PDF 原檔:260822_亞洲硬體_jpm_asian-hardware-technology_original.pdf
圖片清單(已驗證 2026-08-24)
| 檔名 | size | 分類 | 親眼所見內容 |
|---|---|---|---|
260822_亞洲硬體_jpm_asian-hardware-technology_001.png |
88KB | 真資料圖 | 「Top 4 US CSP/ISP cloud capex trend」長條(US$bn)+YoY 折線,2015-2027E:資本支出由 2015 年約 30 升至 2024 年約 175、2025 年約 320、2026E 約 575、2027E 約 865;YoY 標示 2024 +76%、2025 +79%、2026E +80%、2027E +50% |
260822_亞洲硬體_jpm_asian-hardware-technology_008.png |
56KB | 真資料圖 | 「NVL72 ODM rack quarterly shipments (k units)」長條圖:1Q25 1、2Q25 5、3Q25 8、4Q25 13、1Q26 17、2Q26 19、3Q26E 20、4Q26E 21;年度 2025 為 27、2026E 為 77 |
260822_亞洲硬體_jpm_asian-hardware-technology_020.png |
492KB | 真資料圖 | 台達電「Power architecture migration in AI servers」架構圖,四階段並排:①Today—Utility MV Grid(10/13.8/20/34.5kV)→400VAC 配電→AC PSU shelf(72kW/shelf,50VDC 下限 <250kW)→Rack busbar 50VDC→伺服器 50V→12V→0.xV→GPU;②Next Gen 50V Server—HVDC side-rack(800VDC 下 >250kW)→800VDC Crosslink→IT Rack 800V→50V→伺服器 50V→12V→0.xV;③Next gen 800V 原生伺服器—800V→IBV→0.xV;④Next gen 800V 原生伺服器由 SST 供電—SST 3-6MW→配電 800V-0V/800VDC→Rack busbar 800VDC→HVDC 伺服器 |
260822_亞洲硬體_jpm_asian-hardware-technology_050.png |
667KB | 真資料圖 | 「Liquid cooling component overview(以 GB 系列機櫃為例)」實物圖解:左為 in-row liquid-to-liquid CDU、次為 in-row liquid-to-air sidecar(fan door 內含 16-20 顆大風扇做氣冷)、中為整櫃,右上為運算托盤內部標示 cold plate module(含 inner manifold)與 Quick Disconnect(QD,可加浮動安裝),右下為 rack manifold |
260822_亞洲硬體_jpm_asian-hardware-technology_002~052(其餘 48 張) |
— | 未逐張驗證 | 本次僅驗證上列 4 張並用於嵌入;其餘為投影片內的市場規模/ASP/營收預估圖與 iPhone 鏡頭路線圖等,未逐張 Read。若日後要引用,請先依 Step 2.5 逐張 Read 驗證後再嵌入 |
本檔文字層表格已錯位,表格請引用分析頁附錄
本份為投影片型 PDF,pdf_parse 的文字層抽取把所有表格打散、數字與欄位錯位,下方「原始內容」中的表格不可直接引用。
全部關鍵表格已於 2026-08-24 以 PyMuPDF 逐頁渲染成圖、再逐頁目視轉錄補回,成果放在 分析_JPM亞洲硬體_AI與一般伺服器雙軌需求與供給瓶頸_20260822「附錄:關鍵表格」(表 1-16),涵蓋原檔 p2、p3、p5、p10、p11、p12、p15、p16、p22、p28、p33、p48、p51、p52、p53、p54、p55、p56、p57。
需要轉錄未涵蓋的頁面時,重跑:python3 -c "import fitz; d=fitz.open('<original.pdf>'); d[N-1].get_pixmap(matrix=fitz.Matrix(2.6,2.6)).save('/tmp/pN.png')" 後 Read 該 PNG。
原始內容
ora
Asian Hardware Technology
Demand outlook strengthens across AI and general servers; supply constraints the key swing factor
Albert Hung AC +886 2 2725-9875 albert.hung@jpmorgan.com J.P. Morgan Securities (Taiwan) Limited
William Yang AC william.yang@jpmorgan.com J.P. Morgan Securities (Taiwan) Limited
Anthony Leng +886 2 2725-9240 anthony.leng@jpmorgan.com J.P. Morgan Securities (Taiwan) Limited
See the end pages of this presentation for analyst certification and important disclosures, including non-US analyst disclosures. J.P. Morgan does and seeks to do business with companies covered in its research reports. As a result, investors should be aware that the firm may have a conflict of interest that could affect the objectivity of this report. Investors should consider this report as only a single factor in making their
Company
Delta
J.P. Morgan
Lenovo
Quanta
Asus
Analyst
Albert Hung
Albert Hung
Albert Hung
MSI
Asia tech valuations
Compal
Albert Hung
Inventec
ASPEED
Wistron
21Vianet
Accton
Lotes
TSMC
Hon Hai
Mediatek
UMC
ASE Holding
Novatek
Powerchip
Vanguard
GDS
Chipbond
Alchip
GUC
Nanya Tech
Rating
OW
OW
oW
N
N
OW
N
YTD return
%
81%
221%
20%
67%
31%
41%
46%
P/E
FY26E
40.5
12.1
12.4
11.1
15.9
18.4
11.1
P/B
FY26E
13.7
4.2
4.9
2.2
1.1
5.3
2.0
EPS (LCS)
FY26E
43.1
2.4
5.6
343.8
12.7
| Albert Hung | N | 27% 50% 18.9 | 17.3 16.4 | 17.3 16.4 | 18% | 18% | 3.9 | 3.9 | |||
|---|---|---|---|---|---|---|---|---|---|---|---|
| Albert Hung | OW | 139% | 72.6 | 44.4 | 78% | 217.0 | |||||
| Albert Hung | OW | 20% | 11.4 | 2.4 | 23% | 15.8 | |||||
| Albert Hung | OW | -21% | NM | 3.0 | -44% | (1.2) | 0.2 | ||||
| Albert Hung | OW | 78% | 23.2 | 13.5 | 70% | 90.5 | |||||
| Albert Hung | OW | 24% | 19.2 | 13 | 4.0 | 22% | 28% | 83.7 | 5 | ||
| Gokul Hariharan | ow | 53% | 22.0 | 16.8 | 8.0 | 43% | 108.1 | ||||
| Gokul Hariharan | OW | 7% | 13.7 | 11.3 | 1.5 | 13% | 17.9 | ||||
| Gokul Hariharan | OW | 159% | 52.0 | 26.8 | 13.3 | ||||||
| Gokul Hariharan | N | 135% | 15.0 | 17. .8 | 3.2 | ||||||
| Gokul Hariharan | OW | 136% | 28.9 | 18. .5 | 6.4 | 24% | 20 | ||||
| Gokul Hariharan | N | 41% | 15.2 | 26% | 34. | ||||||
| Gokul Hariharan | OW | 70% | 10.2 | 2.0 | 27% | 6. | |||||
| Gokul Hariharan | OW | 67% | 24.2 | 21.6 | 19% | ||||||
| Gokul Hariharan | NR | -5% | NA | NA | NA | N/A | |||||
| Gokul Hariharan | N | 203% | 32.9 | 20.7 | 2 | 5.0 | 7.9 | ||||
| Gokul Hariharan | OW | 7% | 21. | 17.2 | 4.3 | 25% | 171. | ||||
| Gokul Hariharan | ow | 165% | 99.8 | 46 | 42 3 | 49% | 69% | 56.4 | |||
| Jay Kwon | 0 | OW | 168% | 77% | 711 |
Meesnthenu
Pric
FY27E
26.4
10.8
13.4
FY27E
ROE (%)
FY26E
FY27E
37%
28%
45%
38%
15%
2.8
7.6
Company
Unimicron
J.P. Morgan
Yageo
Win Semi
EMC
Analyst
Jerry Tsai
Jerry Tsai
Jerry Tsai
Jerry Tsai
Tripod
Asia tech valuations
Flexium
TSMT
Chicony Power
CHPT
Sunonwealth
E Ink
Auras
AES
Kinik
GPTC
Rating
OW
OW
OW
OW
OW
OW
N
YTD return
%
418%
143%
107%
264%
176%
53%
-34%
P/E
FY26E
58.9
30.8
47.3
53.1
51.1
15.6
NA
FY27E
25.6
17.7
35.0
27.9
30.8
12.1
NA
P/B
FY26E
13.4
6.4
3.6
29.2
22.8
3.8
NA
FY27E
9.6
5.0
3.3
16.9
16.8
3.3
NA
ROE (%)
FY26E
26%
21%
8%
65%
50%
27%
N/A
EPS (LCS)
FY26E
FY27E
19.4
18.2
8.0
112.6
41.9
31.0
N/A
| Jerry Tsai | OW | 8% 89% | NA | 16.2 9.0 | 16.2 9.0 | 2.1 1.8 | 2.1 1.8 | 11.1 | 11.1 | |||
|---|---|---|---|---|---|---|---|---|---|---|---|---|
| Jerry Tsai | 984 OW | -15% | 14.6 11.4 | 2.0 | 1.9 | 13% 14% | 5.4 | |||||
| Jerry Tsai | OW | 21% | 43.0 | 23.8 | 8.4 | 6.3 | 22% | 64.2 | ||||
| Jerry Tsai | OW | -10% | 12.8 | 11.3 | 3.7 | 3.3 | 31% | 11.3 | ||||
| Jerry Tsai | OW | -18% | 13.6 | 11.4 | 2.8 | 2.5 | 20% | 12.0 | ||||
| William Yang | 673 | 405 | N | 134% | 47.0 | 41.5 | 10.5 | 10.0 | 22% | 14.3 | ||
| William Yang | 448 | 700 | OW | 134% | 48.5 | 28.8 | 4.3 | 3.9 | 9% | 9.2 | ||
| William Yang | OW | 121% | 29.0 | 26.8 | 3.8 | 3.4 | 13% | 190.0 | ||||
| mponi | William Yang | OW | 98% | 27.9 | 18.3 | 15.0 | 9.4 | 65% | 106.8 | |||
| William Yang | 993 | N | -2% | 18.3 | 14.8 | 5.5 | 4.4 | 36% | 54.4 | |||
| William Yang | 246 | 460 | 428 | 2% | 27.2 | NA | 2.3 | NA | 9% | 9.0 | ||
| William Yang | 703 | 660 | 44% | 22.2 | 17.5 | 8.2 | 7.1 | 34% | 31.7 | |||
| William Yang | N | -19% | 21.7 | 20.9 | 4.6 | 4.2 | 23% | 49.5 | ||||
| William Yang | OW | 18% | 14.9 | 12.0 | 2.8 | 2.6 | 19% | 95.5 | ||||
| William Yang | 395 | 440 | OW | 10% | 11.8 | 10.8 | 1.5 | 1.4 | 13% | 33.6 | ||
| William Yang | 882 | OW | 97 | 48.7 | 26.2 | 10.0 | 8 .4 | 22% | *%. | 18.1 | ||
| William Yang | 650 | 700 | OW | 45% | 17.0 | 2.5 | 2.3 | 15% | 38.3 | |||
| William Yang | 27 | 78 | OW | -32% | NA | NA | N/A | N/A | ||||
| William Yang | 567 | 570 | 167 N | -3% | 17.2 | NA | 1.9 | 1. 8 | 11% | 33. | ||
| William Yang | 698 | 850 | OW | 76% | 47.0 | 10.8 | 8.9 | 24% | 14.8 | |||
| William Yang | OW | 14% | 12.9 | 8. 3 | 49% | 61 .2 | ||||||
| William Yang | OW | 206% | 30.2 109.2 | 43.3 | 18. | 43% | 15. | |||||
| Jimmy Huang | N | 145% | 51.4 | 5.2 | 48 | 10% | 19.3 | |||||
| Jimmy Huang | OW | 114% | 6.2 | 3.4 | 1.7 | 75% | 28.6 | |||||
| Jimmy Huang | ow | 209% | 6.6 | 2.8 | 1.5 | 55% | 18.6 | |||||
| Jimmy Huang | oW | 49% | 33.1 | .6 | 14.9 | 11.1 | 44% | 70.0 | ||||
| Jimmy Huang | OW | 248% | 42.3 | 6 | 11.8 | 9.7 | 32% | 29.9 | ||||
| Jimmy Huang | OW | 88% | 50.2 | 4 | 15.9 | 11.9 | 35% | 128.5 | ||||
| Jimmy Huang | OW | 113% | 35. 5 | 3 | 6. 6 | 5. | 21% | 20. 1 |
44.5
5
Ticker
Price target
(LC)
Mkt. cap
AI server: Robust demand outlook, Rubin generation ramp on schedule k units
Total datacenter Al chip volumes
YoY growth
High end datacenter GPU volumes
YoY growth
Nvidia
2.1022
800
775
2023
69%
3,632
1,931
1,911
2024
115%
7,815
4,950
4,500
2025
32%
10,320
6,150
5,500
15,895
2026E
54%
8,225
34%
7,425
2027E
25,631
10,781
61%
31%
9,281
Robust AI server demand outlook supported by strong Capex spending
x86-based
AMD
25
- We model 45% AI chip shipment CAGR in 2025-28.
Oberon-like %
1,485
800
23%
80
10%
1,392
1,500
88%
750
50%
31,173
2028E 25-28E CAGR
45%
22%
12,673
10,673
18%
15%
9,606
90%
2,000
1.067
33%
1,400
- GPU server demand remains robust this year on resilient US CSP AI spending and pent-up Neocloud/enterprise demand.
- We see longer demand visibility into next year on strong demand outlook and sustained U.S. CSP capex spending growth.
ASIC chip volume
1,701
- We forecast a 60% CAGR for AI ASIC chip shipments in 2025-28, driven by strong AWS Trainium/Google TPU demand.
Chip per server
Total Al server volumes
YoY growth
| AI server shipment forecast | AI server shipment forecast | AI server shipment forecast | AI server shipment forecast | AI server shipment forecast | AI server shipment forecast | AI server shipment forecast | AI server shipment forecast | AI server shipment forecast |
|---|---|---|---|---|---|---|---|---|
Source: J.P. Morgan estimates for all years, including historical. Note: Total AI server includes AI ASIC + high-end GPU AI servers.
27%
25%
45%
60%
1,911
20
-20%
4,374
2150%
24%
156%
141%
450
650
44%
$1,000
$800
58%
90%
80%
70%
Upbeat 2026 AI capex outlook, extended visibility into 2027
$400
$200
$300
$100
29%
40%
- U.S. hyperscalers raised 2026 capex outlook and provided positive commentary on 2027.
$900
76%
79%
80%
Trillion USD
S0.3
- JPM U.S. hardware team now forecast +80%/+50% YoY growth of datacenter capex in 2026/27, vs. previous estimates of +63%/+40% YoY, which is the third raise this year. We see ~10% upside to the estimates after the recent updated outlook for leading hyperscalers.
- While negative FCF among leading hyperscalers over the next few quarters is inevitable, we see a few positive indicators to support continued AI investments, including robust core businesses, strong AI demand indicators, and decent returns of AI businesses with continued improvement.
- Datacenter capex from Tier 2 providers (e.g. emerging neocloud and other data center-related companies) is now becoming a much more significant cohort.
- We expect the group to grow capex by 65%/39% YoY to US$90bn/US$130bn in 2026/2027.
- We estimate US$5.5tn of AI capex over 2026-30, with US$4.1tn funded through debt. We expect the IG corporate debt market to finance more than US$2.1tn of data center investments over the next five years
Top 4 US CSP/ISP cloud capex trend
Source: 650 Group and J.P. Morgan U.S. team estimates. Units in US$bn.
Anticipated AI Capex Funding Sources (2026-2030 total)
Source: J.P. Morgan U.S. team estimates.
$2.1
S0.4
$1.4
$5.5
700
2,000
J.P. Morgan
600
1,500
500
400
300
40%
450
400
350
35%
30%
27.1%
35.4%
23.7%
300
38.0%
34.5%
42%
35%
28%
AI-led accelerating cloud revenue growth with margin expansion despite capex hikes
500
200
100
0
12%
15%
100
50
Source: Company data, J.P. Morgan estimates.
Source: Company data, J.P. Morgan estimates.
Source: Company data, J.P. Morgan estimates.
Source: Company data, J.P. Morgan estimates.
16%
11%
15%
49%
14%
45%
15%
60%
48%
14%
41%
37.0%
37.4%
33.5%
mi eapenenturemireotmell eot e mene ly tegten
296
Own-firm 3%
396
8%
34%
11%
8%
39%
6%
14%
9%
morrerote lot hi carenenterennieeounent
Coding
31%
Customer Access
Product Development
19%
26%
4.5%
24%
42%
39%
5.8%
22%
26%
9%
5%
5%
7%
4%
90% of APAC respondents on board with AI, with upside in spending in the near future
• Very concerned • Somewhat concerned • Neutral • Somewhat optimistic • Very optimistic
2%
Labor Productivity
14%
392%
40%
40%
Last 12M
Next 12M
- JPM Asia Pacific Artificial Intelligence Implementation Survey 2026 (link) suggests that AI investment is already mainstream, with 88% of APAC respondents reporting AI expenditure over the last 12 months, while only ~3% said they had not invested and ~7% were unsure. Key findings include:
- AI investment is mainstream and growing fast, but leadership is uneven.
- AI stated value case is productivity-led but with a growth mindset; so far cost reduction is secondary.
- Execution capability will increasingly separate AI winners; most respondents were optimistic about profit implications.
- Average AI spend is expected to rise from 4.5% of expenses plus capex over the last 12 months to 5.8% over the next 12 months.
29%
13%
90
80
Arm-based
70
60
50
40
30
20
10
GB300 NVL72
NLI< oom rack quarterly shipments (k units)
2H25
Niula oro servel rodumay
2H26
GPU: HBM3e: 288GB, TDP: up to 1.4kW
1.5x FP4 performance
Nvidia GPU roadmap: Rubin on schedule, Kyber architecture facing challenges
1.5x FP4 performance
17
19
- Vera Rubin system ramps up on schedule in late 3Q to 4Q26
- Our research indicates limited impact on the Vera Rubin ramp schedule from the recent leading PCB maker yield issue.
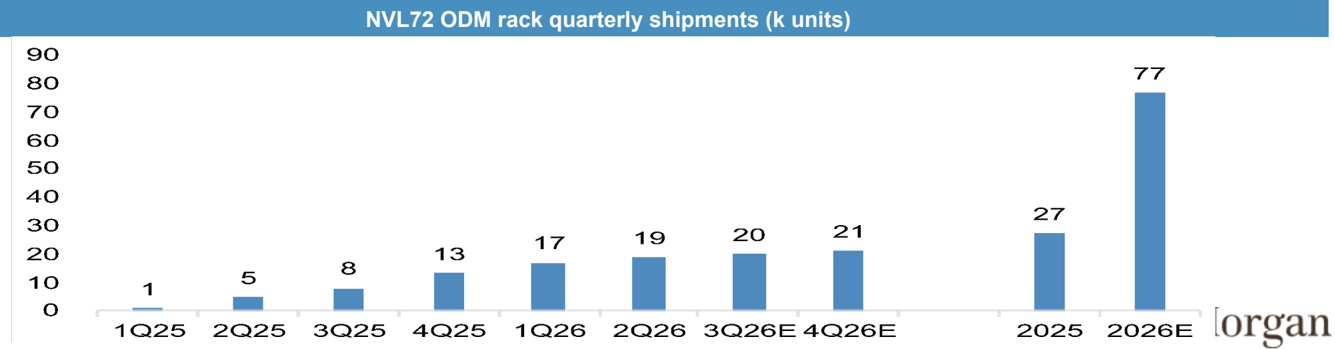
- We estimate 70-80k NVL72 rack shipments this year, comprising 60-65k GB300 rack shipments and ~10k VR rack shipments.
- We continue to forecast ~1.5mn Rubin chip production this year (board level output), but expect only ~10k VR NVL72 rack shipments due to production cycle time and component shortages.
- We expect 85-95k NVL72 rack shipments in 2027, with VR200 rack being the majority.
Nvidia GPU server roadmap
Source: J.P. Morgan, Company data.
21
27
Vera-Rubin NVL72
Dual CX9 1.6T
GPU: HBM4: 288GB, TDP: up to 2. 3kW
CX8 800G
2H24
1425
GB200 NVL72
CX7400G
GPU: HBM3e: 192GB, TDP: 1.2kW
20
2H27
Vera-Rubin Ultra NVL72/576
77
GPU: HBM: TBD., TDP: up to 2.6kW
4*CX9, 3.2T
2H28
Feynman generation
CX10
In USS
NVL72 ODM BoM
J.P. Morgan
MVA fees
NVL72 ODM prices
ODM margin
GB200
3,261,618
144,527
3,406,145
4.29
GB300
3,934,640
148,114
4,082,754
3.69
VR200
6,300,268
174,883
6,475,151
2.7%
Deep dive into NVL72 BOM cost: GPU and Memory to be the key cost driver
Compute tray
Switch tray
5,480,100
485,964
- We estimate the ODM price of the GB300/VR200 rack to be ~US$4.1/6.5mn, ~20%/90% higher than that of the GB200 server, primarily driven by GPU and memory price increases and content upgrades in the networking components and power and thermal systems.
Mix %
2,781,108
3,450,132
- We expect AI server ODM GMs to decline to 3.6%/2.7% of GB300/VR200 vs. 4.2% in GB200.
Power supply system
1%
1%
1%
- However, we see MVA dollars (GP dollars per rack) increasing in VR200, due to a more complex server architecture and longer testing time.
- We estimate ~US$148k/ $175k for the MVA of GB300/VR200 vs. ~US$145k for GB200.
Total memory
HBM
NAND
DRAM (LPDDR)
Power supply system (power shelf/power whip/busbar)
Thermal (coldplate/manifold/QD)
Mechanical (chassis/ slide rail)
MVA
Others (compute tray contents excl. superchip, switch tray, etc.)
Source' .l P Moraan estimates
NVL72 BoM - Summary table
1.4%
2.5%
2.7%
| 2.5% 1.2% 1.4% 0.6% 4.2% 19.3% 8.5% 1.1% 1.2% 0.5% 3.6% 16.1% 8.5% 1.3% 1.1% 0.3% 2.7% 22.3% |
|---|
Source: J.P. Morgan estimates.
J.P. Morgan
TPU - inference
Total
Amazon
Inferentia
Total
2023
1,020
300
2024
900
420
Chip forecast (k)
2025
2026
1,500
2,600
100
Chip units per server
1/4/8
8
1/6/12
2023
255
36
291
38
2024
Implied server units (k)
225
338
2025
2026
375
650
113
53
88
463
13
- We forecast AI ASIC chips to grow 77%/88% YoY in 2026/2027, mainly driven by strong AWS Trainium and Google TPU demand.
Meta
2028
1300
1900
600
199
199
- As AI inference activities scale, we expect more end customers to develop its own AI inference ASIC solutions, which could further expand the AI ASIC server TAM.
MTIA
OpenAl
AI ASIC chip
Apple
AI ASIC chip
Grand total
Yoy
500
300
1,000
24
500
8
JPM ASIC chip/server estimates
300
50
500
13
6
63
| 2,865 7,370 13,850 17,200 24% | 2,865 7,370 13,850 17,200 24% | 2,865 7,370 13,850 17,200 24% | 2,865 7,370 13,850 17,200 24% | 336 | 432 605 1,101 2,167 97% 2,628 | 432 605 1,101 2,167 97% 2,628 | 432 605 1,101 2,167 97% 2,628 | 432 605 1,101 2,167 97% 2,628 | 432 605 1,101 2,167 97% 2,628 | 432 605 1,101 2,167 97% 2,628 |
|---|---|---|---|---|---|---|---|---|---|---|
| 68% | 46% | 77% | 88% | 28% | 40% | 82% | 21% |
Source: J.P. Morgan estimates.
150
200
4,170
6
8
21
38
42
63
125
175
825
2027
4,600
8,500
3,900
2028
5,200
10,000
4,800
2027
1150
488
1638
Microsoft
Microsoft
Meta
Major
Hon Hai
Quanta
Secondary
Quanta
Hon Hai
Quanta
Ai server vom maula " Niula s oro systell
ASIC servers
Nvidia NVL72
GB300
Secondary
Quanta
Hon Hai
Meta
Al
Quanta
Quanta
Consolidated market landscape in AI server ODM space
Dell
Hon Hai
Quanta, Wiwynn, SMCI, Dell
Hon Hai
Quanta, SMCI
Major
Hon Hai
Quanta
Quanta
Secondary
Quanta
Hon Hai, (Wiwynn)
Hon Hai, Jabil
Hon Hai, Jabil, Inventec (board)
Hon Hai
Quanta
Quanta
Hon Hai, Wiwynn, (SMCI), (Dell), (Inventec)
Celestica (L6-L11), Flex (L6-L11), Hon Hai (L10.5), Inventec (L6)
Hon Hai (L10), Inventec (CPU board)
- Hon Hai and Quanta stand out as preferred picks in the NVL72 supply chain, while Celestica and Wiwynn lead among ASIC plays.
Source: J.P. Morgan estimates. Note: Flex/ Inventec also supplies CPU boards for the MI300/400 system.
- While we see tier-2 ODMs (e.g. Pegatron, Compal) managing to break into the space, complex design capabilities, frequent product upgrades, and high working capital requirements should keep the competitive landscape concentrated among a few major players.
Major
Secondary
| AI server ODM matrix - Nvidia's GPU system | AI server ODM matrix - Nvidia's GPU system | AI server ODM matrix - Nvidia's GPU system | AI server ODM matrix - Nvidia's GPU system | AI server ODM matrix - Nvidia's GPU system | AI server ODM matrix - Nvidia's GPU system | AI server ODM matrix - Nvidia's GPU system |
|---|---|---|---|---|---|---|
AI server ODM matrix - AMD's GPU system
AI server ODM matrix - AMD's GPU system
Source: J.P. Morgan estimates. Note: Flex/ Inventec also supplies CPU boards for the MI300/400 system.
Microsoft
Meta
Oracle
GB200
Hon Hai
CPU
Hon Hai
VR200
General Servers: Multi-year strong demand driven by AI, key swing factor on supply constraints
Source: Nvidia.
• OBSERVE
CUM
-
As we migrate towards the era of agentic AI, focusing on test-time scaling (i.e. long thinking), CPUs are playing an increasingly important role in orchestration, running tools and skills, storage, and security. SECURITY & GOVERNANCE
-
ACT
CLIM
- For example, the Vera CPU not only sits in the NVL72 rack systems, but also serves as a standalone CPU across the entire Vera Rubin platform, including storage servers and CPU servers.
MEMORY
- We attribute the strong general server demand this year (30-40% YoY growth on our estimates) primarily to the emerging demand for agentic AI.
NICIA AL Platform
TAT-LEN
Agent = LLM + Harness; CPU plays a critical role in the agentic AI ecosystem
Source: Nvidia.
NEMOTRON
OPEN MODELS
NEMOCLAW
Agentic AI CPUs becoming a new driver for server CPU demand
PROMPT
TOOLS & SKILLS
CUDA-X
LIBRARIES
Unit in millions
- AI SERVER HEADNODE
Global Al accelerator Shipments (mn)
YoY
Avg accelerators per CPU in headnodes
Headnode Server CPUs Needed (mn)
2024
7.6
4.1
1.8
2025
9.6
27%
3.0
3.2
2026E
16.1
67%
2.3
7.1
Accelerating server CPU growth cycle on AI inference cycle
Traditional server unit for non Al workload (mn)
YoY
2%
3%
5%
2027E
25.2
2.2
56%
11.3
59%
13.1
5%
2028E 2025-28 CAGR
32.5
50%
1.9
29%
16.8
48%
13.8
5%
- We segment CPU demand into three buckets-(1) AI server headnode CPUs, (2) regular server CPUs, and (3) agentic-AI CPUs.
Yoy
Yoy
YoY
3%
5%
5%
5%
- As AI applications transition from training toward inference, we expect agentic-AI and AI headnode CPU demand to drive a 'super' general server CPU cycle. 0.0 0.0 0.17 1.6 0.45 7.3 0.68 17.1 0.83 27.0 155%
- We forecast total server CPU shipments to grow from 26mn units in 2025 to 68mn by 2028 (38% CAGR) based on a top-down methodology, triangulated with bottom-up estimates. 16% 42% 42% 32%
Total server CPU shipment excl. Al server headnodes sen
YoY
20.3
22.5
29.2
40.1
51.1
31%
- We forecast a 74%/5%/155% CAGR of AI server headnode CPU/ regular server CPU/ agentic AI server CPU demand in 2025-28.
- We forecast a 53% CAGR of server CPU revenue TAM in 2025-2028, driven by the fast-growing server CPU demand and a ~10% CAGR of server CPU ASP expansion.
| JPM server CPU forecast - top-down methodology | JPM server CPU forecast - top-down methodology | JPM server CPU forecast - top-down methodology | JPM server CPU forecast - top-down methodology | JPM server CPU forecast - top-down methodology | JPM server CPU forecast - top-down methodology | JPM server CPU forecast - top-down methodology |
|---|---|---|---|---|---|---|
Source: J.P. Morgan estimates. Gartner® data for 2024 total server CPU shipments. Global AI accelerator shipments are based on our CoWoS estimates by the semi team.
74%
5%
12.5
Al accelerator unit (mn)
NVDA
HGX (x96 base)
AMD
NVL72 (ARM base)
TPU
v4/5/6/7
v8
vg
AWS
Tm 2
2025
6.2
2.
.8
3
.8
0.7
.8
7
2026E
8.9
3.0
5.9
0.7
27
cautious
2027E
10.0
2.1
.9
1.5
8.9
.7
Fast-growing AI accelerator shipments fueling the AI headnode CPU demand
Inferentia 2
Tm 3
Tm 4
Meta
Others
Total Al accelerator units (mn)
Avg number of accelerators per CPU
HGX (x86 base)
NVDA
NVL72 (ARM/ base)
AMD
TPU
v4/5/6/7
v8
v9
AWS
Tm 2
Inferentia 2
Tim 3
Tm 4
Meta
Microsoft
Others
Blended ratio
Al headnode CPU units (mn)
NVDA
AMD
TPU
AWS
Meta
Microsoft
Others
Total
0.6
1.3
3.5
- Strong accelerator demand + Rising CPU attach rate = Exponential AI server headnode CPU growth.
0.2
0.4
0.8
| AI server headnode CPU forecast 2024 3.9 4.0 2.0 4.0 4.0 4.0 1.5 1.0 5.3 4.0 16.0 13.6 2.0 4.0 4.0 4.0 4.0 2024 1.1 0.1 04 0.1 18 10.1 2025 2.5 4.0 2.0 4.0 3.8 4.0 1.5 1.0 14.5 4.0 16.0 13.6 2.0 4.0 4.0 4.0 3.2 2025 2.4 0.2 0.5 0.1 372 24 4.0 20 4.0 1.5 1.5 1.5 1.0 14.3 4.0 16.0 13.6 2.0 4.0 4.0 4.0 2.3 2026E 3.7 0.2 29 0.1 0.1 0.1 0.1 7.1 2.4 8.0 2.0 4.0 1.5 1.5 1.5 1.0 10.0 4.0 16.0 10.0 2.0 4.0 40 4.0 2.3 2U27E 4.2 0.4 5.9 0.4 0.1 0,2 0.1 2.3 8.O 20 4.0 1.3 1.5 2.0 4.0 16.0 6.4 20 4.0 4.0 4.0 1.9 2028E 5.1 0.8 8.7 1.7 03 02 0.2 Source: J.P. Morgan estimates for all years, including historical. Al accelerator unit estimates are based on our CoWos estimates by the semi team. 8 GPU to 2 CPU 2 GPU to 1 CPU; R200 changed to 8: 1 GPL/CPU ratio Assume w4/v5 4:1 & w8/7 2:1 v3 has two versions, 1:1 or 2:1 Assume average 8 Inferentia to 2 CPUs 80% air cooling (16:1) and 20% liquid cooling (4:1), 50%/50% and 20%/80% AC/LC ratio in 2027/28 JPMe J.P.Morgan |
|---|
Source: J.P. Morgan estimates for all years, including historical. AI accelerator unit estimates are based on our CoWoS estimates by the semi team.
0.5
3
0.1
5
2024
4.5
4.3
587
74
2028E
11.6
.0
2
.8
2.3
.6
Note
14
12
0
J.P. Morgan
64%
68%
66%
80%
70%
60%
50%
Super server cycle underpinned by the recent uptick in x86 CPU vendor revenue growth
20%
60
47
- We have seen accelerating growth in Intel/AMD server datacenter CPU revenue growth in the past three quarters, driven by strong server demand.
- AMD also cast an upbeat long-term outlook for server CPU TAM (US$220bn by 2030 or ~50%+ CAGR in 2025-2030), which underpins our research of the multi-year super server cycle across hyperscalers and the positive demand signals across the supply chain.
2024
2025
2026E
2027E
2028E
Source: Gartner®, J.P. Morgan estimates.
120
100
Source: J.P. Morgan U.S. semi team estimates, Company data. Note: AMD's datacenter revenue excludes GPU revenue.
100
5.0
4.0
3.0
2.0
1.0
-
volvel yuartery orptenlo, Xod allu tot dellu
18% 2121%
8%
29%9%
17%8%
15%
4°8% 1%
6%0%
40%
30%
20%
10%
30
25
20 - 3%
An AI-led multi-year general server upcycle
-5%.
-9%
-13%
-20%
10 -
5
30%
25%
20%
10%
15%
5%
-5%
0%
-10%
-15%
- 1Q26 U.S. CSP server shipments were better-than-seasonal at up QoQ and the overall server shipments appear to have grown double-digit QoQ in 2Q26. 2216
- Initial outlook indicates server shipments should continue to grow into 2H26, led by U.S. CSP server demand.
• YY
-Y/Y
- We have picked up incremental positive signs in server demand over the past 3-6 months with order visibility extended into next year.
- Lotes and ASPEED's order visibility has already extended into 2027. Memory vendors also collected 50-80% demand growth feedback from the U.S. CSPs for next year. The key swing factor is supply chain constraints.
- We anticipate an accelerating shipment growth of 25% YoY next year, driven by accumulated backlog from this year and strong server demand.
- By customer type, we forecast 40-50% growth/ single digit decline to flattish for CSPs/enterprise server shipments in 2026/27, respectively.
- In the longer run, we expect server shipments to sustain at double digit growth in 2028-29, driven by the multi-year AI-led server demand.
Source: Gartner®, J.P. Morgan estimates.
Source: Gartner®, J.P. Morgan estimates.
-4%
13%
vorvol emtteer ortpttollle anle tet urolte
22% 25%
19%
-3%
1%
2%
7%
-18%
6%
4%
9%
Datacenter Power: Secular TAM expansion in AI datacenters
350
60
300
250
40
200
150
30
100
20
0
0
Datacenter new power installed and YoY growth (GW)
Server power supply market landscape
Delta's server power supply TAM (US$bn)
42%
Others, 22%
50
36%
45%
40%
Datacenter Power TAM reaches US$50bn by 2028E, growing at 80% CAGR
Chicony Power,
19%
25%
- We forecast Delta's AC/DC server power revenue to grow at 75-80% CAGR in 2025-28, largely in line with our server power supply TAM CAGR at 80%. 9 5%
5
5
6
0%
- Our datacenter power TAM is driven by three compounders:
2022
2023
2024
2025
2026E
2027E
2028E
—YoY
- Accelerator shipment growth: 40-50% CAGR in 2025-28E based on our latest CoWoS updates
- TDP growth: 30-50% CAGR on continued spec upgrades
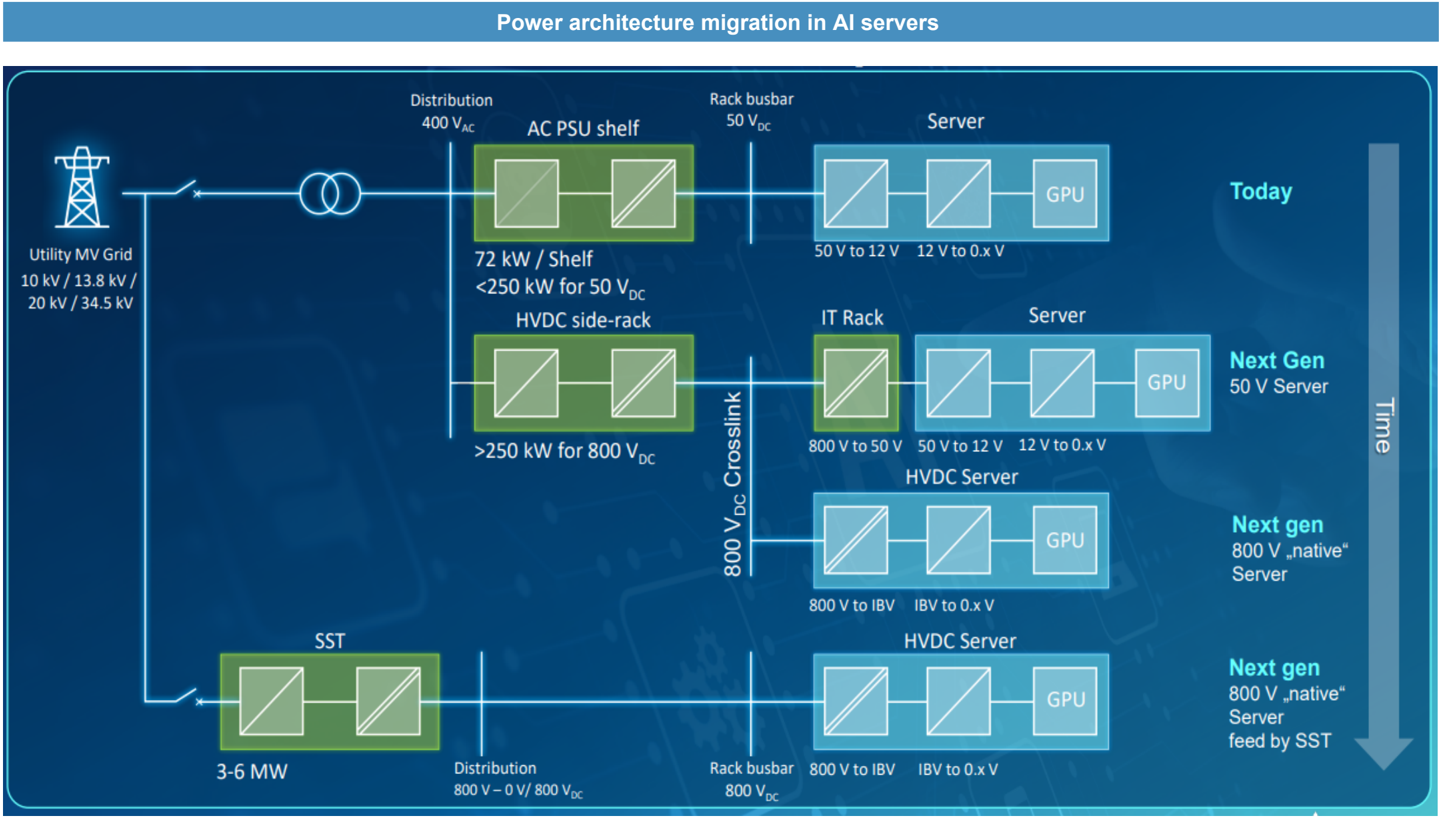
- Power architectural change: Rising power rack adoption (JPMe 20% in Vera Rubin and 50%+ in VR Ultra cycle)
Datacenter new power installed and YoY growth (GW)
Source: IEA, J.P. Morgan estimates.
Server power supply market landscape
Source: Company data, J.P. Morgan estimates. Note: Lite on's server PSU revenue is based on company guidance. Chicony's implied market share based on J.P. Morgan coverage analyst Jerry Tsai's revenue estimates for the company (3412 TT, OW).
Delta's server power supply TAM (US$bn)
Source: J.P. Morgan estimates for all years, including historical.
AI ASIC blended TDP trend (Watt)
Datacenter Al chip shipment growth (mn units for volume)
Nvidia's high-end GPU TDP
J.P. Morgan
35
3000
1,800
30
2500
1,600
25
20
2000
1500
15
1000
10
1,000
800
5
500
600
-
0
400
200
0
115%
140%
2600
120%
25-27 = ~35-40%
2025-28 CAGR = 45-50%
20-25 CAGR = 25-30%
2300
1,600
Datacenter Power growth driver 1 and 2: Accelerator shipment growth + TDP expansion
16-20 CAGR = 15%
54%
1400
- We forecast ~45% CAGR for AI accelerator shipments based on the latest CoWoS update (link) (up from our prior estimate of ~30% CAGR). 500
0%
- We expect a ~30% CAGR for AI accelerators' TDP expansion, driven by continued spec upgrades to address training and inference workloads.
2025
2026E
2027E
2028E
- We see a faster TDP expansion for AI ASIC chips as hyperscalers start to leverage their ASIC solutions for AI training/inference tasks.
Source: Company data, J.P. Morgan estimates.
Datacenter AI chip shipment growth (mn units for volume)
Source: J.P. Morgan estimates for all years, including historical.
Source: J.P. Morgan estimates for all years, including historical.
J.P. Morgan
Real server Power consumption excl. redundancy (kw
Design power capacity per rack
Nvidia's Al server rack power roadmap and estimated power content changes
DGX A100
71
13
DGX B200/B300
14
20
GB200 NVL72
120
198
GB300 NVL72
140
288
Datacenter Power growth driver 3: Power supply configuration change
Redundancy spec
PSU specification (kw)
PSU ASP (USS)
Components
SOKW BBU (20kW*4)
Rack chassis
Liquid cooling busbar
Power whip
N +1 (3+1)
3.3
Nvidia's AI server rack power roadmap and estimated power content changes
VR200 Power shelf
210
444
Power shelf
4*111kw
N+2 (4+2)
18.5
2,600
VR Ultra
900
1500
800VHVDC power rack
10*150kw
N+2 (4+2)
25
3,750
| Number of PSUs per rack | 4 NA | NA | NA | NA | 36 | 24 4 | 24 4 | 60 |
|---|---|---|---|---|---|---|---|---|
| Number of power shelves | ||||||||
| Number of PSUs per power shelf | NA | NA NA NA | ||||||
| Total power content (US$k) | 6 | 4 | 37 25 | 53 36 | 92 | 673 | ||
| PSU content per rack | 8 | 4 | 8 | 62 | 225 | |||
| Number of server per racks | 4 NA | 4 NA | 4 NA | 4 NA | 18 12 | 18 17 | 18 29 | 448 |
| Other components within power shelf | ||||||||
| Dollar content per watt (US$) | 0.11 | 0.11 | 0.10 | 0.11 | 0.13 | 0.13 | 0.14 | 0.15 |
| Dollar/watt - PSU | 0.19 | 0.21 | 0.45 | |||||
| Dollar/watt - Power shlef/rack | 0.11 | 0.11 | 0.10 | 0.11 | 0.18 | |||
| Power rack BoM cost breakdown (800V 660kw) | ||||||||
| Unit price (5) Volume | Content (S) % of total cost Note | |||||||
| 110KW power shelf (18.3kW PSU*6) | 19,200 6 | 115,200 | 45% JPMe PSU ASP at $2600 ($0.14/W), PMCA5P at $300, and power shelf ASP at $3000 | |||||
| 15,000 10,000 1 | 90,000 | 496 | 35% Assume $0.15/Wratio for BBU, shelf cost at $3000 | |||||
| 1 | 10,000 3,000 | |||||||
| 3,000 | 7,200 | 1% JPMe Busbar ASP at $3000, liquid cooling component ASP at $500 |
DC/DC cross link cable
Others
Power vendor assembly and testing
3,600
3% 1004
1% 125A
Power rack BoM cost breakdown (800V 660kw)
| Total cost for end customers | 257.758 100% |
|---|---|
Source: Nvidia, J.P. Morgan estimates. Note: 1 660kW power rack can support 2 Vera Rubin NVL72 racks.
600
600
12
6
N+2 (4+2)
N+2 (4+2)
N+1 (5+1)
N+2 (4+2)
N+2 (4+2)
DGX H100/H200
10
H20
5
J.P. Morgan
10 kV / 13.8 kV /
20 kV / 34.5 kV
GPU
Today
Source: Delta Electronics.
Power architecture migration in Al servers
Distribution
Rack busbar
Server
Datacenter Networking: Whitebox Switching Enters a New Growth Cycle
J.P. Morgan
35
AI-driven Networking upgrades expand whitebox switching market opportunity
- We estimate ~US$6bn datacenter networking serviceable addressable market (SAM including generic ethernet switch, AI back-end and front-end networking) for the top 4 CSPs for Accton in 2025 and expect the market to grow at a ~75% CAGR to reach ~ $33bn by 2028, driven by
- Strong AI-driven general purpose server demand
- AI front-end and back-end networking upgrades
- AI-led accelerating network upgrade cycles
2022
2023
2024
2025
2026E
2027E
2028E
Source: J.P. Morgan estimates, Gartner®. Note: Calculation of Accton' s datacenter switch SAM only includes whitebox ToR switches for scale-out fabrics. AI ASIC scale-out networking switch SAM only includes AWS ASIC back-end ToR switch TAM, while we include AI front-end scale-out SAM into generic whitebox Ethernet switch categories..
Accton's datacenter switch revenue SAM and YoY growth
CSP General server shipment trend and CAGR
238%
Switch ODM-direct vs. server ODM-direct spending growth
J.P. Morgan
K units
21,000
40%
45%
AI-driven general purpose server demand sets the stage for switching growth
127%
30%
- We expect general server shipments to accelerate over the next few years on AI-driven inference demand.
9,000
- We estimate CSP's general server shipment growth of 40%/25%/20% in 2026/27/28.
50%
6,000
0%
3,000
- There could be upside risks to our general server shipment assumptions driven by fast-growing agentic AI demand.
-11%
5%
- Over the past 2-3 years, CSPs have prioritized AI server investment and data center build-outs, while networking has lagged.
2025
2026E
2027E
2028E
- Gartner ® data shows ODM-direct server spending increased 207% / 127% in 2024/25 versus ODM direct switch spending growth of 18%/103% over the same period.
- We expect CSPs to step up networking spending to reduce latency and improve data transmission rates, presenting huge growth opportunities for whitebox Ethernet switches.
CSP General server shipment trend and CAGR
Source: Gartner®, J.P. Morgan estimates.
Switch ODM-direct vs. server ODM-direct spending growth
Source: Gartner®.
-50%
300%
43%
Gb
Tb
500
3500
3000
400
2500
2000
300
1500
200
1000
100
500
0
0
Front-end network and back-end network
Nvidia's GPU scale out bandwidth - NVL72/144 rack
Nvidia GPU scale out bandwidth - per chip
Cloud
Backbone
Frontend
Super Spine
461
3200
AI/ML drives both front-end and back-end networking upgrades
Spine
- Higher bandwidth requirements and data volumes in AI datacenters will drive continued upgrades in the traditional frontend networks and create an incremental back-end GPU fabric.
- Exponential growth of Nvidia's GPU scale-out bandwidth.
- We forecast a ~164% CAGR for the GPU back-end Ethernet ToR switch TAM over 2025-28.
Spine
- Examples of front-end network upgrades:
- -BlueField 3 400G in GB200/300 moving to BlueField 4 800G in VR200
- -CSP's in-house NICs moving from 200G to 400G
Nvidia's GPU scale out bandwidth - NVL72/144 rack
Source: J.P. Morgan estimates, Company data
Front-end network and back-end network
Source: Cisco
Nvidia GPU scale out bandwidth - per chip
Source: J.P. Morgan estimates, Company data
Blended ASP of Accton's datacenter switch port
Switch port ASP growth by customer type
Datacenter switch technology roadmap
J.P. Morgan
30%
Speed
US$,%
250
100G
20%
10%
150
0%
100
-10%
800G
-20%
50
-30%
1.6T
2015 2016 2017 2018 2019 2020 2021 2022 2023 2024 2025E 2026E 2027E
35%
20%
18%
40%
Port ASP expansion driven by AI-led accelerating network upgrade cycles
9%
14%
20%
- A shortening network bandwidth upgrade cadence is supportive of data center switch ASP expansion. -5% -9% -5% -9% 0%
- 7 years for 100G/200G transition versus <2 years for 800G to 1.6T
-24%
-
Rising mix of higher-speed ports supports ASP expansion
-
YoY
•2015 2016 2017 2018 2019 2020 2021 2022 2023 2024 • 2025
- We see Accton as a key beneficiary, given its strong positioning in whitebox data center switches. (JPMe ~40% of total revenue in 3Q26).
- We forecast a ~20% CAGR in Accton's switch port ASP over 202528, primarily driven by the 800G/1.6T upgrade cycle.
Datacenter switch technology roadmap
Source: 650 Group, J.P. Morgan estimates
24%
Switch port ASP growth by customer type
Source: J.P. Morgan estimates.
Source: Gartner®.
Blended ASP of Accton's datacenter switch port
Source: J.P. Morgan estimates, Company data
PCs: Unit downside in sight, but margin/value better than feared
100
J.P. Morgan
80
60
40
20
49%
8%2%
70%
50%
11% 11%
9%
Better-than-feared PC demand in 1H26 likely driven by pull-in orders, cautious on 2H26 PC demand 10% 150 5% 8% 0%
-9971%1%1%
-1%
2%1%1%
0%
-8%
-3%
50
-14%
-15%
-10%
- 1H26 PC shipments appear better-than-expected, likely due to continued Win10 replacement demand and the pull-in of orders ahead of the memory price hikes. -50 -15% 2017 2018 2019 2020 2021 2022 2023 2024 2025 2026Е2027E2028E2029E -20%
- We are cautious on PC end demand in 2H26 due to pull-forward demand in 1H26, the negative price elasticity from key component cost hikes, and late cycle of Win10 PC replacement. ·Q/Q - Y/Y -YN YN
- We anticipate a sub-seasonal shipment trend in 2H26 and forecast a 3% HoH decline for PC shipments.
- We forecast an 8% PC shipment decline this year, comprising 14%/4% consumer/commercial PC shipment decline.
PC + Chromebook quarterly shipments and QoQ/YoY trend
Source: Gartner®, J.P. Morgan estimates.
PC incl./excl. Chromebook annual shipments and YoY trend
Source: Gartner®, J.P. Morgan estimates.
-1%
-10%
350
1%
12%
/2%
2%
2%
20%
200
350%
300%
150
100
12%
6%
15%
10%
10%
20%
15%
10%
Positive ASP y-y trend from 1Q24
400%
350%
3Q16-4Q17
Darents Mile
3Q23-3Q24
Commercial PC demand more resilient driven by Windows 10 expiry and lower price sensitivity from memory-led product price hikes 0%
50%
0%
-50%
50
-100%
-
50%
0%
40
-50%
-100%
Source: WSTS, J.P. Morgan estimates.
-5%
Source: Gartner®, J.P. Morgan estimates.
NAND ASP Y/Y% change vs previous assumptions
Source: WSTS, J.P. Morgan estimates.
Source: Gartner®, J.P. Morgan estimates.
DRAM ASP Y/Y% change vs previous assumptions
Source: WSTS, J.P. Morgan estimates.
-10%
140
14%
25%
J.P. Morgan
20%
15%
10%
5%-
0%
-5%
-10%
11%
Unit downside in sight, but PC brands' margin/value better than feared
2%
1%
0%%
- Asian PC brands delivered better-than-expected PC margins in 1H26, driven by better-than-feared PC demand, continued product price hikes, and product mix adjustments. -3%% 1%
-6%
-6%
- Our research indicates 20-30% YoY growth of PC ASP in 1H26. This, along with the lower-cost PC inventory at hand, drove meaningful margin expansion for brands.
• Notebook ASP Y/Y
- In contrast, we saw PC ODM margin dilution in 1H26 due to the ASP hikes, while profit dollars remain intact.
Courco: Cartnor@) | D Mornan estimatocl
•Acer —
Microstar
Caurco: Camnany data l D Maraan ectimatae Aeer'e 20.1026 data is hacad en Rlnnmhora
- Looking ahead, while we have seen weakening PC demand in 2H26, we expect PC brands margin trend likely to be better than feared due to continued product mix adjustments with pricing actions.
- We expect tier one PC brands' margins to be more resilient in 2H26 due to better supply chain capability.
Blended PC ASP and YoY trend
Source: Gartner®, J.P. Morgan estimates.
Source: Company data. J.P. Morgan estimates. Acer's 2Q-4Q26 data is based on Bloomberg consensus estimates.
23%
17%
11%
9%
CPU
Memory total
SSD
DRAM
2025
250
75
35
40
% of BoM
26%
8%
4%
4%
Note
Raptor Lake
512G
LPDDR5 16G
2026
300
310
125
185
% of BoM
24%
25%
10%
15%
Note
Arrow Lake
512G
LPDDR5 16G, JPMe $11.6/GB
NB BoM analysis supports a 20-30% PC product price hikes by brands in 1H26
Panel
45
5%
13.4"
43
3%
13.4", assume 5% decline
- We estimate that the BoM cost of high-end NBs has increased by ~30% over the past year, mainly driven by the price hikes in memory, non-key semis (analog ICs), software license fees, and other components (e.g. passive components, PCBs).
Dongle
Software
Others
Warranty
- We estimate memory cost to increase by US$200-250 after 3-5x DRAM/NAND price hikes over the past year, driving the memory as % of total NB BoM to rise to 20-30% vs. HSD % a year ago. 237 92 19% 7% MSFT lincense fee cost hike by 5-10%
- We also assume a 5% price hike for other components & non-key semis.
45
100
1254
- The BoM cost increases have also driven PC brands to implement 20-30% price hikes in 1H26 to protect margins
- We believe mid to low range PCs could have a higher sensitivity to the memory BoM % increase given the lower PC price band.
- PC brands have mitigated the impact through spec downgrades and product mix adjustments.
| NB BoM analysis | NB BoM analysis | NB BoM analysis | NB BoM analysis | NB BoM analysis | NB BoM analysis | NB BoM analysis |
|---|---|---|---|---|---|---|
Source: Gartner®, J.P. Morgan estimates.
4%
8%
MVA, logistics etc.
25,000
J.P. Morgan
20,000
27%
25%
10%
40%
28%
16%
60,000
50,000
40,000
Graphics/Motherboards - Soft end demand in the absence of new product ramps
10,000
5,000
-
-12%
-8%
20,000
-14%
40%
28%
16%
4%
8%
- We have seen weakening end demand for PC motherboard and VGA in 1H26 due to memory supply shortage and negative price elasticity from product price hikes.
-
-32%
-32%
- Looking ahead, we expect a sub-seasonal shipment growth (~5% QoQ growth) for the top 3 MB/VGA vendor shipments in 3Q26 and continue to forecast a double-digit shipment decline for the full year MB/VGA shipments. · Aggregated Top 3 motherboard vendor shipment (K unit)
- We see limited catalysts for the market given the lack of new product launches in the next six months.
- This, coupled with the memory-led end demand weakness, implies potential margin pressure for PC component brands.
Source: J.P. Morgan estimates, Company data.
Source: J.P. Morgan estimates, Company data.
18%
29%
Individual stock one-pager - Albert Hung
250
200
150
100
50
0
- Rising power consumption of AI servers
86%
71%
53%
40%
53%
2%
Delta: Key beneficiary of secular AI datacenter power and thermal trend
2% 5%
10%
59%
2%
8%
6%
22%
58%
3%
7%
7%
24%
- We believe Delta will be a major beneficiary of the fast-growing datacenter power supply TAM (JPMe +80% CAGR in 2025-28), driven by
3%
3%
2024
2023
- Non-PSU content increase from power rack adoption and HVDC material upgrades
• Server Al power - DC/DC
2026E
2027E
• Liquid cooling i Server Al power - AC/DC
- Delta possesses the leading position (40%+) in datacenter power (esp. in high-end market) and liquid cooling space.
- We model above-seasonal revenue growth in 3Q/4Q at +16%/+14% QoQ respectively, driven by order push-out from 2Q26, new AI ASIC project ramp in 2H, 110kW power shelf / HVDC product ramp in 4Q, and product price hikes in late 3Q26.
- We anticipate a gradual margin recovery helped by product price hikes and favorable pricing terms for new products.
- We expect the stock to regain momentum over the next three months as datacenter related revenues re-accelerate. Stay OW.
Source: Company data, J.P. Morgan estimates.
Source: Company data, J.P. Morgan estimates.
100%
40%
35%
2025
2028E
65%
55%
15%
5%
-5%
J.P. Morgan
20,000
155%
109%
180%
- 130%
50
40
ASPEED: Supply unlock in 2H26 drives revenue upsides
30%
- We have seen potential revenue upside near term, driven by robust general server demand, new AI server product cycles, and better supply in 2H26.
25
- We forecast 19%/33% QoQ revenue growth in 3Q26/4Q26, and early feedback suggests momentum could extend into 1H27.
- We estimate ~38% shipment CAGR for ASPEED's regular BMC over 2025-28, broadly in line with our server CPU shipment growth forecast.
- ASPEED's BMC shipments should outgrow CPU volumes due to higher exposure to U.S. CSPs, market share gains, and expanding applications.
- We expect AST2700 penetration to accelerate in 2027 (JPMe ~25%/50% in 27/28). From the meaningful ASP premium for AST2700, the ramp should be a clear tailwind for ASPEED's top-line growth.
- ASPEED remains a key beneficiary of the secular server CPU upcycle in our coverage. Stay OW.
Source: Company data, J.P. Morgan estimates.
Source: Company data, J.P. Morgan estimates.
AST2500
AST2600
>4x content growth
24
AST2700
43
10
8
90
80
6,000
5,000
J.P. Morgan
70
60
4,000
50
40
30
20
-
10
-
(1,000)
37%
37%
120%
12%
8%
9.3% 7. 1%6.5%
110%
-0.5%0.4%
- 90%
50%
30%
4%
60%
-21% -1% 1.0%
63%
-2.8%
- 0%.
Lenovo: ISG margin inflection confirmed; AI pipeline doubles
-
0%
-
Lenovo's AI server pipeline more than doubled to US$54bn exiting Jun-Q (vs. US$21bn last Q). Management expects meaningful revenue conversion in 2HFY27.
- We estimate110%/50% YoY ISG revenue growth in FY27/28.
- We expect a significant OPM improvement for ISG business to 9.3% in FY27 from 0.4% in FY26, driven by favorable pricing and OP leverage.
- Beyond FY27, we anticipate a sustained ISG growth momentum on the multi-year server cycle with continued margin improvement on better scale.
- IDG profitability also appears better than feared, as Lenovo has been able to outgrow its peers through better supply chain management and scale.
- Looking ahead, we expect continued growth in 2QFY27 as strong ISG/SSG momentum more than offsets seasonal IDG softness.
- We expect ISG to become a key earnings driver over the medium term. IDG profitability also appears better than feared. Stay OW
Lenovo's ISG revenue and YoY Trend
Source: Company data, J.P. Morgan estimates.
Lenovo's ISG operating income & OPM trend
Source: Company data, J.P. Morgan estimates.
100
80
60
40
20
62%
68%
74%
140%
120%
100%
80%
450
400
350
300
80%
160%
140%
120%
100%
Accton: Riding AI-driven networking upgrade and unlocking new TAM in server racks
2% 70%
20%
20%
-6%
- We forecast Accton to outgrow the whitebox switch market, with a 2025-28 datacenter switch revenue CAGR of ~92% versus an industry TAM CAGR of ~75%, supported by -40%
2027
2019 2020 2021 2022 2023 2024 2025 2026
• Accton's datacener switch revenue (NT$bn)
- Better-positioned in high-end datacenter switch market (400G+)
- Consolidated switch ODM market & Accton's market share rebound in Meta 800G projects
Source: Company data, J.P. Morgan estimates.
Source: Company data, J.P. Morgan estimates.
- Amazon and Meta raised capex guidance for this year and the implied 2H26 capex uptick indicates sustained revenue momentum for Accton.
- We believe market expectations on AWS T3 supply chain remain undemanding and anticipate the stock to ride on T3 ramp up in 2H26.
- Beyond 2026, Accton plans to expand its capacity by 30%+ next year, which could help sustain Accton's growth momentum in the next 1-2 years.OW.
Accton's earnings and yoy trend
Source: Company data, J.P. Morgan estimates.
Accton to outgrow datacenter switch market with 92% rev CAGR
Source: Company data, J.P. Morgan estimates.
-YoY
2028
120%
93%
137%
85%
' 600
500
400
300
119%
250%
-
200%
-
150%
300
250
200
Wiwynn: Well positioned across GPU, AI ASIC, and general servers
200
100
50%
- We expect Wiwynn to outperform on new AI server ramps (both ASIC and GPU projects) and a multi-year general server upcycle.
50
- There could be a re-rating opportunity on the new U.S. CSP ASIC project ramp.
0
- We expect GPU server to re-accelerate in 4Q26, supported by the initial ramp of Nvidia/AMD GPU servers.
GPU server revenue (NT$bn)
3%
223%
166%
- Overall, we forecast AI server revenue growth of ~73%/~110% in 2026/27.
- Importantly, our industry research suggests Wiwynn is participating in the bidding process for Google's TPU v8/v9 projects (TPU trays).
- We model a 26% CAGR in Wiwynn's general server shipments over 2026-28, supported by inference-driven server demand.
- We expect the stock to continue outperforming over the next 3-6 months on new AI server ramps and a multi-year general server upcycle. Stay OW.
Source: Company data, J.P. Morgan estimates.
Source: Company data. J.P. Morgan estimates.
0%
2026E
2027E
- GPU server % of total revenue
22%
25%
2028E
30%
25%
20%
15%
10%
5%
0%
20,000
15,000
Loles o earmings ana yoy trena
80%
66%
29% 31% 27%
20%
90%
70%
- 50%.
25%
Lutes o server gross prom and server or controution 7
20,000
16,000
18,000
14,000
47%
Lotes: Near-term GM headwind, eyes on strong server demand and AI optionality
- Near-term margin weighed down by raw material price increases, depletion of low-cost inventory, and ramp-up costs for new products.
- We expect stable GMs and a mild OPM rebound in 3Q26, with a more meaningful margin recovery in 1H27 as new product cycles ramp.
2020
2021
2022
2023
2024
2025
2026E 2027E
- We view general server demand intact and keep our forecast of 20-30% server shipment growth over 2025-28, despite near-term supply uncertainty.
- 2027 order outlook remains strong with new platform penetration rates likely to reach 30%+
Source: Company data, J.P. Morgan estimates.
Source: Company data, J.P. Morgan estimates.
- Lotes has gained market share in the existing Intel/AMD server platforms due to its competitive pricing strategy.
- Looking ahead, management expects 35-40% m/s in the next-gen Intel/AMD server platforms.
- We believe AI products could bring potential upside to Lotes' business, driven by SOCAMM / QD ramp and mass production of OE socket in 2H27.
Source: Company data, J.P. Morgan estimates.
Lotes's server gross profit and server GP contribution %
Source: Company data, J.P. Morgan estimates.
69%
80%
70%
48%
63%
J.P.Morgan
Apple Supply Chain
(mn units)
iPhone EMS build (LHS)
YoY (RHS)
(mn units)
iPhone 15 mini - 2U21
iPhone 13 - 2021
"Phane SES
3
iPhone EMS build plan
iPhone 15 Plus - 2023
iPhone 16 Plus - 2024
iPhone 16 - 2024
iPhone 16 Pra -2024
iPhone 16 Pra Max - 2024
"Phane 16e iPhone 17 - 2025
iPhone 17 Air - 2025
iPhone 17 Pro - 2025
iPhone 17 Pra Max - 2025
iPhone 17e
Foldable iPhone - 2026
iPhone 18 Pra - 2026
iPhone 18 Pro Max - 2026
Mix (%)
iPhane 13 - 2021
¡Phane 15 mini - 2021
"Phane SEJ
iPhone 14-2022
Phane 15 - 2023
iPhone 14 Plus - 2022
tane 15 Plus - 20
чане 16 - 210
iPhone 16 Plus - 2024
iPhane 16 Pra -2024
iPhane 16 Pra Max - 2024
iPhone 16e iPhone 17 - 2025
iPhone 17 Air - 2025
iPhone 17 Pro -2025
iPhone 17 Pra Max - 2025
iPhone 17e
Foldable iPhone - 202G
iPhone 18 Pro - 2026
iPhone 18 Pra Max - 2026
New model (on units)
2021 - 13 series
2022 - SE3
2022 - 14 series
2023 - 15 series
2024 - 16 series
2025 - 16e
2025 - 17 series
2026 - 17e
2026 - 18 series
10
Source: J.P. Morgan estimates. Note: As this data is based on our channel checks, both actuals and forecasts are from J.P. Morgan.
1023
60
1%
2023
40
-17%
3023
50
-10%
1Q23|
88
11%
1Q24
49
-17%
2024
46
15%
3024
58
15%
4
7624
83
- 5%
1025
56
14%
2025
48
4%
3025
52
-10%
40,25
94
13%
1026
58
3%
2026E
55
16%
3Q2GE
52
0%
1Q2GE
85
- 10%
21
232
7%
2022
243
5%
2023
238
- 2%
2024
236
1%
2025
250
6%
2026E
250
0%
Launch time
Model
Front camera
Face ID (Rx)
- Resolution
Selfie
13e
Face ID
(Rx+Tx)
HD
1H27E
iPhone 13
iPhone 13 Air
Face ID + Sellie can
Face ID
(Rx+Tx)
HD
Face ID
(Rx+Tx)
HD
2H27E
iPhone 20 Pro iPhone 20 Pro
Max
Face ID + Seife cam
Face ID
Face ID
(Rx+Tx)
HD
iPhone 17 Pro
Max
Face ID
(Rx+Tx)
HD
1H26
17e
Face ID +
Selfie cam
Face ID
(Rx+ Tx)
HD
2H26E
iPhone 13 Pro iPhone 18 Pro
Max
Face ID + Selfie cam
Face ID
Face ID
(Rx+Tx)
HD
(Rx+Tx)
HD
Foldable iPhone
Dư ai cam
NIA
2H25
iPhone 17 iPhone 17 Air iPhone 17 Pro
Face ID + Se/fe cam
Face ID
(Rx+Tx)
HD
Face ID
Face ID
(Rx+ Tx)
HD
(Rx+Tx)
HD
iPhone 17, 18, 20 series roadmap, with continued lens spec migrations
-
Elemerts
-
Elemerts
GP
EP
- Expect more iPhones to be launched in 2026E and 2027E:
Rear camera
Wicke
-
Resolution
-
Elemerts
-
OIS
Telephoto
- Elemerts
Ultra wide
-
Resolution
-
Elemerts
TOF
-
Resolution
-
Elemerts
Triple cam +
Triple cam +
EP
Triple cam +
Triple cam +
- 4 models in 2026E: iPhone 17e in 1H26 + 1 st foldable iPhone / 18 Pro / 18 Pro Max in 2H26
48MPx
48MPx
6P
Wide
48MP x
GP
Single cam
Wide
48MPx
Triple cam +
ToF
(Rx+Tx)
HD
Metalens
Selfie
24MP x
Triple cam +
ToF
Wide
Wicke
48MPx, 7P unchanged, but a
48MP x
48MPx
48MP x
Foldable iPhone
Du ai cam
NIA
Selfie
24MPx
GP
Urclerdisplay
2-MPx
EP
Du al cam
Wide
48MPx
48MPx
48MP x
- 6 models in 2027E & onwards: iPhone 18e / 18 Air / 18 (base model) in 1H27 + next-gen foldable iPhone / 20 Pro / 20 Pro Max in 2H27
Sensor shift
Sensor shitt
No sensar shif
Sensor shif
Sensor shift
Sensor shif
- Gradual lens spec improvements in iPhone 17-20 series:
1G3P + 1 prism 1G3P + 1 prism
Sensor shift
Folded
43VP x
1G3P + 1 prism 1G3P + 1 prism
Sensor shift
Folded
Sensor shift
Folded
43MPx
43VP x
1G3P + 1 prism 1G3P + 1 prism
- 17 series in 2H25: 1) front-end selfie camera will upgrade to 24MP (from 12 MP) for all 4 models, 2) folded camera (periscope) of Pro models will upgrade to 48 MP (from 24 MP in 16 Pro models). 6P ToF ToF 6P NIA NIA GP NIA NIA aperture ToF ToF 6P NIA
2MP x
2MPX
2MP X
2MPX
2MP ×
2MP X
- 18 series in 2H26E: 1) wide cam of Pro models will become 7P 'variable aperture', 2) foldable model will have dual front cam with underdisplay.
- 20 series in 2H27E: 1) wide camera of Pro models will remain at 7P with 48 MP resolution, but upgrading to a much larger lens size, 2) ultra wide cameras of Pro models will remain at 6P with 48 MP resolution, but upgrading to a larger aperture.
Source: J.P. Morgan estimates, Company data. Note: Red-colored text refers to spec upgrades.
No sensor shit
NIA
No sensor shift
NIA
Sensor shitt
NIA
Sensor shift
NIA
No sensor shit
NIA
GP
Underdisplay
24MPx
Liquid cooling components
J.P. Morgan
Cold plate module
(with inner manifold)
Liquid cooling component overview - take GB-series rack for example
Quick
cooling)
Source: Auras, Asus company reports, websites.
J.P. Morgan
NVIDIA GB300 Compute Tray
NVIDIA Vera Rubin Compute Tray
Source: Computex event.
| Nvidia VR200 | CSP ASICs | |
|---|---|---|
| Heat spreader/Lid (packaging level) | Rubin GPU: 1-piece lid, US$50 | ASICs: stiffener, US$15-20 |
| Sole supplier of Rubin GPU lid: Jentech | Jentech ~80% m/s in CSP ASIC stiffener I-Chuan ~20% | |
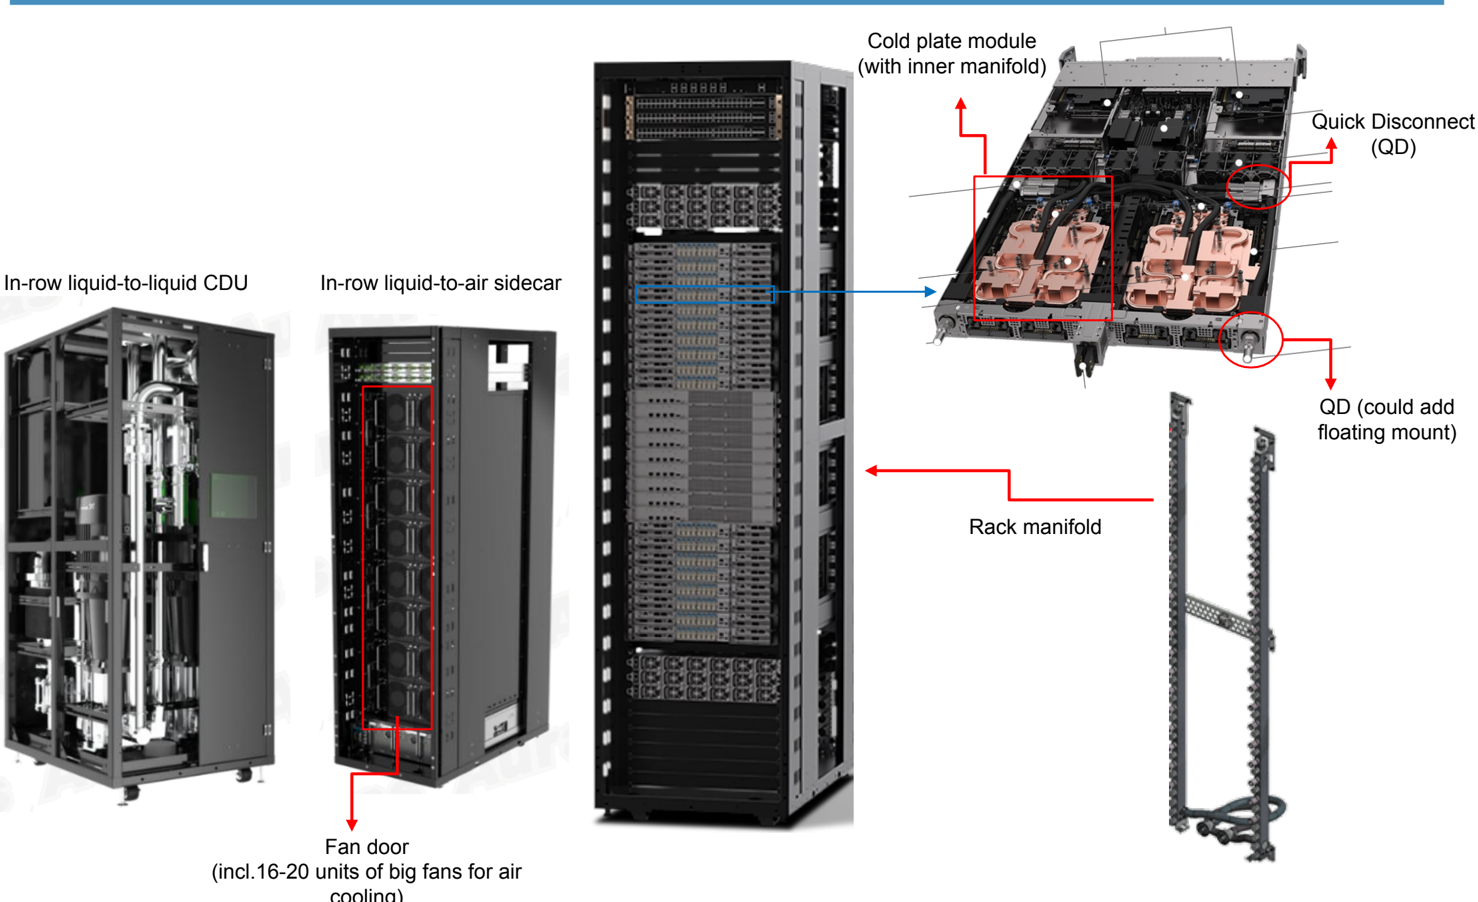
| Liquid cooling content per tray (system/tray level) | US$2,400-2,500 (incl. cold plates, internal manifold, QDs) | >US$3,000 (incl. cold plates, internal manifold, QDs) |
| Qualified suppliers: AVC, Cooler Master, Jentech, BYDE, etc | Google TPU: Furukawa, AVC, Boyd, Cooler Master AWS Trainium: AVC, Cooler Master, Microloop, Auras, etc |
Source: Company data, J.P. Morgan estimates.
Processor
Socket
Motherboard
Backplate ion report (link).
Appendix
Quanta
Compal
Compal
Wistron (excl. Wiwynn)
Lenovo
HP
Dell
10-15%
Wistron
China
80%
68%
70%
15-20%
India
Huagin
Other Asia Mexico
10%
10-15%
Vietnam
10%
Inventec
30%
30%
NB ODM capacity breakdown and market landscape
ASUS
Acer
<5%
40-45%
Pegatron
10%
35-40%
ASUSTek
5-10%
- We believe NB ODMs will continue to expand the non-China NB capacity based on customer requests. We expect non-China NB capacity to reach 30%+ by end of this year. Lenovo 50-80% 10-20% 5% 5% 5%
- Among NB ODMs, Hon Hai has the highest non-China NB capacity exposure (50% in Vietnam), followed by Wistron/Compal/Inventec at 30-40% non-China capacity.
- In contrast, Pegatron and Quanta have slower capacity relocation, which could lead to potential market share losses.
- There could be some margin impact from production relocation costs in the mid to longer term.
| NB ODM matrix | NB ODM matrix | NB ODM matrix | NB ODM matrix | NB ODM matrix | NB ODM matrix | NB ODM matrix | NB ODM matrix | NB ODM matrix | NB ODM matrix |
|---|---|---|---|---|---|---|---|---|---|
Source: J.P. Morgan estimates.
Quanta
Hon Hai
NB ODM/OEM capacity breakdown by region
Source: J.P. Morgan estimates, Company data. Note: PC brand capacity breakdown includes both in-house and outsourcing capacity. Other Asia includes Taiwan,
Thailand, India, etc.
U.S.
Wingtech/
Europe
Luxshare
Others/in-
RoW
house
60%
2%
CoWos Consumption by customer (k wafer per year)
NVIDIA
CoWoS forecast
CoWos-L
Outside TSMC (CoWoS-S/R)
AMD
CoWos-s
CoWos-L
Broadcom
CoWos-S at TSMC
CoWos-S outside TSMC
CoWos-L
Alchip + AWS
Marvell (incl AWS for Trn2)
MediaTek
Others
Overall Total CoWos Consumption yoy
Total TSMC
Total Others (OSATs)
Overall Total CoWos Consumption
Source: J.P. Morgan estimates.
CoWoS allocation breakdown
2027E
2028E
2026E
1196
1076
40
1735
1385
105
% Revision vs prior ests
2027E
1%
1%
100%
JPM Comments
2026 CoWoS-L at TSMC, others at OSAT, 2027 Rubin Ultra assuming 2-die-on-interposer solution.
TSMC adding some CoWo-R to support Vera and future IPX projects now.
1280
0%
4%
Majority of CoWos to migrate to COWOS-L by 2H25. Rubin Ultra likely to remain on CoWOS-L Feynman likely to
CoWoS allocation breakdown
2024
192
127
97
30
65
2025
400
385
30
355
15
2026E
725
685
10
675
40
| MI450 ramp in late 2026, moving to CoWoS-L for onwards, onwards, forecasts incl. Xilinx. Meaningful upside | MI450 ramp in late 2026, moving to CoWoS-L for onwards, onwards, forecasts incl. Xilinx. Meaningful upside | MI450 ramp in late 2026, moving to CoWoS-L for onwards, onwards, forecasts incl. Xilinx. Meaningful upside | MI450 ramp in late 2026, moving to CoWoS-L for onwards, onwards, forecasts incl. Xilinx. Meaningful upside | MI450 ramp in late 2026, moving to CoWoS-L for onwards, onwards, forecasts incl. Xilinx. Meaningful upside | MI450 ramp in late 2026, moving to CoWoS-L for onwards, onwards, forecasts incl. Xilinx. Meaningful upside | MI450 ramp in late 2026, moving to CoWoS-L for onwards, onwards, forecasts incl. Xilinx. Meaningful upside | MI450 ramp in late 2026, moving to CoWoS-L for onwards, onwards, forecasts incl. Xilinx. Meaningful upside | MI450 ramp in late 2026, moving to CoWoS-L for onwards, onwards, forecasts incl. Xilinx. Meaningful upside | |
|---|---|---|---|---|---|---|---|---|---|
| 45 | 52 | 95 | 355 | 540 | 19% | 97% | forecasts to 2027 due to MI400 and Venice CPU demand. Venice in ASE from 2027, conti nued upside in 2028. | ||
| 45 | 52 | 25 | 0% | -100% | MI350 and Xilinx - main CoWoS-S customer. AMD also has non-Al projects migrating to 2.5D packaging in 2H26, likely to be mostly at ASE but not captured in these forecasts | ||||
| 55 | 160 | 230 | 0% | -6% | CoWos-L move likely only for MI400 family and beyond, Venice family of CPUs also to use CoWos-L. | ||||
| Outside TSMC (CoWoS-L/ FoCoS / EFB) | 15 | 195 | 310 | Mostly Venice CPU, but several PC, Gaming and Xbox chips also using Wafer-Level Fan-Out from 2027 - we are modeling only the server CPU parts. | |||||
| 70 | 96 | 250 | 425 | 580 | 0% | 0% | TPu vi (ironwood) and voi most or the volume in 2026 and 2021, va Tamily likely to extend to 2028 a5 well MTIA CoWoS ramp seems slower, OpenAl in 2027. Tomahawk 6 also using CoWos-s. | ||
| 70 | 91 | 220 | 260 | 130 | 0% | 0% | CoWos-S is still mainstream in 2026, but more adoption of CoWoS-L from 2027 for Meta, OpenAl and future versions of TPU starting late 2027 | ||
| 5 | 10 | 70 | 130 | 0% | 0% | Out our in expecting to pick up-trialing Ast and Amkor for Networking projects in 2027. OSA qualfication | |||
| 20 | 95 | 320 | 0% | 0% | arting to use CoWos-L for some projects including advanced TPU models; also likely to incorporate Sole fe vanced ASICs for TPUv10, MTA 450/500 and OpenAl Titan2 in 20: | ||||
| 14 | 5 | 65 | 175 | 250 | 0% | ||||
| lear-term upside to Trn2. Minor Trn3 CoWoS or OSAT allocation. MSFT MAIA 3 to ramp in 2027. Not seeing | |||||||||
| 13 | 75 | 35 | 40 | 80 | 0% | 33% | ig ramp for other CoWoS projects in 2027. In 2028, expect some allocation for Trn4 (for NVLink fusior versions). | ||
| 30 | 150 | 75 | 0% | 20% | 2026 Pocat volume strengthening in 2026/27. TRUNS Humufish now firmly on Intel EMIT - hence lower | ||||
| 16 | 24 | 40 | 40 | 60 | 14% | -20% | one is o, using, toking Chip or wigs vener, some east one sever see | ||
| 350 161% | 652 86% | 1,240 90% | 2,381 92% | 3,320 39% | 2% | 14% | |||
| CoWos Consumption by customer (k water per year) | 2024 | 2025 | 2026E | 2027E | 2028E | 2026E | 2027E | IPM Comments | |
| 290 60 | 592 60 | 1,140 100 | 1,956 425 | 2,490 830 | 0% 43% | 8% 52% | TSMC includes sub-contracting of oS to ASE/SPIL from 2025 and sub-contracting of Interposer to Vanguard ainly ASE/SPIL and Amkor, non-TSMC utilization uneven in 2025, given move to CoWoS-L; more full-s ta Wos from 2H26. Intel EMIB not modeled here, but main volume ramp only in 20 | ||
| 350 | 652 | 1240 | 2381 | 3320 | 2% | 14% | |||
| J.P.Morgan |
Source: J.P. Morgan estimates.
7%
8%
2023
70
70
70
Compute tray
GB300 Superchip
SSD
Main SSD drives
Boot drives
Fans
BMC
PDB
Busbar
HMC
ASP (S)
85,000
960
1,152
576
20
16
GB300 server BoM analysis
Networking cards
BlueField 3
CX7/8
Cold plate
Thermal module
Manifold - GB300 server
Chassis
Universal Quick Disconnect
Cables/Connectors
Others
Slide rail
Compute tray BoM (S)
Total compute tray BoM cost (5)
MVA/ Assemblyfees
NVLink switch tray
N/Link Switch chip
CPu
Fans
Switch board
Thermal module
Manifold
Cold plate
Universal Quick Disconnect
BMC
Chassis
Others
2,500
3,000
Content (S) Mix of total BoN
170,000
86.0%
5,760
4.608
1,152
200
64
300
200
700
300
10,000
6,000
2.9%
2.3%
0.6%
0.1%
0.0%
5.0%
3.3%
11.6%
5.0%
5.1%
3.0%
| 4,000 2.0% 1,500 0.8% | 2 in each compute tray | ||
|---|---|---|---|
| 500 0.3% | D2C Liquid cool cold plate. | ||
| Two pairs per server; JPMe $200 each pair | |||
| 750 | 0.4% | MCIO, PCle, etc. Based on FIT comments $500-1000 total content value. | |
| 0.8% 2 VO board, power cord, cables/connectors | |||
| 191,674 | 96.9% | ||
| 3.1% Assume 10% annual working capital fees for GB300 Superchip and memory, 2.5 month cycle time and 15% margin for other non-GPU parts | |||
| 197.723 | |||
| Unit | Mix of total BoM | Note/Assumption | |
| Two chips for each tray. | |||
| 1 | 500 | 2% | AMD EPYC 3151 |
| 1 | 9% | Assuming $1.2k for PCB value | |
| Each tray has 6-8 fans with each at $20 ASP | |||
| Liquid cooling | |||
| 500 | 2% | Tivo cold plates for two NVLink switch chips | |
| Two pairs per tray: JPMe $200 each pair | |||
| AST2600 at $14 each | |||
| 300 | 1% | Assuming similar to general server | |
| 1 | 1→00 | Connectors, cables, etc. |
Switch tray BoM (S)
MVA/ Assemblyfees
Total compute tray BoM cost ($)
GB300 (10-9-8) Rack BoM cost analysis
Compute tray
Switch tray
Power supply system
Power shelf
Power whip
Bus bar
BMC
Thermal module (rack level)
Manifold
Chassis (rack level)
NVLink cables / connectors
| 21,918 100% | 4.8% Assume 10% annual working capital fees for main chip, 2 month cycle time and 15% margin for other non-chip parts | ||
|---|---|---|---|
| Unit | Content (S) Mix of total BoM | Note/Assumption | |
| 18 | 3,450,132 | 84.5% | 2RU, 2C4G, Bianca form factor. 9 compute trays per rack |
| 20,856 9 | 187.704 | 4.6% 9 switch trays per rack | |
| 4 | 41.200 | 1.0% | 12KW*6 units per shelf, power shelf layout |
| - | 600 1.500 | 0.0% 0.0% | Bizlink's comments NVL36 BoM for Busbar+powerwhip is ~$4000-5000 |
| 4 | 64 | 0.0% | Each RU has one BMC |
| 4.000 | One pair per rack. Liquid to air solution. | ||
| 10,000 | |||
| 35 5184 | 181.440 | DACs ASP at ~$35 each: 2 coonectors * $10-15 ASP +one copper cable at $15; Unit: 72 GPU * 72 ports |
Top of rack (ToR) front-end switch
4,000
50,000
MVA/ Assembly fees
018300 Rack otal BOM mthout MVA (USS)
GB300 Rack total BoM (USS)
4.000
50,000
95%
0.1%
1.2%
JPMe for ASP
mgmt server, cable cartrage, etc.
| 3,934,640 | 96.4% | ||
|---|---|---|---|
| 148,114 | 3.6% | Sum of MVA for computing/swich tray + 10% margins of other parts | |
| 4,082,754 | 100.0% | ||
| Source: Company data, J.P. Morgan estimates. | |||
| J.P.Morgan |
Source: Company data, J.P. Morgan estimates.
Unit
10
Note/Assumption
Each Bianca module has 2 G B200 Superchip
Each compute tray has 4 E1.S SSD drives, each SSD containing 3.84 TB storage, $0.3 per GB from Korea memory team
Each compute tray has 1 M.2 SSD boot drives, each having 1.92 TB storage, $0.3 per GB from Korea memory team
Each tray has 8-10 fans with each at $20 ASP.
DC-SCM and HMC board; two for two DPUs
Assuming adoption of Nvidia's DPU
Compute tray
VR200 Superchip - Strata board
SSD
Main SSD drives
Boot drives
BMC
Midplano
PDB
Busbar
HMC
125,000
ASP (S)
1,958
2,304
576
16
5,000
VR200 server BoM analysis
Networking cards
BlueField 4
CX9 1/0 board
Thermal module
Cold plate
Inner manifold
Universal Quick Disconnect
Chassis
Slide rail
Others
Compute tray BoM (S)
MVA/ Assemblyfees
Total compute tray BoM cost ($)
NVLink switch tray
NVLink Switch chip
CPU
Thermal module
Switch board
Cold plate
Manifold
Universal Quick Disconnect
BMC
Chassis
Others
Switch tray BoM (S)
6,800
4,000
6,000
250,000
Content (S)
9,792
9,216
576
48
5,000
300
200
700
300
34,000
Mix of total BoM
80.3%
3.1%
3.0%
0.2%
0.0%
1.6%
0.1%
0.1%
0.2%
0.1%
10.9%
| 30,000 9.6% | 4 in each compute tray, each VO board contains 2 CX9 chips (800G) | ||
|---|---|---|---|
| 2,610 0.8% 1,250 0.4% | |||
| D2C Liquid cool cold plate | |||
| 1,000 | 0.3% | 1000 manifold content per VR tray by AVC | |
| pover cable, other cable/connector. mechanical parts. etc | |||
| 304,450 | 97.7% | ||
| Assume 10% annual working capital fees for VR Superchip and memory, 2 month cycle time and 6% margin for other non-GPU parts | |||
| 311.459 | |||
| Unit 4 | Content ($) | Mix of total BoM | Note/Assumption |
| 12,000 500 | 48,000 | Four chips for each tray. NVLink 6th chip. | |
| 500 | 1% | AMD EPYC 3151 | |
| 1 | 2,500 | 4% | Assuming $1.6k for PCB value |
| Liquid cooling | |||
| 4 cold plates for 4 NVLink switch chips | |||
| Two pairs per tray: JPMe $200 each pair | |||
| 16 | AST2600 at $16 each | ||
| 300 | 300 | 1% 2% | Assuming similar to general server |
| 1,000 | 1000 | Connectors, cables, mgmt module, sliderail, etc |
MVA/ Assemblyfees
Total compute tray BoM cost (S)
Compute tray
Switch tray
Power supply system
110kw power shelt
Power whiD
Bus bar
BMC
Rack manifold
Chassis (rack level)
NVLink cables / connectors
Cable cartridge
53,996
1,699
24,000
97%
3.1% Assume 10% annual working capital fees for main chip, 2 month cycle time and 15% margin for other non-chip parts
0.4%
| 55,695 | 100% | |||
|---|---|---|---|---|
| NVL72 Oberon (10-9-8) Rack BoM cost analysis | ||||
| Unit 18 | Content (S) Mix of total BoM Note/Assumption 84.6% 2RU, 2C4G, Bianca form factor. 9 compute trays per rack | |||
| 304,450 53.996 | 5,480,100 | |||
| 485.964 | 81,764 | 7.5% 9 switch trays per rack 1.3% | ||
| 12% 18.5kW6 units3RU per shelf, power shelf layout. PMC card -300, power shelf shell ~3200 | ||||
| 77,600 | 1.600 2,500 | 0.0% 120A per power whip, 2 whip per shelf 0.0% Liquid cooled | ||
| 64 | 0.0% Each RU has one BMC 0.1% 1 pair | |||
| 8,000 | ||||
| 10.000 | 2.8% DACs ASP at~$35 each: 2 coonectors * $10-15 ASP tone copper cable at $15; Unit: 72 GPU - 72 ports | |||
| 35 5184 | 181,440 |
Top of rack (ToR) front-end switch
Others
MVA/ Assemblyfees
NVL72 Rack total BoM (US$)
4,000
25,000
4.000
25,000
0.1% Two ToR 400G 32 port switch, one mgmt 1G switch
| NVL72 Rack total BoM without MVA (USS) | 6,300,268 | 97.3% | |
|---|---|---|---|
| 174.883 | 2.7% Sum of MVA for computing/switch tray + 10% margins of other parts | ||
| 6,475,151 | 100.0% | ||
| Source: Company data, J.P. Morgan estimates. |
Source: Company data, J.P. Morgan estimates.
1
0.4% mgmt server, fber patch panel, etc.
Unit
Note/Assumption
Each Strata module has 2 Rubin GPUs and 1 Vera CPU, 768GB LPDDR5 per board
Each compute tray has 4 E1.S SSD drives, 8 T per drive, $0.3 per GB from Korea memory tean
Each compute tray has 1 E1.S SSD boot drive, 2 T per drive, S0.3 per GB from Korea memory tean
DC-SCM and HMC board; one for DPU
11 Paladin connectors, M8+ PCB ~$1000, Connector content S500-1000, Amphenol margin
Assuming adoption of Nvidia's DPU
kunits
YoY
Top 4 US CSP general server board shipments
JPM bottom-up generic whitebox Ethernet ToR switch TAM
2022
7,167
2023
5,857
-18%
2024
6,144
5%
8,767
2025-
43%
2026E
12,274
40%
2027E
25%
18,411
2028E 25-28 CAGR
20%
Quantifying the TAM for generic whitebox Ethernet ToR switch (including AI Front-end)
Nhitebox ToR switch penetration rat
47%
46%
50%
60%
62%
64%
66%
- Overall, we forecast a ~43% CAGR over 2025-28 for the general-purpose white-box Ethernet ToR switch revenue TAM, driven by (1) stronger general server demand, (2) rapid build-out of AI front-end network fabrics, and (3) ASP uplift from ongoing speed migration.
3%
0%
1%
0%
1 %
0%
1%
D%
JPM bottom-up generic whitebox Ethernet ToR switch TAM
0%
0%
25/5DGbps
20D/4DDGbps
20D/4DDGbp
Total
8DDGbps
1 Gbps
4DGbps
1 DG bps
25/5DG bps
20D/40DGbps
100Gbps
8DDGbps
Blended ASP per port ($)
1 DDGbps
8DDGbps
20D/40DGbps
Total TAM (US Smn)
3%
0%
4%
0%
8%
1%
| 235 704 | 72 | 63 | |||
|---|---|---|---|---|---|
| 47 | D | ||||
| 2,536 19,956 | |||||
| D | |||||
| 23,477 | |||||
| ASP per whitebox switch port by speed (US$) | 21 | 19 | 19 | 18 | |
| 422 105 | 289 110 | 264 117 | 239 125 | ||
| 2, | 82 5,442 | 69 6, 367 | 43 7,024 | ||
| 1,212 | 2,413 | 4,435 | |||
| 2,466 | 182 6,935 | 642 9,504 | 1,218 12,726 | ||
| 14% 65% | 59% | 37% | 34% | ||
| Source:650 Group, Gartner®, J.P. Morgan estimates. |
YOY
Source:650 Group, Gartner®, J.P. Morgan estimates.
J.P. Morgan
0%
0%
2%
3%
15,342
28%
Al server shipment estimates (k racks)
GB200
Kyber NVL144
HGX
Hopper
Blackwell
Rubin
GB200
GB300
VR200
Kyber NVL144
HGX
Hopper
Blackwell
Rubin
GB200
GB300
VR200
Kyber NVL144
HGX
Hopper
Blackwell
Rubin
YoY
YoY
Nvidia's GPU ToR switch TAM estimates
2023
2024
30
2025
2026E
70
6
3
Nvidia's GPU ToR switch TAM estimates
2027E
10
3
60
38
2028E
44
| 800G eqv. port demand per rack | |||||
|---|---|---|---|---|---|
| 72 | 72 | 72 | 72 | ||
| 144 | 144 | 144 288 | 144 | ||
| 288 | 288 | 288 1,152 | |||
| 1,152 1,152 | 1,152 1,152 | ||||
| 64 | 64 | 64 | 64 | ||
| 128 | 128 | 128 | 128 | ||
| 128 | 128 | 128 | 128 | ||
| 360 | 1,440 | 0 | |||
| 8,640 | |||||
| 1,440 | 17,280 2,880 | 2,880 46,080 | |||
| 4,480 | 160 | 800 | |||
| 4,000 | |||||
| 640 | 4,800 | 5,600 | |||
| 4,480 | 15,240 | 27,200 | 54,560 | Total port demand (k, 800G eqv.) | |
| ASP per 800G eqv. port (US$) | 506 | 487 | 521 | 557 7% | |
| 2,269 | 7,420 | 14,169 | 30,411 | Nvidia's GPU networking TAM (USSmn) | |
| 110% | 183% | 91% | 115% | ||
| Nutlers et unetwo raing Ethernet TAM (USSmn) | 32% | 75% | 82% | 87% | |
| 733 | 5,565 | 11,619 | 26,458 | ||
| 239% | 286% | 109% | 128% | ||
| Source: J.P. Morgan estimates, Company data |
Source: J.P. Morgan estimates, Company data
25-28 CAGR
J.P. Morgan
J.P. Morgan
400G switch
CPU
Fans
Unit price (S)
146
Switch BoM comparison - 400G vs. 800G bare-metal switch
% of BoM Note
2% Intel" Xeon® Processor D-1527
Volume
1
Total cost
146
What drives the ASP expansion of high-end datacenter switch?
PSU
Chassis
PCB
DRAM
300
300
- We estimate a ~150% ASP increase for 800G switches versus 400G switches, driven by
NAND
Others
MVA
Subtotal
Total
- 2-3x higher Switch ASIC cost (Contributing ~70% of the total ASP increase)
20% Assume 20% GM for ODMI
- PCB / CCL Materials upgrade to M8 from M6+, 3-4x CCL content growth
- CPO adoption could also significantly increase the switch BoM and bodes well for ODM margins given the high complexity of component integration (FAU, OE, shuffle box, etc.). CPU Switch chip
PSU
Fans
Chassis
PCB
NAND
Others
DRAM
Subtotal
MVA
Total
1% 7+1, assume some spec upgrades for fans to dissipate more heats
Switch BoM comparison - 400G vs. 800G bare-metal switch
23
360
300
1500
184
300
720
1,500
| 2.5 | 72 80 | 0% Management + control pane. 32GB DDR4 SODIMM. |
|---|---|---|
| 466 | 2% Cables, connectors, other analog ICs and peripheral components | |
| 15,541 | 80% | |
| 3,885 | 20% Assume 20% GM for ODM | |
| 19,427 | 100% |
Source: J.P. Morgan estimates, NAND/DRAM volume is on a per GB basis
0.3
Disclosures
Analyst Certification: The Research Analyst(s) denoted by an 'AC' on the cover of this report certifies (or, where multiple Research Analysts are primarily responsible for this report, the Research Analyst denoted by an 'AC' on the cover or within the document individually certifies, with respect to each security or issuer that the Research Analyst covers in this research) that: (1) all of the views expressed in this report accurately reflect the Research Analyst's personal views about any and all of the subject securities or issuers; and (2) no part of any of the Research Analyst's compensation was, is, or will be directly or indirectly related to the specific recommendations or views expressed by the Research Analyst(s) in this report. For all Korea-based Research Analysts listed on the front cover, if applicable, they also certify, as per KOFIA requirements, that the Research Analyst's analysis was made in good faith and that the views reflect the Research Analyst's own opinion, without undue influence or intervention.
All authors named within this report are Research Analysts who produce independent research unless otherwise specified. In Europe, Sector Specialists (Sales and Trading) may be shown on this report as contacts but are not authors of the report or part of the Research Department.