PDF 原檔:報告_MS_CPO測試與封裝供應鏈_20261008_original.pdf
圖片清單(已驗證 2026-10-12)
| 檔名 | size | 分類 | 親眼所見內容 |
|---|---|---|---|
報告_MS_CPO測試與封裝供應鏈_20261008_001.png |
144KB | 真資料圖 | MPI TS3000-SE 探針機外觀照(螢幕顯示 Alibria 介面) |
報告_MS_CPO測試與封裝供應鏈_20261008_002.png |
366KB | 真資料圖 | MPI Advanced Probe Systems 展場照,機台標示 TS3500-IFE(單面/雙面晶圓探測) |
報告_MS_CPO測試與封裝供應鏈_20261008_003.png |
86KB | 真資料圖 | MPI DTS650 晶粒對晶粒測試機外觀 |
報告_MS_CPO測試與封裝供應鏈_20261008_004.png |
377KB | 真資料圖 | 手持圓弧形 probe card 實物照(含 BGA 區與電路板,鋁質環框),來源標 FormFactor |
報告_MS_CPO測試與封裝供應鏈_20261008_005.png |
355KB | 真資料圖 | MPI 晶粒對晶粒測試設備內部實景照(光學對位平台、電子模組) |
報告_MS_CPO測試與封裝供應鏈_20261008_006.png |
389KB | 真資料圖 | FormFactor 探針/物鏡對光學引擎晶片的針測近照(黃光耦合) |
報告_MS_CPO測試與封裝供應鏈_20261008_007.png |
158KB | 真資料圖 | 鴻勁(Hon Precision)CPO 方案表:Insertion 4(ASIC+Optical Engine,3000W 單 site,含 Optical Alignment Stage)及 CPO FT(2000W/1000W 單/雙/四 site)的 ATE+ATC handler 配置 |
報告_MS_CPO測試與封裝供應鏈_20261008_008.png |
212KB | 真資料圖 | ASE 簡報:Optical/FAU Attach Comparison(OSAT 視角),V-groove/Bridge coupler/Edge/Grating/CoW mirror coupler 依 performance vs. wafer-scale 相容性排列,附 CPO HVM(Known Good OE)五項準則 |
報告_MS_CPO測試與封裝供應鏈_20261008_009.png |
386KB | 真資料圖 | Corning CPO Tray 展示實物(含 FAU 及光纖收納) |
報告_MS_CPO測試與封裝供應鏈_20261008_010.png |
323KB | 真資料圖 | 緯穎(Wiwynn)Computex 展板:Optical Engine Detachable Solution FAU 區(Corning FlexConnect、上詮 FOCI、Senko、波若威)及 in-chassis 光纖方案 |
報告_MS_CPO測試與封裝供應鏈_20261008_011.png |
122KB | 真資料圖 | TFC FAU 產品展示牌:MMC-FAU DR Series、16F MT-90° FAU(矽光子/CPO 應用) |
報告_MS_CPO測試與封裝供應鏈_20261008_012.png |
190KB | 真資料圖 | 上詮 FAU 於 CPO 封裝示意(FAU 置於多顆光學引擎周邊),標示全自動封裝系統、輕微主動角度最佳化 |
報告_MS_CPO測試與封裝供應鏈_20261008_013.png |
74KB | 真資料圖 | NVIDIA Spectrum-X CPO 交換器晶片封裝外觀 |
報告_MS_CPO測試與封裝供應鏈_20261008_014.png |
64KB | 真資料圖 | NVIDIA Quantum-X CPO 交換器晶片封裝外觀 |
報告_MS_CPO測試與封裝供應鏈_20261008_015.png |
197KB | 真資料圖 | 上詮 SiPh Roadmap:2025 1.6Tbps OE on substrate(可插拔)、2026 CPO Switch(Scale Out)6.4Tbps OE on substrate、2026 beyond CPO XPU(Scale Up)12.8Tbps OE on interposer,附封裝示意 |
報告_MS_CPO測試與封裝供應鏈_20261008_016.png |
246KB | 真資料圖 | 上詮 CPO 方案:挑戰(高密度光纖陣列、FA 對 lens/MT 需求、高溫共封)與上詮技術(20/40/80 通道 FAU、ReLFACon 專利、自製黑色高密度連接器、自動化測試設備) |
報告_MS_CPO測試與封裝供應鏈_20261008_017.png |
44KB | 真資料圖 | ReLFACon 示意:Switch/XPU 基板上 Si/EIC/PIC 堆疊,PIC 端以 ReLFACon 接 FAU |
報告_MS_CPO測試與封裝供應鏈_20261008_018.png |
168KB | 真資料圖 | ASE 簡報:CPO 演進表,Pluggable/On-Board Optics/co-Packaging Optics(3.2/6.4/12.8T)/Optical I/O(6.4/12.8T 以上),頻寬越高功耗越低 |
報告_MS_CPO測試與封裝供應鏈_20261008_019.png |
290KB | 真資料圖 | 華為 Atlas 950 SuperPoD 展場照(1024 卡、256TB 統一記憶體編址) |
報告_MS_CPO測試與封裝供應鏈_20261008_020.png |
563KB | 真資料圖 | 兩個機櫃背部大量綠色光纖線纜接至板卡(Ascend 950 SuperPod 仍採 800G 光模組) |
報告_MS_CPO測試與封裝供應鏈_20261008_021.png |
536KB | 真資料圖 | 阿里巴巴磐久 AL64 分布式 NPO 光互連超節點伺服器機櫃照 |
報告_MS_CPO測試與封裝供應鏈_20261008_022.png |
312KB | 真資料圖 | 阿里巴巴 SNPO 展示:NPX Socket、SNPO 3.2T/6.4T SiPh、3.2T VCSEL |
報告_MS_CPO測試與封裝供應鏈_20261008_024.png |
186KB | 真資料圖 | 致茂 FT/SLT 方案:GPU TDP Hopper 700W→Blackwell 1000-1400W→Rubin 1800->3000W;King Cobra 控溫、3160-H FT handler、3200-HD 高密度測試平台 |
報告_MS_CPO測試與封裝供應鏈_20261008_025.png / 報告_MS_CPO測試與封裝供應鏈_20261008_026.png |
84KB/75KB | 真資料圖 | 白光干涉原理示意(亮暗條紋)/干涉儀架設圖(反射鏡、樣品、白光光源、相機) |
報告_MS_CPO測試與封裝供應鏈_20261008_027.png / 報告_MS_CPO測試與封裝供應鏈_20261008_028.png |
59KB/57KB | 真資料圖 | 致茂先進封裝量測:Model 798X(CoWoS/WMCM 晶圓級 CD 量測,TSV/VIA/RDL/Overlay)/Model 799X(CoPoS 面板級) |
報告_MS_CPO測試與封裝供應鏈_20261008_029.png |
191KB | 真資料圖 | 致茂 CPO Test Solutions:PIC 晶圓測試 586XX、Light Engine/CPO 自動化測試 587XX、5860X、Laser Source |
報告_MS_CPO測試與封裝供應鏈_20261008_030.png / 報告_MS_CPO測試與封裝供應鏈_20261008_036.png / 報告_MS_CPO測試與封裝供應鏈_20261008_037.png / 報告_MS_CPO測試與封裝供應鏈_20261008_046.png |
43-66KB | 真資料圖(財務類) | 本益比/P/S 區間、日月光風險報酬圖、穩懋 P/B 走勢;不嵌公司頁 |
| 其餘 <40KB | <40KB | 未 Read | 估值/風險報酬小圖,不嵌 |
其餘 <40KB 圖未 Read(預設 logo/小圖表);財務、估值、股價類圖表不嵌公司頁。
原始內容
| Morgan Stanley Taiwan Limited+ | Morgan Stanley Taiwan Limited+ |
|---|---|
| Lucas Wang Equity Analyst | +886 2 2730-2875 |
| Charlie Chan | +886 2 2730-1725 |
| Morgan Stanley Asia Limited+ Andy Meng, CFA | +852 2239-7689 |
| Morgan Stanley Taiwan Limited+ Derrick Yang Equity Analyst Derrick Yang@morganstanley com | |
| Morgan Stanley MUFG Securities Co , Ltd + Suzune Tamura, CFA Equity Analyst Suzune Tamura@morganstanleymufg com Morgan Stanley Taiwan Limited+ | +886 2 2730-2862 |
| Daniel Yen, CFA Equity Analyst Daniel Yen@morganstanley com Morgan Stanley Asia Limited+ | +886 2 2730-2863 |
| Daisy Dai, CFA Equity Analyst Daisy Dai@morganstanley com | +852 2848-7310 |
| Henry Zhao Equity Analyst | |
| Henry Zhao@morganstanley com than Jia Research Associate | +852 2239-7731 |
| Ethan Jia@morganstanley com | +852 3963-2287 |
| Greater China Technology Semiconductors | Attractive |
| Ex ibit 1 : Rating/Price Target Changes | Ex ibit 1 : Rating/Price Target Changes |
| What's changed Rating Price Target | What's changed Rating Price Target |
| Allring 6187.TWO Unchanged at OW From NT$1580 to NT$2000 WIN Semi 3105.TWO From UW to EW From NT$300 to NT$600 | Allring 6187.TWO Unchanged at OW From NT$1580 to NT$2000 WIN Semi 3105.TWO From UW to EW From NT$300 to NT$600 |
| KYEC 2449.TW Unchanged at OW From NT$338 to NT$348 | KYEC 2449.TW Unchanged at OW From NT$338 to NT$348 |
| ASE 3711.TW Unchanged at OW From NT$628 to NT$858 | ASE 3711.TW Unchanged at OW From NT$628 to NT$858 |
| FOCI 3363.TWO From OW to EW From NT$708 to NT$688 | FOCI 3363.TWO From OW to EW From NT$708 to NT$688 |
Source: Morgan Stanley Research estimates
Morgan Stanley does and seeks to do business with companies covered in Morgan Stanley Research. As a result, investors should be aware that the firm may have a conflict of interest that could affect the objectivity of Morgan Stanley Research. Investors should consider Morgan Stanley Research as only a single factor in making their investment decision.
For analyst certification and other important disclosures, refer to the Disclosure Section, located at the end of this report.
= Analysts employed by non-U.S. affiliates are not registered with FINRA, may not be associated persons of the member and may not be subject to FINRA restrictions on communications with a subject company, public appearances and trading securities held by a research analyst account.
M Asia Pacific Insight October 8, 2026 10:16 PM GMT
Greater China Technology Semiconductors
Time to revisit CPO and its testing/packaging supply chain
With the recent correction of Taiwan's CPO supply chain, we think expectations have een reset. It's time to revisit the stocks. Reiterate OW on ASE, upgrade WIN Semi to EW, downgrade FOCI to EW.
PIC (photonic IC) and testing are major gating actors or co-packaged optics:
During S MICON Taiwan, several global semiconductors C Os confirmed that CPO adoption is a matter of time. In our recent AI supply chain tracker, we also indicated that Rubin Ultra NVL576 will use CPO for scale-up connect. However, recently some investors have debated whether PIC supply from TSMC may decrease to 35mn units (vs. our previous forecast of 60mn units), which caused a correction of Taiwan's CPO supply chain over the past month. We think that expectations have been reset and it's time to revisit the stocks.
Testing is still the gating actor or CPO to scale: Our recent supply chain checks suggest that although TSMC's PIC production is still the bottleneck, total O (optical engine) production could still reach c. 60mn in 2026. By assuming a 95% yield rate for TSMC IC/PIC hybrid bond and 30% yield rate in downstream assembly, the available O shipments could still reach 17-18mn, which we think is enough to cover 5k NVL576 equivalent of scale-up switches and 200-250k of spectrum scale-out. The open question for 2027 is how fast it can scale. We think testing is the step that sets that pace - the whole CPO testing process is still not finalized. Within our Greater China Semis coverage, we believe TSMC, AS , Hon Precision, MPI, and AllRing will continue to benefit from this secular trend - we suggest building positions on any pullbacks. WIN Semi and KY C could also benefit from optical demand proliferation and longer testing on AI semis. We therefore upgrade WIN Semi to W.
FAU is becoming crowded; downgrade FOCI to EW: Over the past 12 months the supplier base of FAU (Fiber Array Units) has changed. We count at least 10 companies with CPO FAU products shipping, sampling, or in pilot production. Three of them (Corning, Coherent, and TFC) should have larger roles than FOCI in NVIDIA's CPO programs in Rubin NVL576 generation. We therefore see FOCI's FAU market share as more challenging than a year ago. If FOCI can show design wins and share on Optical IO platforms as adoption widens, we would revisit our rating.
What about opportunities in China? NPO should be mainstream or China's AI computing systems: We expect near-packaged optics (NPO) to become the main optical interconnect in China's AI computing systems from 2027, ahead of CPO. For details, please see Could NPO be the solution rather than CPO?
With this report, Lucas Wang assumes coverage of Allring, FOCI, MPI, Hon Precision, and King uan Electronics.
M Asia Pacific Insight
Asia - Testing/CPO Stocks: Order of Preference
Ex ibit 2: Asia - Testing/CPO Stocks: Order of Preference
| Hon Precision 7769.TW | MPI 6223.TWO | Allring 6187.TWO | ASE 3711.TW | Chroma 2360.TW | Advatest 6857.T | TSMC 2330.TW | KYEC 2449.TW | Largan 3008.TW | WIN Semi 3105.TWO | FOCI 3363.TWO | |
|---|---|---|---|---|---|---|---|---|---|---|---|
| Rating | Overweight | Overweight | Overweight | Overweight | Overweight | Overweight | Overweight | Overweight | Equal-Weight | Equal-weight | Equal-weight |
| Trading Currency | TWD | TWD | TWD | TWD | TWD | JPY | TWD | TWD | TWD | TWD | TWD |
| Price Target | 10,008.0 | 8,000.0 | 2,000.0 | 858.0 | 2,800.0 | 45,000.0 | 3,088.0 | 348.0 | 7,100.0 | 600.0 | 688.0 |
| Current Price | 5,925.0 | 5,575.0 | 1,525.0 | 744.0 | 2,330.0 | 40,930.0 | 2,550.0 | 304.5 | 6,660.0 | 581.0 | 667.0 |
| Upside/(Downside) (%) | 69% | 43% | 31% | 15% | 20% | 10% | 21% | 14% | 7% | 3% | 3% |
| Market Cap (in USD mm) | 30,135.7 | 17,615.0 | 4,599.7 | 105,402.2 | 31,106.1 | 187,585.6 | 2,075,671.0 | 11,755.0 | 28,046.8 | 7,730.4 | 2,379.6 |
| Avg Daily Traded Vol (in USD mm) | 170.5 | 162.8 | 67.7 | 327.0 | 182.5 | 1,710.8 | 2,304.2 | 246.7 | 177.6 | 265.0 | 67.4 |
| Street View: Ratings | |||||||||||
| Buy/Overweight | ||||||||||||||||||||||||| | 100%||||||||||||||||||||||| 92% | ||||||||||||||||||||||||| | 100%||||||||||||||||||||||||| | 100%||||||||||||||||||||||||| | 100%||||||||||||||||||||| 83% | |||||||||||||||||||||||| 95% | ||||||||||||||||||||||| 93% | |||||||||||||||||| 70% | |||||||||||||||| 64% | ||||||||||||||||||||||||| 100% |
| Hold/Equal-weight | 0% 0% | || 8% 0% | 0% 0% | 0% 0% | 0% 0% | |||| 17% 0% | | 5% 0% | || 7% 0% | |||| 15% | || 7% | 0% 0% |
| Sell/Underweight Bull Case Value | 16,000.0 | 11,000.0 | 2,780.0 | 1,000.0 | 61,000.0 | 3,720.0 | 428.0 | |||| 15% 11,142.8 | ||||||| 29% 900.0 | 895.0 | |
| Upside (%) | 170% | 97% | 82% | 34% | 3,900.0 67% | 49% | 41% | 67% | 55% | ||
| Bear Case Value | 5,000.0 | 5,000.0 | 810.0 | 500.0 | 1,100.0 | 23,000.0 | 46% 1,700.0 | 220.0 | 3,649.2 | 300.0 | 34% 320.0 |
| Downside (%) | -16% | -10% | -47% | -53% | -44% | -33% | -28% | -45% | -48% | -52% | |
| -33% | |||||||||||
| Risk/Reward Skew | 10.9 | 9.4 | 1.8 | 1.0 | 1.3 | 1.1 | 1.4 | 1.5 | 1.5 | 1.1 | 0.7 |
| Morgan Stanley Estimates | |||||||||||
| FY26e | TWD | TWD | TWD | TWD | TWD | JPY | TWD | TWD | TWD | TWD | TWD |
| Sales | 54,983 | 21,126 | 10,055 | 847,748 | 55,154 | 1,848,000 | 5,589,451 | 47,683 | 66,920 | 21,499 | 2,100 |
| EBITDA | 28,578 | 7,241 | 3,340 | 190,688 | 22,684 | 940,300 | 4,201,496 | 27,207 | 33,813 | 6,082 | (34) |
| EBIT | 28,510 | 7,241 | 3,281 | 102,211 | 21,844 | 909,000 | 3,384,759 | 13,675 | 25,313 | 2,862 | (194) |
| EPS | 129.19 | 64.33 | 30.89 | 18.42 | 43.97 | 971.45 | 115.32 | 9.06 | 184.85 | 8.63 | (0.34) |
| FY27e | |||||||||||
| Sales | 93,963 | 46,004 | 18,000 | 1,143,902 | 76,117 | 2,945,600 | 7,471,986 | 67,303 | 74,757 | 28,255 | 6,791 |
| EBITDA | 49,985 | 17,492 | 5,371 | 330,239 | 32,742 | 1,593,500 | 5,560,587 | 43,467 | 37,386 | 9,614 | 1,605 |
| EBIT | 49,917 | 17,492 | 5,312 | 195,615 | 31,967 | 1,558,000 | 4,577,529 | 21,516 | 28,086 | 5,427 | 1,363 |
| EPS | |||||||||||
| 222.56 | 150.14 | 48.14 | 32.92 | 62.77 | 1,591.42 | 152.74 | 13.66 | 204.18 | 11.29 | 10.18 | |
| FY26 MSe vs. Consensus Mean | |||||||||||
| Sales | -1.6% | -1.7% | 10.1% | 1.0% | 0.8% | 5.7% | 2.8% | -0.6% | 1.0% | 2.9% | -10.4% |
| EBITDA | 1.2% | -12.9% | 9.8% | 6.5% | -1.6% | 4.9% | 4.4% | 9.3% | 1.9% | -5.2% | -125.7% |
| EBIT | 1.5% | -2.7% | 11.3% | 3.4% | -1.7% | -23.3% | 6.0% | 1.3% | -0.8% | -6.3% | 404.2% |
| EPS | 0.3% | -1.1% | 11.1% | -1.3% | -1.6% | 6.0% | 6.8% | 1.3% | 0.0% | 22.3% | -266.7% |
| FY27 MSe vs. Consensus Mean | |||||||||||
| Sales | 1.2% | 10.4% | 30.7% | 8.6% | -2.7% | 31.6% | 1.7% | -3.9% | 1.9% | 13.5% | -26.3% |
| EBITDA | 1.8% | -3.0% | 7.4% | 21.5% | -7.7% | 37.8% | 2.6% | 16.1% | 0.6% | 19.3% | -36.9% |
| EBIT | 3.0% | 10.6% | 9.7% | 22.8% | -6.7% | 8.6% | 6.2% | -4.2% | -2.9% | 15.0% | -37.7% |
| EPS | 1.5% | 9.9% | 12.7% | 15.9% | -6.1% | 36.0% | 6.6% | -6.2% | 0.1% | 13.3% | -39.9% |
| Valuation Multiples at Last Close | |||||||||||
| FY26e | |||||||||||
| P/E | 45.9x | 86.7x | 49.4x | 40.4x | 53.0x | 42.1x | 22.1x | 33.6x | 36.0x | 67.3x | -1951.4x |
| EV/EBIT | 32.6x | 76.7x | 43.1x | 35.9x | 44.9x | 31.7x | 18.8x | 30.7x | 30.0x | 88.1x | -391.3x |
| EV/EBITDA | 32.5x | 76.7x | 42.3x | 19.3x | 43.3x | 30.6x | 15.1x | 15.5x | 22.4x | 41.5x | -2268.0x |
| EV/Sales | 16.9x | 26.3x | 14.1x | 4.3x | 17.8x | 15.6x | 11.4x | 8.8x | 11.3x | 11.7x | 36.2x |
| FCF Yield | -0.6% | 0.6% | 1.4% | -3.9% | 1.5% | 2.1% | 2.2% | -7.5% | 1.5% | 0.7% | -1.9% |
| FY27e | |||||||||||
| P/E | 26.6x | 37.1x | 31.7x | 22.6x | 37.1x | 25.7x | 16.7x | 22.3x | 32.6x | 51.5x | 65.5x |
| EV/EBIT | 18.8x | 31.4x | 26.3x | 19.4x | 30.4x | 17.9x | 13.5x | 19.8x | 26.8x | 46.5x | 57.3x |
| EV/EBITDA | 18.8x | 31.4x | 26.0x | 11.5x | 29.7x | 17.5x | 11.1x | 9.8x | 20.1x | 26.3x | 48.7x |
| EV/Sales | 10.0x | 12.0x | 7.8x | 3.3x | 12.8x | 9.5x | 8.3x | 6.3x | 10.1x | 8.9x | 11.5x |
| FCF Yield | 1.3% | 1.7% | 2.0% | -2.2% | 2.3% | 3.4% | 3.4% | -0.2% | 2.0% | 1.3% | -2.5% |
Source: Company data, FactSet, Morgan Stanley Research e = Morgan Stanley Research estimates Note: Current prices as of the market close on October 8, 2026, unless otherwise noted M Asia Pacific Insight
Testing is still the gating factor for CPO to scale
Co-packaged optics (CPO) is now in production. NVIDIA's Quantum-X Photonics InfiniBand switch began shipping around early 2026 and was in customer production deployments by mid-2026. Spectrum-X thernet Photonics entered full production in August 2026. The open question for 2027 is how fast it can scale - and we think testing is the step that sets that pace.
Optical testing today is slow and largely manual, with no common standard, which also makes automation critical for CPO to scale. In current NVIDIA flows, optical testing coverage largely ends at the optical engine (Insertion 3), and the packaged device receives an electrical-only final test. Two insertions are being added: simultaneous optical-electrical final test (Insertion 4) and SLT (system level test). We believe Insertion 2 (wafer-level testing of bonded IC-on-PIC wafers) will remain in the process - it's important to select KGO (known good O ) as earlier as possible.
Hon Precision has the clearest dated exposure through its Insertion 4 handler, an all-new tool that carries a higher ASP than electrical-only final testing. MPI is the earliest local entrant at the optical engine stage (Insertion 3), and Insertion 2 is upside optionality if qualification succeeds. AllRing supplies assembly equipment: its fiber-array coupling tools sit between Insertions 2 and 3, and demand scales with optical engine count. AS executes much of the back-end flow and buys the equipment; it benefits as test content moves from the wafer to the package.
The key debate is timing of scale-up CPO. Switch-only CPO volumes keep test tool counts modest. The step-change in test equipment demand comes when CPO moves into NVLink scale-up, which first appears in Rubin Ultra NVL576 (2H27) and reaches volume with Feynman (2028).
Co-packaged optics
In CPO, 'insertion testing' typically refers to the defined test insertion points throughout the manufacturing flow, specifying where and how optical-related testing is conducted from wafer level through final system integration. The primary objective of these insertion tests is to identify the known-good optical engines (KGO ) prior to integration with SoC/ ASIC. In practice, current CPO manufacturing flows typically include four to five test insertion stages. The associated measurements can be broadly grouped into three domains: photonic integrated circuit (PIC) signals, optical output signals from the optical engine, and system-level electrical and optical signals. However, as CPO technology remains at an early stage of development, TSMC and its OSAT partners are still in the process of defining and standardizing the full insertion-test flow, while concurrently qualifying suitable testing equipment and ecosystem partners.
Why testing is the gate
Testing a PIC means bringing a fiber to an on-chip coupler with sub-micron to few-micron tolerance. The cross-sectional area of a single-mode fiber core is hundreds of times that of a silicon waveguide, so small misalignments produce large jumps in insertion loss. Thermal M Asia Pacific Insight behavior adds a second layer: ring modulators shift resonance with temperature, and the buried oxide layer in SOI wafers conducts heat about 100 times worse than silicon. lectrical probe cards work at tens-of-microns precision; optical alignment is a different regime.
There is no unified test standard for PIC parameters such as insertion loss, polarizationdependent loss, responsiveness, and crosstalk. Connector designs also vary by customer, so this lack of connector standardization makes automation harder because test systems must handle many connector types.The result is that test throughput, test cost, and yield learning now determine how fast CPO capacity can grow, more so than the optical device technology itself.
Insertion framework - from Insertion 1 to Insertion 4 and SLT Insertion 5)
Insertion 1 typically re ers to PIC (Photonic IC) Wa er-Level Testing: The objective is to screen core photonic components such as modulators, photodiodes, and power monitors before downstream processing. Typical test items include optical power, insertion loss, dark current, and basic DC electrical/optical characteristics. This early screening step plays a critical role in removing defective dies upfront, thereby protecting yield and reducing losses in subsequent manufacturing stages.
Insertion 2 typically takes place a ter the COUPE/SoIC stage: This is when electronic IC ( IC) dies are bonded onto the PIC wafer, while testing is still conducted at the wafer level. This stage focuses on electro-optical ( O/O ) performance and the interaction between photonic and electronic components. Key measurements include modulation efficiency, receiver sensitivity, O/O conversion characteristics, and overall link performance. The objective is to verify that the integrated electrical and optical subsystems operate correctly and cohesively before proceeding to further assembly steps.
In insertion 2, COUP stacks the IC on top of the PIC, so a wafer-level tester must contact the IC electrically on one side while aligning fiber to the PIC on the other. Optical coupling at this stage is sensitive to vibration, temperature, and wafer warpage, which should be the hardest process within CPO insertion testing, in our view.
Insertion 3 is per ormed a ter the optical engines are diced individually rom the PIC wa ers: It is typically conducted at the OSAT stage. Before co-packaging with the ASIC, each optical engine undergoes testing to qualify as a KGO . This stage includes high-speed (at-speed) testing such as bit-error-rate (B R), eye-diagram, and jitter analysis, as well as assessments of power consumption, thermal behavior, and wavelength stability. This represents one of the most critical test insertion points, as it shifts defect detection earlier in the manufacturing flow and materially reduces downstream integration risk.
Insertion 4 occurs a ter the optical engine is co-packaged with the ASIC: At that point, a final test is performed on the fully packaged device using both electrical and optical interfaces. Typical test coverage includes electrical functionality, optical link integrity, transmit/receive channel verification, multi-channel consistency, and performance under thermal conditions. This stage closely resembles traditional AT -based final testing, but with added optical complexity.
M Asia Pacific Insight
SLT is the inal insertion: It evaluates the device under mission-mode, real-world operating conditions. SLT typically involves running realistic traffic patterns, conducting long-duration stress tests, monitoring error rates, and assessing thermal-electrical-optical interactions. The objective is to validate end-system performance, stability, and reliability under actual use conditions.
M Asia Pacific Insight
Ex ibit 3: CPO Insertion Test Flow
| Test Insertion | Insertion 1 (wafer-level) | Insertion 2 (wafer-level) | Insertion 3 (die-level)/3.5 (package-level) | Insertion 4 (module-level) - Insertion 4O | Insertion 4 (module-level) - Insertion 4E | Insertion 5 (potential) |
|---|---|---|---|---|---|---|
| Test content | Electronic IC (EIC) & Photonic IC (PIC) | EIC die to PIC wafer (after SoIC) | Optical engine (die-to-die) | CPO package (ASIC+OE) Optical Testing | CPO package (ASIC+OE) Electrical Testing (2025-2026) Optical+Electrical Testing (starting 2027e) | CPO package (ASIC+OE) SLT? |
| Testing surface | ||||||
| Key Product timeline | 2025-2026 Scale-out CPO switch (Spectrum+Quantum) products 2027e onward: Scale-out CPO switch (Spectrum+Quantum) + Scale-up CPO switch products | 2025-2026 Scale-out CPO switch (Spectrum+Quantum) products 2027e onward: Scale-out CPO switch (Spectrum+Quantum) + Scale-up CPO switch products | 2025-2026 Scale-out CPO switch (Spectrum+Quantum) products 2027e onward: Scale-out CPO switch (Spectrum+Quantum) + Scale-up CPO switch products | 2025-2026 Scale-out CPO switch (Spectrum+Quantum) products 2027e onward: Scale-out CPO switch (Spectrum+Quantum) + Scale-up CPO switch products | 2025-2026 Scale-out CPO switch (Spectrum+Quantum) products 2027e onward: Scale-out CPO switch (Spectrum+Quantum) + Scale-up CPO switch products | 2025-2026 Scale-out CPO switch (Spectrum+Quantum) products 2027e onward: Scale-out CPO switch (Spectrum+Quantum) + Scale-up CPO switch products |
| Testing details | El. & opt. DC, (power, loss, dark current etc.) | E/O, O/E, O/O, high speed, S-parameters | Full calibration/DC, high-speed functional, optical loopback, alternatively: S-parameters | Optical Light Transmission Testing, optical loopback | BER testing, signal testing | Full system functional validation |
| Testing service provider | Foundry (Wafer-level) TSMC | Foundry (Wafer-level) TSMC | OSAT (Die/chip level) SPIL (ASE Group) | OSAT (Die/package level) SPIL (ASE Group) | OSAT (Die/package level) SPIL (ASE Group) | OSAT (Die/package level) SPIL (ASE Group) |
| Equipment and Consumable Vendor | PIC ATE tester: 1) Advantest + TEL + Formfactor 2) Chroma (underqualification) EIC tester: 1) Teradyne + TEL EIC Probe card: FormFactor | Wafer level testing: 1)Ficontec +Formfactor +Teradyne 2) Advantest+ MPI | Die-to-die prober: 1. TEL 2. MPI Optical engine E/O tester+laser reliability test+ELS source test head: Chroma Optical and Electrical Test Socket: Winway | CPO switch tester: Chroma Hypersocket: Winway | ATE tester: 1) Advantest (under qualification) 2)Teradyne FT Handler+ELS source test head+optical alignmnet stage : Hon Precision Hypersocket: Winway | CPO SLT tester: Chroma (under qualification) Coaxial socket/Hypersocket: Winway |
Source: Company data, Morgan Stanley Research (e) estimates
M Asia Pacific Insight
For MPI, we expect CPO testing to emerge as a key revenue growth driver over the coming years: Leveraging its prior experience in L D applications, MPI has the capability to internally develop optical modules for both PIC wafer-level and die-level testing, alongside electrical signal testing for IC dies. At present, MPI is shipping wafer-level testing equipment for Insertion 2 by partnering with Advantest and die-to-die probers for Insertion 3. The company is also developing several additional CPO-related testing tools, as well as expanding its portfolio of probe cards for IC applications.
Ex ibit 4: MPI's wafer-level testing equipment for insertion 2
Ex ibit 5: Live demo of wafer-level testing equipment
Source: MPI
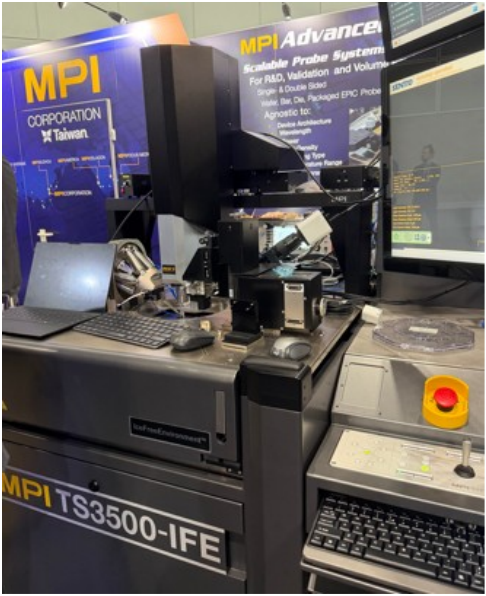
Source: MPI
M Asia Pacific Insight
Ex ibit 6: MPI's equipment for insertion 3 (DT650)
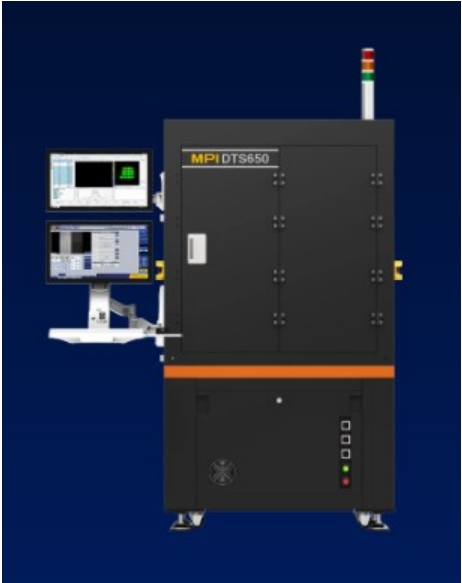
Source: MPI
Ex ibit 8: Probe card for EIC die on PIC wafer for wafer-level testing for CPO
Source: Formfactor
Ex ibit 7: Live demo of die-to-die testing equipment
Source: MPI
Ex ibit 9: Wafer-level testing for optical engine
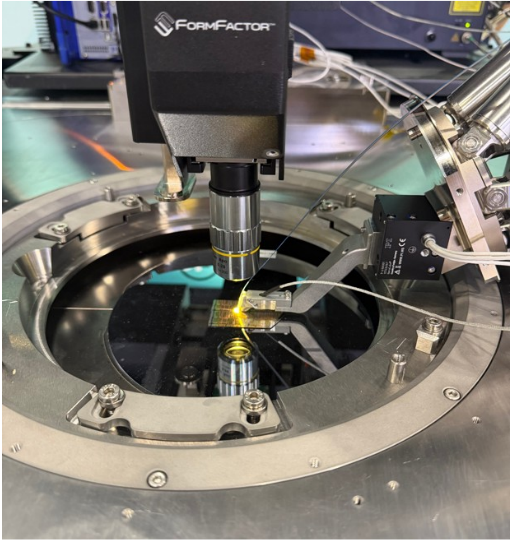
Source: Formfactor M Asia Pacific Insight For Hon Precision, we see CPO as an incremental demand opportunity: As Insertion 1 and Insertion 2 are both conducted at the wafer level, Hon Precision's primary exposure lies in Insertion 4, expected to commence from 2027, as well as in the electric testing performed on Spectrum and Quantum packages. Hon Precision supplies ATC handlers, which operate in conjunction with AT (Automatic Test quipment). The company started shipping ATC handlers for Spectrum and Quantum testing in 2025, and is currently planning to introduce its next-generation handlers for Insertion 4, with shipments expected to begin in 1H27 in preparation for CPO scale-up and mass production.
Ex ibit 10: Hon Precision's solution for CPO
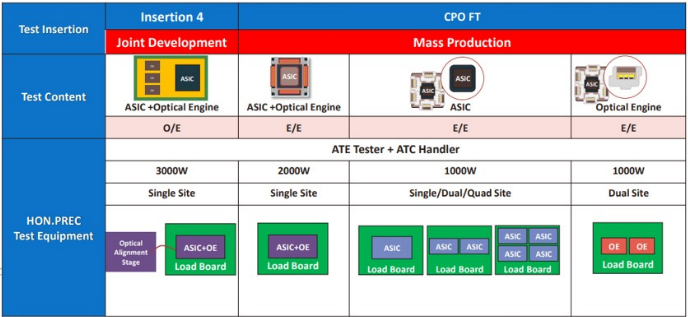
Source: Company data
Allring's CPO products have penetrated the CPO supply chain o NVIDIA or FAUoptical engine coupling and FAU AOI equipment: Its coupling machine pairs a six-axis alignment stage with image recognition for automated FAU-to-chip coupling. This step creates the optical engine that Insertion 3 tests, so coupling yield and throughput directly affect Insertion 3 results. Our latest supply chain checks also suggest that AllRing may have also won the dispensing step after insertion 3, where the optical engine will be mounted onto the CPO package substrate. We expect it to account for 2%, 17%, and 22% of AllRing's total revenue in 2026, 2027, and 2028, respectively. Key focus will be the throughput per tool, which we believe will be the key focus for its customers and the advantage for Allring against its competitors like ADST and MRSI.
Ex ibit 11: Bottom-up analysis for AllRing's revenue
| (NT$mn) | 2024 | 2025 | 2026e | 2027e | 2028e | 2025 Y/Y | 2026 Y/Y | 2027 Y/Y | 2028 Y/Y |
|---|---|---|---|---|---|---|---|---|---|
| CoWoS | 3,530 | 4,771 | 8,055 | 13,500 | 14,400 | 35% | 69% | 68% | 7% |
| CPO | 0 | 150 | 200 | 3,000 | 4,500 | NA | 33% | 1400% | 50% |
| Flip Chip | 200 | 0 | 900 | 200 | 0 | -100% | NA | -78% | -100% |
| SoIC | 120 | 150 | 600 | 700 | 25% | 300% | 17% | ||
| US customer | 200 | 200 | |||||||
| Others | 1,804 | 325 | 750 | 500 | 800 | -82% | 131% | -33% | 60% |
| Total Revenue | 5,535 | 5,366 | 10,055 | 18,000 | 20,600 | -3% | 87% | 79% | 14% |
| Revenue mix | 2024 | 2025e | 2026e | 2027e | 2028e | ||||
| CoWoS | 64% | 89% | 80% | 75% | 70% | ||||
| CPO | 0% | 3% | 2% | 17% | 22% | ||||
| Flip Chip | 4% | 0% | 9% | 1% | 0% | ||||
| SoIC | 0% | 2% | 1% | 3% | 3% | ||||
| US customer | 0% | 0% | 0% | 1% | 1% | ||||
| Others | 33% | 6% | 7% | 3% | 4% | ||||
| Total Revenue | 100% | 100% | 100% | 100% | 100% |
Source: Company data, Morgan Stanley Research (e) estimates
M Asia Pacific Insight
ASE runs much o the back-end CPO low and buys the test equipment: In the
Quantum-X supply chain, TSMC's COUP integrates the IC and PIC into the optical engine, and AS /SPIL handles back-end packaging, including optical coupling and fiber alignment. For Spectrum-X thernet Photonics, NVIDIA named SPIL as the partner for chip-scale packaging and testing, alongside TSMC, Lumentum, TFC Communication, and Foxconn.
AS plans CPO mass production by the end of 2026, covering optoelectronic integration, packaging, test and system co-design. Its subsidiary USI has acquired a controlling stake in Chengdu-based ugenLight Technologies to expand silicon photonics module capacity. As test content moves from the wafer (Insertions 1-2, run at the foundry) to the engine and package (Insertions 3-5, run at the OSAT), more of the test value accrues to AS as service revenue. Longer testing times and new optical-electrical cells also raise capex intensity for its testing operations.
Ex ibit 12: Fiber to PIC Assembly Solutions
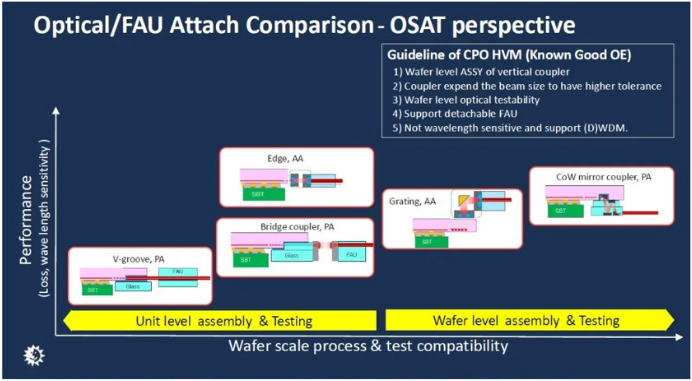
Source: ASE
M Asia Pacific Insight
FAU Is Becoming Crowded
We downgrade FOCI to Equal-weight: FOCI was one of the first suppliers in Taiwan to develop fiber array units (FAUs) for CPO inside TSMC's silicon photonics ecosystem. The stock has been priced as a scarce Taiwanese supplier of a scarce component. However, over the past 12 months the supplier base has changed. We now count at least 10 companies with CPO FAU products shipping, sampling, or in pilot production. Three of them (Corning, Coherent, and TFC) should have larger roles than FOCI in NVIDIA's CPO programs in Rubin NVL576 generation. We therefore see FOCI's FAU market share as more challenging than a year ago when we initiated coverage.
Where we could turn more constructive on FOCI: Our downgrade to qualweight from Overweight is about the switch-CPO FAU market over the next 12-18 months, where FOCI faces larger, better-placed suppliers. However, the longerterm opportunity is optical I/O (OIO), where optical engines and FAUs are copackaged directly with GPUs and other accelerators. OIO should multiply the number of FAUs per system, and FOCI has been preparing for it: it has shown a copackaged optics architecture for multi-chip modules combining an XPU with HBM, and plans to advance MCM/OIO products with customers from 4Q26. Reworkable FAUs also matter more when the package being protected in a GPU rather than a switch. If FOCI can show design wins and share on OIO platforms as adoption widens, we would look to revisit our rating.
What FAU does and why architecture determines key beneficiaries
Traditional FAU is a mature, high-precision iber-array assembly: Fibers are placed into V-grooves on a glass/silicon/quartz substrate, fixed with a cover and adhesive, polished, and then aligned to a PIC or optical engine. It is proven, customizable, and very low-loss, but assembly becomes more difficult as channel count and density rise. Key FAU suppliers for CPO include vendors such as Corning, Coherent, TFC Communication, FOCI, Senko, Browave, Sumitomo lectric, etc.
Coupling method: Grating coupling brings light into the top surface of the PIC; edge coupling brings it in from the side of the die. TSMC's mainstream COUP platform and key customers' (NVIDIA, AMD, Ayar Labs) solutions for the next few years should still stick to grating coupling, because it is easier to achieve mass production. However, Corning's GlassBridge, for example, targets edge coupling.
Fixed vs. detachable: A fixed FAU is bonded permanently; a detachable FAU plugs into a socket on the package, which allows the optical engine to be tested before final assembly and the fiber to be replaced in the field. NVIDIA's Quantum-X CPO scale-out switch used a fixed interface with FAUs sourced almost entirely from TFC, and NVIDIA's Spectrum-X's move to a detachable connector opened second-source positions for other players. This shows how a single architecture change can redistribute share.
M Asia Pacific Insight
Channel density: CPO roadmaps move from single-row 1D arrays toward multi-row 2D arrays as bandwidth per engine rises. Recent launches show the shift. RAM Photonics and Sumitomo lectric have both shown 2D fiber arrays, and Largan has demonstrated fourlayer stacking. ach step resets the qualification process.
How iber count raises di iculty: Fiber count rises with bandwidth. In a parallel design, each 200G lane needs its own transmit fiber and receive fiber. A 3.2T engine (16 × 200G) therefore needs 32 signal fibers, plus several polarization-maintaining fibers that carry light from external lasers, which is why 3.2T products use FAUs of about 40 channels. A 6.4T engine (32 × 200G) needs 64 signal fibers plus laser fibers, which points to about 80 channels. Fiber count grows roughly in line with bandwidth unless designs use wavelength-division multiplexing (WDM) to carry several lanes on one fiber. At the system level, Corning has said a 51.2T switch may need more than 1,000 fibers.
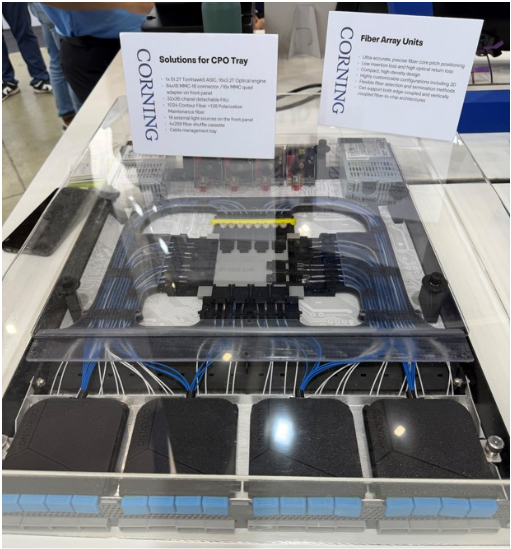
Ex ibit 13: Corning's FAU/CPO demonstration
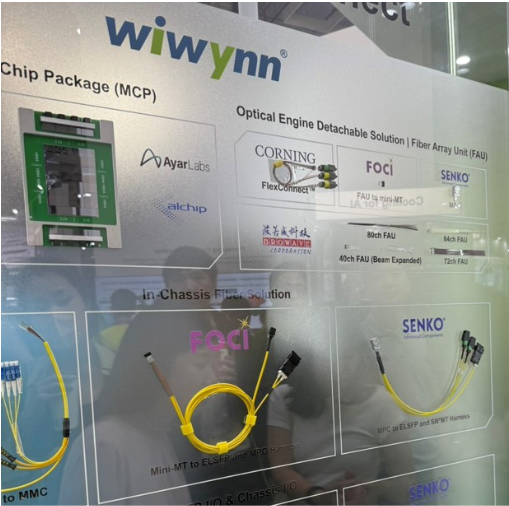
Ex ibit 14: FAU demonstration at Computex for Ayar Labs scale-up solution
Source: Corning, Morgan Stanley Research
Source: Wiwynn M Asia Pacific Insight
Ex ibit 15: TFC's FAU
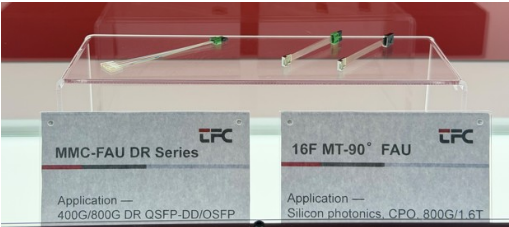
Source: TFC
Ex ibit 16: FOCI's FAU solution for CPO
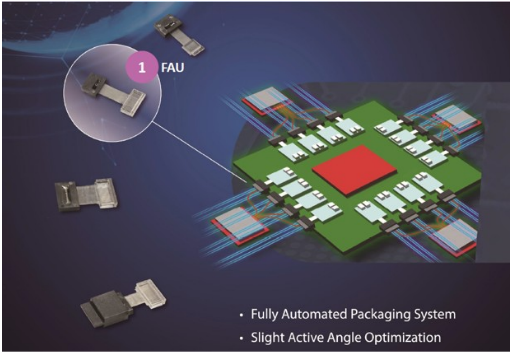
Source: FOCI
Major players within FAU production
FOCI 3363.TWO): The baseline
Strengths - FOCI was early and reworkable FAU could be critical or OIO: It was named in TSMC's silicon photonics ecosystem partner list and has been developing CPO FAUs with TSMC's COUP platform for several years. Its reflow-compatible, reworkable FAU addresses a CPO problem - i.e., that if an FAU fails after bonding, the whole package can be lost, which is extremely important when OIO is packaged together with XPU.
FOCI's FAU shipments started in 3Q26, and August revenue rose 19.7% MoM. FOCI has said that its silicon photonics customers are mainly chip design houses serving highperformance computing. Its September investor presentation listed several MCM CPO packaging solutions already delivered and design-in plans with more than five other customers, although design-ins are not yet volume orders.
Challenges - scale and pro itability: Its first FAU line mainly serves its first customer, with capacity for others planned for next year. Planned capex of about NT$1.54bn from 2026 to 2Q27 is large for FOCI but small against competitors' expansion plans. When CPO gets into scale, the volume, production, and reliability of FOCI's FAU could also be challenges in fulfilling customers' demand.
TFC 300394.SZ; covered by Andy Meng): The incumbent
Strengths - TFCs' CPO FAU and external laser source products are in stable delivery and it is adding capacity with customers: In September, TFC said it had already prepared ample capacity for customers' volume ramp next year. NVIDIA named TFC in the Spectrum-X Photonics production chain for laser module subassemblies, so it already sits inside NVIDIA's CPO supply chain. Its precision manufacturing base dates back to ceramic ferrules, where it took more than 40% global share.
Challenges - potential geopolitical risk: Recent DC meetings highlight 3.2T as the most likely generation to face restrictions on China-based optical transceivers (see Meta Marshall's report Telecom & Networking quipment: Potential FCC Rules on Optical M Asia Pacific Insight Transceivers More Likely to Come in at 3.2T). Although FAUs are components rather than transceivers, so direct exposure is unclear, US customers have an incentive to qualify nonChinese sources even though TFC has production in Thailand.
Implications or FOCI: The US policy angle is the strongest argument for FOCI as a nonChina second/third source. But the supplier-broadening argument cuts both ways: it creates room for FOCI but equally for Corning, Senko, Coherent, and other entrants from Taiwan.
Corning GLW.N; covered by Meta Marshall): The scale player
Strengths - Corning already designs and manu actures iber harnesses with FAUs or CPO and has delivered CPO-optimized iber, customized FAUs, pre-assembled harnesses and connectors: In May 2026, NVIDIA and Corning announced a multiyear commercial and technology partnership under which Corning will increase US optical connectivity capacity tenfold and build three new plants in North Carolina and Texas. Corning also controls fiber supply.
GlassBridge: GlassBridge, which is made by Corning, forms waveguides inside glass using a wafer-based ion-exchange process and relies on passive alignment. The first product supports chip core pitches of 30µm or more and targets coupling loss below 2dB. Corning is co-developing it with GlobalFoundries as a detachable edge coupler. However, it serves a different coupling ecosystem from NVIDIA's grating-coupled designs, and Corning positions GlassBridge as complementary to FAU-based solutions. We see GlassBridge as a 2028+ risk to the terminal value of grating-coupled FAUs, not a 2027 earnings issue. (see our report Greater China Semiconductors: CPO Supply Chain Updates; More on GlassBridge).
Implications or FOCI: Corning is FOCI's key competitor with the most capacity and the closest NVIDIA relationship. Its expansion is the main reason we think FAU pricing may not support the bull-case margin path for FOCI and might consume most of the FAU TAM FOCI is targeting.
Senko privately held under Senko Group; covered by Takuya Osaka): The detachable-interface specialist
Strengths - detachable FAU solution: NVIDIA named Senko among its CPO collaborators when it launched its photonics switches at GTC 2025. In March 2026, Senko and Lightmatter (private) announced a detachable FAU combining Senko's metallic PIC coupler and optical interface with Lightmatter's expanded-beam technology. Lightmatter reports insertion and reinsertion loss below 1.5dB and says the design is compatible with moldand-grind packaging, as demonstrated in AS 's flows. Because the interface uses passive expanded-beam alignment, it removes the need for active fiber alignment during assembly. Senko has also presented a detachable FAU with repeatability under 0.15d, supported by BizLink.
Challenges - detachable FAUs are still early in adoption and cover plate on FAU design is di erent rom NVIDIA: Senko's FAU's cover plate design (S AT™; which is used to align with the receptacle on PIC) is different from NVIDIA's design, which might not be able to ship to NVIDIA for the time being, in our view. Our industry checks suggest that Senko's design of the alignment for both cover plate on FAU and receptacle on PIC is different M Asia Pacific Insight from Nvidia's, which requires a patent. The company has not commented. We believe that if Senko sticks to its own design/patent and would not be willing to accommodate Nvidia's, it might not be the major supplier of Nvidia's FAU.
Implications or FOCI: FOCI's reworkable ReLFACon competes directly with Senko's detachable approach. If detachable connectors become standard across CPO roadmap, Senko's head start and partnerships would be a direct threat to FOCI's differentiation, we believe.
Coherent COHR.N; covered by Meta Marshall): The vertical integrator
Strengths - ability to provide the total solution rather than FAU itsel : Coherent's 2026 OFC investor presentation included FAUs, prism microlens arrays, CPO and NPO modules, and external and continuous-wave lasers within its CPO product range. It can bundle the FAU with the laser and optical engine. NVIDIA announced a multiyear strategic partnership with Coherent in March 2026, alongside one with Lumentum.
Implications or FOCI: Our checks suggest that Coherent could be one of the key FAU (or total solution/fiber kit) suppliers to NVIDIA for Rubin NVL576. If that's the case, it could pressure FOCI;s market share before the OIO generation is released.
Largan 3008.TW; covered by Andy Meng): The precision entrant
Strengths - high precision and ability to expand capacity: Largan says it can combine lower-precision, purchased V-grooves and standard fiber into a finished FA with accuracy below 0.3µm, against 0.5-0.8µm for most products on the market. It has shown fourlayer stacked arrays, which matter for future multi-row designs. In July it confirmed its first order from a customer seeking mass production, with samples sent that month, a pilot line is due by end-3Q26, and volume production as early as mid-2027. It has also spent about NT$8.1bn on land and buildings since June, partly for CPO, and its automated equipment is designed in-house.
Challenges - still relatively new to FAU: In April, Largan management said FAU samples had not yet met loss targets and that building a production line would take one to two years. The timeline has since shortened, but the company still expects six months to a year between pilot and volume production, subject to customer certification. Its chairman has also said Largan may only make FA and micro lens arrays (MLA) rather than full FAUs, and that customer specifications remain single-row for now, with multi-row demand possibly three to four years out.
Implications or FOCI: Although Largan targets FA and MLA for the time being rather than the whole FAU, we still see the possibility for Largan to ship the whole FAU in future. Also, we don't rule out the possibility of Largan collaboratinge with other FAU suppliers, which may have further impact on FOCI's potential market share if that were to occur.
Sumitomo Electric 5802.T; covered bu Yu Shirakawa): The high-density specialist
Strengths - Sumitomo Electric was named in NVIDIA's GTC 2025 silicon photonics ecosystem with strong design capability: It has developed a 90-degree-bent twodimensional fiber array for CPO switches, the 2D-FlexBeamGuid , which arranges 72 single-mode fibers in a 6×12 grid. The company reports a height of 5.5mm, density of 24
M Asia Pacific Insight
fibers per mm and insertion loss below 0.5dB, with polarization-maintaining performance above 20dB. That design targets the multi-row, high-density FAUs that next-generation CPO will need. Sumitomo also makes optical fiber, connectors and semiconductor lasers, including high-power laser sources for CPO, so it can supply several parts of the optical path. Its optical device production is in Japan and Vietnam, which keeps it outside the scope of US measures aimed at Chinese suppliers.
Implications or FOCI: Sumitomo is a credible (in terms of the current quality and capacity) non-China source for the next-generation 80- and 100-channel, multi-row sockets FOCI is seeking for its 2027-28 growth. FOCI's channel-count roadmap is therefore entering a field where at least one established supplier has already shown a 72fiber 2D design.
BizLink 3665.TW; covered by Derrick Yang): The system-level interconnect player
Strengths - System-level integration and collaboration with FAU/HPC vendors. BizLink completed its acquisition of Shenzhen-based Shin Fu Sheng in January 2026, adding fiber patch cords, MPO/MTP connectors and FAU technology, targeting 20- and 42-channel CPO FAUs. It is expanding fiber assembly capacity several times over in China and Taiwan. It also has partnered with S NKO and other ASIC vendors to provide the FAU alignment process for the CPO architecture.
Challenges - mass production experience: Though Bizlink has developed some optical alignment capability internally in the past few years, it does not have experience in mass production as of now, which could hinder it in bidding for more projects.
Implications or FOCI: BizLink can work with FAU vendors or chip vendors for the FAU alignment, so there is some room for cooperation between Bizlink and FOCI.
Other entrants
Browave 3163.TWO; not covered): FOCI's closest Taiwanese peer, already in NVIDIA's ecosystem
Browave was one o the 11 companies NVIDIA named in its silicon photonics ecosystem at GTC 2025 - alongside TFC, Senko, Corning, and Sumitomo lectric. Its CPO products focus on optical I/O: FAUs, fiber harnesses and fiber distribution (shuffle) boxes. Browave has production experience in planar lightwave circuit (PLC) fiber arrays and WDM microoptics, including lens arrays, and co-designs with customers. Its CPO timeline calls for small-volume production in 3Q26, monthly volume in the thousands in 4Q26, and tens of thousands a month in 1Q27 if customer schedules hold. Browave plans to expand its Philippine plant two- to threefold, supported by its plant in Zhongshan, China.
Focused on shu le boxes: Management has clarified that the thousands and tens-ofthousands volume targets refer mainly to shuffle modules rather than precision FAUs. Its MMC connector line depends on licensing from US Conec, and it buys its connectors from third parties. Part of its production sits in China.
Implication for FOCI: Browave competes for the same "Taiwan, non-China" position FOCI relies on, with NVIDIA ecosystem membership and a profitable base business to fund it.
M Asia Pacific Insight
Ability Opto 3362.TWO; not covered)
This company is aiming for volume production in 2027 and a target of about 30% of revenue from the product line. HST (private; non-covered) combines metalenses, mirrors and 2D FAUs into a pluggable multi-row product; its first line in Zhunan is planned at 200,000 sets a year, with trial production in 4Q26 and a target of 2028 scale-up CPO. Outside Taiwan, RAM Photonics (private) says its 2D fiber array has entered mass production with an architecture that scales to more than 1,024 fiber ports. Most of these are pre-revenue in CPO FAUs, but together they show how many suppliers will be competing for 6.4T and multi-row sockets.
Ex ibit 17: FAU - Competitive landscape
| Supplier | Type | CPO FAU status (Oct 2026) | Main strength | Main challenge | When it competes with FOCI |
|---|---|---|---|---|---|
| FOCI (3363 TWO) | Taiwan fiber components | Shipping 40-ch from 3Q26 | Reflow-compatible, reworkable FAU; TSMC ecosystem ties; patents | Small scale; loss-making; customer concentration | - |
| TFC (300394 CH) | China optical components | Stable delivery of CPO FAUs and laser modules | NVIDIA incumbency; scale; 60%+ gross margin | China-based; customer concentration; US policy overhang | Now |
| Corning (GLW US) | Global fiber and glass | Delivering custom FAUs and harnesses; GlassBridge in co- development | Fiber supply; NVIDIA partnership; US capacity expansion | GlassBridge targets edge coupling and takes time | Now |
| SENKO | Japanese connectors | Detachable FAU with Lightmatter; NVIDIA collaborator | Detachable interface IP; expanded- beam passive alignment | FAU's cover plate design (SEAT™) might not be compatible to Nvidia current FAU/CPO module. | Now |
| Coherent (COHR US) | Vertically integrated optics | FAU and lens arrays in CPO portfolio | Can bundle FAU with lasers and engines; NVIDIA investment | FAU not core business | Now to 2027 |
| Largan (3008 TT) | Taiwan precision optics | First FA order; pilot line end-3Q26; volume mid-2027 at earliest | Alignment precision; automation; multi- layer stacking | Yield unproven; may stay at FA level; customer acceptance | 2027+ |
| BizLink (3665 TT) | Taiwan interconnect | FAU sampling; small-volume CPO harness shipments | System-level interconnect; NVIDIA/SENKOrelationship | Mass production experience | 2027+ |
| Sumitomo Electric (5802 JP) | Japanese cable, fiber and laser group | In NVIDIA ecosystem; 72-fiber 2D FAU developed for CPO | Fiber, connectors and lasers in-house; 2D high-density design; non-China | FAU is a small part of the group | Now to 2027 (2D) |
| Others | Browave, Ability Opto, HST, RAM Photonics | Sampling to early production | 2027-28 | ||
| GlassBridge (Corning) | Alternative architecture | Co-development with partners | Wafer-scale glass waveguides; passive alignment | Edge-coupled; first product limited to 30µm+ pitch | 2028+ |
Source: Company Data, Morgan Stanley Research
What crowding does to FOCI's numbers
For 2026, we expect Spectrum-X to be the mainstream scale-out CPO switch product, with the optical engine production number being 800k-1mn units, and total switch shipments being ~25-30k units given production lead time. We now expect Corning, Coherent, and TFC to be the major FAU suppliers, with FOCI taking 5-15% of total market share (vs. our previous assumption of 35%). Thus, we expect NVIDIA's contribution to FOCI's total revenue to be around 12% in 2026
Looking to 2027, our industry checks suggest that NVIDIA could introduce a CPO version of the NVL576 architecture, with the launch time likely in 2H27. As a result, we assume 5k and 20k units of CPO Rubin Ultra rack shipments in 2027 and 2028, respectively, with FOCI having 5-15% market share. Thus, we expect NVIDIA's total revenue to contribute around 82% and 90% of FOCI's total revenue in 2027 and 2028, respectively.
M Asia Pacific Insight
Downgrade FOCI from OW to EW
Our downgrade mostly reflects the competitive landscape and the capability for FOCI to expand the capacity as soon and as much as possible to meet customers' demand. This is also the main reason why we expect FOCI's market share to drop from 15% in 2026 to 8% in 2028 - the demand is growing so fast that our expected O shipments from TSMC are growing from <500k units in 2026 to >70mn units in 2028. However, we believe FOCI will find it hard for capacity to catch up the demand growth - its capacity and production scale aren't comparable to other peers like Corning, TFC, or even Largan, etc.
We acknowledge FOCI's design capability, patent, and cooperation with TSMC which is the leader, in building the CPO ecosystem with its COUP technology. However, when customers are desperate for CPO to scale and have components ready, we believe the automation and scale of FAU's capacity will also play an important role in market share.
We see potential for FOCI to announce another fundraising by the end of this year or early 2027 to expand capacity further after its recent small FAU production sample passed customers' qualification. Also, the production line for FAU could also be fully automated by end-2026 and running 24/7.
Where we could be wrong with our EW call
-
Capacity expansion: We expect O shipments from TSMC to growing from <500k units in 2026 to >70mn units in 2028. We therefore expect almost all of the major FAU suppliers to expand capacity, including FOCI. The upside/downside surprise would be the pace of FOCI's capacity expansion.
-
Collaboration with other FAU suppliers: We don't rule out the possibility of FOCI collaboring with other total solutions providers like Corning, Coherent, etc. in future to provide FAUs or part of the FAU components.
-
More customers rather than just Nvidia: There are still multiple customers (probably more than 10) doing prototypes with potential to recognize NR revenue in 2026, with mass production likely starting in 2027 or 2028, according to our supply chain checks. We haven't fully baked this into our FOCI model, and view it as only a bull case scenario as we await additional product launch and shipment signs in the supply chain. However, again, we think the capacity and automation would constrain FOCI's FAU shipments in the near term.
We raise our inal OE shipment assumptions
We raise our final O shipment forecasts from 7mn in 2027 and 48mn in 2028 to 17mn and 73mn, respectively. Although we lower our assumption for TSMC's average capacity in both years, we raise the SoIC (hybrid bond of IC/PIC) utilization rate assumption to 95% because we have seen strong improvement from TSMC in the past year. Also, since the downstream assembly yield rate is already at 20-30% currently, we believe it's not too demanding to improve to 30% on average in 2027.
For this 17mn O in 2027, we believe it's enough to support at least 5k equivalent of Rubin Ultra NVL576 server racks by assuming 2304 scale-up O (18 switch trays per NVL72; four switches per tray; four O per switch) and 768 scale-out O (three switches per NVL72; 32 O per switch) per rack.
M Asia Pacific Insight
Ex ibit 18: Our new OE assumptions from TSMC PIC output
| 2026e | 2027e | 2028e | |
|---|---|---|---|
| TSMC average PIC capacity (kwpm) | 0.5 | 8 | 20 |
| Die per wafer | 648 | 648 | 648 |
| Annual PIC production (mn) | 4 | 62 | 156 |
| SoIC yield rate | 50% | 95% | 95% |
| Optical engine production (mn) | 2 | 59 | 148 |
| Downstream assembly yield rate | 20% | 30% | 50% |
| Actual Optical engine shipment (mn) | 0.39 | 17.73 | 73.87 |
Source: Morgan Stanley Research estimates
Ex ibit 19: Our previous OE assumptions from TSMC PIC output
| 2026e | 2027e | 2028e | |
|---|---|---|---|
| TSMC PIC capacity (kwpm) | 0.5 | 10 | 25 |
| Die per wafer | 648 | 648 | 648 |
| Annual PIC production (mn) | 4 | 78 | 194 |
| SoIC yield rate | 50% | 50% | 50% |
| Optical engine production (mn) | 2 | 39 | 97 |
| Downstream assembly yield rate | 20% | 20% | 50% |
| Actual Optical engine shipment (mn) | 0.39 | 7.78 | 48.60 |
Source: Morgan Stanley Research estimates
We also raise our ASP assumptions for FOCI 3.2T and 6.4T FAU to US$100 and US$220 from US$90 and US$180. However, we lower our market share assumptions for FOCI from 35% to 8-10% for 2027-2028.
Ex ibit 20: Bottom-up analysis: NVIDIA's revenue contribution to FOCI in 2026-28e
| 2026e | 2027e | 2028e | |
|---|---|---|---|
| Rubin Ultra rack unit (k units) | 5 | 20 | |
| Optical Engine content per Rubin Ultra rack | 3072 | 3072 | |
| Scale-Up (NVLink switch/Quantum) | 2304 | 2304 | |
| Scale-out (Spectrum) | 768 | 768 | |
| Other scale-out switch optical engine consumption | |||
| Spectrum-X (k units) | 800 | 1,000 | 3,000 |
| Quantum-X (k units) | 1,000 | 3,000 | |
| Market Share Assumptions | |||
| FOCI | 15% | 10% | 8% |
| Others (TFC, Corning, etc.) | 80% | 85% | 85% |
| FAU ASP Assumptions | |||
| FAU ASP (6.4T; US$) | 220 | 220 | 220 |
| FAU ASP (3.2T; US$) | 100 | 100 | 100 |
| FAU ASP (1.6T; US$) | 45 | 45 | 45 |
| FOCI Revenue contribution from NVIDIA | |||
| Revenue contribution (US$mn) | 9 | 186 | 597 |
| Revenue contribution (NT$mn) | 261 | 5,568 | 17,914 |
| FOCI CY Revenue (NT$mn) | 2,100 | 6,791 | 19,914 |
| % of total revenue | 12% | 82% | 90% |
Source: Company data, Morgan Stanley Research (e) estimates M Asia Pacific Insight Source: NVIDIA
Ex ibit 21: Spectrum-X CPO Switch
Ex ibit 22: Quantum-X CPO Switch
Source: NVIDIA
When we could turn more constructive on FOCI: Our qual-weight rating reflects our view on switch-CPO FAUs between now and 2027, where we think FOCI's share and margins will come under pressure. We note that optical I/O is a different and potentially larger opportunity, and any positive signs on this could lead us to revisit our rating.
Why could FOCI be better placed in OIO than in switches? FOCI was positioned early. At its November 2025 investor conference it showed a co-packaged optics architecture for multi-chip modules combining an XPU with HBM, and it lists MCM/OIO co-packaged optics among products advancing with customers from 4Q26.
Reworkability also carries more weight in OIO. A failed fiber interface on a GPU package destroys far more value than one on a switch package. FOCI's reflow-compatible, reworkable ReLFACon design addresses that risk directly, so it may count for more with accelerator customers than with switch customers.
For Optical I/O or optical engine on interposer adoption plans, we see NVIDIA exploring multiple solutions for the next-generation Feyman and Feyman Ultra's platform, but whether this is introduced or not will still take time. For other solutions, we see AMD targeting a scale-up CPO version for its MI550 or MI650 rack system in 2027/2028, based on its development progress. We also see ASIC vendors exploring CPO on GPU.
FOCI's plans for capacity
In its public offering disclosure early this year for the S O, FOCI disclosed its projected revenue and profitability for the NT$1.538bn in capex. The company completed its S O plan in early February, with total acquired capital of NT$3.1bn. However, we believe the capacity is far from enough to meet the whole industry demand. We therefore see potential for FOCI to announce another fund raising by the end of this year or early 2027 to expand capacity further after the recent small FAU production sample passed customers' qualification.
M Asia Pacific Insight
Ex ibit 23: FOCI's projected revenue and profitability from NT$1 538bn in capex
| Year (NT$mn) | 2026 | 2027 | 2028 |
|---|---|---|---|
| Sales Revenue | 518 | 2,398 | 3,980 |
| Gross Profit | 198 | 906 | 1,598 |
| Gross margin | 38.2% | 37.8% | 40.1% |
| Operating Profit | 38 | 483 | 1,012 |
| Operating margin | 7.3% | 20.1% | 25.4% |
Source: Company data, Morgan Stanley Research
Ex ibit 24: FOCI's SiPh Roadmap
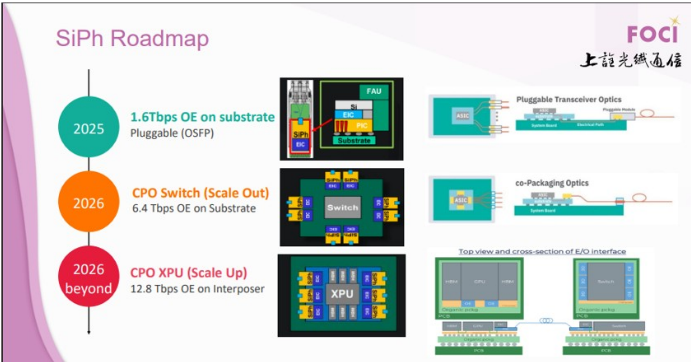
Source: FOCI
Ex ibit 25: FOCI's solutions for CPO
Source: FOCI
M Asia Pacific Insight
Ex ibit 26: ReLFACon enables direct transmission of external photonic signals with MCM modules to achieve reliable signal transmission
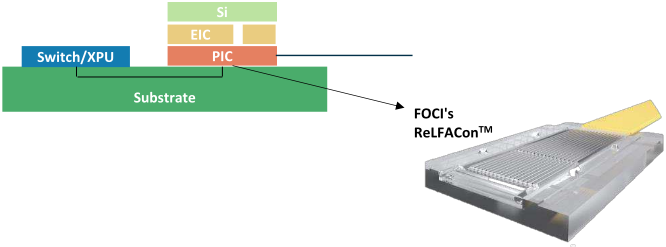
Source: FOCI
M Asia Pacific Insight
What a out China? Could NPO e the solution rather than CPO?
We expect near-packaged optics (NPO) to become the main optical interconnect in China's AI computing systems from 2027, ahead of co-packaged optics (CPO). Copper will keep the shortest links inside a server tray, and pluggable optics will remain in scale-out networks. For the scale-up links that join thousands of accelerators into one system, we think NPO is the option China can build, standardize, and maintain with its own supply chain.
The case rests on China's constraints. Domestic AI chips are weaker per chip than NVIDIA's, so Chinese system makers build much larger scale-up domains to compensate. Huawei's Atlas 960 SuperPoD connects up to 4,096 NPUs in one system, against 72 or 144 GPUs in an NVIDIA rack. Domains that span dozens of cabinets are beyond copper's reach and must be optical. CPO, the other highdensity optical option, depends on TSMC's co-packaging processes, which Chinese AI chipmakers cannot use. NPO keeps the optical engine as a separate, replaceable part on the board a few centimeters from the chip, so the chip can use domestic packaging and the engine can come from domestic optical suppliers.
Four ways to connect accelerators
AI systems connect accelerators in two layers. Scale-out networks link servers and racks through switches, usually with pluggable optical modules. Scale-up networks link accelerators into a single high-bandwidth domain so they can share memory and act as one machine. Scale-up is where the copper-versus-optics decision is being made.
Copper: lectrical links over cables or backplanes. Copper is cheap, reliable and lowlatency, but its reach falls as lane rates rise; at 200G per lane, links are limited to a few meters. Copper-based AI racks have to pack computing extremely tightly to stay within reach, which creates manufacturing, power-density and cooling problems, and copper cannot cover scale-up domains of more than about a 100 accelerators.
Pluggable optics, including LPO: Modules plug into the front panel of a switch or server. Conventional modules contain a DSP that re-times the signal; linear-drive pluggable optics (LPO) remove the DSP to cut power and latency. Huawei's current Atlas 950 SuperPoD uses LPO.
NPO: The optical engine moves off the front panel onto the main board, a few centimeters from the switch or computing chip, and plugs into a socket. Huawei's Hi-ON leaves about 5cm of copper between the computing package and the optics. Alibaba's module uses a standard LGA connector, so the engine can be tested on its own, screened for yield and replaced in the field.
CPO: The optical engine sits inside the chip package. CPO gives the best power and density, but the engine and the chip share a package, so yields are combined and a failed engine is hard to replace. NVIDIA's Spectrum-X Photonics switches, now in production, are M Asia Pacific Insight built on TSMC's COUP process with SoIC stacking.
Ex ibit 27: CPO evolution progress
Source: ASE
We compare copper-based interconnects, pluggable optical transceivers, near-package optics (NPO), and co-packaged optics (CPO) in xhibit 28. Copper is the mainstream option for short-reach scale-up connectivity, with passive cables offering low cost, low power consumption, and very low latency, while limited transmission distance constrains broader deployment.
Pluggable optical transceivers are the mainstream solution for scale-out networks, combining longer reach and straightforward maintenance with higher power consumption and signal latency.
NPO and CPO are emerging as alternatives for both applications, combining shorter electrical links and higher density with lower power consumption than the pluggable modules shown. NPO occupies an intermediate position, balancing higher lane speeds and density with relatively accessible maintenance. CPO offers the highest stated lane speeds and interconnection density, alongside the shortest electrical links, although its cost and maintenance requirements present greater challenges.
M Asia Pacific Insight
Ex ibit 28: Comparison of Copper and Optical Interconnect Architectures
| Copper / Electrical | Pluggable Optical Transceiver Module | NPO (Near Package Optics) | CPO (Co-package Optics) | |
|---|---|---|---|---|
| Speed limit (Gbps per lane) | 100Gbps (can reach 200Gbps by DAC) | 200Gbps | 200Gbps to 400Gbps | 400Gbps+ |
| Transmission distance | 1m to 2m | 500m to 10km | 100m to 2km | 100m to 2km |
| Electrical link length | 1-2m end-to-end for DAC | 150–250 mm | 30-100 mm | <15 mm |
| DSP integrated | No (DAC) / Yes (AEC) | Yes | No | No |
| Power consumption | Low (DAC) / Medium (AEC) | High | Low | Low |
| Ease of maintenance | High | High | Medium-High | Low |
| Signal latency | Very low (DAC) / Low (AEC) | High | Low-Medium | Low |
| Interconnection density | Low-Medium | Medium | High | Very high |
| Current cost | Low | Medium | High | Very high |
| Scale Out use case | N/A, distance limit | Mainstream | Emerging | Emerging |
| Scale Up use case | Mainstream | N/A, budget and power limit | Emerging | Emerging |
Source: Morgan Stanley Research
Why China is different
Weaker chips force larger scale-up domains
Huawei's Ascend 960DT offers roughly half the FP8 computing and a third of the FP4 computing of NVIDIA's B300, which NVIDIA cannot sell in China. Chinese system makers compensate for the lack of computing by connecting more chips. Huawei's Atlas 960 holds up to 4,096 NPUs in one SuperPoD. Huawei's simulation claims that a 100,000-NPU cluster built from 4,096-NPU SuperPoDs achieves 2.75 times the model FLOPs utilization of a cluster built from 8-NPU servers, because cross-server communication otherwise takes up more than 40% of training time. A 4,096-chip domain spread across dozens of cabinets cannot be wired with copper, so optics are a requirement for China's system design.
Weaker SerDes favor a shorter electrical path
LPO would work better when bandwidth needs are moderate and the host chip's SerDes are strong, while NPO is more suitable when bandwidth density is high or the chip's SerDes are not strong enough. Alibaba also says NPO lowers the SerDes performance required of the main chip compared with LPO. Chinese accelerators and switch chips are M Asia Pacific Insight built on less advanced processes than their US counterparts, so a shorter electrical channel directly eases one of their design limits.
CPO depends on packaging China cannot access
Production CPO today relies on TSMC's COUP optical engine process and advanced 3D stacking. Chinese AI chipmakers cannot use TSMC for advanced AI chips. NPO separates the optical engine from the ASIC package, so the ASIC can use domestic 2.5D packaging and the engine can be built on mature 2D processes. Alibaba's 3.2T NPO module, for example, flip-chips two 16-channel silicon photonics chips and linear driver/TIA chips onto an mSAP substrate using mature 2D packaging.
Serviceability matters more in very large systems
A 4,096-NPU system contains thousands of optical links. With CPO, a failed engine can take a switch or accelerator package out of service. With NPO, the engine can be swapped. Huawei says its Hi-ON design doubles fault-free operating time and lifts system availability to 99.8% compared with a pluggable-based design. Alibaba says its NPO switch supports module-level hot swapping, so a failure affects the smallest possible unit. Alibaba's team describes long-term stability and failure rates as the deciding factor for whether all-optical scale-up can be deployed at scale.
Who is deploying NPO?
Huawei: from LPO in the Atlas 950 to NPO in the Atlas 960E
Huawei's current Atlas 950 SuperPoD, shown at WAIC 2026, connects the 8 NPUs within each computing tray electrically, around 4,096 800G optical transceivers in the 1,024NPU system on display, about four per NPU, and described it as the first SuperPoD to use LPO, based on Huawei's 100G VCS L technology.
The Atlas 960 moves to NPO. Huawei's Hi-ON engine carries 7.2 Tb/s with a built-in light source and is, according to Huawei, the first NPO engine with an integrated light source to reach mass production. It integrates 36 transceiver channels and uses linear direct drive with no oDSP, which Huawei says cuts latency by about 90% and power use by about 66% against a conventional pluggable. Huawei says 5,500 Hi-ON engines replace the 48,000 800G modules a conventional design would need, cutting system power by more than 550kW. The bandwidth matches: 5,500 × 7.2 Tb/s is 39.6 Pb/s, against 38.4 Pb/s for 48,000 × 800G. The air-cooled version is due in 2Q27 and the liquid-cooled version in 3Q27, with the Ascend 960DT chip pulled forward to 1Q27.
M Asia Pacific Insight
Ex ibit 29: Huawei Ascend 950 SuperPod with a scale-up range to 8,192 chips
Source: Huawei
Ex ibit 30: Ascend 950 SuperPod still adpots 800G optical transceivers
Source: Huawei
Alibaba Cloud: NPO as the core of all-optical scale-up
Alibaba connects 512 accelerators through a single-layer CLOS network of optical links and eliminates high-speed copper inside the rack. Alibaba names LPO and NPO as the preferred optical options and says they reduce optical cost by 30-40%.
Alibaba has since powered up a 3.2T NPO module in the OIF package format, measuring 22.5mm × 35.1mm. It reports typical power of about 20W, a TD CQ (Transmitter and Dispersion ye Closure Quaternary) of 1.9dB and compliance with the I (Institute of lectrical and lectronics ngineers) 802.3bs DR4, so it can inter-operate with conventional DSP-based modules. The module is deployed in a switch built on four domestic 25.6T switch chips, giving 102.4T of capacity with a path to 409.6T. The switch has passed power-on and functional validation and is in long-term reliability testing. Alibaba is also working with other internet companies to set a 6.4T standard (UPO) through the ODCC (Open Data Center Committee).
At APSARA 2026, Alibaba introduced its NPO scale-up solution called AL64, which it said could link up to 1,024 NPUs through NPO networking.
M Asia Pacific Insight
Ex ibit 31: Panjiu AL64 adopts NPO to conduct scale-up networking
Source: Alibaba Source: Alibaba This report references U.S. Executive Order 14105 and/or entities that may be in scope of such order. U.S. persons may be prohibited from en a in in certain transactions or otherwise require certain other transactions be notified to the U.S. Department of Treasury. Readers are solely responsible for ensurin that their investment or trade activities are carried out in compliance with applicable laws.
Ex ibit 32: Alibaba showcased its NPO solutions at APSARA 2026
This report references export controls and/or entities that may be subject to export control restrictions. Readers are solely responsible for ensurin that their investment or trade activities are carried out in compliance with applicable laws.
M Asia Pacific Insight
Glo al Implications
Greater China Semiconductors covered by Charlie Chan)
ASE LEAP revenue may reach US$9bn in 2027 higher than the company's latest guidance of >US$7.5bn)
Our bottom-up analysis suggests that AS 's L AP revenue is likely to reach US$9bn in 2027, given strong demand from both oS (on substrate) outsourcing, CPU CoWoS needs, and new CPO demand, higher than company guidance of >US$7.5bn. The demand is mostly from oS outsourcing from TSMC. While AS remains the major oS supplier to NVIDIA GPU, our checks also indicate that the majority of Google TPU and AMD MI400 series is likely to be outsourced to AS , given TSMC's clean-room limitations. We think the dollar content per chip for oS at AS could range from US$100 to US$250 in 2026, depending on the material cost, chip size, and margin of each product. Our assumption of the oS outsourcing percentage from TSMC of major products is - NVIDIA almost 100%, TPU 70-90%, MI400 80%.
Meanwhile, our channel checks suggest that AMD's Venice CPU could go for full CoWoSlike packaging at AS Group (both AS and SPIL). The initial allocation could be more at SPIL given SPIL's better production capability. Then, the allocation could reach 50:50 between SPIL and AS . By assuming US$8k per CoWoS wafer cost at AS by comparing the pricing to TSMC CoWoS and that the chip per CoWoS wafer could be around 25-26 chips for Venice CPU, we expect the dollar content per Venice CPU to be slightly above US $300.
For CPO, we also expect AS to play a significant role in both packaging and testing. The whole process may include testing from insertion 3, insertion 4, SLT, optical engine mounted on the substrate, FAU attachment, etc. We assume the dollar content for the packaging could be around US$30 per O and could be more than double if it includes the testing process.
M Asia Pacific Insight
Ex ibit 33: Further breakdown of our ASE LEAP revenue forecasts
| 1Q25 | 2Q25 | 3Q25 | 4Q25 | 1Q26 | 2Q26e | 3Q26e | 4Q26e | 2025 | 2026e | 2027e | |
|---|---|---|---|---|---|---|---|---|---|---|---|
| Units (k) | |||||||||||
| Nvdia (Units k) | |||||||||||
| Blackwell with GDDR7 | - | - | 300 | 500 | 250 | 250 | 250 | 250 | 800 | 1,000 | |
| Blackwell with HBM | 1,000 | 1,100 | 1,400 | 1,500 | 1,500 | 1,500 | 1,600 | 300 | 5,000 | 4,900 | 560 |
| Rubin | 800 | 1,200 | 2,000 | 7,000 | |||||||
| Quantum-X (CPO) | 2,880 | ||||||||||
| Spectrum-X (CPO) | 300 | ||||||||||
| AMD (Units k) | |||||||||||
| MI400 Series (assuming 80% outsource from TSMC) | 24 | 120 | 240 | 384 | 1,000 | ||||||
| Venice CPU | 100 | 400 | 500 | 1,000 | 4,400 | ||||||
| Google (Units k) | |||||||||||
| TPU (assuming 70-90% outsource from TSMC) | 1,225 | 2,856 | 6,930 | ||||||||
| Others (Units k) | |||||||||||
| Vera CPU | 2,070 | 4,025 | |||||||||
| Maia, Trainium2/3, etc. | 120 | 200 | 400 | ||||||||
| Dollar content assumption per chip | |||||||||||
| Blackwell (oS) | 180 | 180 | 180 | 180 | 200 | 200 | 200 | 200 | 180 | 200 | 240 |
| Rubin (oS) | 230 | 230 | - | 230 | 276 | ||||||
| Quantum-X (CPO) | 120 | ||||||||||
| Spectrum-X (CPO) | 960 | ||||||||||
| MI400 Series (oS) | 230 | 230 | 230 | - | 230 | 276 | |||||
| Venice CPU (Full CoWoS) | 320 | 320 | 320 | - | 320 | 416 | |||||
| TPU (oS) | 150 | 150 | 180 | ||||||||
| Vera CPU (oS/CoWoS) | 200 | 200 | 200 | 200 | 240 | ||||||
| Others (oS/Full CoWoS) | 120 | 120 | 120 | 120 | 120 | 144 | |||||
| Advanced packaging revenue from each product (US$mn) | |||||||||||
| Blackwell (oS) | 180 | 198 | 306 | 360 | 350 | 350 | 370 | 110 | 1,044 | 1,180 | 134 |
| Rubin (oS) | 184 | 276 | - | 460 | 1,932 | ||||||
| Quantum-X (CPO) | 346 | ||||||||||
| Spectrum-X (CPO) | 288 | ||||||||||
| MI400 Series (oS) | 6 | 28 | 55 | - | 88 | 276 | |||||
| Venice CPU (Full CoWoS) | 32 | 128 | 160 | - | 320 | 1,830 | |||||
| TPU (oS) | 184 | 428 | 1,247 | ||||||||
| Vera CPU (oS) | 414 | 966 | |||||||||
| Others (oS/Full CoWoS) | 14 | 24 | 58 | ||||||||
| Total Revenue from oS outsource | 1,235 | 2,583 | 4,585 | ||||||||
| Total Revenue from full CoWoS-Like process Total Revenue from CPO packaging | 7 | 332 | 1,859 634 | ||||||||
| Total advanced packaging revenue (US$ mn) | 1,242 | 2,915 | 7,077 | ||||||||
| ASE LEAP revenue guidance | 1,600 | 3,700 | 7,500 | ||||||||
| % of ASE LEAP revenue guidance | 78% | 79% | 94% | ||||||||
| Wafer Sort Revenue (from ASE guidance/ 2027 MSe ) | 400 | 800 | 2,000 | ||||||||
| Total MSe LEAP revenue (US$ mn) | 1,642 | 3,715 | 9,077 |
Source: Company data, Morgan Stanley Research e = Morgan Stanley Research estimates
Ex ibit 34: ASE LEAP revenue breakdown by customers
| 2025 | 2026e | 2027e | |
|---|---|---|---|
| Total MSe LEAP revenue (US$ bn) | 1.6 | 3.71 | 9.08 |
| ASE Guidance on LEAP revenue (US$ bn) | 1.6 | 3.70 | >7.5 |
| Nvidia Revenue | 1.3 | 2.1 | 3.7 |
| % of MSe LEAP Revenue | 78% | 57% | 41% |
| TPU Revenue | 0.3 | 0.5 | 1.6 |
| % of MSe LEAP Revenue | 16% | 14% | 18% |
| AMD Revenue | 0.1 | 0.6 | 2.5 |
| % of MSe LEAP Revenue | 4% | 15% | 28% |
Source: Morgan Stanley Research e = Morgan Stanley Research estimates
KYEC also benefits from strong GPU/TPU/CPU demand
In our earlier GUC report, we mentioned that demand for Google CPUs is very strong. We now forecast Google CPU shipments of 1.2-1.3mn units this year and around 4mn units in 2027 with around 3mn units of Axion2 and 1mn units of Axion3. Per our published forecast, the Axion3 FT time could also double from Axion2 to around 600 seconds given two computing dies and larger chip size.
Our checks also indicate that this Google CPU requests burn-in and SLT (system-level testing), which we believe could generate 1-2% of KY C 2026 revenue and 5-10% of 2027e. To sum up, we now forecast that Google-related demand could account for 10-15%
M Asia Pacific Insight
of KY C's 2027 total revenue, including TPU, CPU, FT, and part of the CP.
Although our checks suggest that R-series XPU final test time might ramp from 800-900 seconds, not much higher than the prior generation, the test still may recover when KY C has more capacity. We also break down the CPU demand from the major customer, including G-series and V-Series CPU. We expect sharp testing time improvement from c. 300 seconds to c. 700 seconds - CPU design and chip size are both getting more complicated as generation/geometry migrates for heavier AI inferencing and orchestration workload. Those CPUs also require burn-in for better performance.
Overall, we expect that B-series XPU could maintain momentum in 3Q26 despite the ramp-up of R-series. Combined with new products like 3nm TPU and 2nm smartphone SoC from MediaTek, we forecast revenue growth for KY C of 10-15% QoQ in 4Q26. Overall revenue from the largest customer should be more than 40% of KY C's total revenue in 2026. Overall, we forecast AI-related offerings to still contribute 25-30% to KY C's revenue in 2025, >35% in 2026, and >45% in 2027 (including TPU and chip probing).
Ex ibit 35: KYEC: Testing revenue (excluding wafer sort) from major customers
| 1Q25 | 2Q25 | 3Q25 | 4Q25 | 1Q26 | 2Q26e | 3Q26e | 4Q26e | 2025 2026e | 2027e | |
|---|---|---|---|---|---|---|---|---|---|---|
| Units (k) | ||||||||||
| H-series | 650 | 200 | 250 | 500 | 400 | 400 | 600 | 600 | 1,600 2,000 | |
| B-series with GDDR7 | - | - | 300 | 500 | 250 | 250 | 250 | 250 | 800 1,000 | |
| B-series with HBM | 1,000 | 1,100 | 1,400 | 1,500 | 1,500 | 1,500 | 1,600 | 300 | 5,000 4,900 | 560 |
| R-series | 800 | 1,200 | 2,000 | 6,500 | ||||||
| G-series CPU | 1,100 2,450 | 250 | ||||||||
| V-series CPU | 2,500 | 5,750 | ||||||||
| Google TPU | 1,750 3,680 | 4,500 | ||||||||
| Google CPU | 1,200 | 4,000 | ||||||||
| Test time | ||||||||||
| Per chip test time (seconds) | ||||||||||
| H-series test time | 350 | 350 | 350 | 350 | 350 | 350 | 350 | 350 | 350 350 | 350 |
| B-series with GDDR7 test time | 350 | 350 | 350 | 350 | 350 | 350 | 350 350 | 350 | ||
| B-series with HBM test time | 700 | 750 | 900 | 1,000 | 1,000 | 1,000 | 850 | 850 | 1,000 850 | 850 |
| R-series test time | 850 | 850 | 850 | 1,275 | ||||||
| G-series CPU test time | 300 300 | 300 | ||||||||
| V-series CPU test time | 700 | 700 | ||||||||
| Google TPU blended test time | 186 340 | 450 | ||||||||
| Google CPU test time | 300 | 400 | ||||||||
| Total test demand (k hrs) | ||||||||||
| H-series | 63 | 19 | 24 | 49 | 39 | 39 | 58 | 58 | 156 194 | - |
| B-series with GDDR7 | 29 | 49 | 24 | 24 | 24 | 24 | 78 97 | - | ||
| B-series with HBM | 194 | 229 | 350 | 417 | 417 | 417 | 378 | 71 | 1,190 1,282 | 132 |
| R-series | - | - | 189 | 283 | 472 | 2,302 | ||||
| G-series CPU | 92 204 | 21 | ||||||||
| V-series CPU | 486 | 1,118 | ||||||||
| Google TPU | 90 348 | 563 | ||||||||
| 100 | 444 | |||||||||
| CPU | ||||||||||
| Test hour rate (for the largest customer including burn-in) | 170 | 170 | 170 | 170 | 170 | 170 | 180 | 190 | 170 178 | 200 |
| Test hour rate (for TPU with self-bought testers) | 200 250 | 280 | ||||||||
| Largest customer's AI revenue to KYEC (US$ mn) | 43.8 | 42.3 | 68.6 | 87.4 | 81.6 | 81.6 | 116.9 | 83.0 | 257.6 485.5 | 714.6 |
| % of KYEC MSe Revenue (quarterly figures without CPU) TPU revenue to KYEC (US$ mn) | 19% | 15% | 23% | 27% | 25% | 23% | 30% | 18% | 23% 32% 18.1 86.9 | 33% 157.5 |
| % of KYEC MSe Revenue | 1.6% 5.7% | |||||||||
| 7.3% | ||||||||||
| Google CPU revenue to KYEC (US$ mn) | 25.0 | 124.4 | ||||||||
| % of KYEC MSe Revenue | 1.6% | 5.7% |
Source: Company data, Morgan Stanley Research e = Morgan Stanley Research estimates
WIN Semi could benefit from PD growth and potential outsource of the LD by late 2027; upgrade from UW to EW
In our previous WIN Semi report, we noted that Lumentum (LIT .O, covered by Meta Marshall) is unlikely to outsource CW lasers or ML to WIN Semi, which was the main thesis for our UW rating. However, our recent checks suggest that WIN Semi and its largest customer (Broadcom) have secured InP substrate and could show substantial growth for the PD (photo diode) business in 2H26, which could account for >10% of WIN Semi's total revenue. Our recent checks also suggest that Broadcom could outsource LD
M Asia Pacific Insight
(laser diode) production to WIN Semi given insufficient internal capacity. Our checks indicate that Broadcom could be one of the top four suppliers for Nvidia's CPO laser diode (Lumentum and Coherent are two of the others).
We also see WIN Semi with even stronger revenue growth from its aerospace business into 2027, especially from the ground station and satellite business. With SpaceX's (SPCX; covered by Adam Jonas) launch of its Starship and Starlink V3 satellite, we expect the content value per satellite for WIN Semi to increase largely from Starlink v2 to v3, as well as future DTD (direct to device) satellites. The content improvement comes not just only from the RF chips volume increase, but also the material migration from GaAs to GaN, of which the 4-inch GaN ASP could be US$9k from our industry checks (vs. 6-inch GaAs of around US$2.5-3k). We therefore upgrade from UW to W.
Where we could be wrong with our WIN Semi EW call: We think the largest swing factor for WIN Semi in the near term would be the aerospace business, which we think is relatively hard to track given the satellite launch could always come with certain possibility of a delay or failure. However, on September 28, 2026, SpaceX successfully launched the Starship with Starlink V3 satellite. If SpaceX decides to speed up the satellite constellation, there also might be upside to our forecast.
Ex ibit 36: WIN Semi's Aerospace revenue projection
| 2025 | 2026e | 2027e | 2028e | |
|---|---|---|---|---|
| WIN Semi Total Revenue (MSe, NT$mn) | 16,639 | 21,499 | 28,255 | 40,029 |
| Infra to total revenue | 33% | 30% | 38% | 35% |
| Aerospace to Infra | 30% | 35% | 38% | 40% |
| Aerospace to total revenue | 10% | 11% | 15% | 14% |
| Aerospace Revenue (MSe, NT$mn) | 1,625 | 2,283 | 4,127 | 5,589 |
| Ground station | 650 | 975 | 1,462 | 2,194 |
| Satellite | 543 | 789 | 2,043 | 2,649 |
| Others | 432 | 518 | 622 | 746 |
| New Launched Satellite (units) | ||||
| v0.9/1 | - | - | - | - |
| v1.5 | - | - | - | - |
| v2.0 Mini | 2,912 | 3,058 | - | - |
| v3.0 (and Future Broadband Generations) | - | 75 | 905 | 2,020 |
| Mobile Gen 1 (DTD) | 286 | - | - | - |
| Mobile Gen 2 (and Future Generations) | - | - | 480 | 520 |
| Content Value to WIN Semi (per satellite; US$k) | ||||
| v0.9/1 | NA | NA | NA | NA |
| v1.5 | NA | NA | NA | NA |
| v2.0 Mini | 5 | 5 | 5 | 5 |
| v3.0 (and Future Broadband Generations) | 35 | 35 | 35 | 40 |
| Mobile Gen 1 (DTD) | 10 | 10 | 10 | 10 |
| Mobile Gen 2 (and Future Generations) | 50 | 50 | 50 | 50 |
| Total Revenue to WIN Semi (per satellite; NT$mn) | ||||
| v0.9/1 | NA | NA | NA | NA |
| v1.5 | NA | NA | NA | NA |
| v2.0 Mini | 456 | 379 | - | - |
| v3.0 (and Future Broadband Generations) | 16 | 261 | 1,287 | 2,004 |
| Mobile Gen 1 (DTD) | 71 | - | - | - |
| Mobile Gen 2 (and Future Generations) | - | 149 | 756 | 645 |
| Total Revenue to WIN Semi (from satellite) | 543 | 789 | 2,043 | 2,649 |
Source: Morgan Stanley Research estimates M Asia Pacific Insight Source: Company data, Morgan Stanley Research e = Morgan Stanley Research estimates
Ex ibit 37: Projection of SpaceX's Numbers of Satellite
Greater China Hardware covered by Derrick Yang)
Chroma 2360.TW): Multiple drivers from the AI-related testing and metrology market
Dominant in GPU SLT and stepping into FT handlers
Chroma has been the dominant supplier of SLT tools in the HPC market. It has been the sole supplier to NVIDIA's GPUs, and it is seeing more interest from HPC vendors in SLT for their CPU and accelerators.
Besides expanding demand for GPU and accelerators in AI deployment, Chroma's SLT business should also benefit from ever-increasing power density from those advanced chips as the test equipment specs also need to be upgraded. We estimate that the SLT business will account for ~20% of Chroma's total revenue in 2026.
In the HPC testing market, Chroma used to focus more on SLT, but it has decided to leverage its existing expertise and customer relationships to penetrate the final test handler market, which we believe represents an even bigger market opportunity than SLT. Moreover, it will penetrate the market for burn-in ovens for HPC in the coming quarters.
M Asia Pacific Insight
Ex ibit 38: SLT and FT equipment offerings from Chroma
Source: Chroma
Fast-growing metrology business amid advanced packaging capacity expansion
In 2025, Chroma started to supply metrology equipment that is used in the probe mark, RDL and TSV structures in the advanced packaging process, with its customer base including foundry and OSAT players.
Chroma's metrology equipment employs white light interferometry technology. The basic working principle is to have white light emitted on the reference mirror and the sample, which is placed at the same distance from the light source. The reflected beams from the reference mirror and sample surface are then received by a light sensor.
Interference occurs when two light beams collide, which could cause them to either strengthen or weaken, depending on the phase of the two light beams. Thus, by measuring the intensity of the combined light beams, the distance between the light sensor and multiple points on the target surface can be calculated through an algorithm. This can then be used to measure the dimensions of the structure or the alignment of layers.
This business should continue to grow along with the capacity expansion for different advanced packaging architectures, e.g., CoWoS, wafer-level multi-chip module (WMCM), CoPoS. We estimate that metrology will account for mid single digit % of Chroma's total revenue in 2026.
M Asia Pacific Insight
Ex ibit 39: Concept of light interference
Source: Keyence
Ex ibit 40: Setup of interferometer
Source: Wikipedia
Ex ibit 41:
Metrology equipment offerings from Chroma
Advanced Packaging – 2D/3D Wafer Metrology Systems
Chroma
Source: Chroma
Emerging contribution from CPO testing equipment
For CPO testing equipment, Chroma can leverage its accumulated experience and technology in electrical IC and photonics IC testing. It has already been qualified for insertion 3 and insertion 4o testing tools. We think Chroma should ship some tools in 2H26 for the pilot line and it has already received the first batch of orders for the MP line for shipment in 2027.
We estimate that photonics testing equipment will account for 7% of its total revenue in 2026, and the contribution could be higher if CPO continues to penetrate more data center interconnects.
M Asia Pacific Insight
Ex ibit 42: CPO testing equipment offerings from Chroma
CPO Test Solutions
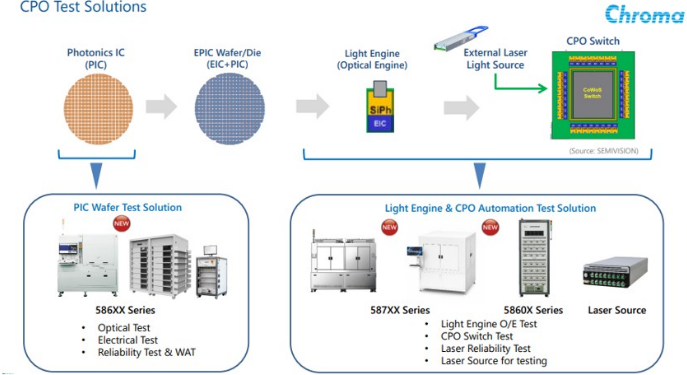
Source: Chroma
Greater China Hardware covered by Andy Meng)
Largan 3008.TW): CPO/FAU opportunity continues to progress
We remain positive on Largan's CPO/FAU opportunity given the company's strong track record in high-precision manufacturing relative to most Taiwanese peers. For our FAU assumptions, we assume an ASP of US$100 and expect Largan's market share to increase from 5% in 2027 to 40% in 2028, with net margins of 10% and 30%, respectively. This implies FAU earnings contribution of approximately US$4mn in 2027 and US$579mn in 2028. In its recent 3Q26 results call, Largan indicated that its first FA project has passed customer verification and that it is expanding from FA into FAU, including coupling and potential FAU-to-carrier assembly, with a dedicated new facility expected to support mass production from around mid-2027, reinforcing our long-term positive view on the company's FAU/CPO opportunities.
Genius 3406.TW): CPO/FAU component opportunity
We expect Genius to participate primarily in FAU components rather than the overall FAU solutions. Accordingly, we assume that its addressable component TAM represents approximately 15% of total FAU TAM. We assume Genius's market share increases from 5% in 2027 to 30% in 2028, with net margins of 10% and 25%, respectively, implying FAU component earnings contribution of approximately US$1mn in 2027 and US$54mn in 2028.
Japan - Semiconductors covered by Suzune Tamura)
Advantest 6857.T): ATE growth to outpace the broader SPE market; reiterating Top Pick and OW
Advantest has expressed confidence in its strong positioning in CPO testing. The company expects its CPO-related revenue to double in 2027 and more than double again in 2028.
M Asia Pacific Insight
Its competitor Teradyne (covered by Shane Brett) expects the CPO-related tester TAM to grow from $100mn in 2026 to $300-700mn in 2028, and further to $1bn by 2030, as CPO adoption broadens across scale-up applications in AI computing clusters. Based on Advantest's outlook as of the June quarter, the SoC tester TAM is expected to reach around $11bn in 2026, suggesting that the CPO tester market remains relatively small for now. ven without CPO, we believe the AT market can outgrow the broader SP market over the next few years, supported by increasing volumes of AI ASICs and CPUs, as well as higher test intensity across GPUs, ASICs and CPUs. Once scale-up demand ramps, we expect CPO to emerge as the next growth driver for AT demand.
Advantest's V93000 has a very large installed base across foundries and OSATs. We believe Advantest's competitive advantage lies in the ability of customers and the broader supply-chain ecosystem to extend the existing V93k platform to CPO testing. Fabless customers are already familiar with the V93k platform, including functionality, programming environment and workflows, whereas adopting a different platform would require them to develop entirely new test programs. From a production-site perspective, investment risk can also be reduced by deploying CPO testing capabilities on the existing V93k platform, as customers retain the flexibility to repurpose the platform for testing other devices if needed.
M Asia Pacific Insight
Allring: Estimate Revisions and Quarterly Financials
We li t our EPS estimates 21% or 2026, 21% or 2027, and 27% or 2028: Our 2026 revenue and PS estimate changes mostly reflect better-than-expected 2Q26 performance and non-op gain. We lift our 2027 and 2028 revenue estimates to reflect ongoing advanced packaging capacity opportunities, including oS capacity expansion for Xintec (3374.TWO; Not Covered), for which we now expect 10kwpm by 2027 and 40kwpm by 2028. We expect the content value per kwpm of oS build could be similar to TSMC of NT$130mn given the same equipment used. Besides, we also bake in some contribution from a US customer, which could start in 2027.
Ex ibit 43: AllRing: Estimate revisions
| NTD mn | New '2026 | Old '2026E | Diff. | New '2027e | Old '2027E | Diff. | New '2028e | Old '2028E | Diff. |
|---|---|---|---|---|---|---|---|---|---|
| Net sales | 10,055 | 9,405 | 7% | 18,000 | 14,955 | 20% | 20,600 | 16,655 | 24% |
| Gross profit | 5,282 | 4,877 | 8% | 9,350 | 7,766 | 20% | 10,824 | 8,749 | 24% |
| Operating profit | 3,281 | 2,739 | 20% | 5,312 | 4,385 | 21% | 6,315 | 4,944 | 28% |
| Pretax Income | 3,547 | 2,930 | 21% | 5,576 | 4,561 | 22% | 6,579 | 5,145 | 28% |
| Net income | 3,002 | 2,454 | 22% | 4,684 | 3,831 | 22% | 5,526 | 4,322 | 28% |
| EPS for consensus | 30.89 | 25.48 | 21% | 48.14 | 39.79 | 21% | 56.81 | 44.89 | 27% |
| Margins | |||||||||
| Gross margin | 52.5% | 51.9% | 51.9% | 51.9% | 52.5% | 52.5% | |||
| Operating margin | 32.6% | 29.1% | 29.5% | 29.3% | 30.7% | 29.7% | |||
| Pretax margin | 35.3% | 31.2% | 31.0% | 30.5% | 31.9% | 30.9% | |||
| Net margin | 29.9% | 26.1% | 26.0% | 25.6% | 26.8% | 25.9% | |||
| Opex % | 19.9% | 22.7% | 22.4% | 22.6% | 21.9% | 22.8% |
Source: Morgan Stanley Research (e) estimates
Ex ibit 44: AllRing: Quarterly financials
| (NT$ mn) | 1Q26 | 2Q26 | 3Q26E | 4Q26E | 1Q27E | 2Q27E | 3Q27E | 4Q27E | 2024 | 2025E | 2026E | 2027E | 2028E |
|---|---|---|---|---|---|---|---|---|---|---|---|---|---|
| Total revenues | 1,411 | 2,355 | 3,203 | 3,086 | 3,272 | 4,085 | 4,950 | 5,694 | 5,535 | 5,366 | 10,055 | 18,000 | 20,600 |
| Q/Q Change | 59% | 67% | 36% | -4% | 6% | 25% | 21% | 15% | 359% | -3% | 87% | 79% | 14% |
| Y/Y Change | 13% | 55% | 88% | 248% | 132% | 73% | 55% | 84% | 359% | -3% | 87% | 79% | 14% |
| Cost of Sales | 681 | 1,065 | 1,541 | 1,486 | 1,573 | 1,963 | 2,379 | 2,736 | 2,818 | 2,453 | 4,773 | 8,650 | 9,776 |
| Percent of Revenues | 48% | 45% | 48% | 48% | 48% | 48% | 48% | 48% | 51% | 46% | 47% | 48% | 47% |
| Gross Profit | 731 | 1,290 | 1,661 | 1,601 | 1,699 | 2,122 | 2,571 | 2,958 | 2,717 | 2,913 | 5,282 | 9,350 | 10,824 |
| Gross Margin | 52% | 55% | 52% | 52% | 52% | 52% | 52% | 52% | 49% | 54% | 53% | 52% | 53% |
| Total Opex | 403 | 507 | 552 | 539 | 923 | 931 | 1,043 | 1,140 | 1,284 | 1,304 | 2,001 | 4,038 | 4,509 |
| Percent of Revenues | 29% | 22% | 17% | 17% | 28% | 23% | 21% | 20% | 23% | 24% | 20% | 22% | 22% |
| R&D | 192 | 265 | 210 | 210 | 400 | 400 | 400 | 400 | 775 | 767 | 877 | 1,600 | 1,625 |
| Percent of Revenues | 14% | 11% | 7% | 7% | 12% | 10% | 8% | 7% | 14% | 14% | 9% | 9% | 8% |
| General & Adm Exp. | 112 | 110 | 150 | 144 | 262 | 327 | 396 | 455 | 276 | 275 | 516 | 1,440 | 1,648 |
| Percent of Revenues | 8% | 5% | 5% | 5% | 8% | 8% | 8% | 8% | 5% | 5% | 5% | 8% | 8% |
| Selling Expenses | 99 | 132 | 192 | 185 | 262 | 204 | 247 | 285 | 233 | 262 | 608 | 998 | 1,236 |
| Percent of Revenues | 7% | 6% | 6% | 6% | 8% | 5% | 5% | 5% | 4% | 5% | 6% | 6% | 6% |
| Operating Income | 327 | 783 | 1,109 | 1,061 | 775 | 1,191 | 1,528 | 1,818 | 1,433 | 1,610 | 3,281 | 5,312 | 6,315 |
| Operating Margin | 23% | 33% | 35% | 34% | 24% | 29% | 31% | 32% | 26% | 30% | 33% | 30% | 31% |
| Total Non-operating Income | (loss -60 | -174 | -16 | -16 | -66 | -66 | -66 | -66 | -133 | -12 | -14 | -14 | 0 |
| Profit Before Taxes | 387 | 957 | 1,126 | 1,077 | 841 | 1,257 | 1,594 | 1,884 | 1,566 | 1,813 | 3,547 | 5,576 | 6,579 |
| Percent of Revenues | 27% | 41% | 35% | 35% | 26% | 31% | 32% | 33% | 28% | 34% | 35% | 31% | 32% |
| Taxes | 67 | 141 | 180 | 172 | 135 | 201 | 255 | 301 | 255 | 316 | 561 | 892 | 1,053 |
| Tax Rate | 17% | 15% | 16% | 16% | 16% | 16% | 16% | 16% | 16% | 17% | 16% | 16% | 16% |
| Total Net Income to Parent | 325 | 827 | 945 | 905 | 707 | 1,056 | 1,339 | 1,582 | 1,311 | 1,485 | 3,002 | 4,684 | 5,526 |
| Percent of Revenues | 23% | 35% | 30% | 29% | 22% | 26% | 27% | 28% | 24% | 28% | 30% | 26% | 27% |
| EPS (NT$) | 3.37 | 8.50 | 9.72 | 9.30 | 7.27 | 10.85 | 13.76 | 16.27 | 15.25 | 15.46 | 30.89 | 48.14 | 56.81 |
| Change vs Year Ago | -6% | 104% | 123% | 177% | 116% | 28% | 42% | 75% | 794% | 1% | 100% | 56% | 18% |
| EPS for consensus (NT$) | 3.37 | 8.50 | 9.72 | 9.30 | 7.27 | 10.85 | 13.76 | 16.27 | 15.25 | 15.46 | 30.89 | 48.14 | 56.81 |
| Change vs Year Ago | -6% | 104% | 123% | 177% | 116% | 28% | 42% | 75% | 794% | 1% | 100% | 56% | 18% |
Source: Company data, Morgan Stanley Research (E) estimates
M Asia Pacific Insight
AllRing: Valuation Methodology
We raise our RI-based price target (base case scenario value) rom NT$1,580 to NT $2,000, reflecting our estimate changes for 2027 and 2028. Our key assumptions are unchanged, including a cost of equity (Co ) at 8%, derived from a risk-free rate of 2.0%, beta of 1.0 and market risk premium of 6%; intermediate growth rate of 16%; and terminal growth rate of 4.5%.
Ex ibit 45: AllRing: RI model
| NT$ million | 2026E | 2027E | 2028E | 2029E | 2030E | 2031E | 2032E | 2033E | 2034E | 2035E | 2036E | 2037E |
|---|---|---|---|---|---|---|---|---|---|---|---|---|
| Total Equity | 9,700 | 12,923 | 16,125 | 18,349 | 20,930 | 23,923 | 27,395 | 31,423 | 36,095 | 41,515 | 47,802 | 55,095 |
| Net Profit | 2,954 | 4,684 | 5,526 | 6,411 | 7,436 | 8,626 | 10,006 | 11,607 | 13,465 | 15,619 | 18,118 | 21,017 |
| ROAE | 34.4% | 41.4% | 38.1% | 37.2% | 37.9% | 38.5% | 39.0% | 39.5% | 39.9% | 40.2% | 40.6% | 40.9% |
| Residual Income | 1,975 | 3,240 | 3,883 | 4,707 | 5,480 | 6,376 | 7,416 | 8,621 | 10,019 | 11,641 | 13,522 | 15,703 |
| Spread | 26.4% | 33.4% | 30.1% | 29.2% | 29.9% | 30.5% | 31.0% | 31.5% | 31.9% | 32.2% | 32.6% | 32.9% |
| Ending Equity Capital | 9,700 | |||||||||||
| PV of Forecast Period | 45,636 | |||||||||||
| PV of Continuing Value | 138,737 | |||||||||||
| Equity Value | 194,073 | |||||||||||
| No. of Shares | 97 | |||||||||||
| Price Target | 2,000 |
Source: Company data, Morgan Stanley Research (E) estimates
Ex ibit 46: AllRing: NTM P/E
Source: Company data, FactSet, Morgan Stanley Research estimates
M Asia Pacific Insight
Risk Reward - AllRing Tech Co. (6187.TWO) Risk Reward - AllRing Tech Co. (6187.TWO)
CPO, SoIC, and CoPoS Help to Extend Revenue Momentum; OW
NT$2,000.00 PRICE TARGET
Base case, residual income model. Our key assumptions are:
- Cost of equity (CoE) of 8%, derived from a risk-free rate of 2.0%, beta of 1.0, and a market risk premium of 6.0%.
- Intermediate growth rate of 16%.
- Cash dividend payout of 65%
- Terminal growth rate of 4.5%.
Consensus Price Target Distribution
Source: Refinitiv, Morgan Stanley Research
RISK REWARD CHART
Key: Historical Stock Performance Current Stock Price Price Target
Source: Refinitiv, Morgan Stanley Research
BULL CASE
BASE CASE
OVERWEIGHT THESIS
- ▪NVIDIA's next-generation GPU Rubin will stick with graphene for heat sink attachment, reducing concerns about competition for Allring.
- ▪We expect AllRing to be a key beneficiary of the multi-year advanced packaging trend, including CoPoS and SoIC, but large-scale revenue contributions will likely take time.
- ▪It is the sole WoW (Wafer-on-Wafer) dispenser supplier for SoIC, which we expect to be the next growth driver, contributing at least 2% of total revenue in 2026 and 4% in 2027.
- ▪Our implied 2027e target P/E is 40x, similar to its SoIC peer and lower than CPO peers. We expect new advanced packaging opportunities including CPO, CoWoP, and CoPoS to benefit the company in the long run.
Consensus Rating Distribution
Source: Refinitiv, Morgan Stanley Research
Risk Reward Themes
Secular Growth:
Positive
Technology Diffusion: Positive
View descriptions of Risk Rewards Themes here
BEAR CASE
58x 2027e EPS
We assume: 1) 60% revenue CAGR over 2025-28, thanks to stronger-than-expected capacity expansion plans for TSMC's CoWoS, CPO and SoIC; 2) gross margin expands to more than 55% in 2025-28, due to strongerthan-expected operating leverage resulting from the equipment production outsourcing strategy; 3) new product launches exceed expectations and AllRing increases its market share in other processes such as "CoW. "
42x 2027e EPS
We expect: 1) 46% revenue CAGR in 202528e after strong CoWoS capacity expansion for TSMC in 2024-25; 2) gross margin to be maintained at 48-53% from 2024-28 thanks to high operating leverage resulting from the equipment production outsourcing strategy; and 3) with new equipment launches, we expect AllRing to expand its market share in other processes. CPO, SoIC and other applications continue to bear fruit.
16x 2027e EPS
We assume: 1) -30% revenue CAGR in 202428 due to slower-than-expected CoWoS capacity expansion plans by TSMC; 2) gross margin falls below 40% owing to the high bargaining power of its customers; 3) market share loss in "WoS" process amid rising peer competition.
NT$810.00
NT$2,780.00
NT$1,617.00
NT$2,000.00
M Asia Pacific Insight
Risk Reward - AllRing Tech Co. (6187.TWO)
KEY EARNINGS INPUTS
| Drivers | Dec 2025 | Dec 2026e | Dec 2027e | Dec 2028e |
|---|---|---|---|---|
| Semi revenue (NT$, mn) | 5,215 | 9,925 | 17,917 | 20,508 |
| Passive revenue (NT$, mn) | 52 | 65 | 43 | 47 |
INVESTMENT DRIVERS
- CoWoS capacity expansion from TSMC
- New technology migration such as SoIC and silicon photonics
- Strong operating leverage, given equipment production outsourcing strategy
GLOBAL REVENUE EXPOSURE
Source: Morgan Stanley Research Estimate View explanation of regional hierarchies here
MS ALPHA MODELS
3/5
MOST
3 Month
Horizon
Source: Refinitiv, FactSet, Morgan Stanley Research; 1 is the highest favored Quintile and 5 is the least favored Quintile
RISKS TO PT/RATING
RISKS TO UPSIDE
- Stronger-than-expected CoWoS capacity expansion
- Faster-than-expected adoption of silicon photonics
- Market share gains from peers, led by continuous R&D and China's localization trend
RISKS TO DOWNSIDE
- Slowdown in CoWoS capacity expansion
- Allring's "WoS" market share declining
- Slowdown in technology migration such as SoIC and silicon photonics adoption
OWNERSHIP POSITIONING
Inst. Owners, % Active
78.5%
Source: Refinitiv, Morgan Stanley Research
MS ESTIMATES VS. CONSENSUS
Source: Refinitiv, Morgan Stanley Research M Asia Pacific Insight
AllRing: Financial Summary
Income Statement
Cash Flow Statement
| NT$mn (Years End Dec ) | 2024 | 2025 | 2026E | 2027E | 2028E |
|---|---|---|---|---|---|
| Net sales | 5,535 | 5,366 | 10,055 | 18,000 | 20,600 |
| COGS | 2,818 | 2,453 | 4,773 | 8,650 | 9,776 |
| Gross profit | 2,717 | 2,913 | 5,282 | 9,350 | 10,824 |
| Operating expenses | 1,284 | 1,304 | 2,001 | 4,038 | 4,509 |
| Operating income | 1,433 | 1,610 | 3,281 | 5,312 | 6,315 |
| Non-operating income | (133) | (203) | (266) | (264) | (264) |
| Pre-tax income | 1,566 | 1,813 | 3,547 | 5,576 | 6,579 |
| Income tax | 255 | 316 | 561 | 892 | 1,053 |
| Minority Interest | 1,311 | 1,496 | 2,986 | 4,684 | 5,526 |
| Reported net Income | 1,311 | 1,485 | 3,002 | 4,684 | 5,526 |
| Adj.wtd.avg.shrs( m) | 90 | 96 | 97 | 97 | 97 |
| Reported EPS (NT$) | 15.25 | 15.46 | 30.89 | 48.14 | 56.81 |
| EPS for consensus (NT$) | 15.25 | 15.46 | 30.89 | 48.14 | 56.81 |
| NT$mn (Years End Dec ) | 2024 | 2025 | 2026E | 2027E | 2028E |
|---|---|---|---|---|---|
| Cashflow from Operations | 1,079 | 1,958 | 2,216 | 3,103 | 5,066 |
| Net profits | 1,311 | 1,485 | 3,002 | 4,684 | 5,526 |
| Depreciation | 47 | 59 | 59 | 59 | 59 |
| Working Capital Change | (130) | 476 | (854) | (1,649) | (529) |
| Other adjustments | (157) | (71) | 0 | 0 | 0 |
| Cashflow from Investing | (359) | (666) | (98) | (151) | (151) |
| Capex | (372) | (581) | (100) | (100) | (100) |
| Change of LT Investment | (36) | 36 | 0 | 0 | 0 |
| Other adjustments | 50 | (68) | (51) | (51) | (51) |
| Cashflow from financing | 1,851 | (645) | (743) | (1,501) | (2,342) |
| Increase in L/T debt | (563) | 49 | 0 | 0 | 0 |
| Increase in S/T debt | 0 | 0 | 0 | 0 | 0 |
| Cash Dividend Paid | (131) | (980) | (743) | (1,501) | (2,342) |
| Net change in cash | 2,601 | 646 | 1,358 | 1,451 | 2,573 |
Balance Sheet
| NT$mn (Years End Dec ) | 2024 | 2025 | 2026E | 2027E | 2028E |
|---|---|---|---|---|---|
| Cash | 3,536 | 4,182 | 5,540 | 6,991 | 9,564 |
| Mkt Securities | 0 | 53 | 0 | 0 | 0 |
| AR/NR | 1,552 | 806 | 1,905 | 3,411 | 3,903 |
| Inventory | 949 | 1,114 | 1,719 | 3,116 | 3,522 |
| Other | 293 | 180 | 180 | 180 | 180 |
| Current Assets | 6,330 | 6,335 | 9,345 | 13,698 | 17,169 |
| Long-term investments | 36 | 0 | 0 | 0 | 0 |
| Fixed assets | 1,298 | 1,879 | 1,979 | 2,079 | 2,179 |
| Deffered assets | 50 | 76 | 76 | 76 | 76 |
| Other assets | 1,056 | 1,288 | 1,288 | 1,288 | 1,288 |
| Total Assets | 8,796 | 9,609 | 12,719 | 17,172 | 20,743 |
| S/T borrowings | 0 | 0 | 0 | 0 | 0 |
| AP/NP | 888 | 564 | 1,358 | 2,461 | 2,781 |
| Other ST liabilities | 865 | 943 | 943 | 943 | 943 |
| LT debt | 290 | 339 | 339 | 339 | 339 |
| Other LT liabilities | 131 | 142 | 142 | 142 | 142 |
| Total Liabilities | 2,279 | 2,121 | 2,971 | 4,225 | 4,594 |
| Common shares | 969 | 971 | 971 | 971 | 971 |
| Additional capital | 2,919 | 3,017 | 3,017 | 3,017 | 3,017 |
| Retained earning | 2,347 | 2,941 | 5,200 | 8,383 | 11,567 |
| Other shareholders' equity | 282 | 559 | 559 | 576 | 593 |
| Total Equity | 6,517 | 7,488 | 9,747 | 12,947 | 16,149 |
| Total Liab. & Shrhldr's Equity | 8,796 | 9,609 | 12,719 | 17,172 | 20,743 |
| Financial Ratios | 2024 | 2025 | 2026E | 2027E | 2028E |
|---|---|---|---|---|---|
| Growth(%) | |||||
| Turnover | 359.2 | -3.0 | 87.4 | 79.0 | 14.4 |
| Operating profits | 1623.8 | 12.3 | 103.8 | 61.9 | 18.9 |
| Pretax profits | 873.5 | 15.8 | 95.7 | 57.2 | 18.0 |
| Net profits | 848.5 | 13.3 | 102.1 | 56.0 | 18.0 |
| EPS | 793.9 | 1.4 | 99.8 | 55.9 | 18.0 |
| Margins (%) | |||||
| Gross Margin | 49.1 | 54.3 | 52.5 | 51.9 | 52.5 |
| Operating Margin | 25.9 | 30.0 | 32.6 | 29.5 | 30.7 |
| Pretax Margin | 28.3 | 33.8 | 35.3 | 31.0 | 31.9 |
| Net Profit | 23.7 | 27.7 | 29.9 | 26.0 | 26.8 |
| Return (%) | |||||
| ROAE | 29.1 | 21.2 | 34.8 | 41.3 | 38.0 |
| ROAA | 19.7 | 16.1 | 26.9 | 31.3 | 29.2 |
| Gearing (%) | |||||
| Net Debt/Equity | (49.8) | (51.3) | (53.4) | (51.4) | (57.1) |
| Liabilities/Equity | 35.0 | 28.3 | 30.5 | 32.6 | 28.4 |
| Ratios (X) | |||||
| Current ratio | 3.6 | 4.2 | 4.1 | 4.0 | 4.6 |
| Quick ratio | 2.9 | 3.3 | 3.2 | 3.1 | 3.6 |
| Others | |||||
| AR/NR Turnover (days) | 180 | 69 | 69 | 69 | 69 |
| Inventory Turnover (days) | 563 | 131 | 131 | 131 | 131 |
| AP Turnover (days) | 337 | 104 | 104 | 104 | 104 |
| Cash Conversion (days) | 406 | 97 | 97 | 97 | 97 |
E = Morgan Stanley Research Estimates
Source: Morgan Stanley Research, Company Data M Asia Pacific Insight
FOCI: Estimate Revisions and Quarterly Financials
We narrow our loss estimate or 2026 but make signi icant cuts to 2027e and 2028e earnings: Weaker-than-expected 1Q26 and 2Q26 results were mainly due to ongoing capacity transition from the Hsinchu fab to the new fab in Thailand as the company prioritizes its SiPh/CPO development. The SiPh/CPO new capacity line will also take some time, and pre-mass production preparation such as destructive testing conducted could also affect its gross margin in 2026. Hence our 2026 earnings estimate is still a loss.
We make more significant cuts to our 2027-28 revenue and PS assumptions to reflect less CPO market share from its largest customer given fierce competition. We now expect 8-15% (vs. our previous expectation of 35%). Also, because we expect the company to continue expand the capacity, we see ongoing margin dilution from the new production ramp.
Ex ibit 47: FOCI: Estimate revisions
| NT$ mn | New '26E | Old '26E | Diff. | New '27E | Old '27E | Diff. | New '28E | Old '28E | Diff. |
|---|---|---|---|---|---|---|---|---|---|
| Net sales | 2,100 | 1,985 | 6% | 6,791 | 8,694 | -22% | 19,914 | 23,559 | -15% |
| Gross profit | 285 | 370 | -23% | 2,345 | 3,194 | -27% | 7,510 | 9,044 | -17% |
| Operating profit | (194) | (129) | 1,363 | 2,184 | -38% | 4,968 | 6,443 | -23% | |
| Pretax Income | (47) | (58) | 1,428 | 2,214 | -36% | 4,993 | 6,454 | -23% | |
| Net income | (39) | (45) | 1,157 | 1,794 | -36% | 4,044 | 5,228 | -23% | |
| Reported EPS (NT$) | (0.34) | (0.41) | 10.18 | 16.36 | -38% | 35.59 | 47.68 | -25% | |
| Margins | |||||||||
| Gross margin | 13.6% | 18.7% | 34.5% | 36.7% | 37.7% | 38.4% | |||
| Operating margin | -9.3% | -6.5% | 20.1% | 25.1% | 24.9% | 27.3% | |||
| Pretax margin | -2.2% | -2.9% | 21.0% | 25.5% | 25.1% | 27.4% | |||
| Net margin | -1.8% | -2.3% | 17.0% | 20.6% | 20.3% | 22.2% |
Source: Company data, Morgan Stanley Research (E) estimates
Ex ibit 48: FOCI: Quarterly financials
| NT$ in million # NT$ | 1Q26 0 NT$ 0 | 2Q26 NT$ 0 | 3Q26E NT$ 0 | 4Q26E NT$ 0 | 1Q27E NT$ 0 | 2Q27E NT$ 0 | 3Q27E NT$ 0 | 4Q27E NT$ 0 | 1Q28E NT$ 0 | 2Q28E NT$ 0 | 3Q28E NT$ 0 | 4Q28E NT$ 0 | 2024 NT$ 0 | 2025 NT$ 0 | 2026E NT$ 0 | 2027E NT$ 0 | 2028E NT$ 0 |
|---|---|---|---|---|---|---|---|---|---|---|---|---|---|---|---|---|---|
| Total Revenues Sequential Change | 382 -2.2% | 429 12.4% | 600 39.7% | 796 32.8% | 956 20.0% | 1,250 30.7% | 1,741 39.3% | 2,844 63.4% | 3,746 31.7% | 4,444 18.7% | 5,278 18.8% | 6,447 22.2% | 1,364 | 1,892 | 2,100 | 6,791 | 19,914 |
| Change vs Year Ago Cost of Sales | -6.7% 375 | -26.5% 428 | 18.1% 511 85% | 103.8% 611 | 150.3% 668 | 191.2% | 190.4% 1,143 | 257.1% 1,783 | 291.8% 2,377 | 255.6% 2,793 | 203.1% 3,281 | 126.7% 3,954 | 7.2% 1,185 | 38.7% 1,537 | 11.0% 1,815 | 223.4% 4,446 | 193.3% 12,404 |
| Percent of Revenues | 98% | 100% | 77% 185 | 70% | 852 68% | 66% | 63% | 63% | 63% | 62% | 61% | 87% | 81% | 86% | 65% | 62% | |
| Gross Profit Percent of Revenues Incremental Margin | 7 1.9% NM | 1 0.2% -13% | 88 14.7% 51% | 23.3% 49% | 288 30.1% 64% | 398 31.8% 37% | 598 34.3% 41% | 1,061 37.3% 42% | 1,369 36.5% 34% | 1,651 37.2% 40% | 1,997 37.8% 41% | 2,493 38.7% 42% | 179 13.1% 1% | 355 18.8% 33% | 285 13.6% -34% | 2,345 34.5% 44% | 7,510 37.7% 39% |
| Total Opex Percent of Revenues R&D Percent of Revenues | 163 42.8% 72 18.8% | 93 21.7% 45 | 105 17.5% 50 | 118 14.8% | 164 17.2% 100 | 229 18.3% 150 12.0% | 246 14.1% 150 8.6% | 343 12.0% | 436 11.6% | 547 12.3% 310 | 770 14.6% 460 | 790 12.2% | 273 20.0% 147 10.8% | 354 18.7% 212 | 479 22.8% 221 | 982 14.5% 600 8.8% | 2,542 12.8% |
| General & administrative Percent of Revenues | 73 19.1% | 10.4% 35 8.3% | 8.3% 37 6.3% | 55 6.9% 39 5.0% | 10.5% 50 | 60 | 70 | 200 7.0% 100 | 260 6.9% 120 | 7.0% 170 | 8.7% | 460 7.1% 220 | 96 | 11.2% 110 | 10.5% 185 8.8% | 1,490 7.5% | |
| 19 | 13 3.0% | 18 3.0% | 24 3.0% | 5.2% 14 1.5% | 4.8% 19 | 4.0% 26 | 3.5% | 3.2% 56 | 3.8% 67 | 220 4.2% | 3.4% 110 | 7.1% 29 2.2% | 5.8% 32 1.7% | 73 3.5% | 280 4.1% | 730 3.7% | |
| Selling & marketing Percent of Revenues | 4.9% | (92) | (17) -2.8% | 67 | 124 12.9% | 1.5% | 1.5% | 43 1.5% | 1.5% | 1.5% | 90 1.7% | 1.7% | (93) | 0 0.0% | (194) | 102 1.5% | 322 1.6% |
| Income | (156) | n.a. | n.a. | 169 | 352 | 932 | 1,105 24.9% | 1,227 | 1,704 26.4% | -6.8% | -9.3% | 1,363 | |||||
| Operating Percent of Revenues | -40.9% n.a. | -21.4% n.a. | 8.5% n.a. | 13.5% n.a. | 20.2% n.a. | 719 | 24.9% | n.a. | n.a. | n.a. | n.a. | n.a. | 20.1% n.a. | 4,968 24.9% | |||
| Change vs Year Ago | 22 | 64 | 31 | 31 | 16 | 25.3% n.a. | n.a. 6 | 6 | 23.2% n.a. | 6 | 37 | 22 | 148 | 65 | n.a. | ||
| Total Non-operating Income(Loss) | (135) | (28) -7% | 14 | 99 | 140 | 16 | 16 | 16 | 6 1,233 | -4% | 23 1% | (47) | 25 | ||||
| Profit Before Taxes Percent of Revenues | -35% | 2% | 12% | 15% | 185 | 368 21% | 735 26% | 939 25% | 1,111 25% | 23% | 1,710 27% | (57) | -2% | 1,428 21% | 4,993 25% | ||
| Taxes | (28) | (3) 11.2% | 3 | 20 | 15% | 70 | 140 | 178 | 211 19.0% | 325 | (8) | 7 | (8) | 271 | 949 | ||
| Tax Rate | 20.5% | 20.0% | 20.0% | 27 | 35 | 19.0% | 19.0% | 234 19.0% | 19.0% | ||||||||
| Reported Income (TW Percent of Revenues | (107) | (25) -6% | 11 2% | 79 | 19.0% | 19.0% | 19.0% | 900 | 999 19% | 1,385 | 14.6% | 29.0% | 17.3% | 19.0% | 19.0% | ||
| GAAP) | -28% | 150 | 760 | 20% | 21% | (48) -4% | 16 1% | (39) | 1,157 17% | 4,044 | |||||||
| 113 | 12% | 298 | 595 | 20% | -2% | 20% | |||||||||||
| Change vs Year Ago | 0% | 12% | 17% | 21% | NM | ||||||||||||
| 0% | |||||||||||||||||
| 10% | 0% | 0% | 0% | 0% | 0% | 0% | NM | NM | NM | 250% | |||||||
| 0% | 0.10 | 0% 0.69 | 1.32 | 2.62 | 5.24 | 6.69 | 7.92 | 8.79 | 12.19 | (0.34) | |||||||
| Reported EPS (NT$, TW | 0% | 0% | 35.59 | ||||||||||||||
| GAAP) Change vs Year Ago | (0.98) -9215% | (0.22) -237% | -49% | -422% | 1.00 n.a. | n.a. | 2497% | 655% | 571% | 499% | 235% | 133% | (0.47) NM | 0.16 NM | NM | 10.18 NM | 250% |
Source: Company data, Morgan Stanley Research (E) estimates M Asia Pacific Insight
FOCI: Valuation Methodology
Downgrade rom OW to EW but cut our price target (base case scenario value) only 3%, to NT$688: Largely offsetting the cuts to our 2027/2028 PS forecasts, we update the our beta assumption.
We keep our medium-term growth rate at 16%, in line with Asian optics peers (e.g., Landmark), to reflect rapid development in CPO and silicon-photonics technology. We also update the cost of equity from 12.9% to 11.6% (risk-free rate 2.0%, risk premium 6.9%, beta updated from 1.6 to 1.4 - last 52 weeks beta). We maintain our other assumptions: payout ratio of 61%, and terminal growth rate of 4%.
Our bull and bear case values also fall 3% each.
Ex ibit 49: FOCI: RI base
| NT$million | 2026E | 2027E | 2028E | 2029E | 2030E | 2031E | 2032E | 2033E | 2034E | 2035E | 2036E | 2037E |
|---|---|---|---|---|---|---|---|---|---|---|---|---|
| Total Equity | 2,427 | 3,471 | 7,380 | 9,494 | 11,947 | 14,790 | 18,087 | 21,910 | 26,343 | 31,482 | 37,442 | 44,352 |
| Net Profit | (39) | 1,157 | 4,044 | 4,690 | 5,438 | 6,305 | 7,310 | 8,476 | 9,828 | 11,396 | 13,214 | 15,321 |
| ROAE | NM | 39.2% | 74.5% | 55.6% | 50.7% | 47.2% | 44.5% | 42.4% | 40.7% | 39.4% | 38.3% | 37.5% |
| Residual Income | 671 | 2,185 | 3,246 | 3,715 | 4,250 | 4,863 | 5,570 | 7,044 | 9,174 | 10,626 | 12,308 | |
| Spread | 27.6% | 63.0% | 44.0% | 39.1% | 35.6% | 32.9% | 30.8% | 29.1% | 27.8% | 26.8% | 25.9% | |
| Ending Equity Capital | 2,427 | |||||||||||
| PV of Forecast Period | 24,546 | |||||||||||
| PV of Continuing Value | 50,480 | |||||||||||
| Equity Value | 77,453 | |||||||||||
| No. of Shares | 113 | |||||||||||
| Projected Price | 688 |
Source: Company data, Morgan Stanley Research (E) estimates
Ex ibit 51: FOCI: P/S
Ex ibit 50: FOCI: P/B
Source: Company data, Factset, Morgan Stanley Research estimates Source: Company data, Factset, Morgan Stanley Research estimates M Asia Pacific Insight
Risk Reward - FOCI Fi er Optic Communications Inc Risk Reward - FOCI Fiber Optic Communications Inc (3363.TWO)
(3363.TWO) FAU market is becoming crowded; EW
NT$688.00 PRICE TARGET
Base case, residual income model. Key assumptions: cost of equity of 11.6% (risk-free rate 2.0%, risk premium 6.9%, beta 1.4), a payout ratio of 61%, a medium-term growth rate of 16%, and a terminal growth rate of 4.0%.
RISK REWARD CHART
Source: Refinitiv, Morgan Stanley Research
BULL CASE
BASE CASE
EQUAL-WEIGHT THESIS
- ▪Co-packaged optics (CPO) are an advanced silicon photonics (SiPh) method that integrates optics and silicon on a single packaged substrate, to reduce signal loss, power consumption, and cost.
- ▪However, the FAU market is becoming crowded; We count at least 10 companies with CPO FAU products shipping, sampling or in pilot production.
- ▪Given its close partnership with TSMC, we think FOCI is still positioned to provide CPO's fiber array units (FAU) and related services, leveraging its ReLFACon technology.
- ▪At our price target, FOCI would trade at 68x 2027e P/E, but only 19x 2028e, which we think is fair for now.
Risk Reward Themes
Disruption:
Positive
Secular Growth:
Negative
Technology Diffusion: Positive
View descriptions of Risk Rewards Themes here
BEAR CASE
88x 2027e EPS
We assume: 1) 200% revenue CAGR, 202528e, from stronger-than-expected CPO development; 2) faster-than-expected CPO introduction; 3) gross margin improving to over 50% in 2027e thanks to scale effects and the company's technology competitiveness; and 4) >600% EPS CAGR, 2025-28e.
64x 2027e P/E
We project: 1) >120% revenue CAGR, 202528e, on fast CPO development; 2) gross margin improves to over 37% in 2028e thanks to scale effects and the company's technology competitiveness; 3) >500% EPS CAGR, 2025-28e.
31x 2027e P/E
We assume: 1) 50% revenue CAGR, 202327e, given slower-than-expected CPO development; 2) slower-than-expected CPO introduction; and 3) gross margin falling below 10% in 2027 due to the high bargaining power of customers.
NT$320.00
NT$895.00
NT$688.00
M Asia Pacific Insight
Risk Reward - FOCI Fiber Optic Communications Inc (3363.TWO)
KEY EARNINGS INPUTS
| Drivers | Dec 2025 | Dec 2026eDec | 2027eDec | 2028e |
|---|---|---|---|---|
| Revenue from computing segment (NT$, mn) | 1,198 | 1,325 | 1,594 | 1,764 |
| Revenue from communication segment (NT$, mn) | 326 | 270 | 417 | 452 |
| Revenue from battery segment (NT$, mn) | 109 | 473 | 4,745 | 17,655 |
INVESTMENT DRIVERS
- Silicon photonics and CPO
GLOBAL REVENUE EXPOSURE
Source: Morgan Stanley Research Estimate View explanation of regional hierarchies here
RISKS TO PT/RATING RISKS TO UPSIDE
- Faster-than-expected CPO introduction
- Increased geopolitical tensions
- Significant AI/cloud capex increase
RISKS TO DOWNSIDE
- Slower-than-expected CPO introduction
- Easing geopolitical tensions
- Significant AI/cloud capex cuts
OWNERSHIP POSITIONING
Inst. Owners, % Active
76.2%
Source: Refinitiv, Morgan Stanley Research
MS ESTIMATES VS. CONSENSUS
FY Dec 2026e
EPS (NT$)
Sales / Revenue (NT$, mn)
EBITDA
Note: There are not sufficient brokers supplying consensus data for this metric
Note: There are not sufficient brokers supplying consensus data for this metric
(NT$, mn) Note: There are not sufficient brokers supplying consensus data for this metric
Net income
(NT$, mn) Note: There are not sufficient brokers supplying consensus data for this metric
ROE
(1.5)
(%)
Note: There are not sufficient brokers supplying consensus data for this metric
Mean Morgan Stanley Estimates
Source: Refinitiv, Morgan Stanley Research M Asia Pacific Insight M Asia Pacific Insight
FOCI: Financial Summary
Ex ibit 52: FOCI: Financial Summary
Income Statement
Cash Flow Statement
(2,542) Working Capital Change
4,968 Other adjustments
114 Other adjustments
| NT$mn (Years End Dec ) | 2024 | 2025 | 2026E | 2027E | 2028E |
|---|---|---|---|---|---|
| Cashflow from Operations | 70 | (17) | 125 | 444 | 1,680 |
| Net profits | (48) | 16 | (39) | 1,157 | 4,044 |
| Depreciation | 100 | 107 | 161 | 241 | 362 |
| Working Capital Change | (71) | (154) | 2 | (954) | (2,727) |
| Other adjustments | 88 | 13 | 0 | 0 | 0 |
| Cashflow from Investing | 19 | (165) | (1,538) | (2,307) | (2,768) |
| Capex | (55) | (55) | (1,538) | (2,307) | (2,768) |
| Change of LT Investment | 170 | 43 | 0 | 0 | 0 |
| Change of ST Investment | 0 | 0 | 0 | 0 | 0 |
| Other adjustments | (95) | (153) | 0 | 0 | 0 |
| Cashflow from financing | 453 | 122 | 2,223 | 4,500 | 5,089 |
| Increase in L/T debt | 2 | (3) | 2,000 | 4,000 | 4,000 |
| Increase in S/T debt | 0 | 153 | 306 | 613 | 1,225 |
| Cash Dividend Paid | (49) | 0 | (83) | (113) | (136) |
| Issuance of stock | 522 | 0 | 0 | 0 | 0 |
| Other adjustments | (21) | (28) | 0 | 0 | 0 |
| Exchange rate adjustment | 15 | 3 | 0 | 0 | 0 |
| Net change in cash | 557 | -58 | 810 | 2,637 | 4,000 |
2,954 Financial Ratios
91 Growth(%)
0 Operating profits
21,533 Margins (%)
2,297 Gross Margin
1,595 Operating Margin
1,464 Gearing (%)
| 2024 | NT$ 2,025 | 2026E | 2027E | 2028E | |
|---|---|---|---|---|---|
| Growth(%) | |||||
| Turnover | 7.2 | 38.7 | 11.0 | 223.4 | 193.3 |
| Operating profits | 60.3 | -100.5 | -39953.9 | -800.9 | 264.4 |
| Pretax profits | -1091.4 | -140.4 | -304.1 | -3167.2 | 249.6 |
| Net profits | -500.3 | -133.5 | -337.8 | -3104.4 | 249.6 |
| EPS | -441.3 | -133.4 | -319.7 | -3078.0 | 249.6 |
| Margins (%) | |||||
| Gross Margin | 13.1 | 18.8 | 13.6 | 34.5 | 37.7 |
| Operating Margin | -6.8 | 0.0 | -9.3 | 20.1 | 24.9 |
| Pretax Margin | -4.1 | 1.2 | -2.2 | 21.0 | 25.1 |
| Net Profit | -3.5 | 0.9 | -1.8 | 17.0 | 20.3 |
| Return (%) | |||||
| ROAE | (2.1) | 0.6 | (1.5) | 39.2 | 74.5 |
| ROAA | (1.8) | 0.5 | (0.9) | 13.8 | 24.6 |
| Gearing (%) | |||||
| Net Debt/Equity | (58.1) | (49.4) | (72.6) | (109.1) | (88.9) |
| Liabilities/Equity | 17.3 | 23.9 | 121.7 | 227.7 | 191.8 |
| Ratios (X) | |||||
| Current ratio | 6.2 | 4.2 | 3.5 | 3.8 | 3.6 |
| Quick ratio | 5.1 | 3.2 | 2.9 | 3.2 | 2.9 |
| Others | |||||
| AR/NR Turnover (days) | 75 | 54 | 54 | 54 | 54 |
| Inventory Turnover (days) | 82 | 83 | 83 | 83 | 83 |
| AP Turnover (days) | 49 | 47 | 47 | 47 | 47 |
| Cash Conversion (days) | 108 | 90 | 90 | 90 | 90 |
| NT$mn (Years End Dec ) | 2024 | 2025 | 2026E | 2027E | 2028E |
|---|---|---|---|---|---|
| Net sales | 1,364 | 1,892 | 2,100 | 6,791 | 19,914 |
| COGS | (1,185) | (1,537) | (1,815) | (4,446) | (12,404) |
| Gross profit | 179 | 355 | 285 | 2,345 | 7,510 |
| Operating expenses | (273) | (354) | (479) | (982) | (2,542) |
| Operating income | (93) | 0 | (194) | 1,363 | 4,968 |
| Non-operating income | 37 | 22 | 148 | 65 | 25 |
| Pre-tax income | (57) | 23 | (47) | 1,428 | 4,993 |
| Income tax | (8) | 7 | (8) | 271 | 949 |
| Reported net Income | (48) | 16 | (39) | 1,157 | 4,044 |
| Adj.wtd.avg.shrs( m) | 88 | 88 | 113 | 114 | 114 |
| Reported EPS (NT$) | (0.47) | 0.16 | (0.34) | 10.18 | 35.59 |
| Modelware EPS (NT$) | (0.47) | 0.16 | (0.34) | 10.18 | 35.59 |
Balance Sheet
| NT$mn (Years End Dec ) | 2024 | NT$ 2,025 | 2026E | 2027E | 2028E |
|---|---|---|---|---|---|
| Cash | 1,470 | 1,412 | 2,221 | 4,859 | 8,859 |
| Mkt Securities | 43 | 20 | 20 | 20 | 20 |
| AR/NR | 285 | 276 | 311 | 1,007 | 2,954 |
| Inventory | 288 | 409 | 411 | 1,007 | 2,811 |
| Other | 56 | 91 | 91 | 91 | 91 |
| Current Assets | 2,141 | 2,207 | 3,055 | 6,984 | 14,734 |
| Long-term investments | 0 | 0 | 0 | 0 | 0 |
| Fixed assets | 485 | 647 | 2,024 | 4,090 | 6,496 |
| Deffered assets | 51 | 56 | 56 | 56 | 56 |
| Other assets | 290 | 247 | 247 | 247 | 247 |
| Total Assets | 2,967 | 3,157 | 5,381 | 11,376 | 21,533 |
| S/T borrowings | 0 | 153 | 459 | 1,072 | 2,297 |
| AP/NP | 202 | 194 | 233 | 572 | 1,595 |
| Other ST liabilities | 146 | 175 | 175 | 175 | 175 |
| LT debt | 89 | 86 | 2,086 | 6,086 | 10,086 |
| Other LT liabilities | 0 | 0 | 0 | 0 | 0 |
| Common shares | 1,036 | 1,036 | 1,036 | 1,036 | 1,036 |
| Total Liabilities | 437 | 608 | 2,954 | 7,905 | 14,153 |
| Additional capital | 1,440 | 1,464 | 1,464 | 1,464 | 1,464 |
| Retained earning | 276 | 273 | 152 | 1,196 | 5,104 |
| Other shareholders' equity | (222) | (225) | (225) | (225) | (225) |
| Total Equity | 2,531 | 2,549 | 2,427 | 3,471 | 7,380 |
| Total Liab. & Shrhldr's Equity | 2,967 | 3,157 | 5,381 | 11,376 | 21,533 |
E = Morgan Stanley Research Estimates
Source: Morgan Stanley Research, Company Data
Source:
M Asia Pacific Insight
ASE: Estimate Revisions and Quarterly Financials
We raise our EPS estimates 3% or 2026, 10% or 2027, and 23% or 2028: The increase mostly reflects margin expansion from better product mix, price hikes, and rising utilization rate, as well as the CPO business starting from 2027.
Ex ibit 53: ASEH: Estimate revision summary
| (NT$ mn) | New 2026e | Old 2026e | Diff.% | New 2027e | Old 2027e | Diff.% | New 2028e | Old 2028e | Diff.% |
|---|---|---|---|---|---|---|---|---|---|
| Net sales | 847,748 | 836,892 | 1%1,143,902 | 1,116,816 | 2%1,540,230 | 1,453,498 | 6% | ||
| IC ATM | 542,924 | 531,497 | 2% | 799,470 | 770,999 | 4%1,182,358 | 1,091,940 | 8% | |
| EMS | 317,359 | 317,359 | 0% | 374,536 | 374,536 | 0% | 403,632 | 403,632 | 0% |
| Gross profit | 181,772 | 178,672 | 2% | 291,850 | 273,076 | 7% | 453,877 | 389,301 | 17% |
| Operating profit | 102,211 | 99,620 | 3% | 195,615 | 178,087 | 10% | 333,891 | 272,064 | 23% |
| Pretax Income | 103,703 | 100,699 | 3% | 188,134 | 171,776 | 10% | 326,409 | 265,753 | 23% |
| Net income | 81,402 | 79,064 | 3% | 145,490 | 132,817 | 10% | 252,426 | 205,480 | 23% |
| Diluted EPS | 18.42 | 17.89 | 3% | 32.92 | 30.05 | 10% | 57.12 | 46.50 | 23% |
| Margins | |||||||||
| Gross margin | 21.4% | 21.3% | 25.5% | 24.5% | 29.5% | 26.8% | |||
| IC ATM GM | 28.2% | 28.3% | 32.2% | 31.0% | 35.2% | 32.2% | |||
| Operating margin | 12.1% | 11.9% | 17.1% | 15.9% | 21.7% | 18.7% | |||
| Pretax margin | 12.2% | 12.0% | 16.4% | 15.4% | 21.2% | 18.3% | |||
| Net margin | 9.6% | 9.4% | 12.7% | 11.9% | 16.4% | 14.1% |
Source: Morgan Stanley Research (e) estimates
Ex ibit 54: ASEH: Quarterly financials
| (NT$ mn) | 1Q26 | 2Q26e | 3Q26e | 4Q26e | 1Q27e | 2Q27e | 3Q27e | 4Q27e | 2025 | 2026e | 2027e | 2028e |
|---|---|---|---|---|---|---|---|---|---|---|---|---|
| Total Revenues Q/Q % | 173,662 -2.4% | 191,064 10.0% 26.7% | 235,978 23.5% 40.0% | 247,044 4.7% 38.9% | 240,743 -2.6% 38.6% | 267,062 10.9% 39.8% | 303,482 13.6% | 332,616 9.6% | 645,388 8.4% | 847,748 31.4% | 1,143,902 | 1,540,230 |
| Y/Y % | 17.2% (138,812) | (150,945) 79.0% | (185,083) 78.4% | (191,136) | (182,774) | (200,231) | 28.6% | 34.6% | (531,195) | (665,976) 78.6% | 34.9% | 34.6% |
| Cost of Sales Percent of Revenues Gross Profit Gross Margin % | 79.9% 34,850 20.1% | 40,118 | 50,895 | 77.4% 55,908 | 75.9% | 75.0% | (225,581) 74.3% 77,901 25.7% | (243,467) 73.2% | 82.3% 114,193 | 181,772 | (852,053) 74.5% | (1,086,353) 70.5% |
| Total Operating Expense Percent of Revenues R&D Percent of Revenues Sales and Marketing % Revenues | (17,318) 10.0% 0 (9,210) 5.3% (1,996) 1.1% | 21.0% (19,024) 10.0% 0 (10,229) 5.4% (2,287) | 21.6% (21,327) 9.0% 0 (10,379) 4.4% (2,689) | 22.6% (21,893) 8.9% 0 (10,529) 4.3% | 57,969 24.1% (21,753) 9.0% 0 (10,679) 4.4% (2,648) | 66,831 25.0% (23,114) 8.7% 0 (10,829) 4.1% (2,938) | (24,939) 8.2% 0 (10,979) 3.6% (3,338) 1.1% | 89,148 26.8% (26,429) 7.9% 0 (11,129) 3.3% (3,659) | 17.7% (63,437) 9.8% 0 (32,851) 5.1% (7,405) | 21.4% (79,561) 9.4% 0 (40,346) 4.8% (9,688) | 291,850 25.5% (96,235) 8.4% 0 (43,615) 3.8% (12,583) | 453,877 29.5% (119,986) 7.8% 0 (46,055) 3.0% (16,943) |
| General and Admin | (6,113) 3.5% | 1.2% (6,508) 3.4% | 1.1% (8,259) 3.5% | (2,717) 1.1% (8,647) | 1.1% (8,426) 3.5% | 1.1% (9,347) | (10,622) | 1.1% (11,642) 3.5% | 1.1% 3.6% | 1.1% | 1.1% (40,037) 3.5% | 1.1% (56,989) 3.7% |
| % Revenues Operating Income | 17,532 10.1% | 21,095 | 29,569 | 3.5% 34,016 | 36,216 | 3.5% 43,718 | 3.5% 52,962 | 62,719 | (23,181) 50,756 | (29,526) 3.5% | 195,615 | 333,891 |
| Operating Margin Income | 668 | 11.0% 4,566 | 12.5% (1,872) 27,697 11.7% | 13.8% (1,871) 32,144 | 15.0% (1,870) | 16.4% (1,871) | 17.5% (1,871) | 18.9% (1,870) | 7.9% 545 | 102,211 12.1% 1,492 | 17.1% (7,481) | 21.7% (7,482) |
| Total Non-operating Profit Before Taxes | 18,200 10.5% | 25,661 13.4% | 13.0% | 34,347 14.3% | 41,847 | 51,091 16.8% | 60,849 18.3% | 51,301 7.9% | 103,703 | 188,134 16.4% | 326,409 | |
| Percent of Revenues | (3,635) 20.0% | (4,167) 16.2% | (5,678) 20.5% | (6,590) | (7,041) | 15.7% | (12,474) | (9,460) 18.4% | 12.2% (20,069) | (38,567) | 21.2% (66,914) | |
| Taxes Tax Rate | 21,494 | 20.5% | (8,579) 20.5% | (10,474) 20.5% | 20.5% | 19.4% | 20.5% | 20.5% | ||||
| Net Income, Cont Ops | 14,565 | 22,019 (666) | 25,555 | 20.5% 27,306 | 33,268 | 40,617 | 48,375 (1,270) | 41,841 (1,182) | 83,634 | 149,566 | ||
| Minority Interest Reported Income (TW | (417) 14,148 8.1% | (442) 21,052 11.0% | 21,353 9.0% | (706) 24,849 | (754) | (908) 32,360 12.1% | (1,143) | 14.2% 89.6% | 40,658 6.3% | (2,232) 81,402 | 145,490 12.7% | (7,069) |
| GAAP) Net margin | 87.3% | 4.76 | 96.4% | 10.1% | 53.7% | (4,076) | 259,495 | |||||
| Y/Y % | 68.9% | 84.9% | 25.2% | 9.6% | 78.7% | 73.5% | ||||||
| 3.20 | 4.83 | 5.62 | 8.93 | 16.4% | ||||||||
| 26,552 | 252,426 | |||||||||||
| 179.9% | 13.0% | |||||||||||
| 39,474 | ||||||||||||
| 47,105 | ||||||||||||
| 11.0% 87.7% | 100.2% | |||||||||||
| EPS for Consensus | 6.01 | 7.32 | 10.66 | 32.92 | 57.12 | |||||||
| (NT$) | 9.22 | 18.42 | ||||||||||
| Seq % | -3.8% | 48.8% | 1.4% | 16.4% | 6.9% | 21.9% | 22.0% | 19.3% | 24.5% | 99.8% | 78.7% | 73.5% |
| Reported basic EPS | 3.24 | 4.80 | 4.87 | 5.66 | 6.05 | 7.38 | 9.00 | 9.38 | 18.57 | 33.17 | 57.54 | |
| (NT$) | 10.74 |
Source: Company data, Morgan Stanley Research (e) estimates
M Asia Pacific Insight
Valuation methodology
We li t our price target rom NT$628 to NT$858: This reflects our earnings estimate revisions for 2026-28. We continue to derive our price target using the base case value from a residual income model. We also raise our intermediate growth rate assumption from 9% to 10%, and terminal growth rate from 3% to 3.5% given the upcoming CPO opportunity, which should benefit the company's TAM. Our cost of equity is unchanged at 9.8% (beta of 1.3, risk premium of 6% and risk-free rate of 2%) and
Our bull case value rises from NT$700 to NT$1,000, while our bear case value increases from NT$380 to NT$500, implying 30x and 15x our 2027e PS, respectively. We remain Overweight.
Ex ibit 55: ASEH: Residual income model
| 2026e | 2027e | 2028e | 2029e | 2030e | 2031e | 2032e | 2033e | 2034e | 2035e | 2036e | 2037e | |
|---|---|---|---|---|---|---|---|---|---|---|---|---|
| Total Equity | 430,375 | 527,024 | 692,156 | 819,884 | 960,384 | 1,114,935 | 1,284,941 | 1,471,947 | 1,677,654 | 1,903,931 | 2,152,837 | 2,426,633 |
| Net Profit | 81,402 | 145,490 | 252,426 | 277,669 | 305,436 | 335,980 | 369,578 | 406,535 | 447,189 | 491,908 | 541,098 | 595,208 |
| ROAE | 20.3% | 30.4% | 41.4% | 36.7% | 34.3% | 32.4% | 30.8% | 29.5% | 28.4% | 27.5% | 26.7% | 26.0% |
| Residual Income | 39,038 | 88,627 | 166,588 | 186,382 | 200,982 | 216,841 | 234,133 | 253,035 | 273,731 | 296,420 | 321,314 | 348,644 |
| Spread | 10.5% | 20.6% | 31.6% | 26.9% | 24.5% | 22.6% | 21.0% | 19.7% | 18.6% | 17.7% | 16.9% | 16.2% |
| Ending Equity Capital | 430,375 | |||||||||||
| PV of Forecast Period | 1,282,478 | |||||||||||
| PV of Continuing Value | 2,048,125 | |||||||||||
| Equity Value | 3,760,978 | |||||||||||
| No. of Shares | 4,383 | |||||||||||
| Projected Price | 858 |
Source: Company data, Morgan Stanley Research (e) estimates M Asia Pacific Insight
Relative valuation
Over the past two months, AS 's share price has rallied (+45% vs. Taiex +25%) in response to investor expectations for its CPO testing and margin expansion. Despite this we remain OW, as the stock is still only trading at 21x our 2027e PS, which we view as attractive for a company that has increasing pricing power, AI revenue, and margin growth. Our price target implies 26x our 2027e PS, more than +2SD from its historical average of 13x since 2015.
Ex ibit 56: ASEH: One-year forward P/E chart
Source: Company data, Morgan Stanley Research (e) estimates
M Asia Pacific Insight
Risk Reward - ASE Technology Holding Co. Ltd. (3711.TW) Risk Reward - ASE Technology Holding Co. Ltd. (3711.TW)
We see further upside potential from AI/CPO; stay OW
NT$858.00 PRICE TARGET
Base case, residual income model. Key assumptions: cost of equity of 9.8%, intermediate growth rate of 10%, terminal growth rate of 3.5%, and cash dividend payout ratio of 60%.
NT$711.07
Source: Refinitiv, Morgan Stanley Research
BULL CASE
BASE CASE
OVERWEIGHT THESIS
- ▪Our checks show that ASE is receiving strong packaging overflow demand from TSMC, which could enjoy strong momentum in 2026 and after.
- ▪We now think ASE's LEAP (leading-edge advanced packing) revenue is likely to reach US$8.5bn in 2027e.
- ▪We also see strong revenue upside potential in CPO-related packaging and testing
- ▪Our price target implies 26x our 2027e EPS, similar to +2SD from its historical average of 13x since 2015.
▪However, we still view the P/E as
- attractive for a company that has increasing pricing power, AI revenue, and margin growth.
Source: Refinitiv, Morgan Stanley Research
Risk Reward Themes
Secular Growth:
Positive
Technology Diffusion: Positive
View descriptions of Risk Rewards Themes here
BEAR CASE
30x 2027e EPS
Strong semi growth; competition becomes rational thanks to merger; upside for SiP penetration rate with mainstream products: Competition becomes rational with sustained gross margin. Stronger price bargaining power and technology advancement thanks to smooth consolidation between ASE and SPIL. SiP shipments accelerate among mmWave AiP, camera modules, acoustic modules, 3D sensing, and wearables. ASEH develops comprehensive advanced packaging technology with high traction among customers.
26x 2027e EPS
Strong cycle with AI/advanced packaging as the driving force: Demand for wire-bonding and flip-chip from consumer tech demand is recovering while most of the capacity in Taiwan is full. The advanced packaging business should be the major source of margin accretion in future. Pricing for ATM businesses is likely to rise 5-20% in 2026e. CoWoS outsourcing from TSMC may aid its top line and margin profile as well as the CPO opportunity in 2027/2028.
15x 2027e EPS
Semis enter down-cycle, with less back-end outsourcing and big customers searching for more cost-effective alternatives: The macro situation weakens, impairing semi demand. The need for second sources causes big customers to shift back-end orders away from ASE, along with pricing erosion given competition. SiP adoption remains limited outside of wearables. Gross margins keep deteriorating given competition from Chinese peers.
NT$500.00
NT$1,000.00
NT$858.00
M Asia Pacific Insight
Risk Reward - ASE Technology Holding Co. Ltd. (3711.TW)
KEY EARNINGS INPUTS
| Drivers | Dec 2025 | Dec 2026eDec | 2027eDec | 2028e |
|---|---|---|---|---|
| Revenue from IC packaging Segment (NT$, mn) | 311,799 | 434,737 | 644,087 | 955,264 |
| Revenue from Testing Segment (NT$, mn) | 71,899 | 99,741 | 145,396 | 215,145 |
| Revenue from Direct Material Segment (NT$, mn) | 5,192 | 8,245 | 9,987 | 11,949 |
| Revenue from SiP (NT$, mn) | 104,159 | 117,322 | 129,328 | 142,061 |
INVESTMENT DRIVERS
- Global semi growth
- New applications for SiP
- Synergies from merger with SPIL
GLOBAL REVENUE EXPOSURE
Source: Morgan Stanley Research Estimate View explanation of regional hierarchies here
MS ALPHA MODELS
3/5
MOST
3 Month
Horizon
Source: Refinitiv, FactSet, Morgan Stanley Research; 1 is the highest favored Quintile and 5 is the least favored Quintile
RISKS TO PT/RATING
RISKS TO UPSIDE
- Stronger-than-expected global economic and semiconductor growth
- Margin expansion through merger consolidation
- New wearables project wins with higher margins
RISKS TO DOWNSIDE
- Slower-than-expected global economic and semiconductor growth
- Further margin erosion amid price competition
- Lack of new features in wearables, causing consumers to lose interest
OWNERSHIP POSITIONING
Inst. Owners, % Active
69.3%
Source: Refinitiv, Morgan Stanley Research
MS ESTIMATES VS. CONSENSUS
Source: Refinitiv, Morgan Stanley Research M Asia Pacific Insight
ASEH: Financial summary
Income Statements
Cash Flow Statements
(924,760) Working Capital Change
| NT$mn (Years End Dec ) | 2025 | 2026e | 2027e | 2028e |
|---|---|---|---|---|
| Cashflow from Operations | 142,249 | 193,646 | 253,735 | 384,120 |
| Net profits | 40,658 | 81,402 | 145,490 | 252,426 |
| Depreciation | 63,607 | 88,477 | 134,624 | 174,763 |
| Working Capital Change | 37,973 | 26,793 | (26,379) | (43,069) |
| Other adjustments | 11 | (3,026) | 0 | 0 |
| Cashflow from Investing | (165,644) | (325,517) | (327,142) | (299,825) |
| Capex | (162,149) | (325,517) | (327,142) | (299,825) |
| Change of LT Investment | 0 | 0 | 0 | 0 |
| Change of ST Investment | (446) | 0 | 0 | 0 |
| Other adjustments | (3,049) | 0 | 0 | 0 |
| Cashflow from financing | 45,269 | 75,605 | 51,159 | 12,706 |
| Increase in L/T debt | 81,307 | 0 | 0 | 0 |
| Increase in S/T debt | (3,641) | 0 | 0 | 0 |
| Cash Dividend Paid | (23,034) | (24,395) | (48,841) | (87,294) |
| Dir& Emp Bonus Paid | 0 | 0 | 0 | 0 |
| Other adjustments | (9,363) | 100,000 | 100,000 | 100,000 |
| Exchange rate adjustment | (5,898) | 0 | 0 | 0 |
| Net change in cash | 15,976 | -56,266 | -22,248 | 97,001 |
211,328 Financial Ratios
31,825 Margins (%)
| Financial Ratios | 2025 | 2026e | 2027e | 2028e |
|---|---|---|---|---|
| Growth(%) | ||||
| Turnover | 8.4 | 31.4 | 34.9 | 34.6 |
| Operating profits | 29.6 | 101.4 | 91.4 | 70.7 |
| Pretax profits | 23.1 | 102.1 | 81.4 | 73.5 |
| Net profits | 25.2 | 100.2 | 78.7 | 73.5 |
| EPS | 24.5 | 99.8 | 78.7 | 73.5 |
| Margins (%) | ||||
| Gross Margin | 17.7 | 21.4 | 25.5 | 29.5 |
| Operating Margin | 7.9 | 12.1 | 17.1 | 21.7 |
| EBITA Margin | 17.2 | 21.7 | 28.0 | 32.2 |
| Pretax Margin | 7.9 | 12.2 | 16.4 | 21.2 |
| Net Profit | 6.3 | 9.6 | 12.7 | 16.4 |
| Return (%) | ||||
| ROAE | 11.3 | 20.3 | 30.4 | 41.4 |
| ROAA | 5.0 | 8.3 | 12.4 | 17.5 |
| Gearing (%) | ||||
| Net Debt/Equity | (16.2) | (1.0) | 3.4 | (11.4) |
| Liabilities/Equity | 138.2 | 146.8 | 144.4 | 129.7 |
| Ratios (X) | ||||
| Current ratio | 1.3 | 1.0 | 1.0 | 1.4 |
| Quick ratio | 0.9 | 0.6 | 0.6 | 1.0 |
| Others | ||||
| AR/NR Turnover (days) | 65 | 67 | 67 | 67 |
| Inventory Turnover (days) | 41 | 41 | 41 | 41 |
| AP Turnover (days) | 54 | 57 | 57 | 57 |
| Cash Conversion (days) | 52 | 51 | 51 | 51 |
| NT$mn (Years End Dec ) | 2025 | 2026e | 2027e | 2028e |
|---|---|---|---|---|
| Net sales | 645,388 | 847,748 | 1,143,902 | 1,540,230 |
| COGS | (531,195) | (665,976) | (852,053) | (1,086,353) |
| Depreciation Expense | (60,438) | (81,473) | (124,478) | (161,592) |
| Variable Cost | (470,757) | (584,502) | (727,575) | (924,760) |
| Gross profit | 114,193 | 181,772 | 291,850 | 453,877 |
| Operating expenses | (63,437) | (79,561) | (96,235) | (119,986) |
| Operating income | 50,756 | 102,211 | 195,615 | 333,891 |
| Non-operating income | 545 | 1,492 | (7,481) | (7,482) |
| Pre-tax income | 51,301 | 103,703 | 188,134 | 326,409 |
| Income tax | (10,643) | (22,301) | (42,643) | (73,982) |
| Reported net Income | 40,658 | 81,402 | 145,490 | 252,426 |
| Adj.wtd.avg.shrs( m) | 4,411 | 4,419 | 4,419 | 4,419 |
| Basic EPS (NT$) | 9.38 | 18.57 | 33.17 | 57.54 |
| EPS for Consensus (NT$) | 9.22 | 18.42 | 32.92 | 57.12 |
Balance Sheets
| NT$mn (Years End Dec ) | 2025 | 2026e | 2027e | 2028e |
|---|---|---|---|---|
| Cash | 92,469 | 36,203 | 13,954 | 110,956 |
| Mkt Securities | 7,754 | 7,754 | 7,754 | 7,754 |
| AR/NR | 125,042 | 119,231 | 156,616 | 211,328 |
| Inventory | 76,951 | 71,886 | 90,126 | 115,308 |
| Other | 11,579 | 11,579 | 11,579 | 11,579 |
| Current Assets | 313,795 | 246,653 | 280,029 | 456,924 |
| Long-term investments | 60,306 | 63,332 | 63,332 | 63,332 |
| Fixed assets | 421,115 | 658,155 | 850,674 | 975,736 |
| Other assets | 94,118 | 94,118 | 94,118 | 94,118 |
| Total Assets | 889,333 | 1,062,257 | 1,288,152 | 1,590,109 |
| S/T borrowings | 31,825 | 31,825 | 31,825 | 31,825 |
| AP/NP | 88,754 | 104,671 | 133,917 | 170,741 |
| Other ST liabilities | 121,549 | 121,549 | 121,549 | 121,549 |
| LT debt | 214,081 | 314,081 | 414,081 | 514,081 |
| Other LT liabilities | 57,536 | 57,536 | 57,536 | 57,536 |
| Total Liabilities | 515,966 | 631,883 | 761,128 | 897,953 |
| Common stocks | 44,361 | 44,361 | 44,361 | 44,361 |
| Preferred stocks | 0 | 0 | 0 | 0 |
| Capital Researve | 156,457 | 156,457 | 156,457 | 156,457 |
| Retained earning | 174,508 | 231,515 | 328,164 | 493,297 |
| Minority Equity | 0 | 0 | 0 | 0 |
| Others | (1,959) | (1,959) | (1,959) | (1,959) |
| Total Equity | 373,368 | 430,375 | 527,024 | 692,156 |
| Total Liab. & Shrhldr's Equity | 889,333 | 1,062,257 | 1,288,152 | 1,590,109 |
e = Morgan Stanley Research Estimates
Source: Morgan Stanley Research, company data M Asia Pacific Insight
KYEC: Estimate Revisions and Quarterly Financials
We nudge our 2026 and 2028 EPS s up 1% and 2%; 2027e is virtually unchanged: 2028 revenue and earnings assumptions reflects the start of new US capacity contribution.
Ex ibit 57: KYEC: Earnings estimate revisions
| (NT$ mn) | New 2026e | Old 2026e | Diff.% | New 2027e | Old 2027e | Diff.% | New 2028e | Old 2028e | Diff.% |
|---|---|---|---|---|---|---|---|---|---|
| Net sales | 47,683 | 47,683 | 0% | 67,303 | 67,303 | 0% | 89,529 | 87,546 | 2% |
| Gross profit | 19,106 | 19,106 | 0% | 27,817 | 27,817 | 0% | 38,172 | 37,330 | 2% |
| Operating profit | 13,675 | 13,675 | 0% | 21,516 | 21,559 | 0% | 29,858 | 29,260 | 2% |
| Pretax income | 14,020 | 14,044 | 0% | 21,677 | 21,769 | 0% | 29,975 | 29,488 | 2% |
| Net income | 11,369 | 11,388 | 0% | 17,559 | 17,634 | 0% | 24,281 | 23,886 | 2% |
| Reported EPS | 9.06 | 8.95 | 1% | 13.66 | 13.69 | 0% | 18.89 | 18.55 | 2% |
| Margins | |||||||||
| Gross margin | 40.1% | 40.1% | 41.3% | 41.3% | 42.6% | 42.6% | |||
| Opex ratio | 11.4% | 11.4% | 9.4% | 9.3% | 9.3% | 9.2% | |||
| Operating margin | 28.7% | 28.7% | 32.0% | 32.0% | 33.4% | 33.4% | |||
| Pretax margin | 29.4% | 29.5% | 32.2% | 32.3% | 33.5% | 33.7% | |||
| Net margin | 23.8% | 23.9% | 26.1% | 26.2% | 27.1% | 27.3% |
Source: Morgan Stanley Research estimates
Ex ibit 58: KYEC: Quarterly financials
| (NT$ mn) | 1Q26 | 2Q26e | 3Q26e | 4Q26e | 1Q27e | 2Q27e | 3Q27e | 4Q27e | 2025 | 2026e | 2027e | 2028e |
|---|---|---|---|---|---|---|---|---|---|---|---|---|
| Total Revenues | 10,192 | 11,142 | 12,079 | 14,271 | 15,076 | 16,117 | 17,493 | 18,617 | 34,934 | 47,683 | 67,303 | 89,529 |
| Q/Q % | 2.3% | 9.3% | 8.4% | 18.2% | 5.6% | 6.9% | 8.5% | 6.4% | ||||
| Y/Y % | 39.3% | 33.2% | 30.0% | 43.2% | 47.9% | 44.7% | 44.8% | 30.5% | 30.1% | 36.5% | 41.1% | 33.0% |
| Cost of Sales | (6,141) | (6,741) | (7,483) | (8,212) | (8,954) | (9,476) | (10,165) | (10,890) | (22,411) | (28,578) | (39,485) | (51,357) |
| Percent of Revenues | 60.3% | 60.5% | 62.0% | 57.5% | 59.4% | 58.8% | 58.1% | 58.5% | 64.2% | 59.9% | 58.7% | 57.4% |
| Gross Profit before dep and amort | 6,472 | 7,077 | 7,581 | 9,884 | 9,107 | 9,626 | 10,313 | 17,998 | 19,390 | 31,014 | 47,044 | 59,330 |
| Percent of Revenues | 63.5% | 63.5% | 62.8% | 69.3% | 60.4% | 59.7% | 59.0% | 96.7% | 55.5% | 65.0% | 69.9% | 66.3% |
| Gross Profit | 4,051 | 4,400 | 4,596 | 6,060 | 6,122 | 6,640 | 7,327 | 7,728 | 12,522 | 19,106 | 27,817 | 38,172 |
| Gross Margin Incremental Margins | 39.7% | 39.5% | 38.0% | 42.5% | 40.6% | 41.2% | 41.9% | 41.5% | 35.8% | 40.1% | 41.3% | 42.6% |
| Total Opex | (1,279) | (1,572) | (1,092) | (1,488) | (1,458) | (1,552) | (1,615) | (1,677) | (3,520) | (5,430) | (6,301) | (8,314) |
| Percent of Revenues | 12.5% | 14.1% | 9.0% | 10.4% | 9.7% | 9.6% | 9.2% | 9.0% | 10.1% | 11.4% | 9.4% | 9.3% |
| R&D | (307) | (315) | (278) | (288) | (357) | (375) | (338) | (318) | (930) | (1,188) | (1,388) | (1,778) |
| Percent of Revenues | 3.0% | 2.8% | 2.3% | 2.0% | 2.4% | 2.3% | 1.9% | 1.7% | 2.7% | 2.5% | 2.1% | 2.0% |
| Sales and Marketing | (98) | (104) | (157) | (200) | (196) | (210) | (227) | (242) | (464) | (559) | (875) | (1,164) |
| Percent of Revenues | 1.0% | 0.9% | 1.3% | 1.4% | 1.3% | 1.3% | 1.3% | 1.3% | 1.3% | 1.2% | 1.3% | 1.3% |
| General and Admin | (873) | (1,154) | (657) | (1,000) | (905) | (967) | (1,050) | (1,117) | (2,126) | (3,684) | (4,038) | (5,372) |
| Percent of Revenues | 8.6% | 10.4% | 5.4% | 7.0% | 6.0% | 6.0% | 6.0% | 6.0% | 6.1% | 7.7% | 6.0% | 6.0% |
| Operating Income | 2,772 | 2,828 | 3,504 | 4,572 | 4,664 | 5,089 | 5,713 | 6,051 | 9,003 | 13,675 | 21,516 | 29,858 |
| Operating margin | 27.2% | 25.4% | 29.0% | 32.0% | 30.9% | 31.6% | 32.7% | 32.5% | 25.8% | 28.7% | 32.0% | 33.4% |
| Total Non-operating Income | 36 | 248 | 26 | 35 | 41 | 45 | 37 | 37 | 1,626 | 345 | 161 | 117 |
| Profit Before Taxes | 2,808 | 3,076 | 3,530 | 4,607 | 4,706 | 5,133 | 5,749 | 6,088 | 10,629 | 14,020 | 21,677 | 29,975 |
| Percent of Revenues | 27.6% | 27.6% | 29.2% | 32.3% | 31.2% | 31.9% | 32.9% | 32.7% | 30.4% | 29.4% | 32.2% | 33.5% |
| Taxes | (522) | (584) | (670) | (875) | (894) | (975) | (1,092) | (1,156) | (2,624) | (2,651) | (4,118) | (5,694) |
| Tax Rate | 18.6% | 19.0% | 19.0% | 19.0% | 19.0% | 19.0% | 19.0% | 19.0% | 24.7% | 18.9% | 19.0% | 19.0% |
| Net Income, Cont Ops | 2,287 | 2,492 | 2,859 | 3,732 | 3,812 | 4,158 | 4,657 | 4,932 | 8,005 | 11,369 | 17,559 | 24,281 |
| Reported Income (TW GAAP) | 2,287 | 2,492 | 2,859 | 3,732 | 3,812 | 4,158 | 4,657 | 4,932 | 11,016 | 11,369 | 17,559 | 24,281 |
| Percent of Revenues | 22.4% | 22.4% | 23.7% | 26.1% | 25.3% | 25.8% | 26.6% 62.9% | 26.5% | 31.5% | 23.8% | 26.1% | 27.1% |
| Change vs Year Ago | -46.7% | 14.5% | 24.2% | 66.0% | 66.7% | 66.9% | 32.2% | 41.6% | 3.2% | 54.5% | 38.3% | |
| ModelWare EPS (NT$) | 1.86 | 2.04 | 2.22 | 2.90 | 2.97 | 3.23 | 3.62 | 3.84 | 8.96 | 9.06 | 13.66 | 18.89 |
| 1,223 | 1,223 | 1,223 | 1,223 | |||||||||
| Basic shares (mn units) Diluted | 1,223 1,227 | 1,223 1,224 | 1,223 1,285 | 1,223 | 1,285 | 1,285 | 1,285 | 1,223 | 1,223 | 1,223 1,285 | 1,223 1,285 | |
| 1,223 | 1,223 | 1,223 | 1,285 | 1,285 | 1,223 | 1,230 | 1,255 | 1,223 | ||||
| Basic period End share | 1,223 | 1,223 | 1,223 | 1,223 | 1,223 | 1,223 | 1,223 |
Source: Company data, Morgan Stanley Research (e) estimates
M Asia Pacific Insight
Valuation methodology
We raise our price target rom NT$338 to NT$348: The price target change comes mostly from our 2028e earnings change - we expect its new US capacity start to contribute in 2H28. We continue to derive our price target (our base case scenario value) from a residual income model. All of our key valuation assumptions are the same: a cost of equity of 9.8% (risk premium of 6%, risk-free rate of 2%, and beta of 1.3), intermediate growth rate of 10.5%, and terminal growth rate of 3.0%.
Our bull case value rises from NT$415 to NT$428 and our bear case increases from NT $215 to NT$220, implying 31x and 16x our 2027e PS, respectively.
Ex ibit 59: KYEC: Residual income model
| (NT$ mn) | 2026e | 2027e | 2028e | 2029e | 2030e | 2031e | 2032e | 2033e | 2034e | 2035e | 2036e | 2037e |
|---|---|---|---|---|---|---|---|---|---|---|---|---|
| Total Equity | 56,299 | 68,173 | 83,675 | 90,971 | 99,032 | 107,940 | 117,783 | 128,659 | 140,678 | 153,959 | 168,634 | 184,850 |
| Net Profit | 11,369 | 17,559 | 24,281 | 26,831 | 29,648 | 32,761 | 36,201 | 40,002 | 44,203 | 48,844 | 53,972 | 59,640 |
| ROAE | 21.3% | 28.2% | 32.0% | 30.7% | 31.2% | 31.7% | 32.1% | 32.5% | 32.8% | 33.2% | 33.5% | 33.7% |
| Residual Income | 5,801 | 10,367 | 15,122 | 17,510 | 21,201 | 23,593 | 26,237 | 29,159 | 32,389 | 35,958 | 39,902 | 44,260 |
| Spread | 11.5% | 18.4% | 22.2% | 20.9% | 21.4% | 21.9% | 22.3% | 22.7% | 23.0% | 23.4% | 23.7% | 23.9% |
| Ending Equity Capital | 56,299 | |||||||||||
| PV of Forecast Period | 141,208 | |||||||||||
| PV of Continuing Value | 239,727 | |||||||||||
| Equity Value | 437,233 | |||||||||||
| No. of Shares | 1,255 | |||||||||||
| Projected Price (NT$) | 348 |
Source: Company data, Morgan Stanley Research (e) estimates M Asia Pacific Insight
Relative valuation
Our price target implies a target multiple of 25x based on our 2027 PS estimate, which we consider to be justified by the revenue CAGR of >30% that we project over 2025-28, with significantly higher AI earnings exposure in 2026 and beyond. We expect KY C's gross margin profile to expand with increasing AI testing revenue exposure.
Ex ibit 60: KYEC: One-year forward P/E chart
Ex ibit 61: KYEC: One-year forward P/B vs ROAE chart
2012 2013 2014 2015 2016 2017 2018 2019 2020 2021 2022 2023 2024 2025
Source: Company data, TEJ, Morgan Stanley Research estimates
Source: Company data, TEJ, Morgan Stanley Research estimates
M Asia Pacific Insight
Risk Reward - King Yuan Electronics Co Ltd (2449.TW) Risk Reward - King Yuan Electronics Co Ltd (2449.TW)
AI revenue pushed out to 4Q26/2027
NT$348.00 PRICE TARGET
Base case, residual income model. Key assumptions: cost of equity of 9.8%, intermediateterm growth rate of 10.5%, terminal growth rate of 3.0%, and cash dividend payout ratio of 65%.
Consensus Price Target Distribution
Source: Refinitiv, Morgan Stanley Research
RISK REWARD CHART
Source: Refinitiv, Morgan Stanley Research
BULL CASE
BASE CASE
OVERWEIGHT THESIS
- ▪3Q26/2026 revenue guidance has been cut from slower R-series XPU ramp and lower test time.
- ▪But, despite the short-term headwind, management reiterated that AI demand in 2027 remains robust, including some shipments being pushed out from 2H26 to 2027.
- ▪Our AI demand breakdown suggests strong growth in TPU and CPU demand in 2027, each accounting for 10-15% of total revenue.
- ▪We expect 2027 margin to be sustained >40% given rising utilization and cost passthrough to customers.
- ▪Our price target implies 25x 2027e EPS, justified by our 2025-28e revenue CAGR of >35%. We see re-rating potential given structural GM improvement and continued pickup in AI revenue and earnings growth.
Source: Refinitiv, Morgan Stanley Research
Risk Reward Themes
Pricing Power:
Positive
Secular Growth:
Positive
View descriptions of Risk Rewards Themes here
BEAR CASE
31x 2027e EPS
Strong semiconductor cycle after macro uncertainties have eased: 1) AI testing demand continues to surprise to the upside, with AI GPU testing market share remaining stable before 2027. 2) 5G progress is faster than in our base case, leading to higher mmWave testing demand. 3) IDM outsourcing to OSAT is faster than expected, notably in 5G and AI-related testing demand. 4) US/China tensions ease. 5) Consumer/smartphone testing demand is stronger than expected.
25x 2027e EPS
Strong HPC and auto demand offset by weak consumer semi testing demand: 1) AI GPU testing market share remains stable. 2) Longer testing time of 5G SoC and higer penetration of 5G smartphone help KYEC's SoC testing business to offset some unit decline in 2026. 3) HPC and automotive customers testing demand stays healthy in 2026, due to longer testing times for GPUs and FPGAs. 4) More normalized non-AI testing demand in 2026.
16x 2027e EPS
US-China trade tensions linger, coupled with inventory correction: 1) A sluggish 5G smartphone penetration rate hampers 5G smartphone demand. 2) Logic semi inventory correction persists longer than expected. 3) Testers are severely underutilized, leading to significant margin contraction. 4) Meaningful AI GPU testing market share loss.
NT$220.00
NT$428.00
NT$348.00
M Asia Pacific Insight
Risk Reward - King Yuan Electronics Co Ltd (2449.TW)
KEY EARNINGS INPUTS
| Drivers | Dec 2025 | Dec 2026e | Dec 2027e | Dec 2028e |
|---|---|---|---|---|
| Wafer Sort revenue (NT$, mn) | 2,624 | 2,793 | 2,393 | 3,010 |
| Final Test revenue (NT$, mn) | 3,781 | 3,757 | 3,294 | 5,989 |
| Burn-In revenue (NT$, mn) | 171 | 180 | 479 | 767 |
INVESTMENT DRIVERS
- 5G smartphone shipment/penetration rate
- Gross margin improvement/erosion
- China's semiconductor localization demand
GLOBAL REVENUE EXPOSURE
Source: Morgan Stanley Research Estimate View explanation of regional hierarchies here
MS ALPHA MODELS
4/5
MOST
3 Month
Horizon
Source: Refinitiv, FactSet, Morgan Stanley Research; 1 is the highest favored Quintile and 5 is the least favored Quintile
RISKS TO PT/RATING
RISKS TO UPSIDE
- Rise in shipments for core customers such as MediaTek
- Strong AI demand from both GPU and ASIC
- Penetration of wafer sorting business
- Rise in IDM outsourcing to OSAT
RISKS TO DOWNSIDE
- Overall non-AI demand remaining weak
- Significant testing market share loss
- Drop in shipments for core customers such as MediaTek
OWNERSHIP POSITIONING
Inst. Owners, % Active
52.9%
Source: Refinitiv, Morgan Stanley Research
MS ESTIMATES VS. CONSENSUS
Source: Refinitiv, Morgan Stanley Research M Asia Pacific Insight
Financial summary
Ex ibit 62: Financial Summary
Income Statement
Cash Flow Statement
| NT$mn (Years End Dec ) | 2025 | 2026e | 2027e | 2028e |
|---|---|---|---|---|
| Net sales | 34,934 | 47,683 | 67,303 | 89,529 |
| COGS | (22,411) | (28,578) | (39,485) | (51,357) |
| Depreciation Expense | (6,865) | (10,763) | (18,048) | (19,980) |
| Variable Cost | (15,547) | (17,814) | (21,437) | (31,377) |
| Gross profit | 12,522 | 19,106 | 27,817 | 38,172 |
| Operating expenses | (3,520) | (5,430) | (6,301) | (8,314) |
| Operating income | 9,003 | 13,675 | 21,516 | 29,858 |
| Non-operating income | 1,626 | 345 | 161 | 117 |
| Pre-tax income | 10,629 | 14,020 | 21,677 | 29,975 |
| Income tax | 387 | (2,652) | (4,118) | (5,694) |
| Reported net Income | 11,016 | 11,369 | 17,559 | 24,281 |
| Adj.wtd.avg.shrs( m) | 1,230 | 1,255 | 1,285 | 1,285 |
| Basic EPS (NT$) | 9.01 | 9.30 | 14.36 | 19.86 |
| EPS for consensus (NT$) | 8.96 | 9.06 | 13.66 | 18.89 |
Balance Sheet
| NT$mn (Years End Dec ) | 2025 | 2026e | 2027e | 2028e |
|---|---|---|---|---|
| Cash | 17,964 | 4,276 | 2,970 | 11,814 |
| Mkt Securities | 0 | 0 | 0 | 0 |
| AR/NR | 7,203 | 9,669 | 13,647 | 18,154 |
| Inventory | 1,332 | 3,279 | 4,629 | 6,157 |
| Other | 2,420 | 1,560 | 1,858 | 2,196 |
| Current Assets | 28,919 | 18,785 | 23,104 | 38,322 |
| Long-term investments | 8,416 | 8,464 | 8,515 | 8,566 |
| Fixed assets | 60,554 | 98,166 | 112,394 | 114,399 |
| Other assets | 3,289 | 2,144 | 966 | (213) |
| Total Assets | 101,178 | 127,558 | 144,979 | 161,074 |
| S/T borrowings | 0 | 20,000 | 25,000 | 25,000 |
| AP/NP | 909 | 1,429 | 1,974 | 2,568 |
| Other ST liabilities | 15,010 | 15,010 | 15,010 | 15,010 |
| LT debt | 30,275 | 30,275 | 30,275 | 30,275 |
| Other LT liabilities | 4,546 | 4,546 | 4,546 | 4,546 |
| Total Liabilities | 50,740 | 71,260 | 76,805 | 77,399 |
| Common stocks | 12,227 | 12,227 | 12,227 | 12,227 |
| Preferred stocks | 0 | 0 | 0 | 0 |
| Capital Researve | 5,081 | 5,081 | 5,081 | 5,081 |
| Retained earning | 33,121 | 38,982 | 50,857 | 66,358 |
| Other shareholders' equity | 0 | 0 | 0 | 0 |
| Total Equity | 50,438 | 56,299 | 68,173 | 83,675 |
| Total Liab. & Shrhldr's Equity | 101,178 | 127,558 | 144,979 | 161,074 |
e = Morgan Stanley Research Estimates
Source: Morgan Stanley Research, Company Data
(31,377) Working Capital Change
| NT$mn (Years End Dec ) | 2025 | 2026e | 2027e | 2028e |
|---|---|---|---|---|
| Cashflow from Operations | 13,152 | 21,820 | 34,378 | 42,624 |
| Net profits | 11,016 | 11,369 | 17,559 | 24,281 |
| Depreciation | 7,508 | 12,388 | 20,772 | 22,995 |
| Working Capital Change | (2,028) | (3,894) | (4,782) | (5,442) |
| Other adjustments | (3,344) | 1,958 | 829 | 789 |
| Cashflow from Investing | (13,078) | (50,000) | (35,000) | (25,000) |
| Capex | (31,732) | (50,000) | (35,000) | (25,000) |
| Change of LT Investment | 18,652 | 0 | 0 | 0 |
| Change of ST Investment | 52 | 0 | 0 | 0 |
| Other adjustments | (50) | 0 | 0 | 0 |
| Cashflow from financing | 4,613 | 14,492 | (684) | (8,780) |
| Increase in L/T debt | 9,918 | 0 | 0 | 0 |
| Increase in S/T debt | 0 | 20,000 | 5,000 | 0 |
| Cash Dividend Paid | (4,891) | (5,508) | (5,684) | (8,780) |
| Dir& Emp Bonus Paid | 0 | 0 | 0 | 0 |
| Other adjustments | (414) | 0 | 0 | 0 |
| Exchange rate adjustment | (326) | 0 | (0) | 0 |
| Net change in cash | 4,361 | -13,687 | -1,307 | 8,844 |
18,154 Financial Ratios
25,000 Margins (%)
| 2025 | 2026e | 2027e | 2028e | |
|---|---|---|---|---|
| Growth(%) | ||||
| Turnover | 30.1 | 36.5 | 41.1 | 33.0 |
| Operating profits | 45.9 | 51.9 | 57.3 | 38.8 |
| Pretax profits | 78.0 | 31.9 | 54.6 | 38.3 |
| Net profits | 41.6 | 3.2 | 54.5 | 38.3 |
| EPS | 41.5 | 1.1 | 50.8 | 38.3 |
| Margins (%) | ||||
| Gross Margin | 35.8 | 40.1 | 41.3 | 42.6 |
| Operating Margin | 25.8 | 28.7 | 32.0 | 33.4 |
| EBITA Margin | 45.4 | 51.3 | 58.8 | 55.7 |
| Pretax Margin | 30.4 | 29.4 | 32.2 | 33.5 |
| Net Profit | 31.5 | 23.8 | 26.1 | 27.1 |
| Return (%) | ||||
| ROAE | 23.2 | 21.3 | 28.2 | 32.0 |
| ROAA | 11.7 | 9.9 | 12.9 | 15.9 |
| Gearing (%) | ||||
| Net Debt/Equity | (35.6) | 27.9 | 32.3 | 15.8 |
| Liabilities/Equity | 100.6 | 126.6 | 112.7 | 92.5 |
| Ratios (X) | ||||
| Current ratio | 1.8 | 0.5 | 0.6 | 0.9 |
| Quick ratio | 1.6 | 0.4 | 0.4 | 0.7 |
| Others | ||||
| AR/NR Turnover (days) | 74 | 74 | 74 | 74 |
| Inventory Turnover (days) | 16 | 12 | 18 | 21 |
| AP Turnover (days) | 18 | 18 | 18 | 18 |
| Cash Conversion (days) | 72 | 68 | 73 | 77 |
M Asia Pacific Insight
WIN Semi: Estimate Revisions and Quarterly Financials
We raise our 2026, 2027, and 2028 EPS estimates 19%, 20%, and 58%, respectively:
We increase our revenue forecasts for 2027-28 due to stronger aerospace business contribution as well as PD (photo diodes), mostly from SpaceX and Broadcom. Our margin assumptions rise slightly owing to ramping optical business and infrastructure. 2026 PS change is mostly from higher-than-expected 2Q26 non-operating profit.
Ex ibit 63: WIN Semi: Estimate revisions
| (NT$ mn) | New 2026e | Old 2026e | Diff.% | New 2027e | Old 2027e | Diff.% | New 2028e | Old 2028e | Diff.% |
|---|---|---|---|---|---|---|---|---|---|
| Net sales | 21,499 | 21,284 | 1% | 28,255 | 25,521 | 11% | 40,029 | 30,155 | 33% |
| Gross profit | 6,040 | 6,145 | -2% | 9,359 | 8,441 | 11% | 14,526 | 10,411 | 40% |
| Operating profit | 2,862 | 2,957 | -3% | 5,427 | 4,590 | 18% | 10,235 | 6,407 | 60% |
| Pretax income | 4,045 | 3,321 | 22% | 5,251 | 4,268 | 23% | 10,059 | 6,085 | 65% |
| Net income | 3,672 | 3,092 | 18.7% | 4,801 | 4,015 | 20% | 8,647 | 5,468 | 58% |
| EPS for consensus | 8.63 | 7.27 | 18.7% | 11.29 | 9.44 | 20% | 20.33 | 12.86 | 58% |
| Margins | |||||||||
| Gross margin | 28.1% | 28.9% | 33.1% | 33.1% | 36.3% | 34.5% | |||
| Operating margin | 13.3% | 13.9% | 19.2% | 18.0% | 25.6% | 21.2% | |||
| Pretax margin | 18.8% | 15.6% | 18.6% | 16.7% | 25.1% | 20.2% | |||
| Net margin | 17.1% | 14.5% | 17.0% | 15.7% | 21.6% | 18.1% |
Source: Morgan Stanley Research (e) estimates
Ex ibit 64: WIN Semi: Quarterly financials
| (NT$ mn) | 1Q25 | 2Q25 | 3Q25 | 4Q25 | 1Q26 | 2Q26 | 3Q26e | 4Q26e | 2024 | 2025 | 2026e | 2027e | 2028e |
|---|---|---|---|---|---|---|---|---|---|---|---|---|---|
| Total Revenues | 3,576 -3.5% | 3,780 5.7% | 4,488 18.7% | 4,794 6.8% | 4,590 -4.3% | 5,257 14.5% | 5,882 11.9% | 5,770 -1.9% | 17,458 | 16,639 | 21,499 | 28,255 | 40,029 |
| Sequential Change Change vs Year Ago | -19.5% | -23.8% | 3.2% | 29.4% | 28.4% | 39.1% | 31.1% | 20.4% | 10.2% | -4.7% | 29.2% | 31.4% | 41.7% |
| Cost of Sales | (2,977) | (3,083) | (3,283) | (3,270) | (3,381) | (3,773) | (4,175) | (4,131) | (13,416) | (12,612) | (15,460) | (18,895) | (25,503) |
| Gross Profit Gross Margin | 598 16.7% | 698 18.5% | 1,205 26.9% | 1,525 31.8% | 1,209 26.3% | 1,485 28.2% | 1,707 29.0% | 1,639 28.4% | 4,042 23.2% | 4,026 24.2% | 6,040 28.1% | 9,359 33.1% | 14,526 36.3% |
| Total Opex Percent of Revenues R&D Percent of Revenues | (815) 22.8% (428) 12.0% (104) | (817) 21.6% | (820) 18.3% | (858) 17.9% (404) 8.4% | (780) 17.0% (357) 7.8% | (743) 14.1% (265) 5.0% | (816) 13.9% (275) 4.7% | (839) 14.5% (280) 4.8% | (3,280) 18.8% (1,691) 9.7% | (3,309) 19.9% (1,600) 9.6% | (3,177) 14.8% (1,176) 5.5% | (3,933) 13.9% (1,575) 5.6% | (4,291) 10.7% (1,740) 4.3% |
| Sales and Marketing Percent of Revenues General and Admin Percent of Revenues | 2.9% (283) | (392) 10.4% (110) 2.9% | (377) 8.4% (107) 2.4% | (128) 2.7% | (110) 2.4% (313) | (111) 2.1% (367) | (124) 2.1% (417) 7.1% | (122) 2.1% (437) 7.6% | (442) 2.5% (1,147) 6.6% | (449) 2.7% | (468) 2.2% (1,534) 7.1% | (848) 3.0% (1,510) 5.3% | (1,001) 2.5% (1,550) |
| -6.1% | 8.3% (119) -3.1% | (336) 7.5% 386 8.6% | (325) 6.8% | 6.8% | 7.0% | 762 | (1,259) 7.6% 717 | 2,862 13.3% | 5,427 19.2% | 25.6% | |||
| 7.9% (217) | (315) | 667 | 429 9.3% | 742 | 891 | 801 | 3.9% 10,235 | ||||||
| Operating Income Percent of Revenues | 156 | (432) (551) | 511 897 | 13.9% | 101 530 | 14.1% 447 | 15.1% 314 | 4.3% 672 1,389 | 1,182 | ||||
| (61) -1.7% | -14.6% | 20.0% | 437 | 11.5% | 1,188 | 1,205 | 333 1.9% | 8.4% | 4,045 18.8% | 5,251 | (176) | ||
| Total Non-operating Income(Loss) | 13.9% | (429) | (175) | ||||||||||
| Profit Before Taxes | -119.7% | -220.9% | 263.9% | 1,104 23.0% | -970.3% | 22.6% | 20.5% | 321 1,122 | 4.4% | ||||
| Percent of Revenues Change vs Year Ago | (2) -4.0% | 61 | (213) 23.8% | -262.9% | (83) 15.7% | -315.7% (284) 23.9% | 34.3% (241) 20.0% | 19.4% 1.6% (224) | 7 | (297) 21.4% | (832) | 18.6% | 25.1% |
| Taxes Tax Rate | 11.0% | (142) 12.9% | 905 | 964 | 20.0% 897 | -2.1% | 10,059 | ||||||
| 79 | (490) | 684 | 962 | 9.7% 87 | 977 | 150 | 1,092 | 20.6% | (1,050) 20.0% | (2,012) 20.0% | |||
| Percent of Revenues Minority Interest | 16 | 533 | 18.6% -332.1% | 4.1% | 1,694 | 459 | 4,801 | 8,647 | |||||
| (421) | 387 | 67 | 72 | 340 1.9% | 6.6% | 3,212 | 4,201 14.9% | 8,047 20.1% | |||||
| Net Income, Cont Ops | (63) -1.8% | -13.0% | 15.2% | 20.1% | 446 | 17.2% | 16.4% 150 | 15.6% | 14.9% | ||||
| 1,029 | 1,047 | 3,672 | 600 | ||||||||||
| Income (TW Percent of Revenues | 0.4% | -11.1% | 1,070 | ||||||||||
| 1,114 | 428 | 601 | 600 | ||||||||||
| 69 | |||||||||||||
| Reported GAAP) | -96.2% | 23.8% | 21.5% | 11.6% | 18.9% | 18.2% | 768 4.4% | 17.1% | 17.0% | ||||
| Change vs Year Ago | -186.7% | 368.7% | -392.1% | 3312.4% | 1.8% | -1064.3% | 10.2% 120.5% | 116.8% | 30.8% | 21.6% 80.1% | |||
| Reported Diluted EPS (NT$, TW | 0.04 | (0.99) | 2.52 | 2.42 | 1.25 | 2.30 | 2.62 | 2.46 | 1.81 | 3.98 | 8.63 | 11.29 | 20.33 |
| GAAP) | |||||||||||||
| Reported Basic EPS (NT$, GAAP) | 0.04 | (0.99) | 2.52 | 2.43 | 1.26 | 2.30 | 2.63 | 2.47 | 1.81 | 4.00 | 8.66 | 11.32 | 20.40 |
Source: Company data, Morgan Stanley Research (e) estimates
M Asia Pacific Insight
WIN Semi: Valuation Methodology
Our price target (base case value) increases rom NT$300 to NT$600: This factors in our PS forecast changes for 2026 to 2028, as well as increases in our valuation methodology assumptions.
We continue to derive our price target from a residual income model - we believe it best presents the value of the company. We raise our key valuation assumptions for growth because we believe the company is enjoying stronger revenue growth than in the past, when most of its revenue was coming only from smartphones. The changes include our intermediate growth rate assumption rising from 12% to 15% and terminal growth from 3% to 4%. Our cost of equity remains the same at 8% (beta of 1.0, equity risk premium of 6%, risk-free rate of 2%).
Our bull case value rises from NT$650 to NT$900 and our bear case value from NT$175 to NT$300, implying 80x and 26x our 2027 PS estimates, respectively.
Ex ibit 65: WIN Semi: Residual income model
| (NT$ mn) | 2026e | 2027e | 2028e | 2029e | 2030e | 2031e | 2032e | 2033e | 2034e | 2035e | 2036e | 2037e |
|---|---|---|---|---|---|---|---|---|---|---|---|---|
| Total Equity | 45,092 | 46,413 | 49,272 | 52,503 | 56,220 | 60,494 | 65,409 | 70,521 | 75,838 | 81,367 | 87,117 | 93,097 |
| Net Profit | 3,672 | 4,801 | 8,647 | 9,944 | 11,436 | 13,151 | 15,124 | 15,729 | 16,358 | 17,012 | 17,693 | 18,401 |
| ROAE | 8.4% | 10.5% | 18.1% | 19.5% | 21.0% | 22.5% | 24.0% | 23.1% | 22.4% | 21.6% | 21.0% | 20.4% |
| Residual Income | 182 | 1,124 | 4,676 | 5,687 | 6,845 | 8,172 | 9,694 | 9,905 | 10,122 | 13,380 | 13,834 | 14,305 |
| Spread | 0.4% | 2.5% | 10.1% | 11.5% | 13.0% | 14.5% | 16.0% | 15.1% | 14.4% | 13.6% | 13.0% | 12.4% |
| Ending Equity Capital | 45,092 | |||||||||||
| PV of Forecast Period | 50,615 | |||||||||||
| PV of Continuing Value | 159,517 | |||||||||||
| Equity Value | 255,225 | |||||||||||
| No. of Shares | 425 | |||||||||||
| Projected Price (NT$) | 600 |
Source: Morgan Stanley Research (e) estimates
Ex ibit 66: WIN Semi's one-year forward P/B band
Source: FactSet, Morgan Stanley Research estimates
M Asia Pacific Insight
Risk Reward - WIN Semiconductors Corp (3105.TWO) Risk Reward - WIN Semiconductors Corp (3105.TWO)
More PD and Aerospace business; EW
NT$600.00 PRICE TARGET
Base-case, residual income model. Key assumptions: cost of equity of 8.0% (beta of 1.0), intermediate growth rate of 15.0%, and terminal growth rate of 4.0%.
NT$376.70
Mean
Consensus Price Target Distribution
NT$142.00
NT$600.00
Source: Refinitiv, Morgan Stanley Research
RISK REWARD CHART
Source: Refinitiv, Morgan Stanley Research
BULL CASE
BASE CASE
EQUAL-WEIGHT THESIS
- ▪Stronger iPhone demand appears likely in the near term, but smartphone growth is mature compared to AI demand.
- ▪We expect to see more GaAs wafer consumption as we migrate to the WiFi 7 era, as WiFi 7 has three bands (2.4 GHz, 5 GHz and 6 GHz) vs. WiFi 6 at just two (2.4 GHz, 5 GHz).
- ▪GaN penetration in satellite business could lift the wafer ASP.
- ▪We think optical transceivers and robotics may become future drivers, as WIN Semi has the technology to enable products like EML, CW-DFB and DML..
- ▪We are EW. The company is facing pricing competition from Chinese peers and AWSC. Valuation is also fair based on our new price target.
Source: Refinitiv, Morgan Stanley Research
Risk Reward Themes
New Data Era:
Pricing Power:
Positive
Positive
Secular Growth:
Positive
View descriptions of Risk Rewards Themes here
BEAR CASE
80x 2027e EPS
3D sensing, WiFi 7 and 5G take-off: AR adoption rate beats expectations in 2027 and beyond. Smartphone demand appears to be stronger than expected, while 5G and WiFi 7 implementation starts at a healthy speed. Power amplifier (PA) customers such as Murata and Broadcom continue to work with WIN Semi, while PA customer Qualcomm's RF demand beats expectations. Win Semi also achieves significant market share in optical transceiver and 3D sensing production.
53x 2027e EPS
Orders from Chinese smartphone customers and iPhone start to pick up: WiFi 7 demand grows as forecast in 2026 and beyond. Key communications PA customers continue to work with WIN Semi, while Chinese smartphone demand starts to show recovery. AI related products such as optical transceivers and 3D sensing might also drive up its utilization rate. We expect UTR to remain at 60-80% in 2027.
26x 2027e EPS
3D sensing, 5G and WiFi 7 adoption freeze: 3D sensing adoption rate declines without killer applications in 2027. EM smartphone demand does not recover, while 5G and WiFi 7 commercialization is further delayed. Major communications PA customers find alternative partners with similar GaAs technologies, while PA customer Qualcomm's RF demand misses our base case expectations significantly.
NT$300.00
NT$900.00
MS PT
Morgan Stanley Estimates
NT$600.00
M Asia Pacific Insight
Risk Reward - WIN Semiconductors Corp (3105.TWO)
KEY EARNINGS INPUTS
| Drivers - Wafer shipments (6" equiv) (NT$, mn) | Dec 2025 - 258 | Dec 2026eDec 2027eDec 2028e - 345 | Dec 2026eDec 2027eDec 2028e - 417 | Dec 2026eDec 2027eDec 2028e - 532 |
|---|---|---|---|---|
| Blended wafer ASP (US$) (NT$, mn) | 1,806 | 1,809 | 1,997 | 2,242 |
| Utilization rate (%) (%) | 50.0 | 66.3 | 68.8 | 78.1 |
INVESTMENT DRIVERS
- 3D sensing adoption in smartphones or faster deployment for 5G
- Share gains for key fabless customers at a more significant speed
- Chinese smartphone demand
GLOBAL REVENUE EXPOSURE
Source: Morgan Stanley Research Estimate View explanation of regional hierarchies here
MS ALPHA MODELS
4/5
MOST
3 Month
Horizon
Source: Refinitiv, FactSet, Morgan Stanley Research; 1 is the highest favored Quintile and 5 is the least favored Quintile
RISKS TO PT/RATING
RISKS TO UPSIDE
- WIN Semi being able to raise utilization rate.
- Stronger-than-expected gross margin improvement
- More orders from Apple for the next-gen iPhone RF [update?]
- LD (laser diode) qualification
RISKS TO DOWNSIDE
- No adoption of 3D sensing and AR applications without killer applications
- Slowdown in outsourcing trend among integrated device manufacturers
- Build-up of component inventories amid poor smartphone demand
OWNERSHIP POSITIONING
Inst. Owners, % Active
59.9%
Source: Refinitiv, Morgan Stanley Research
MS ESTIMATES VS. CONSENSUS
Source: Refinitiv, Morgan Stanley Research M Asia Pacific Insight
WIN Semi: Financial Summary
Ex ibit 67: WIN Semi: Financial summary M Asia Pacific Insight
| Income Statement, 2024-2028e, Year End Dec | Income Statement, 2024-2028e, Year End Dec | Income Statement, 2024-2028e, Year End Dec | Income Statement, 2024-2028e, Year End Dec | Income Statement, 2024-2028e, Year End Dec | Income Statement, 2024-2028e, Year End Dec | Balance sheet | 2024 | 2025 | 2026e | 2027e | 2028e |
|---|---|---|---|---|---|---|---|---|---|---|---|
| (NT$ mn) | 2024 | 2025 | 2026e | 2027e | 2028e | (NT$ mn) | |||||
| Turnover | 17,458 | 16,639 | 21,499 | 28,255 | 40,029 | Assets | |||||
| YoY Growth | 10.2% | -4.7% | 29.2% | 31.4% | 41.7% | Cash & Equivalent | 5,419 | 7,067 | 7,015 | 6,773 | 6,602 |
| MarketableSecurity | 275 | 324 | 295 | 295 | 295 | ||||||
| Less: COGS | (13,416) | (12,612) | (15,460) | (18,895) | (25,395) | A/R & N/R | 1,226 | 1,597 | 2,212 | 2,997 | 4,139 |
| Variable costs | (9,690) | (9,509) | (12,743) | (15,258) | (22,016) | Inventories | 4,992 | 4,979 | 6,611 | 8,286 | 10,926 |
| Depreciation & amort | (3,725) | (3,103) | (2,717) | (3,638) | (3,379) | Other Current Ass. | 299 | 435 | 389 | 389 | 389 |
| Gross profit | 4,042 | 4,026 | 6,040 | 9,359 | 14,634 | Total current assets | 12,455 | 14,557 | 16,828 | 19,046 | 22,657 |
| YoY Growth | 16.5% | -0.4% | 50.0% | 55.0% | 56.4% | LT Investment | 6,520 | 8,872 | 10,596 | 10,596 | 10,596 |
| % margin | 23.2% | 24.2% | 28.1% | 33.1% | 36.6% | Total Fixed Assets | 28,265 | 19,672 | 18,688 | 18,381 | 18,606 |
| Total Other Assets | 17,018 | 17,628 | 18,775 | 18,775 | 18,775 | ||||||
| Operating Expenses: | (3,280) | (3,309) | (3,177) | (3,933) | (4,251) | Total Assets | 64,259 | 60,729 | 64,888 | 66,799 | 70,635 |
| R&D | (1,691) | (1,600) | (1,176) | (1,575) | (1,700) | ||||||
| Sales and Marketing | (442) | (449) | (468) | (848) | (1,001) | ||||||
| General and Admin | (1,147) | (1,259) | (1,534) | (1,510) | (1,550) | A/P & N/P | 1,094 | 1,662 | 2,330 | 2,921 | 3,851 |
| Operating Profit | 762 | 717 | 2,862 | 5,427 | 10,383 | Accrued Expenses | 0 | 0 | 0 | 0 | 0 |
| YoY Growth | -1465.3% | -5.9% | 299.1% | 89.6% | 91.3% | Other Payable | 2,199 | 3,135 | 3,692 | 3,692 | 3,692 |
| % margin | 4.4% | 4.3% | 13.3% | 19.2% | 25.9% | Total Current Liab. | 7,603 | 5,865 | 10,302 | 10,893 | 11,823 |
| L-T Liabilities | 16,532 | 12,328 | 8,973 | 8,973 | 8,973 | ||||||
| Total Non-op | (429) | 672 | 1,182 | (175) | (176) | Total Other L-T Liab | 986 | 545 | 520 | 520 | 520 |
| Total Liabilities | 25,121 | 18,738 | 19,795 | 20,386 | 21,316 | ||||||
| Common Stocks | 4,239 | 4,239 | 4,239 | 4,239 | 4,239 | ||||||
| Pretax Profit | 333 | 1,389 | 4,045 | 5,251 | 10,207 | Preferred Stocks | |||||
| YoY Growth | -149.0% | 317.4% | 191.1% | 29.8% | 94.4% | Capital Reserve | 9,970 | 9,977 | 10,059 | 10,059 | 10,059 |
| % margin | 1.9% | 8.4% | 18.8% | 18.6% | 25.5% | Retained earnings | 23,909 | 27,329 | 30,357 | 31,677 | 34,584 |
| Treasury Stock | 0 | 0 | 0 | 0 | 0 | ||||||
| Tax | 7 | (297) | (832) | (1,050) | (2,041) | Total Equity | 39,138 | 41,991 | 45,092 | 46,413 | 49,319 |
| Reported Net Income | 768 | 1,694 | 3,672 | 4,801 | 8,766 | ||||||
| ModelWare EPS (NT$) | 1.81 | 3.98 | 8.63 | 11.29 | 20.61 | Cash Flow Statement | |||||
| (NT$ mn) | 2024 | 2025 | 2026e | 2027e | 2028e | ||||||
| Adj. Net Income | 340 | 1,092 | 3,212 | 4,201 | 8,166 | ||||||
| Key Ratios | 2024 | 2025 | 2026e | 2027e | 2028e | Depreciation | 4,700 | 3,994 | 3,219 | 4,187 | 3,889 |
| (%) | Net Investment Losses (Gains) | 17 | 1,953 | 0 | 0 | 0 | |||||
| Return ROAA | 1.2% | 2.6% | 5.6% | 7.1% | 12.8% | Others | (2,163) | (2,158) | (2,935) | (1,870) | (2,852) |
| ROAE | 2.1% | 4.0% | 8.0% | 10.2% | 18.3% | Cash Flow-Operating | 4,900 | 4,953 | 3,497 | 6,518 | 9,202 |
| OP. ATO | 30.3% | 33.1% | 40.0% | 50.1% | 65.4% | ||||||
| (Purchase) of FA | (1,222) | (1,691) | (2,471) | (3,880) | (4,114) | ||||||
| Gearing (x) | Sale of Fix Asset | 1 | 6,235 | 0 | 0 | 0 | |||||
| Net Debt/ Equity | 0.3x | 0.1x | 0.0x | 0.0x | 0.0x | (Purchase)L-T Inv. | 0 | 0 | 0 | 0 | 0 |
| Current Ratio | 1.6x | 2.5x | 1.6x | 1.7x | 1.9x | Sale of L-T Inv. | 0 | 0 | 25 | 0 | 0 |
| Quick Ratio | 0.9x | 1.5x | 0.9x | 0.9x | 0.9x | Sale(Pur.)S-T Inv. | (77) | 61 | 103 | 0 | 0 |
| Cash Flow-Investing | (1,055) | 5,112 | (2,177) | (3,880) | (4,114) | ||||||
| Operating Cycle | |||||||||||
| AR/NR Turnover (days) | 46 | 53 | 46 | 40 | 32 | Inc(Dec)-S-T Debt | (3,394) | (7,506) | (475) | 0 | 0 |
| Inventory Turnover (days) | 183 | 204 | 179 | 164 | 136 | Dividend Paid | 0 | (424) | (1,016) | (2,881) | (5,259) |
| AP Turnover (days) | 59 | 68 | 63 | 58 | 48 | Dir.&Emp.Bonus | 0 | 0 | 0 | 0 | 0 |
| Cash Conversion (days) | 170 | 189 | 162 | 146 | 120 | Proceed from New Issue | 0 | 0 | 0 | 0 | 0 |
| Dec/Inc-TreasureSt | 0 | 0 | 0 | 0 | 0 | ||||||
| Others | (5,545) | (350) | 145 | 0 | 0 | ||||||
| Cash Flow-Financing | (8,939) | (8,280) | (1,346) | (2,881) | (5,259) | ||||||
| Change in Cash | (4,906) | 1,648 | (52) | (242) | (171) | ||||||
| e = Morgan Stanley Research Estimates | e = Morgan Stanley Research Estimates | e = Morgan Stanley Research Estimates | e = Morgan Stanley Research Estimates | 7,015 | 6,773 | ||||||
| Source: Company Data, Morgan Stanley Research | Source: Company Data, Morgan Stanley Research | Source: Company Data, Morgan Stanley Research | Net cash/(debt), b/f | 10,326 | 5,419 | 7,067 | |||||
| Net cash/(debt), c/f | 5,419 | 7,067 | 7,015 | 6,773 | 6,602 |
Risk Reward Reference links
- View explanation of Options Probabilities methodology -
Options_Probabilities_ xhibit_Link.pdf
- View descriptions of Risk Rewards Themes - RR_Themes_ xhibit_Link.pdf
-
View explanation of regional hierarchies - G G_ xhibit_Link.pdf
-
View explanation of Theme/ xposure methodology -
SG_Sustainable_Solutions_ xternal_Link.pdf
- View explanation of H RS methodology - SG_H RS_ xternal_Link.pdf
M Asia Pacific Insight
INDUSTRY COVERAGE: Greater China Technology Semiconductor
| Company (Ticker) | Rating (As Of) | Price* (10/08/2026) |
|---|---|---|
| Charlie Chan | ||
| Advanced Wireless Semiconductor Co (8086.TWO) | U (07/14/2025) | NT$154.00 |
| Alchip Technologies Ltd (3661.TW) | O (05/14/2021) | NT$4,345.00 |
| ASE Technology Holding Co. Ltd. (3711.TW) | O (09/15/2024) | NT$744.00 |
| Cambricon Technology Corporation (688256.SS) | O (04/27/2026) | Rmb981.00 |
M Asia Pacific Insight M Asia Pacific Insight Stock Ratings are subject to change Please see latest research for each company
| CXMT Corp (688825.SS) | O (08/26/2026) | Rmb50.52 |
|---|---|---|
| Global Unichip Corp (3443.TW) | O (06/24/2026) | NT$8,360.00 |
| GlobalWafers Co Ltd (6488.TWO) | E (05/19/2026) | NT$1,130.00 |
| Gudeng Precision (3680.TWO) | O (11/25/2025) | NT$571.00 |
| Hua Hong Semiconductor Ltd (1347.HK) | E (03/12/2026) | HK$95.60 |
| Iluvatar CoreX Semiconductor Co., Ltd. (9903.HK) | O (04/27/2026) | HK$92.25 |
| King Yuan Electronics Co Ltd (2449.TW) | O (03/03/2023) | NT$304.50 |
| MediaTek (2454.TW) | O (11/28/2025) | NT$4,690.00 |
| MetaX Integrated Circuits (688802.SS) | E (04/27/2026) | Rmb467.58 |
| Nanya Technology Corp. (2408.TW) | O (05/28/2026) | NT$532.00 |
| OmniVision Integrated Circuits Group Inc (603501.SS) | E (11/17/2025) | Rmb78.96 |
| Phison Electronics Corp (8299.TWO) | E (02/25/2026) | NT$2,060.00 |
| SG Micro Corp. (300661.SZ) | E (11/03/2025) | Rmb96.00 |
| Silergy Corp. (6415.TW) | U (05/19/2026) | NT$462.50 |
| SMIC (0981.HK) | O (10/21/2025) | HK$56.80 |
| TSMC (2330.TW) | O (02/07/2022) | NT$2,550.00 |
| UMC (2303.TW) | O (05/19/2026) | NT$147.50 |
| Vanguard International Semiconductor (5347.TWO) | E (01/14/2026) | NT$186.50 |
| WIN Semiconductors Corp (3105.TWO) | E (10/08/2026) | NT$581.00 |
| Daisy Dai, CFA | ||
| ASMPT Ltd (0522.HK) | O (07/24/2025) | HK$163.80 |
| China Resources Microelectronics Limited (688396.SS) | U (03/02/2026) | Rmb52.02 |
| Empyrean Technology Co Ltd (301269.SZ) | E (01/17/2025) | Rmb85.45 |
| Hangzhou Silan Microelectronics Co. Ltd. (600460.SS) | U (08/25/2025) | Rmb29.64 |
| Hygon Information Technology Co., Ltd. (688041.SS) | O (07/03/2026) | Rmb220.53 |
| Innoscience (2577.HK) | E (10/13/2025) | HK$37.20 |
| JCET Group Co Ltd (600584.SS) | O (09/16/2026) | Rmb62.60 |
| Shanghai Fudan Microelectronics (1385.HK) | O (03/07/2025) | HK$24.16 |
| SICC Co Ltd (688234.SS) | O (03/20/2026) | Rmb102.50 |
| SJ Semiconductor Corp (688820.SS) | E (09/16/2026) | Rmb105.95 |
| StarPower Semiconductor Ltd (603290.SS) | E (05/14/2026) | Rmb78.85 |
| Unigroup Guoxin Microelectronics Co Ltd (002049.SZ) | U (01/10/2023) | Rmb56.14 |
| Universal Scientific Ind. (Shanghai) (601231.SS) | O (11/05/2025) | Rmb23.07 |
| Yangjie Technology (300373.SZ) | O (06/10/2022) | Rmb81.00 |
| Daniel Yen, CFA | ||
| AP Memory Technology Corp (6531.TW) | O (07/11/2025) | NT$980.00 |
| ASMedia Technology Inc (5269.TW) | U (10/03/2025) | NT$1,490.00 |
| Aspeed Technology (5274.TWO) | O (06/09/2025) | NT$17,485.00 |
| Egis Technology Inc (6462.TWO) | E (01/28/2026) | NT$100.50 |
| Elan Microelectronics Corp (2458.TW) | O (10/03/2025) | NT$132.00 |
| eMemory Technology Inc (3529.TWO) | O (08/18/2026) | NT$2,915.00 |
| Espressif Systems (688018.SS) | O (05/15/2023) | Rmb117.65 |
| GigaDevice Semiconductor Beijing Inc (603986.SS) | O (05/15/2025) | Rmb334.40 |
| Macronix International Co Ltd (2337.TW) | O (09/18/2025) | NT$116.00 |
| Montage Technology Co Ltd (6809.HK) | O (03/18/2026) | HK$273.40 |
| Montage Technology Co Ltd (688008.SS) | O (03/18/2026) | Rmb197.01 |
| Novatek (3034.TW) | U (02/04/2026) | NT$531.00 |
| Nuvoton Technology Corporation (4919.TW) | U (11/10/2025) | NT$155.50 |
| Parade Technologies Ltd (4966.TWO) | O (05/27/2026) | NT$558.00 |
| Powerchip Semiconductor Manufacturing Co (6770.TW) | O (10/27/2025) | NT$72.20 |
| Realtek Semiconductor (2379.TW) | E (01/30/2026) | NT$749.00 |
| Shenzhen Goodix Technology Co Ltd (603160.SS) | U (07/14/2025) | Rmb51.55 |
| Winbond Electronics Corp (2344.TW) WPG Holdings (3702.TW) | O (05/28/2026) | NT$177.00 NT$117.50 |
| O (03/16/2026) | ||
| WT Microelectronics Co. Ltd. (3036.TW) | O (01/27/2026) | NT$215.50 |
| Duan Liu - Dosilicon Co Ltd (688110.SS) - Shenzhen Longsys Electronics Co Ltd (301308.SZ) | U (09/06/2024) - E (02/25/2026) | Rmb105.73 - Rmb288.60 |
|---|---|---|
| Henry Zhao | ||
| ACM Research Inc (ACMR.O) | O (03/07/2023) | US$70.80 |
| Advanced Micro-Fabrication Equipment Inc (688012.SS) | O (11/06/2023) | Rmb313.24 |
| Maxscend Microelectronics Co Ltd (300782.SZ) | U (01/11/2021) | Rmb64.65 |
| NAURA Technology Group Co Ltd (002371.SZ) | O (11/06/2023) | Rmb600.32 |
| Tiffany Yeh | ||
| AllRing Tech Co. (6187.TWO) | O (09/23/2025) | NT$1,525.00 |
| FOCI Fiber Optic Communications Inc (3363.TWO) | E (10/08/2026) | NT$667.00 |
| Himax Technologies Inc (HIMX.O) | E (02/04/2026) | US$13.26 |
| Hon Precision (7769.TW) | O (04/17/2026) | NT$5,925.00 |
| MPI Corporation (6223.TWO) | O (04/17/2026) | NT$5,575.00 |
| Silicon Motion (SIMO.O) | O (05/06/2024) | US$261.89 |
| WinWay Technology Co Ltd (6515.TW) | O (04/17/2026) | NT$5,615.00 |
- Historical prices are not split adjusted
© 2026 Morgan Stanley