PDF 原檔:260520_ms_rubin-rack-BOM_original.pdf
原始內容
M May 20, 2026 09:00 PM GMT
Greater China Technology Hardware | Asia Pacific
Analysis of Rubin rack BOM, component content, and ODM value-added
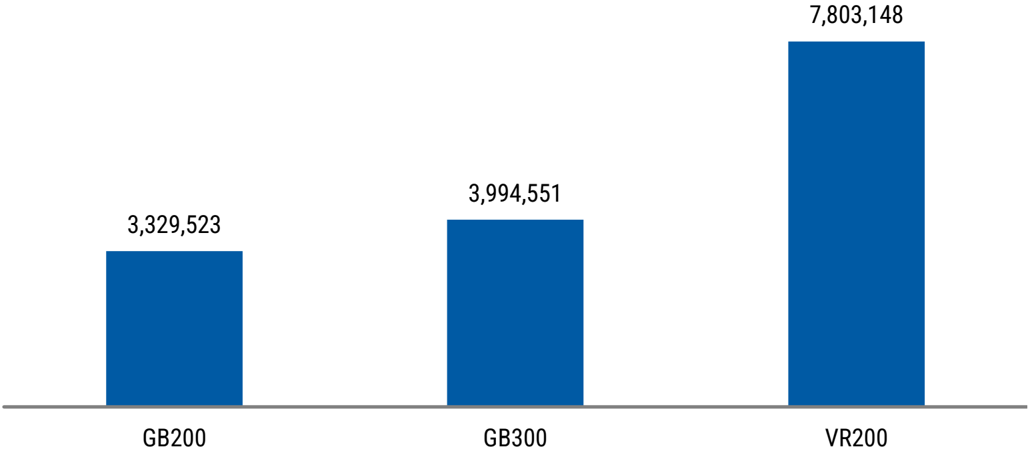
Rubin rack ASP is at ~US$7.8M buying from ODMs; price point is higher buying from OEMs. Biggest downstream content increase comes from PCB (+233%), MLCC (+182%), ABF (+82%), Power (+32%), and Cooling (+12%). But ODM value-added will also increase 35-40%, contrary to market view.
The Rubin rack will cost ~US$7.8M: This is the price hyperscalers will be paying for a Rubin rack from ODMs; the price of a Rubin rack will be even higher if bought from OEMs (i.e., Lenovo, Asustek, Giga-Byte, Dell, etc). Most components will enjoy a rise in content, driven by increased complexity, computing density, and power density, among other things. Within the downstream components made by companies we cover, we estimate that PCB content will increase the most vs. Blackwell (+233%), followed by MLCC (+182%), ABF substrates (+82%), power (+32%), and cooling (+12%).
Rubin ODM value-added will also increase 35-40%: Our bottom-up analysis aligns with what Wistron's management said on its 4Q earnings call: that ODM valueadded in dollar terms would increase for Rubin. The 35-40% increase is spread throughout the rack, with increased complexity across the computing board, computing tray, switch board, switch tray, cooling components, and rack-level assembly, as well as new boards to assemble/test. But there are other things ODMs can do that are not captured in our numbers. That said, based on the numbers that our analysis captures, the implied GM for a Rubin rack is ~1.9% (vs. ~2.7% for GB300). Again, however, we think investors should focus on the increase in absolute dollar profitability and not the decline in margins.
More ODMs are talking about the consignment business model: Hon Hai was the first to mention it, during its 4Q25 call. And at its 1Q26 earnings call, Quanta also mentioned that it expects some projects to shift over to a consignment business model in 2H26. It looks like this shift is slowly happening, and more customers are willing to help share the increased working capital burden. It remains unclear what percentage of projects will shift to consignment, but we do view this trend positively over the long-term.
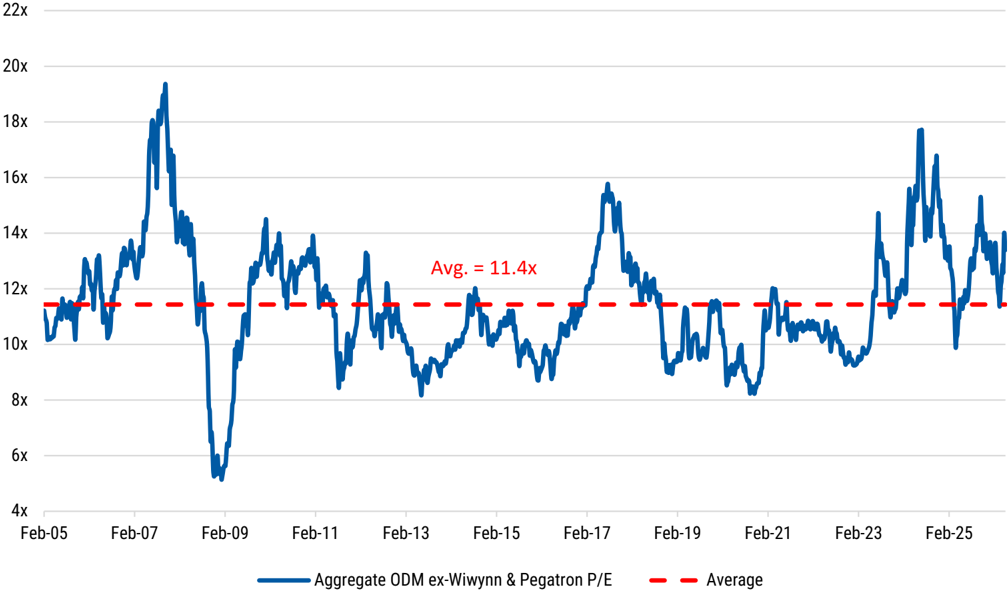
Our post-earnings ODM preference: Wiwynn is our Top Pick in ODMs, followed by Wistron > Quanta > Hon Hai, based on upside to our price targets. Risk-reward for the ODM cohort still looks attractive at only ~13x CY27e P/E on average vs. the ~11.5x average over the past ~20 years. For component suppliers, we like Delta, AVC, Unimicron, ZDT, and FIT.
Idea
Morgan Stanley Taiwan Limited+
Howard Kao
Equity Analyst
Howard.Kao@morganstanley.com
+886 2 2730-2989
Irene Yen
Research Associate
Irene.Yen@morganstanley.com
+886 2 2730-2869
Sharon Shih
Equity Analyst
Sharon.Shih@morganstanley.com
+886 2 2730-2865
Greater China Technology Hardware
Asia Pacific Industry View
In-Line
Morgan Stanley does and seeks to do business with companies covered in Morgan Stanley Research. As a result, investors should be aware that the firm may have a conflict of interest that could affect the objectivity of Morgan Stanley Research. Investors should consider Morgan Stanley Research as only a single factor in making their investment decision.
For analyst certification and other important disclosures, refer to the Disclosure Section, located at the end of this report.
+= Analysts employed by non-U.S. affiliates are not registered with FINRA, may not be associated persons of the member and may not be subject to FINRA restrictions on communications with a subject company, public appearances and trading securities held by a research analyst account.
M
Bottom-Up Analysis of VR200 Rack BOM
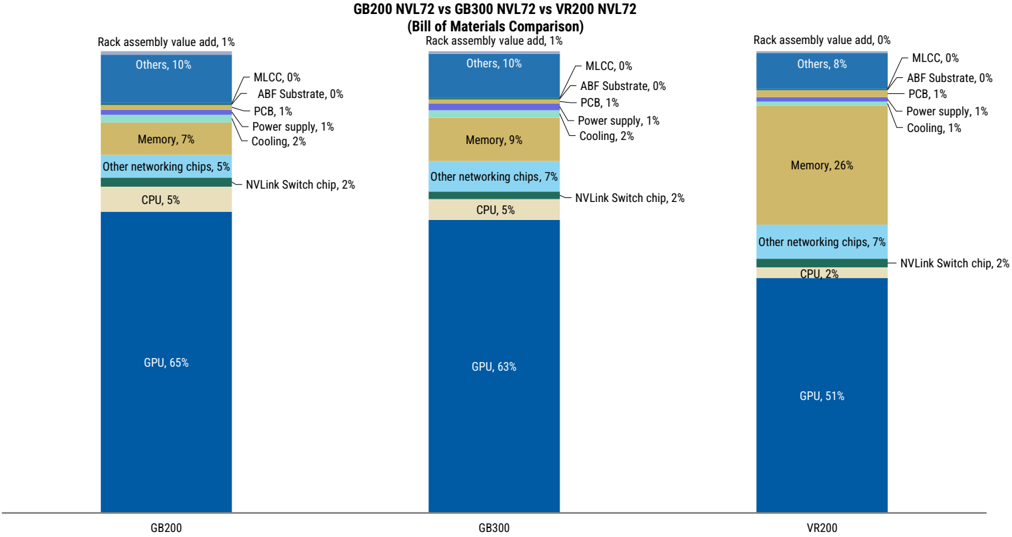
We estimate that a Rubin rack will cost ~US$7.8M, if bought from the ODMs: A big portion of the increase in rack cost is from memory prices, which have increased materially since Nvidia first launched GB200 NVL72. With the old memory prices, memory was only 5-10% of GB200 NVL72 rack bill of materials - but with the increased memory content and significantly higher pricing now, we estimate that memory is now 25-30% of the VR200 rack bill of materials. This drives the GPU content down from ~65% in GB200 to ~51% for VR200. This rack ASP is our estimate for what the ODMs will charge/receive from the cloud customers, but the pricing from the OEMs (i.e., Lenovo, Asustek, Giga-Byte, Dell, etc.) will be even higher, after including brand profit and other charges, which will vary by company.
Hyperscalers could be buying the SOCAMM themselves: Our base case is that Nvidia will buy the SOCAMM that goes onto the Rubin compute board, and resell at a 70% GM. In this base case scenario, the Rubin rack ASP would be ~US$7.8M, as mentioned above and throughout the note. However, in the scenario where the SOCAMMs are acquired by the hyperscalers directly, the rack ASP would drop to ~US$6.7M for a Rubin rack.
Exhibit 1: Owing to recent increase in memory prices, memory will become 25%+ of the rack BOM for Rubin
Source: Morgan Stanley Research estimates.
M
Exhibit 2: We estimate the new upcoming VR200 rack ASP to be ~US$7.8mn
Nvidia NVL72 Rack ASP (US$)
Source: Morgan Stanley Research estimates.
Memory is not the only component showing a content increase: In our coverage, cooling components, power supply, PCB, ABF substrates, and MLCC, among others, are also all showing content increases. Other than a meaningful increase in memory content for the Rubin, for downstream components made by companies under our coverage, we see the biggest content increase for PCB (+233%), followed by MLCCs (+182%), ABF substrates (+82%), power supply (+32%), and cooling (+12%). And we believe the pure rack assembly value-added will also increase, ~30%, driven by increased complexity of the rack design.
Exhibit 3: We estimate that a single VR200 NVL72 rack will cost ~US$7.8M
| Nvidia NVL72 Bill of Materials | GB300 | VR200 | Diff. |
|---|---|---|---|
| GPU | $2,520,000 | $3,960,000 | 57% |
| CPU | $180,000 | $180,000 | 0% |
| NVLink Switch chip | $64,800 | $144,000 | 122% |
| Other networking chips | $261,000 | $576,000 | 121% |
| Memory | $373,939 | $2,001,600 | 435% |
| Cooling | $64,610 | $72,080 | 12% |
| Power supply | $57,600 | $76,000 | 32% |
| PCB | $35,100 | $116,730 | 233% |
| ABF Substrate | $11,160 | $20,340 | 82% |
| MLCC | $1,530 | $4,320 | 182% |
| Others | $402,412 | $623,278 | 55% |
| Rack assembly value add | $22,400 | $28,800 | 29% |
| Total | $3,994,551 | $7,803,148 | 95% |
Source: Morgan Stanley Research estimates.
M
Rubin PCB content is rising meaningfully
Rubin PCB content is showing the biggest increase amongst downstream components:
Based on our supply chain checks, we see PCB content increasing massively, 233%+, for Rubin v. GB300. This would bring total PCB content up to ~US$117K, vs only just ~US$35K in GB300, which would be a big tailwind for the PCB suppliers, including Unimicron and ZDT in our coverage.
This meaningful jump in content is driven by an increase in PCBs, with the introduction of new modules like the ConnectX module and the midplane PCB, but there is an increase in layer count and CCL-grade for PCBs as well. For example, the computing board for Rubin is now a 26L board vs a 22L HDI PCB in GB300, and the CCL-grade is upgraded to M8 vs. M7 for Blackwell.
In addition, the dimensions of the computing board are also slightly larger in Rubin vs. Blackwell. Moreover, the switch tray PCB for Rubin is now a 32L PCB vs a 24L PCB for Blackwell.
All of this adds to the meaningful increase in PCB content. There is also a new midplane PCB in the computing tray (44L) that was previously not found in the GB300 rack, which also adds to the content growth.
Exhibit 4: VR200 PCB Content is 200%+ higher than that of GB300
| PCB ASP per board (US$) | GB300 | VR200 |
|---|---|---|
| Compute PCB | $650 | $1,400 |
| Switch PCB | $800 | $1,450 |
| Midplane PCB | $0 | $1,500 |
| BlueField PCB | $0 | $255 |
| ConnectX PCB | $0 | $270 |
| Other peripheral PCB | $50 | $50 |
| PCB Units per rack | GB300 | VR200 |
| Compute PCB | 36x | 36x |
| Switch PCB | 9x | 9x |
| Midplane PCB | 0x | 18x |
| BlueField PCB | 18x | 18x |
| ConnectX PCB | 0x | 72x |
| Other peripheral PCB | 90x | 45x |
| Total PCB Content per rack | GB300 | VR200 |
| Compute PCB | $23,400 | $50,400 |
| Switch PCB | $7,200 | $13,050 |
| Midplane PCB | $0 | $27,000 |
| BlueField PCB | $0 | $4,590 |
| ConnectX PCB | $0 | $19,440 |
| Other peripheral PCB | $4,500 | $2,250 |
| Total PCB Content per rack | $35,100 | $116,730 |
Source: Morgan Stanley Research estimates.
MLCC is showing a significant content increase
Based on our latest estimates, we estimate MLCC content for VR200 to be ~US$4.3K:
M
This would present a quite meaningful increase vs. GB300 at only ~US$1.5K, and could explain why high-end AI server MLCC demand is currently so strong and causing all the ODMs to aggressively trying to secure and build as much inventory as possible, ahead of the Rubin rack ramp from 2H26 on wards.
Our checks indicate that the MLCC content per computing board and switch board is increasing quite meaningfully, with the computing board MLCC content showing a larger content increase. In addition, the newly introduced BlueField and ConnectX modules will also contribute to more MLCC content per rack.
Exhibit 5: VR200 MLCC content is 180%+ higher compared to GB300
| MLCC content per board (US$) | GB300 | VR200 |
|---|---|---|
| Compute PCB | $25 | $90 |
| Switch PCB | $20 | $45 |
| BlueField DPU Module | $5 | $5 |
| ConnectX Orchid Module | $5 | $5 |
| Other peripheral PCB | $5 | $5 |
| Units per rack | GB300 | VR200 |
| Compute PCB | 36x | 36x |
| Switch PCB | 9x | 9x |
| BlueField DPU Module | 0x | 18x |
| ConnectX Orchid Module | 0x | 72x |
| Other peripheral PCB | 90x | 45x |
| Total MLCC Content per rack | GB300 | VR200 |
| Compute PCB | $900 | $3,240 |
| Switch PCB | $180 | $405 |
| BlueField DPU Module | $0 | $90 |
| ConnectX Orchid Module | $0 | $360 |
| Other peripheral PCB | $450 | $225 |
| Total MLCC Content per rack | $1,530 | $4,320 |
Source: Morgan Stanley Research estimates.
We estimate that ABF substrate content is also growing, driven by higher ASP per substrate and increased number of substrates
We estimate that ABF substrate content for VR200 will increase ~82% vs. GB300:
Aside from content increases for the substrates themselves per chip, such as for the Rubin GPU and Vera CPU vs. its predecessor, there is also an increased number of substrates used per Rubin rack. This is because there are 2x more NVLink and ConnectX chips in the Rubin system vs. the Blackwell system. According to Morgan Stanley analyst Shoji Sato, the Rubin GPU ABF substrate ASP will rise to ~US$200 per chip. which is up 100% vs. Blackwell at ~US$100 of substrate content per chip.
design rack
rack
Current
2026
M
2027
HVDC Standalone power rack
400V AC >> 800V DC
400V AC >> 800V DC
Vera Rubin CPX version
Exhibit 6: VR200 ABF Substrate content is 80%+ higher compared to GB300
Oberon
| ABF Substrate ASP per chip (US$) | GB300 | VR200 |
|---|---|---|
| GPU | $100 | $200 |
| CPU | $50 | $60 |
| NVSwitch ASIC | $30 | $30 |
| BlueField DPU | $30 | $30 |
| ConnectX chip | $30 | $30 |
| ABF Units per rack | GB300 | VR200 |
| GPU | 72x | 72x |
| CPU | 36x | 36x |
| NVSwitch ASIC | 18x | 36x |
| BlueField DPU | 18x | 18x |
| ConnectX chip | 36x | 72x |
| Total ABF Content per rack | GB300 | VR200 |
| GPU | $7,200 | $14,400 |
| CPU | $1,800 | $2,160 |
| NVSwitch ASIC | $540 | $1,080 |
| BlueField DPU | $540 | $540 |
| ConnectX chip | $1,080 | $2,160 |
| Total ABF Content per rack | $11,160 | $20,340 |
Source: Morgan Stanley Research estimates.
380kW+
18.3KW
US$398,160
US$1.05
Clear AI server power upgrade path
Our latest supply chain checks suggest that besides the standard 110kW power shelf to be featured in the Vera Rubin platform, one US CSP is adopting HVDC standalone power rack in the Vera Rubin platform. For large-scale adoption, we expect 800V DC to be adopted in Nvidia's Rubin Ultra platform, scheduled for 2H27. Delta is also working with at least three US CSP customers on HVDC platform adoption in ASIC power rack projects, with initial rollout expected starting 2H26.
Exhibit 7: AI server power solution roadmap to 800 VDC architecture
Source: Morgan Stanley Research
Vera Rubin Ultra
Kyber
600kW
30kW
>10x
Liquid cooling content value growth
Vera Rubin server racks will be fully liquid-cooled: the fan-less design would increase the
tray
Thermal value per Vera Rubin NVL 144 rack
NVQD
M
-
per compute tray
Tray manifold
Cold plate module - Bottom Half
-
per compute tray
NVQD
-
per compute tray
Floating mount
-
per compute tray
Thermal value per compute tray
-
of compute tray per rack
Thermal value for compute tray per rack
Switch tray
Cold plate module
-
per switch tray
NVQD
-
per compute tray
Floating mount
-
per compute tray
Others
Thermal value per compute tray
-
of switch tray per rack
Thermal value for switch tray per rack total thermal content value per rack
Слила. Алемак Сакіли Палалел sotimatal
$
$
$
BOM (US$)
400
800
20
offering value per tray via incremental addition of tray manifolds, QD usage, and cold plate design in bottom-half components, such as switch poles and peripheral components.
Assuming that Vera Rubin racks' computing trays continue to adopt the Bianca board design, we expect the cold plate content value for the computing board half of the tray to decrease in view of the design standardization. Our channel checks suggest that the design change in gold plating has not been fully confirmed.
Along with rack manifolds equipped per rack, we forecast that the total thermal content value per rack amounts to US$72,080.
Exhibit 8: Liquid cooling component value for Vera Rubin computing tray and switch tray unit
| 2 $ 400 |
|---|
| $ 18 $ 20 360 |
| 50 |
| 2 $ 100 |
| $ 920 |
| $ 8,280 |
| $ 57,780 |
$
Source: Morgan Stanley Research estimates
200
2
M
Exhibit 9: VR200 Cooling Content (ex-Side-car CDU) is 12%+ higher than that of GB300
| Cooling content (US$) | GB300 | VR200 |
|---|---|---|
| Cooling (In-tray only) | $50,310 | $57,780 |
| Rack Manifold | $13,500 | $13,500 |
| Rack-level other cooling | $800 | $800 |
| Total cooling (ex-Side-car CDU) | $64,610 | $72,080 |
| Side-car CDU | $50,000 | $50,000 |
| Total cooling | $114,610 | $122,080 |
Source: Morgan Stanley Research estimates.
Other than components, ODM value-added Is Increasing
We also estimate ODM value-added increasing 35-40% for Rubin vs. Blackwell racks:
We think this is contrary to the market view. We believe that the market expects ODM value-added to decline for Rubin, owing to the "standardization" of the computing tray. But our analysis suggests a different outcome. We see the ODM value-added increasing thanks not only to increased complexity but also additional modules introduced in the new Rubin system, for ODMs to assemble and test.
Overall, we see a ~38% increase in ODM value-added. But there could also be other components within the rack that the ODMs may be able to provide, something that is not captured in our analysis here.
What does this imply for ODM GM? This implies that the ODM GM for GB300 is US $108,213/US$3,994,551 = ~2.7% GM, and for VR200, it is US$149,646/US$7,803,148 = ~1.9% GM. Because these racks are becoming more expensive, the margin that the ODMs are able to earn is declining, but we think the absolute dollar profitability is what is important, and that is increasing, from GB300 to VR200.
- However, we did mention above that there is a scenario where the SOCAMMs are bought by the customer directly. Under this scenario, the rack ASP would fall to ~US$6.7M (down from ~US$7.8M). Under this scenario, ODM GM would rise to ~2.2% (up from ~1.9%).
Exhibit 10: Our bottom-up analysis on ODM value-added per rack
| ODMValue-Add per rack | GB300 | VR200 |
|---|---|---|
| Compute Board Assembly/Test | $12,096 | $16,200 |
| Compute Tray Assembly/Test | $28,800 | $32,400 |
| Switch Board Assembly/Test | $2,475 | $3,150 |
| Switch Tray Assembly/Test | $2,700 | $3,150 |
| Rack Assembly/Test | $22,400 | $28,800 |
| BF DPU Assembly/Test | $1,170 | $1,170 |
| CX/Orchid Module Assembly/Test | $0 | $3,600 |
| Other peripheral boards | $3,150 | $1,260 |
| Cooling components | $12,922 | $14,416 |
| Others | $22,500 | $45,500 |
| Total ODMValue-Add | $108,213 | $149,646 |
Source: Morgan Stanley Research estimates.
M
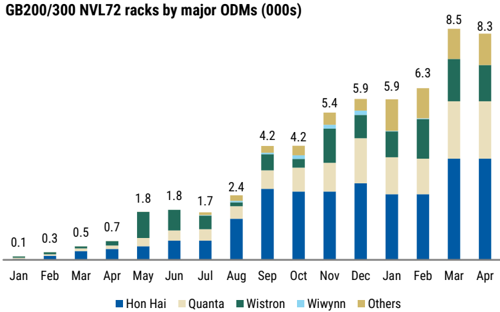
Exhibit 11: Monthly GB200/300 Rack Output (January 2025 to present)
Hon Hai
Quanta
Source: Morgan Stanley Research estimates.
Exhibit 13:
Historical P/E valuation for Taiwan's ODMs in aggregate
Aggregate ODM (ex-Wiwynn & Pegatron) P/E
Source: FactSet, Morgan Stanley Research.
Wistron
Wiwynn
Others
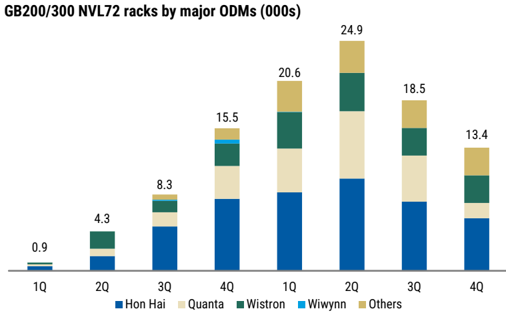
Exhibit 12: Quarterly GB200/300 Rack Output (C1Q25-4Q26e)
Source: Morgan Stanley Research estimates.
M
Exhibit 14: AI revenue exposure by different ODMS (2025 vs 2026e)
| AI Exposure | CY25 | CY26 |
|---|---|---|
| Hon Hai | 27% | 32% |
| Quanta | 50% | 68% |
| Wistron | 27% | 35% |
| Wiwynn | 48% | 44% |
| Compal | <3% | 8% |
| Pegatron | <3% | 22% |
Source: Morgan Stanley Research estimates.
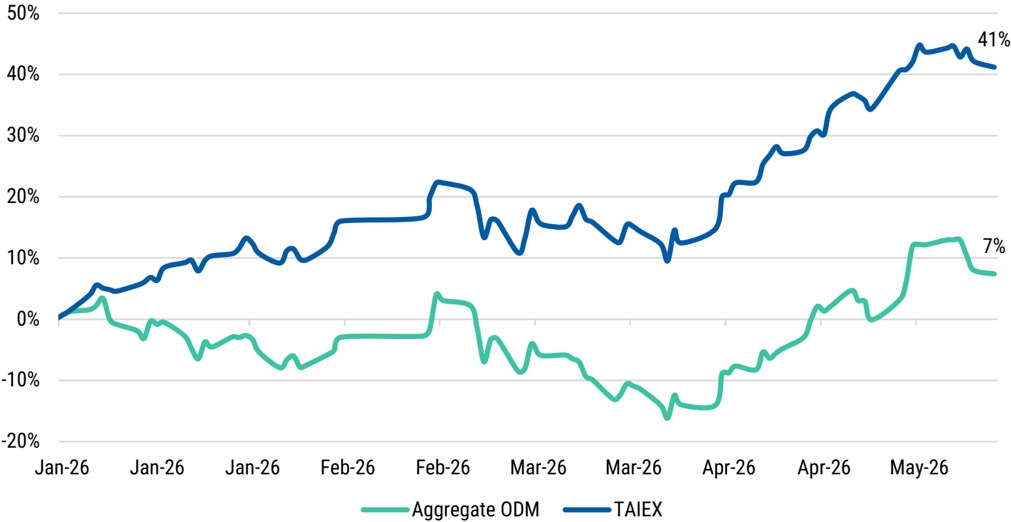
Exhibit 15: ODMs have meaningfully underperformed the TAIEX YTD
YTD Aggregate ODM vs. TAIEX Performance
Source: FactSet, TEJ.
M
Exhibit 16: Valuation comparison table for the ODMs

| ODM Ticker | Company | Closing price (LC) 5/18/2026 | Rating Price target | Market cap (US$ mn) | EPS | EPS | Current P/E (X) | Current P/E (X) | PT PEG (X) | PT PEG (X) | P/B (X) | P/B (X) | P/B (X) | P/S (X) | P/S (X) | EV/EBITDA | EV/EBITDA | ROA(%) | ROA(%) | ROE (%) | ROE (%) | ||||
|---|---|---|---|---|---|---|---|---|---|---|---|---|---|---|---|---|---|---|---|---|---|---|---|---|---|
| ODM Ticker | Company | Closing price (LC) 5/18/2026 | Rating Price target | 26E | 27E | 28E | 26E | 27E 28E | 26E | 27E 28E | 26E | 27E | 28E | 26E | 27E 28E | 26E | 27E | 28E 26E | 27E 28E | 26E 27E | 28E | ||||
| 2317.TW | Hon Hai | 248.50 | 310.00 | 109,152 | 16.38 | 19.90 | 23.03 | 15.2 | 12.5 | 10.8 0.74 | 0.58 0.69 | 1.7 | 1.6 | 1.5 | 0.4 | 0.3 0.3 | 6.7 | 5.6 4.8 | 4% 5% | 5% | 11% 13% | 14% | |||
| 2382.TW | Quanta | 300.00 | 385.00 | 36,709 | 24.66 | 28.80 | 30.80 | 12.2 | 10.4 | 9.7 0.45 | 0.62 1.41 | 3.7 | 3.1 | 2.6 | 0.3 | 0.3 0.3 | 10.1 | 8.5 7.7 | 6% | 5% | 5% | 34% 32% | 29% | ||
| 3231.TW | Wistron | 135.50 | 210.00 | 14,067 | 13.95 | 18.11 | 21.30 | 9.7 | 7.5 | 6.4 0.18 | 0.25 | 0.36 | 1.5 1.3 | 1.1 | 0.1 | 0.1 0.1 | 3.0 | 2.4 | 1.9 4% | 4% | 4% | 16% 18% | 19% | ||
| 6669.TW | Wiwynn | 5,090.00 | 7,500.00 | 27,319 | 357.51 | 466.82 | 539.38 | 14.2 | 10.9 | 9.4 0.47 | 0.36 0.61 | 5.8 | 4.4 | 3.5 | 0.6 | 0.4 0.4 | 9.7 | 7.7 6.2 | 17% | 16% | 16% | 46% 46% | 41% | ||
| 2324.TW | Compal | 28.25 | 23.00 | 4,002 | 1.98 | 2.23 | 2.63 | 14.3 | 12.7 10.7 | 0.33 | 1.02 0.59 | 0.8 | 0.8 | 0.8 | 0.1 | 0.1 0.1 | 6.2 | 5.9 | 5.2 | 2% | 2% | 2% | 6% 6% | 7% | |
| 4938.TW | Pegatron | 76.50 | 85.00 | 6,335 | 5.39 | 7.61 | 8.04 | 14.2 | 10.0 | 9.5 164.08 | 0.24 1.69 | 0.8 | 0.7 | 0.7 | 0.2 0.1 | 0.1 | 3.6 | 2.8 2.8 | 2% | 3% | 2% | 6% 7% | 8% | ||
| 2356.TW | Inventec | 52.20 | -- | 5,938 | 3.05 | 3.59 | 4.02 | 17.1 | 14.5 | 13.0 0.63 | 0.82 1.11 | 2.5 | 2.5 | 2.0 | 0.2 | 0.2 | 0.2 | 10.9 | 10.9 | 10.9 3% | 3% | NA | 15% 17% | 16% | |
| Average | 13.8 | 11.2 9.9 | 0.47 | 0.56 0.92 | 2.4 | 2.0 1.7 | 0.3 | 0.2 0.2 | 7.2 | 6.3 5.7 | 5% 5% | 6% | 19% 20% | 19% | |||||||||||
| Median | 14.2 | 10.9 | 9.7 | 0.47 | 0.58 0.69 | 1.7 | 1.6 | 1.5 | 0.2 | 0.2 | 0.2 | 6.7 | 5.9 | 5.2 | 4% 4% | 4% | 15% 17% | 16% |
Source: FactSet (for Inventec), Morgan Stanley Research estimates (for the other ODMs).
M
Disclosure Section
The information and opinions in Morgan Stanley Research were prepared or are disseminated by Morgan Stanley Asia Limited (which accepts the responsibility for its contents) and/or Morgan Stanley Asia (Singapore) Pte. (Registration number 199206298Z) and/or Morgan Stanley Asia (Singapore) Securities Pte Ltd (Registration number 200008434H), regulated by the Monetary Authority of Singapore (which accepts legal responsibility for its contents and should be contacted with respect to any matters arising from, or in connection with, Morgan Stanley Research), and/or Morgan Stanley Taiwan Limited and/or Morgan Stanley & Co International plc, Seoul Branch, and/or Morgan Stanley Australia Limited (A.B.N. 67 003 734 576, holder of Australian financial services license No. 233742, which accepts responsibility for its contents), and/or Morgan Stanley Wealth Management Australia Pty Ltd (A.B.N. 19 009 145 555, holder of Australian financial services license No. 240813, which accepts responsibility for its contents), and/or Morgan Stanley India Company Private Limited having Corporate Identification No (CIN) U22990MH1998PTC115305, regulated by the Securities and Exchange Board of India ('SEBI') and holder of licenses as a Research Analyst (SEBI Registration No. INH000001105); Stock Broker (SEBI Stock Broker Registration No. INZ000244438), Merchant Banker (SEBI Registration No. INM000011203), and depository participant with National Securities Depository Limited (SEBI Registration No. IN-DP-NSDL-567-2021) having registered office at Altimus, Level 39 & 40, Pandurang Budhkar Marg, Worli, Mumbai 400018, India; Telephone no. +91-22-61181000; Compliance Officer Details: Mr. Tejarshi Hardas, Tel. No.: +91-22-61181000 or Email: tejarshi.hardas@morganstanley.com; Grievance officer details: Mr. Tejarshi Hardas, Tel. No.: +91-22-61181000 or Email: msic-compliance@morganstanley.com which accepts the responsibility for its contents and should be contacted with respect to any matters arising from, or in connection with, Morgan Stanley Research, and their affiliates (collectively, "Morgan Stanley"). Morgan Stanley India Company Private Limited (MSICPL) may use AI tools in providing research services. All recommendations contained herein are made by the duly qualified research analysts.
For important disclosures, stock price charts and equity rating histories regarding companies that are the subject of this report, please see the Morgan Stanley Research Disclosure Website at www.morganstanley.com/eqr/disclosures/webapp/generalresearch, or contact your investment representative or Morgan Stanley Research at 1585 Broadway, (Attention: Research Management), New York, NY, 10036 USA.
For valuation methodology and risks associated with any recommendation, rating or price target referenced in this research report, please contact the Client Support Team as follows: US/Canada +1 800 303-2495; Hong Kong +852 2848-5999; Latin America +1 718 754-5444 (U.S.); London +44 (0)20-7425-8169; Singapore +65 6834-6860; Sydney +61 (0)2-9770-1505; Tokyo +81 (0)3-6836-9000. Alternatively you may contact your investment representative or Morgan Stanley Research at 1585 Broadway, (Attention: Research Management), New York, NY 10036 USA.
圖片清單(已驗證 2026-07-02)
回補驗證:僅涵蓋已被 lib 頁嵌入的圖片,非全量驗證。
| 檔名 | size | 分類 | 親眼所見內容 |
|---|---|---|---|
260520_ms_rubin-rack-BOM_page6.png |
464KB | 真資料圖 | Exhibit 6:ABF substrate ASP per chip 表格,GB300 vs VR200 各元件(GPU/CPU/NVSwitch ASIC/BlueField DPU/ConnectX chip)ASP、units per rack、total ABF content per rack 數字比較,總計 GB300 $11,160 vs VR200 $20,340;下方 Exhibit 7 為 AI server power solution roadmap 時間軸表格(Current/2026/2027),列出 server power supply design、AC-DC conversion、Nvidia GPU generation、rack architecture、power wattage 等欄位 |
260520_ms_rubin-rack-BOM_page7.png |
710KB | 真資料圖 | Exhibit 8:Liquid cooling component value for Vera Rubin computing tray and switch tray 表格,列出 Compute tray (Bianca) 與 Switch tray 各零件(cold plate module、NVQD、tray manifold、floating mount 等)unit 數與 BoM (US$),總計 total thermal content value per rack US$57,780 |