PDF 原檔:報告_Aletheia_PCB與CCL產業_ISU_TTM_台光電_20261004_original.pdf
圖片清單(已驗證 2026-10-04)
| 檔名 | size | 分類 | 親眼所見內容 |
|---|---|---|---|
| _001.png | 36KB | 真資料圖 | Google Cloud backlog 柱狀圖(1Q24–2Q26,US$bn)加 YoY 折線;1Q26 約 460、2Q26 約 515,YoY 約 400% |
| _002.png | 17KB | 真資料圖 | TPU 出貨量柱狀圖(百萬顆):2025 約 3.3、2026E 約 3.6、2027E 8.5、2028E 12 |
| _005.png | 21KB | 真資料圖 | TPU V8i 拓撲:2 顆 Compute Die N3E、8 顆 HBM3E、1 顆 I/O N4、2 顆 Dummy |
| _006.png | 32KB | 真資料圖 | TPU V9 拓撲:4 顆 Compute Die N2P、4 顆 Core logic、4 顆 I/O N3P、12 顆 HBM4E |
| _007.png | 106KB | 真資料圖 | Multi-lam 與 HDI 對照表:Multi-lam 30–50L+,用於 AI 加速器、交換器、網通,強項為高層數、大板、電源/訊號分離(N+M);HDI 20–40L,用於更先進的 AI 加速器,強項為細線路與高密度互連 |
| _008.png | 141KB | 真資料圖 | TPU8 網路拓撲(docling 誤標為 MLCC 圖):Jupiter 南北向(100G SerDes 乙太交換器+OCS)、Global WAN;TPU8i(Sunfish)Boardfly、每 pod 最多 1,152 顆;TPU8t(Zebrafish)3D Torus、每 pod 9,600 顆、14 pod 合成 134,400 顆的 Virgo cluster(200G SerDes 乙太交換器) |
| _009.png | 279KB | 真資料圖 | 標準 HDI 製程(L/S>30µm:填孔電鍍→乾膜壓合→蝕刻→去膜)與 mSAP(L/S<30µm:乾膜壓合→填孔電鍍→去膜→快速蝕刻)流程剖面對照 |
| _010.png | 21KB | 未判讀(<40KB) | 文中為 PCB 樹脂 Dk/Df 比較圖位置 |
| _011.png | 85KB | 真資料圖 | 傳統可插拔光模組 vs CPO:PCB 上交換器 ASIC 與光模組距離 11–12 吋造成 40dBm→20dBm 訊號損失;CPO 把光引擎放在 ASIC 旁(interposer 上) |
| _012.png | 76KB | 真資料圖 | ISU Petasys 12 個月 forward PER band(Dec-20 至 Dec-26,10x–50x),股價 2025 底約 150,000 韓元後回落至約 120,000 |
| _013.png | 70KB | 真資料圖 | TTM 營收結構:左圖占比(A&D 46%→25%、Data Center and Networking 27%→62%,2024–2028E),右圖金額(US$mn,2028E 約 7,900) |
| _014.png | 207KB | 真資料圖 | TTM PCB 產品路線圖四象限:N+M 非對稱 PCB(量產中)、超高層 midplane/backplane(1–2 年內量產)、光學 PCB 與封裝(開發中)、CoWoP 先進封裝(SLP 承載 interposer、HBM、GPU/CPU,開發中) |
| _015.png | 153KB | 裝飾·logo·banner | TTM 國防垂直整合示意(PCB+元件=模組+軟體+機箱=整合系統),產品照片拼貼 |
| _016.png | 237KB | 裝飾·logo·banner | TTM 國防領域定位(太空/空中/海上/陸地 × 現有位置與成長領域),照片拼貼文字卡 |
| _017.png | 80KB | 真資料圖 | TTM 12 個月 forward PER band(2016–2026,5x–30x),2026 年中一度衝破 30x 至約 US$220 後回落至約 US$125 |
| _018.png | 84KB | 裝飾·logo·banner | Aletheia 全球據點地圖 |
| _003/_004.png | 10–13KB | 未判讀(<40KB) | 文中為 TPU compute tray/networking tray 價值量變化圖位置 |
原始內容
58837
Advanced Materials - PCB & CCL
AI
Companies: ISU Petasys, TTM Technologies, Elite Material
No CNY
USD
0.089
www.aletheia-capital.com
0.135
Shaotang Lee
+852 9193 6990
shaotang.lee@aletheia-capital.com
Warren Lau
+852 2534 7404
warren.lau@aletheia-capital.com
Skye Chen
+852 2534 7404 skye.chen@aletheia-capital.com
STOCK INFORMATION
| US$ bn | ISU Peta | TTM | EMC |
|---|---|---|---|
| M.cap | 6.6 | 13.9 | 58.2 |
| Rating | Buy | Buy | Buy |
| TP | ₩270k | $236 | TWD10k |
| Upside | 123% | 79% | 93% |
KEY VALUATION MATRIX (2 Oct '26)
| FYE Dec | ISU Peta | TTM | EMC |
|---|---|---|---|
| PER (x) | |||
| FY26E | 32.2 | 27.5 | 40.3 |
| FY27E | 16.6 | 17.6 | 19.7 |
| FY28E | 11.2 | 13.2 | 12.8 |
| EV/EBITDA (x) | EV/EBITDA (x) | ||
| FY26E | 22.6 | 20.0 | 29.7 |
| FY27E | 12.1 | 12.8 | 14.8 |
| FY28E | 8.1 | 9.6 | 9.5 |
| EPS Growth (%) | EPS Growth (%) | ||
| FY26E | 65 | 95 | 215 |
| FY27E | 94 | 57 | 104 |
| FY28E | 48 | 33 | 54 |
Goldilocks
We resume coverage of the PCB/CCL industry, focusing primarily on Google's TPU supply chain, which we believe will deliver the strongest and most sustainable growth through 2028 and beyond. We forecast aggregate TPU volumes to more than triple between 2025/26 and 2028, far outpacing competing platforms. Critically, we project a surge in the content value of next-generation TPU ASICs. As Google integrates more advanced logic and HBM chiplets into a single compute module, we project TPU content value to increase five- to tenfold over the next three to four years. Accordingly, we estimate that the addressable PCB content value alone could quadruple from 2026 to 2029. Equally vital is Google's longstanding leadership in optical connectivity for its Superpods. The upcoming doubling of switch speeds and interconnect bandwidth will act as a secondary tailwind, further lifting PCB content value. Consequently, we expect the PCB/CCL market to experience continuous pricing power and a possibility of LTAs forming, mirroring the supply dynamics seen in the memory industry. Within the key TPU vendor matrix, we resume coverage of Isu Petasys and EMC with BUY ratings and target prices of KRW 270k and TWD 10,000, respectively. We also initiate coverage of TTMI with a BUY rating and a target price of $236. Risks include end demand, execution, and US policy on AI data centre expansion.
Why Google's TPUs?
We forecast TPU's volume to more than triple to 12m units in 2028 (8.5mn in 2027) from 3.6mn in 2026, encompassing both in-house deployment and allocations to third-party AI labs via ASIC services. The strong volume is evident by its massive $520bn cloud service backlog orders in C2Q26. At the same time, TPU is expected to quadruple in TPU V9 (mid-28) vs V8 (2H26) and could double again in V10 (2029) as Google squeezes more chiplets into its ASIC designs. The complexity of design for PCB (upgrade to 50L+ or HDI) and CCL (upgrade to M8/M9 material or even PTFE) represents at least 50%-100% expansion in ASP in each generation. Furthermore, networking is expected to see a similar upgrade trend in PCB/CCL, as scale-up architectures and bandwidth requirement rise, especially from 400Gbps to 800G/1.6Tbps.
LTA likely becomes new norm under strong demand and supply constraint
Our supply chain survey indicated increasing discussion about long-term agreements (LTA) over the PCB and CCL supply chain with CSPs. Terms may be different from vendor to vendor, and most of them are still under discussion at this stage. However, those discussions send a clear message that end users are securing high-end PCB/CCL capacity by prepayment and LTAs for the next few years, because the overall industry may continue to remain undersupplied. Also, we reckon prepayment 1) will ease supply chain pressure on capex/cash flow, 2) make the supply chain more willing to invest given longer visibility and secured shipment, and 3) improve supply chain management with better profitability. We believe this will further boost P/E for the supply chain, if LTAs are confirmed, with longer visibility and stable order backlogs.
We prefer TPU supply chain into 2027/28: buy on EMC, ISU and TTM
The TPU supply chain will be the biggest winner into 2027/28 with strong unit growth and content value upgrades. Shipments are expected to reach 8.5/12m in 2027/28 vs 3.6m in 2026. Content value per rack for PCBs is up to USD30k-40k and CCL USD12k-18k for TPU v8 (vs USD20k/7k in v7). We expect another 40%-50% in v9 with HDI adoption. We like EMC for its leading position and expect TPU/800Gbps switches to become the company's key earnings driver. We set our TP at NT$10,000, with 30x FY27/28 PER. ISU is uniquely positioned to capture these secular trends due to its high exposure to Google and networking. We have a BUY and a TP of KRW270,000 on 30x FY27/28 PER. Lastly, TTM is the best proxy in the United States to capture both AI server and national defence trends with better profitability and irreplaceability
given its industry position. We initiate with BUY with a TP of USD236 with 30x FY27/28 PER.
Title
Please refer to important disclosures and disclaimers at the end of this report. This report is intended solely for the subscriber.
Unauthorized sharing, distribution, or reproduction may violate applicable regulatory requirements and could result in legal action.
linkedin icon circleçåçæå°çµæ
facebok icon circleçåçæå°çµæ
twiter icon circleçåçæå°çµæ
58837
What matters to Google's TPU franchise
FIGURE 1: BACKLOG ORDERS OF GOOGLE COMPUTE CLOUD SERVICES ($ bn)
Source: Google & Aletheia/TAG (Sep 2026)
FIGURE 2: ESTIMATED TPU VOLUME
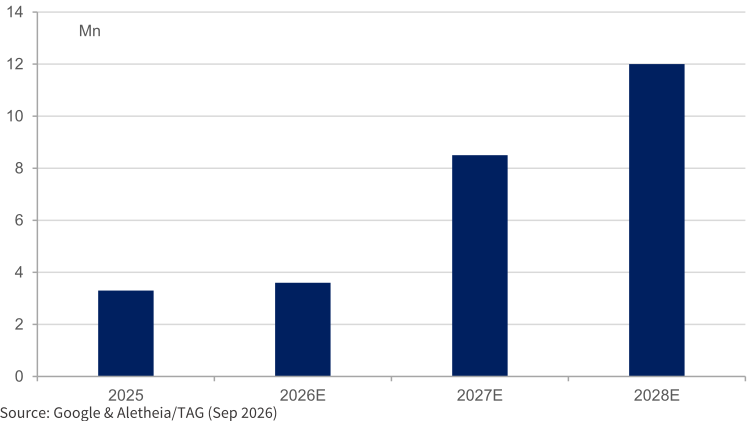
FIGURE 3A: CHG OF CONTENT VALUE IN PCB TPU COMPUTE TRAY
Source: Aletheia/TAG
4 October 2026
2
FIGURE 3B: CHG OF CONTENT VALUE IN PCB NETWORKING TRAY
4 October 2026
GPU/ASIC volume, content value and price hikes drive PCB/CCL to another strong cycle in 2027/28
We are positive on the PCB/CCL sector into 2027/28, with a strong upgrade cycle, and the whole industry will remain undersupplied because our checks indicate 1) continued AI device unit growth, supported by increasing CSP capex, 2) PCB design complexity will boost content value (increasing processing time and lowering yield rate), 3) CCL material upgrade to support higher data transmission and power supply, and 4) price hikes in the near-term because of the supply shortage and LTAs in the longer-term for a better demand outlook.
What is not in the price yet?
The sector has outperformed year-to-date, but we believe the PCB/CCL upgrade cycle will continue to surprise the market because 1) stronger AI device unit growth (especially Google TPU, of which we project 8.5/12m units in 2027/28), 2) significant content value growth via PCB design complexity (higher layer counts, advanced form factor like HDI/mSAP, longer processing time) and CCL material upgrades (M8/M9, PTFE), 3) wider AI end devices (GPU, ASIC, switch, CPU and LPU, for example) will all require high end PCBs to support performance and 4) better cash flow and profitability via prepayment and LTAs.
The overall industry is under a severe supply shortage at this stage, especially high-end products, with the key bottleneck being in upstream material (CCL, glass fiber and copper foil) as well as PCB equipment, based on our supply chain checks. The longest lead-time for certain PCB equipment (like drilling machines) can be up to 36 months, suggesting strong surge in demand from the supply chain. We don't see any sign of the tightness easing in the near term.
AI server unit growth and spec upgrade in 2027/28
We estimate GPU & ASIC volume will grow approximately 50% in CY2027 and CY2028, reaching a potential 34mn units in CY28, up from 15m units in CY26. The key driver is the expected unit surge in both CSPs' ASICs as well as AI labs, that is, OpenAI and Anthropic. Their aggregate volume is forecast to rise from 5.5mn -6mn in CY26 to reach 12mn -13mn units in CY26 and further increase to 20mn in CY28, implying a quadrupling in a three-year period. Some of the notable drivers including the following:
- ▶OpenAI's direct procurement compute power (excluding CPS and neoclouds) is expected to reach 11Gw in CY28, up from 3.3GW in CY27 and a mere 1GB in CY26. This includes AVGO'ssponsored ASIC of 1.3GW (Jalapeno) and 5GW in CY27/28 respectively, while the remaining goes to AMD (8GW in the three-year period) and, to a lesser extent, NVDA;
- ▶Similarly, Anthropic's own compute capacity is likely to reach 13GW in CY28, up sharply from CY27's 6GW. The majority of this comes from AVGO (TPU V8i and V8.5) while 5GW is supplied by AMD of in two years;
- ▶Meta is likely to build 3GW of its own compute on its ASIC (via AVGO) in CY27/28 using its MTIA400/450 ASIC. We note Meta's previous ASIC program in 2025/26 has been scaled back and pushed out so this marks the second attempt at ramping up its own silicon solution.
- ▶We estimate Google's own compute TPU volume is expected to increase to 5.5mn units in CY28 from 4mn -4.5mn in CY27 and ~3.5mn in both CY25/26. While the unit growth appears to be modest relative to the AI labs, we note the compute capacity is likely to surge given the TDP for V8 and V9 is materially higher than those of V6/7.
While NVDA's GPU volume is likely to moderate and market share is expected to decline (as most of its customers are building their own ASIC and diversifying to other suppliers), it will remain the dominant supplier to most CSPs, neoclouds and enterprises. Moreover, NVDA, along with industry is migrating to a multi-rack or large pod structure to offer aggregated
3
4 October 2026
Optimized for agentic workloads
system compute and memory. NVDA's ability to offer comprehensive GPU, CPU, LPU, storage and networking racks sustain its competitive edge in the fast-moving environment.
FIGURE 4: ESTIMATED GPU & ASIC UNIT FORECASTS (MN UNITS)
Note: 1-We assume each V8.5 (Whalefish) is eqvl of 2x V8i (Sunfish). 10GB of deployment in CY28 is 6.5mn units of V8i or 3.3m units of V8.5 (Whalefish).
| 2025 | 2026E | 2027E | 2028E | Remarks | |
|---|---|---|---|---|---|
| NVDA | 5.4 | 7.6 | 9.5 | 11.4 | There are ~1mn units of GB300 in production in CY27. The mix in CY2028 is pending on the dual- or quad-GPU Rubin Ultra and the design status of Feynman. |
| -Rubin | - | 2.0 | 6.5 | TBD | There are ~1mn units of GB300 in production in CY27. The mix in CY2028 is pending on the dual- or quad-GPU Rubin Ultra and the design status of Feynman. |
| -Rubin Ultra | - | - | 2.0 | TBD | There are ~1mn units of GB300 in production in CY27. The mix in CY2028 is pending on the dual- or quad-GPU Rubin Ultra and the design status of Feynman. |
| AMD | 1.9 | 1.6 | 2.0 | 3.0 | OAI and Anthropic recently upped orders for CY2028 |
| Google TPU | 3.3 | 3.6 | 8.5 | 12.0 1 | TPU units include Anthropic's volume via AVGO. For CY27, we expect an equal split betweet V8i&t variant in 2027 and limited volume of V8.5 (Whalefish). V9 HVM expected in mid-2028. |
| -V8i+t | - | 1.0 | 8.2 | 10.5 | TPU units include Anthropic's volume via AVGO. For CY27, we expect an equal split betweet V8i&t variant in 2027 and limited volume of V8.5 (Whalefish). V9 HVM expected in mid-2028. |
| -V9 | - | - | - | 1.5 | TPU units include Anthropic's volume via AVGO. For CY27, we expect an equal split betweet V8i&t variant in 2027 and limited volume of V8.5 (Whalefish). V9 HVM expected in mid-2028. |
| Trainium | 1.9 | 1.6 | 2.0 | 2.0 | Status of T4 TBD |
| OpenAI | - | 0.2 | 1.0 | 3.5 | 1.3/5GW deployment in CY27/28 |
| MTIA | 0.2 | 0.2 | 0.7 | 2.0 | MTIA450 more meaningful volume in 2027/28 |
| Others | 0.2 | 0.2 | 0.3 | 0.5 | Volume of Maia300/400 to be more meaningful |
| Total | 12.9 | 15.0 | 24.0 | 34.4 | Expect ~50%CAGR CY26E-28E |
Source: Aletheia/TAG estimates
AI server performance to jump significantly every generation
As shown in the table below, we see huge upgrades in compute power and TDP every generation. PCBs and CCL will upgrade along with AI server specs to reduce data loss and improve signal performance. PCB design is getting more complex from 20L -30L to 50L+ in the future or the structure will likely be migrated from HLT to HDI. For CCL, we witness a clear trend of upgrade material from M7 to M8 now and will see more adoption of the M8.5/M9 going forward, boosting the ASP (a doubling from M7 to M8; M8 to M9 also doubling).
In the future, along with strong agentic AI demand, we believe AI server design will further advance exponentially in the next two to three years. TPU's TDP is expected to grow 10x from v8 to v10 within two to three years to further drive-up PCB/CCL's content value significantly. AMD will equip PCBs with 50L+ into the MI500 generation and Open AI's aggressive hardware production pipeline will provide upside surprise to the market. We can expect PCB/CCL to upgrade accordingly. We will have a more comprehensive analysis in the next section.
FIGURE 5A: SPECIFICATIONS OF SELECTED GPU & ASIC DEVICES
| Rubin | Rubin Ultra1 (Dual-die) | MI500³ (Quad-die) | TPU V8i (Sunfish) | TPU V9i (Humufish) | OpenAl (Jalapeno) | |
|---|---|---|---|---|---|---|
| Logic | 2xN3 | 2xN3 | 4xN2+2xN3 | 2xN3P | 4xN2P+4xN3P | 1xN3P |
| I/O | 1xN3+1xN4 | 1xN3+1xN4 | 4xN3 | 1xN3E | 4xN3P | 1xN3E |
| HBM | 288GB/4 | 192GB/4² 256GB/4E | 512GB/4E³ | 288GB/3E | 384GB/4E | 216GB/4 |
| Bandwidth | 21TB/s | 21/32TB/s | Up to 66TB/s | 10-15TB/s | Up to 49TB/s | 15.4TB/s |
| TDP | 2.3kW | 2.6kW | 4.5-5kW | 600W | 4-5kW | 700W |
| FP4 | 50PFLOPs | <50PFLOPs | ~100PFLOPs | 10.1PFLOPs | N.A. | 13.4PFLOPs |
| HVM | 2H26 | 2H27 | 4Q27 | 4Q26 | Mid-28 | 4Q26 |
Note: 1-There is a quad-die Rubin Ultra SKU. 2-The final specs of Rubin Ultra are yet to be determined. At the time of writing, there are three options consisting of 192GB of HBM4 (8-Hi), 256GB HBM4E (8-Hi) and 386GB HBM4E (12-Hi).
4
4 October 2026
Optimized for agentic workloads
3-There is a dual-die (with 12-Hi) MI500 GPU likely to go to the Helios rack. The quad-die GPU is equipped with 12-Hi HBM4E.
Source: Aletheia/TAG
FIGURE 5B: SPECIFICATIONS OF SELECTED MULTI-RACKS OR PODS
| Rubin | Rubin Ultra² (Dual-die) | MI500³ (Quad-die) | TPU V8i (Sunfish) | TPU V9i (Humufish) | OpenAl (Jalapeno) | |
|---|---|---|---|---|---|---|
| Scalability | 5761 | 5761 | 512 | 1,152 | 1,6004 | 2,048 |
| Networking | Spectrum-X | Spectrum-X | T100 or S1 G300 | ICl | ICl | TH6 |
| System compute | 29EFLOPs | <29EFLOPs | 51EFLOPs | 12EFLOPs | N.A. | 27EFLOPs |
| System memory | 166TB5, 12PB/s | 111-147TB5, ~20PB/s | 262TB, 34PB/s | 332TB, 17PB/s | 614TB, 78PB/s | 432TB, 32PB/s |
| Device/tray Tray/rack | 4/18 | 4/18 | 1/16 | 4/8 | N.A. | 8/16 |
| Rack/pod | 8 | 8 | 32 | 36 | N.A. | 16 |
| TDP/rack | 225kW | 260kW | ~100kW | <80kW | N.A. | ~125kW |
| Rack HVM | 1H27 | 1H28 | 1H28 | Mid-27 | 2H28 | 2H27 |
Note: 1- We assume 8 racks as a pod, but NVL Super pod can support as many as 16 racks or 1,152 GPUs. 2-There is a quad-die RU SKU. 3-The final specs of AMD's super pod structure are yet to be finalized. There is a dual-die MI500 GPU (each comes with 8 stacks of 12-Hi HBM4E) likely to go to the Helios rack. 4-Estimate based on TPU V8i. 5-VR200 rack comes with 576TB of high-performance eSSD or 4,608TB of eSSD with eight racks pod. The eSSD density for Rubin Ultra is expected to rise further.
Source: Aletheia/TAG
Summary: PCB/CCL spec upgrade and key suppliers in AI solutions
The table below shows the key players' solution and their PCB/CCL specifications as well as major suppliers. For PCB, we see an increasing layer count from 20L-30L now to 50L+ in the coming years and moving from HLC to HDI for more complex design. Our supply chain check suggests AMD's MI500 series as well as Nvidia's LPU PCB will likely adopt 50L+ design. This represents a longer processing time with a lower yield rate, and design complexity will support further ASP hikes. For CCL, M8 is becoming a standard material for AI servers/networking and we are going to see more advanced materials into 2027/28 (M9/PTFE). CCL is the most critical component in PCB and every generation upgrade (M7 to M8, or M8 to M9) implies the ASP will nearly double.
Nvidia: It started to adopt M8 material from the GB200 NVL72. Rubin is expected to bring another modest upgrade: 1) introducing mid-plane with 44L design and M8 (or M8.5) CCL material, 2) most of the rest PCB/CCL remain on M8 with higher layer counts. The company is evaluating PTFE material for its switch board in the next generation. Also, we think Nvidia's LPU can generate incremental demand for PCB/CCL with its 52L design with M9/M8 materials. PCB suppliers for LPU will be VGT, WUS and TTM mainly, while, in our view, CCL suppliers are Shengyi (major) and EMC.
Google: TPU is expected to see the biggest upside in the PCB/CCL addressable market in 2027/28 thanks to both unit growth and content value upgrades. The next section will have a comprehensive analysis.
Amazon: Trn 3's air-cooled solution will remain at a 26L PCB design (with M8 material), while the liquid-cooled version will migrate to 40L. for Trn3 is solely EMC and TUC are the only CCL suppliers for the Trn 3. We expect to see a more significant upgrade for PCB/CCL in the next generation Trn 4 (higher layer counts, upgrade to M9?)
AMD: AMD is another key growth driver for the sector, with meaningful volume into 2027/28. The MI450, with 48L/M8 design, will start to contribute from next year and we believe AMD's MI500 series will likely adopt a 50L+ PCB design with M9 materials. This will represent a huge
5
increase in content value. SCC is its major source for PCB supply while CCL suppliers are EMC and Doosan.
OpenAI: Our supply chain checked OpenAI's Jalapeno roadmap and its pipeline to reach 1.3GW and 5GW deployment in 2027/28 is aggressive. We have limited visibility of Jalapeno's hardware specs. However, given its strong performance (~700W TDP), we can assume it will be equipped with similar specs to TPU v8 for PCB/CCL (30-40L PCB with M8 materials).
FIGURE 6: PCB/CCL SPECS AND KEY SUPPLIERS FOR AI SERVERS
| Code name | Timeline | PCB specs. | PCB suppliers | CCL specs. | CCL suppliers | |
|---|---|---|---|---|---|---|
| Nvidia | GB200 | 1H25 | 22L HDI 24L (switch) | VGT, Unimicron VGT, TTM, Unimicron (switch) | M8/M4 M8/M2 (switch) | Doosan Shengyi, EMC (switch) |
| Nvidia | GB300 | 1H26 | 22L HDI 24L (switch) | VGT, Unimicron VGT, TTM, Unimicron (switch) | M8/M4 M8/M2 (switch) M8/M4 | Doosan Shengyi, EMC (switch) |
| Nvidia | Vera Rubin | 2H26 | 26L HDI 32L (switch) 44L (mid-plane) | VGT, Unimicron, ZDT VGT, WUS, TTM, Unimicron (switch) | M8/M4 M8 (switch) M8 (mid-plane) | Doosan Shengyi, EMC, Nanya (switch) |
| Nvidia | Rubin Ultra | 2H27 | 30L HDI 32L (switch) 44L (mid-plane) | VGT, Unimicron, ZDT VGT, WUS, TTM, Unimicron, SCC (switch) | M8/M6 M8/M9+ PTFE (switch) M9 (mid-plane) | Doosan Shengyi, EMC/Taiflex (switch) |
| TPU v7 Ironwood | 1H26 | 26L | ISU, LCS, WUS, TTM | M7 | Panasonic, EMC | |
| TPU v8i Sunfish | 4Q26 | 32L M+M | ISU. LCS, WUS, TTM, Dynamic | M8/M6 | Panasonic, EMC, Nanya | |
| TPU v8t Zebrafish | 1Q27 | 34L N+M | ISU, LCS, WUS, TTM, GCE, Dynamic | M8/M6 | Panasonic, EMC, Doosan | |
| TPU v9 Humufish | 2028 | HDI | ISU, LCS, WUS, TTM, Unimicron, Dynamic | M9/M8 | Panasonic, EMC, Doosan | |
| Amazon | Trainium 2e | 1H26 | 26L | GCE, Shengyi, FHT | M8 | EMC, TUC |
| Amazon | Trainium 3 | 2H26 | 26L/40L 22L (switch) | GCE, Shengyi, FHT, WUS, ZDT | M8 | EMC, TUC |
| Amazon | Trainium 4 | 2H27 | 34L 30L (switch) | GCE, Shengyi, ZDT | M9? | EMC, TUC, Nanya |
| AMD | MI450 | 4Q26 | 48L | SCC (major), Unimicron, Dynamic | M8 | EMC, Doosan |
| AMD | MI500 | 4Q27 | 48-52L | SCC (major), Unimicron, Dynamic | M9 | EMC, Doosan |
| OpenAI | Jalapeno | 4Q26 | 40L | GCE and others | M8? | EMC, Doosan |
Source: Aletheia/ TAG
FIGURE 7: NVIDIA LPU PCB/CCL SUPPLY CHAIN
| Code name | Timeline | PCB specs. | PCB supplier | CCL specs. | CCL suppliers | |
|---|---|---|---|---|---|---|
| Nvidia | LPU | Late 2H26 | 52L | VGT, WUS, TTM | M9/M8 | Shengyi, EMC |
Source: Aletheia/TAG
4 October 2026
6
FIGURE 8A: TOPOLOGY OF TPU V8i
Google's TPU to undergo rapid spec upgrades in next several years; its PCB/CCL will benefit accordingly
The figures below illustrate the rapid production transition and specificiation advancement of Google's TPU roadmap in the next several years. We highlight the following considerations:
- The current V8i variant, which is undergoing HVM (through 1H28), receives a modest upgrade vs TPU V7 in terms of design and specification. For the latter, there are two logic dies and four HBM stacks encompassing TDP of approximately 1,000w. In TPU V8i, the TPD rises by 30% with the addition of one logic tile and two HBM stacks.
- We expect the next generation of TPU V9 to undergo a massive uplift in design complexity, TPD and compute capability. We estimate there are 12 logic dies (4x times more than V8i) and 12 HBM stacks (double that of V8i) to be the first to useTSMC's N2 process node. Given the rapid rise in chiplet quantity, we estimate the reticle size of the design to be 9.5x reticle size. The compute capability is likely to surge accordingly with the TDP of both training and inference to reach 4,500w, more than triple compared to TPU V8i. We expect TPU V9 to begin HBM in mid-2028 and run through 2029.
- We think TPU V10 will experience the next wave of significant specification and performance uplift as the number of logic chiplets rises further to 30, 2.5x vs TPU V9 and they are all to be fabicated on TSMC's N2P geometry as well as being encompassed with 3D packaging for the first time. In addition, the number of HBM stacks will rise by one-third to 16 stacks. We estimate the reticle size is likely to increase to 15x, 50% larger than TPU V9 and critically the TDP to surge to 10,000w if not higher!. TPU V10 is expected to enter HBM in 2029.
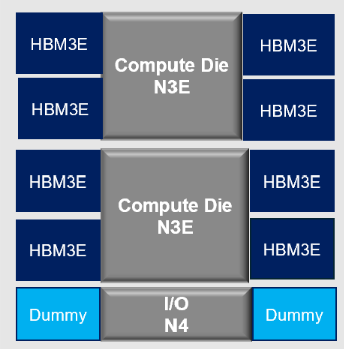
FIGURE 8B: TOPOLOGY OF TPU V9 (HUMUFISH)
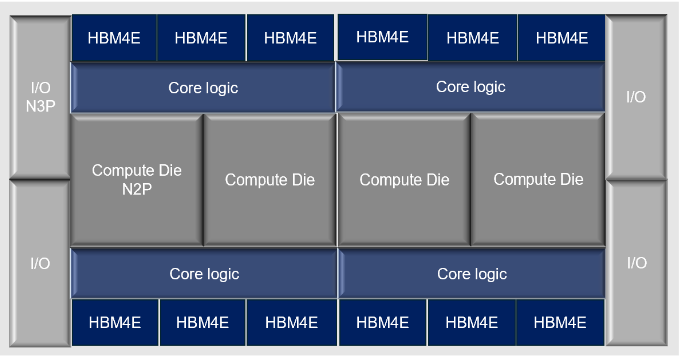
Source: Aletheia Capital/TAG
FIGURE 9: SPECIFICATIONS OF TPU'S ASIC
| Specifications | TPU V8i 2H26/27 | TPU V8.5 2H27/28 | TPU V9 Mid-28 | TPU V10 2029 |
|---|---|---|---|---|
| Compute die | 2x (N3) | 4x (N3) | 4x (N2P) | 16x (N2P) |
| Core logic/base die | - | - | 4x (N3P) | 8x (N2P) |
| I/O die | 1x (N4) | 2x (N4) | 4x (N3P) | 6x (N2P) |
| HBM | 8x (12-Hi HBM3E) | 12x (8-Hi HBM3E/4) | 12x (8-Hi HBM4E) | 16x (8-Hi HBM4E) |
| Total dies | 11x | 22x | 24x | 46x |
| 2.5D packaging | CoWoS | CoWoS | EMIB-T/penal | EMIB-T/panel |
| 3D packaging | No | No | No | Yes |
| Reticle size | ~2.5x | ~5x | 9.5x | 15x |
| Estimated TDP | ~1,300W | ~2,600W | ~4,500W | ~10,000W |
Source: Aletheia/TAG estimates
4 October 2026
7
4 October 2026
Implications for PCB/CCL
We think the TPU supply chain will enjoy the biggest growth in 2027/28 along with strong unit growth and content value upgrades among all the GPU/ASICs. Shipments are expected to reach 8.5m/12m in 2027/28 vs 3.6m in 2026. We view increasing compute power, higher HBM density, and a doubling of ICI bandwidth as pushing PCB designs toward significantly higher routing density, tighter L/S, more advanced CCL, smaller via structures, and multi-stage lamination to maintain signal integrity and shorten electrical paths.
We observed that TPU's PCB ASP has risen 2.5x from TPU V5 to V8, and 4x for the 400Gbps switch to 800Gbps. In addition, we estimate 2.6x growth in TPU unit demand from 2025E-27E and 3x expansion in the 400bps/800Gbps AI switch market by 2028 versus 2025, or 30% growth in total, making TAM growth exponential in these years.
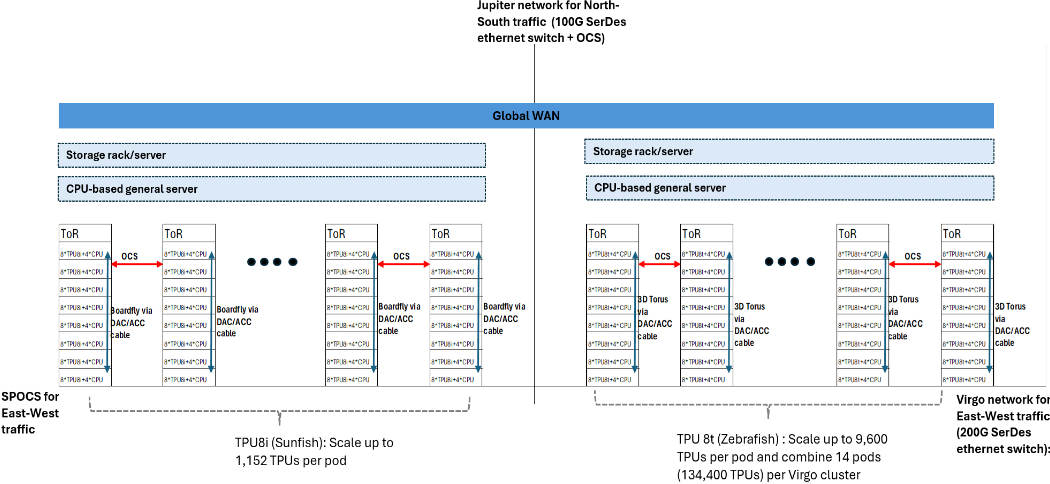
The table below illustrates the structure of Google TPU v8. One rack will contain eight compute trays, with each tray equipped with four TPUs, four NICs, four optical modules as well as two CPUs (Axiom). TOR (Top-Of-Rack)/OCS will connect those racks together to form a superpod (via the Virgo network) and the Juniper network to connect with other functions. The increasing compute power and connectivity represents significant content value growth for PCB/CCL based on those performance upgrades and data transmission.
To support the performance upgrades, TPU PCB architecture is shifting from standard multilayer (Ghostfish) to N+M structures using dual-grade CCL and multi-lamination in Zebrafish and Sunfish, and ultimately to HDI PCB in Humufish. These transitions lift PCB ASPs by 30% in Ghostfish, 80%-90% in Sunfish/Zebrafish. Based on our estimates, content value per rack for PCB is up to USD30k-40k and CCL USD12-18k for TPU v8 (vs USD20k/7k in v7). We expect another 40%-50% in Humufish with HDI adoption. Into TPU V10, given that TDP will further double to 10kW, we can assume PCB/CCL will be further upgraded to meet the higher requirement.
FIGURE 10: PCB SPECIFICATIONS FOR TPU
| ViperFish | GhostFish | SunFish | ZebraFish | HumuFish | TPU v10 | |
|---|---|---|---|---|---|---|
| CCL material grade | M5-m6 | M7 | M8 (signal) + M6 (power) | M8 (signal) + M6 (power) | M8/M9 | M9/M10 |
| Production schedule for PCB | 4Q25 | 4Q26 | 1Q27 | 2028 | 2029 | |
| Layer count | 20-22 | 26 | 32 (15+2+15) | 34 (16+2+16) | ~30-40 | TBD |
| Layer count change | - | 18% | 23% | 31% | - | - |
| Multi-layer | Multi-layer | N+M | N+M | HDI | HDI | |
| N+M sequential lamination is inherently more challenging than a standard multilayer build because it requires multiple lamination cycles, yield rates could fall by 15%-30%. | N+M sequential lamination is inherently more challenging than a standard multilayer build because it requires multiple lamination cycles, yield rates could fall by 15%-30%. | N+M sequential lamination is inherently more challenging than a standard multilayer build because it requires multiple lamination cycles, yield rates could fall by 15%-30%. | N+M sequential lamination is inherently more challenging than a standard multilayer build because it requires multiple lamination cycles, yield rates could fall by 15%-30%. | HDI PCB requires fewer layers owing to its high density, but it is more challenging than N+M because it requires multiple cycles of laser drilling, sequential buildup and ultra-fine feature formation. That would see further yield rate loss. | HDI PCB requires fewer layers owing to its high density, but it is more challenging than N+M because it requires multiple cycles of laser drilling, sequential buildup and ultra-fine feature formation. That would see further yield rate loss. | |
| ASP Index | 1 | 1.3 | 2.2 | 2.1 | 2.5 | ~5-6 |
Source: Aletheia/TAG
We see an increasing trend for adopting HDI in advanced AI acclerators: 1) it shortens highfrequency signal paths, reducing signal attenuation and latency, 2) it increases circuit density through microvia technology, including blind and buried vias, 3) it saves internal space and 4) it optimizes heat dissipation efficiency. HDI normally requires fewer layers compared to conventinal multi-lam PCB due to its higher density, but HDI PCB is still more challenging because it requires multiple cycles of laser drilling, sequential buildup, and ultra-fine feature formation. The longer processing time and lower yield rate will further drive up content value for PCB.
8
FIGURE 11: HDI IS MORE ADVANCED THAN MULTI-LAM PCB
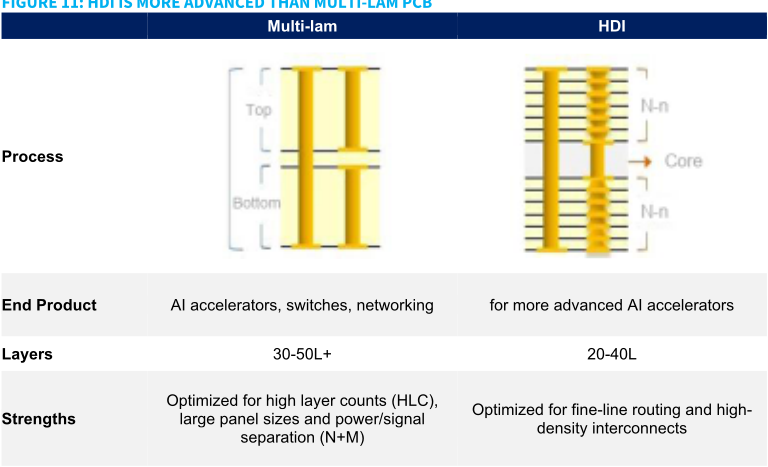
Source: Aletheia/ TAG
Increasing networking growth will be another pillar of growth
ToR (Top-of-Rack) switch demand for AI server systems is set to grow the fastest during 202628 as architectures scale-up and bandwidth requirements rise. As scale-up bandwidth increases, data move outward more quickly, shifting bottlenecks in the scale-out network. Google's TPU v8 network architecture is a good example as illustrated below.
FIGURE 12: MLCC DEMAND IN VARIOUS AI SERVERS AND GENERAL SERVERS
Source: Aletheia/TAG
4 October 2026
Adoption of 800 Gbps switches is set to accelerate in 2026-27, with CCL moving from M7 to M8 and PCB architecture shifting from multilayer to N+M. As a result, we estimate the 800 Gbps switch PCB ASP will rise ~275% to ~USD1,500 from USD350-400 in 400 Gbps systems. The layer count will increase by 35%-40%, with the remaining value uplift driven by higher-grade materials and more complex structures. For 1.6T switches, PCB ASP is
9
4 October 2026
10
expected to reach USD3,000-4,000 as the layer count expands to 44-50L and CCL upgrades to M9 (potentially mixed with M8 in power layers).
At the Hot Chips Conference, a premier annual semiconductor industry event, at Stanford University at the end of August, Google further disclosed the networking architecture for its upcoming TPU8t (Zebrafish - MediaTek) and TPU8i (Sunfish - Broadcom). In addition to upgrading its Jupiter network (north-south traffic) architecture, which connects storage, general servers, and its global WAN with higher bandwidth, lower latency, and fewer hops, Google also detailed its new Virgo network (east-west traffic). Through the co-design of network architecture, optical switching technology, and the software orchestration layer, the Virgo network facilitates scaling the maximum TPU cluster size to 1m units (up from 100,000 units in TPU v7 - Ironwood).
This upgrade highly relies on networking hardware advancements, particularly in optical communications. Our deep-dive research into Google's new TPU network architecture leads to the conclusion that demand will increase for ethernet switches and optical transceivers.
FIGURE 13: OPTICAL NETWORK HARDWARE DEMAND
| Component ratio to TPU/Pod | TPU8 | TPU7 | Remark |
|---|---|---|---|
| Ethernet switch bandwidth -Tb per TPU | 2.0 | 0.4 | |
| Transceiver modules per TPU | 3.0 | 1.8 | |
| Total OCS demand in product lifecycle (Mix of different specs.) | 258,542 | 20,833 | We assume lifecycle volume for TPU7 is 4m and TPU8 is 14-15m units. |
| Optical cable per TPU | 18.2 | 8.0 | |
| DAC/ACC cable per TPU | 1.9 | 1.5 | TPU7 uses 100Gbps per lane and TPU8 uses 200Gbps per lane. |
Source: Aletheia Capital/TAG
- For switches: TPU8 will start to use 200Gbps SerDes when it was only 100Gbps SerDes in the TPU7 generation. This will require a higher requirement of CCL Df/Dk and PCB layer count and layout. In addition, switch demand will increase to 2Tbps of bandwidth per TPU, rise from 0.4 Tbps in TPU7.
- For transceiver modules: we estimate TPU8 will adopt lots of 800Gbps transceivers and may partially adopt 1.6Tbps transceivers. In addition to that, transceiver module demand per TPU could rise to 3.0-3.5 from 1.8 in TPU7.
FIGURE 14: PCB SPECIFICATIONS FOR SWITCH
| 100 Gbps | 400 Gbps | 800 Gbps | 1.6 Tbps | |
|---|---|---|---|---|
| CCL material grade | M6 | M7 | M8 | M8/M9 |
| PCB volume production schedule | - | 2022-23 | 2Q26 | 2Q27 |
| Layer count | 12~18 | 26~28 | 36~40 | 44~50 |
| Layer count change | - | 65-75% | 35-40% | 20-25% |
| Multi-layer | Multi-layer | N+N | N+M | |
| Process highlight | N+M sequential lamination is inherently more challenging than a standard multilayer build because it requires multiple lamination cycles. The yield rate could see a 15-30% loss | N+M sequential lamination is inherently more challenging than a standard multilayer build because it requires multiple lamination cycles. The yield rate could see a 15-30% loss | N+M sequential lamination is inherently more challenging than a standard multilayer build because it requires multiple lamination cycles. The yield rate could see a 15-30% loss | N+M sequential lamination is inherently more challenging than a standard multilayer build because it requires multiple lamination cycles. The yield rate could see a 15-30% loss |
| PCB ASP (USD) | 180 | 400 | 1,500-2,000 | 3,000-4,000 |
| PCB ASP change | - | 122% | 275% | 94% |
Source: Aletheia/TAG
4 October 2026
Who will benefit most in the Google TPU supply chain?
ISU Petasys is best positioned to capture this growth given its high exposure to networking PCBs (50%-60% of sales) and its role as a key PCB supplier to Google (50%+ of sales). We also consider EMC another great proxy for the TPU supply chain, because of 1) its leading position in high-end CCL, 2) its increasing market share in ASICs (Google, AWS) as well as AMD, and 3) its better margin/profitability along with favorable product mix and price hikes. TTM is another key supplier to Google TPU for N+M products, and we expect its business to accelerate from 2H26. If Google confirms LTAs with its PCB/CCL vendors, we think it will further drive-up the supply chain's P/E with more stable backlogs and longer order visibility.
Price hikes will continue; LTAs are ongoing
Another key growth driver to lift PCB/CCL makers' profitability is price hikes. We have witnessed several rounds of price hikes already this year and expect more. Besides, our channel check suggests that CSPs are working closely with PCB/CCL makers for LTAs to secure advanced capacity and smooth the production process. This section will discuss these two issues and implications for the supply chain.
Price hikes will likely continue
Our supply chain checks suggest that CCL makers are increasing prices by 50%-100% YTD to reflect 1) organic material upgrades under the supply constraint, 2) a shortage inf upstream materials supply and price hikes (resin, copper foil and glass cloth), and 3) longer and more complex laminate process for more advanced CCL. We see price hikes across the board from all production lines from M8 material to M4 because tier 1 makers are allocating more capacity for advanced materials (which requires a longer processing time resulting in lower production volume). As such, entry-level products will be excluded and will partially shift to second-tier vendors.
Based on current visibility, we expect more waves of price hikes in CCL in 2H26 and 1H27. We think each round will be 10%-15%. We assume better profitability for CCL makers in future quarters owing to 1) higher UTR under a supply constraint, 2) continued price hikes and 3) favorable product mix along with product migration.
Are LTAs becoming new norm for PCB/CCL?
Given the tight supply conditions and strong PCB/CCL demand for the foreseeable future, we are also hearing that CSPs are aggressively approaching PCB and CCL makers for LTAs to secure capacity. Terms will vary from vendor to vendor. However, those discussions send a clear message that end users are securing high-end PCB/CCL capacity by prepayment and LTAs for the next few years, because the overall industry may continue to remain undersupplied. Also, we reckon prepayment 1) will ease supply chain pressure on capex/cash flow, 2) make the supply chain more willing to invest under longer order visibility and secured shipment volume, and 3) improve supply chain management with better profitability. Below are typical LTAs between memory suppliers and their key customers.
11
4 October 2026
12
FIGURE 15: DETAILS OF LTAS BETWEEN MEMORY SUPPLIERS AND THEIR CUSTOMERS (AS OF SEP 2026)
| Samsung | SKHY³ | Micron | Kioxia | SNDK | |
|---|---|---|---|---|---|
| Duration | 5 years | 5 years | 3-5 years⁴ | 3+years | 4 years |
| Targeted coverage | 60-70% | 50-60% | 35%5 | ~50%in 2H26 | 2/3 in 27/28 |
| Customers | 5+51 | 10 | 26 | 3 | 8 |
| Ceiling price | Yes | No³ | Yes | No | Yes |
| Floor price | Yes | Yes | Yes | Yes | Yes |
| Deposit/ prepayment | Yes² | No | $32bn | No | $16.5bn |
| Total value | N.A. | N.A. | $150bn | N.A. | $94bn |
Note: 1- 5 AI customers confirmed as of 2Q26. Five more clients to be confirmed in 3Q26. 2-Cash payment is 25% of value of contract (covering DRAM& NAND). 3- SKHY's LTA doesn't apply to NVDA as the HBM ASP is determined annually and server DRAM (SoCAAM) is semi-annual or quarterly. ASP offered to NVDA will be at a discounted to market price. 4-Auto customers signed 3-year contract while others are on five years term. 5-20% for DRAM and 33% for NAND by 2030.
Source: Aletheia/TAG
New trends/developments in PCB supply chain and implications
Given the fast development of PCB design, there is lots of noise in the supply chain about the future PCB demand outlook. This section will discuss the latest developments in the PCB industry and their implications for the supply chain, including mSAP adoption in optical, pros and cons for PTFE material (hybrid/pure) as well as CPO's impact on the CCL supply chain.
mSAP is becoming a standard for optical beyond 1.6T
mSAP (Modified Semi-Additive Process) is not a new technology. It is an advanced PCB manufacturing method that builds fine circuit traces by electroplating copper onto a thin layer rather than etching away thick copper. It allows PCB to further shrink its L/S to below 30um (compared to 30-50um for traditional etching). As such, PCB can support higher density to support advanced electronic devices with a smaller/complex form factor.
FIGURE 16: MSAP PROCESS IS SUITABLE FOR PCB WITH L/S <30UM
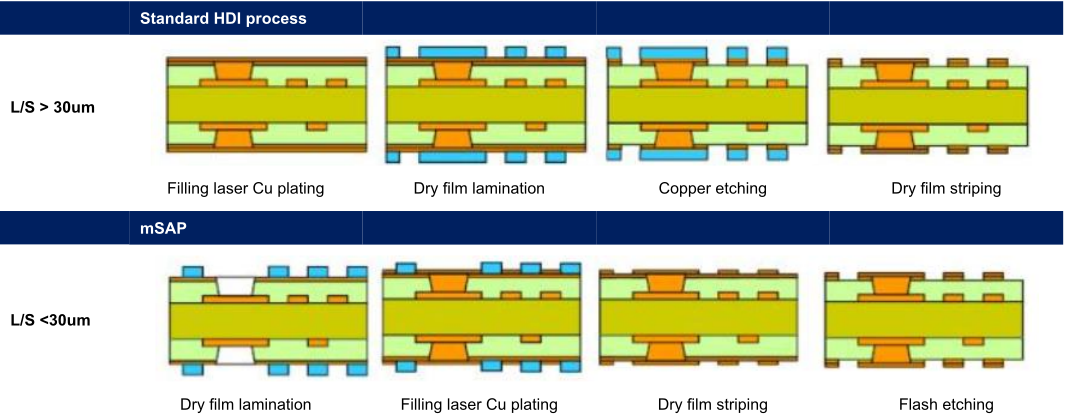
Source: Aletheia/TAG
4 October 2026
13
To meet the requirement for higher integration and miniaturization, optical modules are increasingly adopting mSAP to reduce product size and signal loss. Our supply chain check suggests that 1) we are seeing some 800G switch mSAP adoption, but it is more like an optional solution to ally with a specific form factor according to a vendor's requirement, and 2) mSAP is becoming a mandatory process from 1.6T given the L/S is expected to shrink to below 30um.
FIGURE 17: MSAP IS BECOMING A STANDARD FROM 1.6T
| 400G | 800G | 1.6T | 3.2T | |
|---|---|---|---|---|
| Layer (HDI) | 10L | 12-14L | 14-18L | 20-22L |
| L/S | 40-50um | 30-40um | 20-30um | 10-15um |
| CCL | M4/M6 | M6/M7 | M8+ | M9+ |
| Suppliers | SCC, Unimicron | SCC, ZDT, Unimicron, Compeq Kinwong, WUS | SCC, ZDT, Unimicron, Compeq | SCC, ZDT, Unimicron |
| mSAP adoption | NO | Optional | YES | YES |
Source: Aletheia/ TAG
4 October 2026
14
Implications for supply chain: The key bottleneck for mSAP is more in the 1) upstream materials from Japan vendors, including carrier copper foil from Mitsui Kinzoku and Nittobo's low-CTE glass fabric and 2) selected equipment like laser drilling machines and laser direct imaging (LDI) machines. The production lead-time has increased to 10-12 months (vs the normal 4-6 months).
For PCB supply, we believe SCC, ZDT and Unimicron will be the key beneficiaries of mSAP. Compeq is also being qualfied for its mSAP solution for 800G/1.6T switches, based on our checks.
FIGURE 18: MAJOR PLAYERS' PROGRESS WITH MSAP
| SCC | SCC is a leader in the mSAP process among Chinese PCB makers. The company recently announced a RMB4.37bn private placement to expand AI-related PCB capacity (including mSAP). |
|---|---|
| ZDT/Avary | ZDT/Avary is aiming to become the world's largest mSAP supplier by expanding capacity 5x in the coming years at all its major production sites (including China, Taiwan and Thailand). |
| Unimicron | Unimicron raised its 2026 capex from TWD25bn to TWD34bn in its latest earnings call. According to the company, 70% will be used in ABF substrate and 30% for HDI, mSAP and new production site in Thailand. |
| Compeq | Compeq has passed qualification for mSAP in high-end switch products and started to enter into mass production from 2H26. The company will continue to expand mSAP capacity in both its Taiwan and China (Chongqing) sites. |
Source: Aletheia Capital, TAG
Potential PTFE developments in the future
Nvidia is testing hybrid material (PTFE + M9) in the Rubin Ultra generation for switch trays to meet up with higher requirements of data transmission and may consider pure PTFE material for the backplane in the next generation. CCL makers are testing and sampling several solutions at this stage, and we will have better visibility into 1H27.
FIGURE 19: PCB'S MAJOR RESIN MATERIAL DK/DF COMPARISON: PTFE HAS BEST DK/DF
M9 materials based on PPO/HC resin are no longer sufficient to meet Nvidia's performance requirements. PTFE has better/stable signal performance (low Dk/Df) and the current hybrid solution with no glass cloth can reduce the usage of Q-glass, which is under a supply constraint. However, the hybrid solution is difficult to process (laminate/drill), making its yield rate very low and higher manufacturing costs. Also, the new material will take longer time for qualification.
Implication to supply chain: We don't think PTFE will become mainstream material in AI servers in the near future considering its low yield rate and high cost. It is more likely to be adopted in areas which require extremely low Dk/Df like Nvidia is testing it for switch boards and potentially backplane.
For PTFE CCL supply, we think Shengyi will be the first source given its track record with Nvidia. EMC/Taiflex camp will likely be the second source potentially (EMC supplies M9 PP and Taiflex supplies PTFE CCL). For PCB supply, we think the major suppliers will be Chinesebased PCB vendors (SCC, Kinwong, WUS and VGT for example) and the yield rate is still low (below 30%).
CPO may trigger CCL de-spec?
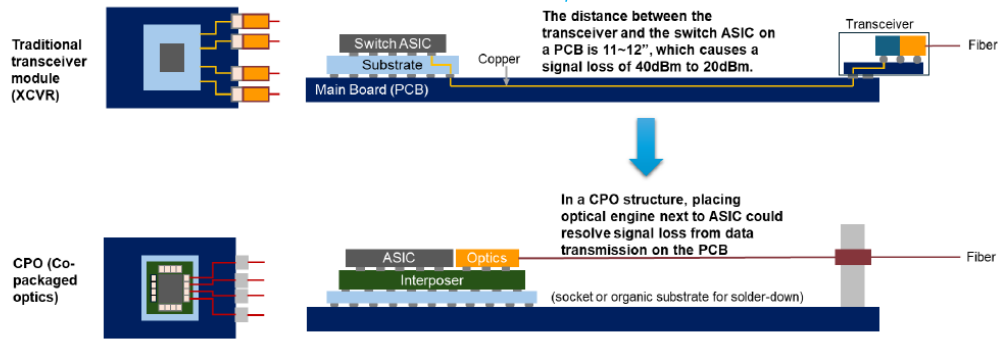
CPO is an advanced heterogeneous integration of optics and silicon devices in a single form. It enables the integration of both PIC and EIC and packages them in a modular form factor along with switches or XPU (including ASIC) via substrate or interposer to support high-speed transmission and power saving. In traditional systems, electronic signals are converted to optical signals with signal loss and higher power consumption. CPO, however, places the optical engines closer to the switch ASIC or xPU, reducing the distance that signals need to travel and improving the overall performance.
Most common data transmission involves using a transceiver module to input data into the switch ASIC for computing, which must pass through the PCB. For switches, the PCB distance between the transceiver module and the switch ASIC is approximately 11 to 12 inches or ±300mm. This results in signal loss and reduces the switch ASIC's signal integrity from 40 dBm to 20 dBm, implying a 50% signal loss. This is despite industry efforts to develop advanced low Df/Dk CCL to reduce signal loss and latency. As such, placing the optical engine next to the switch IC will efficiently resolve this problem as illustrated in figure below.
FIGURE 20: CPO ADOPTION LIKELY TO SHRINK THE USAGE OF ADVANCED PCB/CCL
Source: Aletheia/TAG
4 October 2026
15
Advanced Materials - PCB & CCL Goldilocks
4 October 2026
Implication for the supply chain: The CPO's purpose is to minimize the data transmission on the PCB, allowing high-speed data transmission to take place within the IC level. In this case, PCB in switch systems may no longer require the low-Df/Dk CCL material compared to its use of high-end low Df/Dk CCL (M6-M8) for 400Gbps and 800Gbps switch today. As such, some people may be concerned that the adoption of CPO will slow down the further migration of CCL.
More impact on CCL side but manageable
As discussed above, we believe the adoption of CPO will impact the CCL side more (material change) instead of the PCB side. However, we don't think it will become an immediate threat and the overall impact should be manageable, because 1) The design of CPO is not finalized and still faces challenges in higher manufacutring costs, lower yield rate, and reliability issues, 2) Nvidia is more aggressive in CPO solutions while other vendors (like Google) still stick with existing solutions, and 3) the overall CCL industry is undersupplied and material upgrades of more and more new applications are taking place in to fulfill future demand.
Hence, our conclusion is 1) CPO penetration takes time and the initial impact will be more in the Nvidia supply chain instead of the entire AI supply chain for CCL makers, and 2) the overall trend for CCL material upgrades will remain strong as other non-CPO application demand remains strong and the overall industry is still undersupplied.
16
ISU Petasys
AI #Hardware www.aletheia-capital.com
Price: KRW 121,200
Target Price: KRW 270,000
Upside: 123%
Total return: 123%
Risk: High
No CNY
USD
0.089
0.135
Shaotang Lee
+852 9193 6990
shaotang.lee@aletheia-capital.com
Warren Lau
+852 2534 7404 warren.lau@aletheia-capital.com
Skye Chen
+852 2534 7404 skye.chen@aletheia-capital.com
ISU Petasys
Bloomberg
RIC
007660 KRX
007660.KRX
Market cap (USDbn)
6.6
Average daily T/O (USD|mn)
71
More to Come
We transfer coverage and reiterate BUY for ISU and maintain a TP at KRW270,000 on 30X FY27/28E PER. We remain optimistic for its accelerated revenue and earnings growth into 2028E, driven by increasing PCB design complexity and accelerating deployment of Google's TPU and expanding demand in high-speed networking. We believe the exponential growth compounded by both unit growth and content value upgrades will continue to lead to the growth of its AI PCB business and offset the concerns about market share loss. Not to mention there will be more ASIC projects to come to further boost growth and diversify its concentration. We view ISU as the best proxy to capture solid growth from both Google TPU and networking upgrades thanks to its high exposure, as well as leading high-end PCB technology and strategic geographic presence in Korea.
TPU to lead growth, but more to come
We expect ISU's revenue/earnings to increase sequentially from 2H26 to the entire 2027 along with the Google TPU v8 ramp up. Despite concerns about market share loss, we view that 1) the absolute shipment/revenue contribution from Google will still be more than double, considering the TAM is growing 4-5x with higher unit shipment (3.6m to 8.5/12.0m) and higher content value (80%-150% higher) for both of compute and networking, and 2) less involvement in Google's general server business. The company is also working on customer diversification; MSFT's ASIC will become ISU's next key growth driver from 2028 onward.
New capacity is on the way to support future growth
ISU is expanding capacity aggressively to meet the strong demand: 1) an earlier Fab 6 ramp in 1Q27 for a 25% capacity increase, 2) A 20-25% capacity increase by 2Q28 after Fab 5 expansion for HDI to secure annual sales capacity of W2tn, according to the company. Fab 7 is also under discussion if HDI demand comes in stronger than expected. Its core MLB (multilam board) products will remain in strong demand while new HDI products are under development. The company doesn't believe the increasing adoption of HDI will cannibalize demand for MLB. Also, we see continued price hikes (along with upstream material shortage and a strong end demand outlook) and better product mix will drive ISU's profitability to further expand in FY27/28 under a higher UTR.
BUY with unchanged TP of KRW270,000
ISU is uniquely positioned to capture two major trends due to its high exposure to Google and networking. We project its EPS will triple from FY26 to FY28 with larger revenue scale and a favorable product mix. We have a BUY and an unchanged TP of KRW270,000 on 30x FY27/28 P/E. We roll over our valuation period to the average of 2027/28 with longer order visibility and more AI PCB projects to come, while we lower our multiple slightly from 35x to 30x to align with regional peers.
KEY FINANCIAL AND VALUATION MATRIX
ROE (%)
57.7
19.5
24.9
29.6
30.8
42.4
41.9
| Dec 31 (KRW bn) | 2022 | 2023 | 2024 | 2025 | 2026E | 2027E | 2028E |
|---|---|---|---|---|---|---|---|
| Revenue | 643 | 675 | 837 | 1,088 | 1,795 | 3,254 | 4,567 |
| EBITDA | 130 | 78 | 125 | 234 | 395 | 734 | 1,085 |
| Op Profit | 117 | 62 | 102 | 205 | 356 | 673 | 987 |
| Net Profit | 102 | 48 | 74 | 160 | 273 | 537 | 793 |
| EPS | 1,620 | 755 | 1,171 | 2,278 | 3,766 | 7,318 | 10,803 |
| Consensus EPS | - | - | - | - | 3,784 | 5,995 | 7,631 |
| PER (X) | 74.8 | 160.5 | 103.5 | 53.2 | 32.2 | 16.6 | 11.2 |
| PBR (X) | 34.5 | 28.7 | 23.4 | 11.3 | 8.6 | 5.8 | 3.9 |
| Dividend Yield (%) | 0.1 | 0.1 | 0.1 | 0.2 | 0.3 | 0.6 | 0.9 |
Source: Company, FactSet, Aletheia/TAG
Please refer to important disclosures and disclaimers at the end of this report. This report is intended solely for the subscriber.
Unauthorized sharing, distribution, or reproduction may violate applicable regulatory requirements and could result in legal action.
linkedin icon circleçåçæå°çµæ
facebok icon circleçåçæå°çµæ
twiter icon circleçåçæå°çµæ
FIGURE 1: SALES ASSUMPTION FOR ISU PETASYS
| (KRW bn) | Sales - 2025 | Sales - 2026E | Sales - 2027E | Sales - 2028E | YoY - 2026E | YoY - 20207E | YoY - 2028E |
|---|---|---|---|---|---|---|---|
| ISU Petasys (standalone): | 930 | 1,503 | 2,914 | 4,169 | 62% | 94% | 43% |
| - Networking | 286 | 458 | 721 | 928 | 60% | 57% | 29% |
| - Datacenter | 644 | 1,045 | 2,193 | 3,241 | 62% | 110% | 48% |
| ISU Petasys Hunan (CHN) | 227 | 348 | 388 | 440 | 53% | 12% | 13% |
| ISU Petasys Corp. (US) | 22 | 33 | 40 | 46 | 52% | 21% | 15% |
| Adjustment | -91 | -88 | -88 | -88 | -3% | 0% | 0% |
| Total ISU sales | 1,088 | 1,795 | 3,254 | 4,567 | 65% | 81% | 40% |
| ISU Petasys (standalone): | ISU Petasys (standalone): | ISU Petasys (standalone): | ISU Petasys (standalone): | ISU Petasys (standalone): | ISU Petasys (standalone): | ISU Petasys (standalone): | ISU Petasys (standalone): |
| - Networking | 286 | 458 | 721 | 928 | 60% | 57% | 29% |
| - Datacenter | 644 | 1,045 | 2,193 | 3,241 | 62% | 110% | 48% |
| Mix | Mix | Mix | Mix | Mix | Mix | Mix | Mix |
| - Networking | 31% | 30% | 25% | 22% | |||
| - Datacenter | 69% | 70% | 75% | 78% |
Source: Company, Aletheia/TAG
FIGURE 2: EARNINGS MODEL FOR ISU PETASYS
| (KRW bn) | 1Q26 | 2Q26 | 3Q26E | 4Q26E | 1Q27E | 2Q27E | 3Q27E | 4Q27E | 2024 | 2025 | 2026E | 2027E | 2028E |
|---|---|---|---|---|---|---|---|---|---|---|---|---|---|
| Sales | 340 | 380 | 455 | 620 | 664 | 739 | 873 | 978 | 837 | 1,088 | 1,795 | 3,254 | 4,567 |
| Gross profit | 84 | 95 | 120 | 165 | 171 | 191 | 227 | 254 | 157 | 282 | 464 | 843 | 1,190 |
| Opex | 17 | 18 | 28 | 45 | 36 | 39 | 45 | 49 | 55 | 78 | 108 | 169 | 203 |
| Operating profit | 67 | 77 | 91 | 120 | 135 | 152 | 182 | 205 | 102 | 205 | 356 | 673 | 987 |
| Non-OP | -3 | 0 | -3 | -1 | 1 | 3 | 5 | 7 | -10 | -3 | -7 | 16 | 30 |
| Pretax profit | 64 | 77 | 89 | 120 | 136 | 155 | 187 | 211 | 92 | 202 | 349 | 689 | 1,017 |
| Net profit | 50 | 60 | 69 | 93 | 106 | 121 | 145 | 165 | 74 | 160 | 273 | 537 | 793 |
| EPS (KRW) | 687 | 813 | 964 | 1,302 | 1,447 | 1,642 | 1,982 | 2,247 | 1,171 | 2,278 | 3,766 | 7,318 | 10,803 |
| Growth | |||||||||||||
| Sales QoQ | 14.2% | 11.6% | 19.7% | 36.5% | 7.1% | 11.3% | 18.0% | 12.0% | - | - | - | - | - |
| Sales YoY | 34.8% | 57.4% | 53.5%108.2% | 95.3% | 94.6% | 91.9% | 57.6% | 23.9% | 30.0% | 65.0% | 81.3% | 40.4% | |
| EPS QoQ | 16.2% | 18.3% | 18.6% | 35.0% | 11.2% | 13.5% | 20.7% | 13.4% | - | - | - | - | - |
| EPS YoY | 13.4% | 85.6% | 49.9%120.3%110.6%101.9%105.6% | 72.6% | 55.1% | 94.5% | 65.3% | 94.3% | 47.6% | ||||
| Margin | |||||||||||||
| Gross margin | 24.8% | 25.1% | 26.3% | 26.6% | 25.7% | 25.8% | 26.0% | 26.0% | 18.7% | 25.9% | 25.9% | 25.9% | 26.1% |
| Opex | 5.1% | 4.8% | 6.2% | 7.2% | 5.4% | 5.3% | 5.2% | 5.1% | 6.5% | 7.1% | 6.0% | 5.2% | 4.5% |
| OP margin | 19.8% | 20.3% | 20.1% | 19.4% | 20.3% | 20.5% | 20.8% | 20.9% | 12.2% | 18.8% | 19.8% | 20.7% | 21.6% |
| Non-OP | -0.8% | -0.1% | -0.6% | -0.1% | 0.2% | 0.4% | 0.6% | 0.7% | -1.2% | -0.3% | -0.4% | 0.5% | 0.7% |
| Net margin | 14.8% | 15.7% | 15.2% | 15.0% | 16.0% | 16.3% | 16.7% | 16.9% | 8.8% | 14.7% | 15.2% | 16.5% | 17.4% |
Source: Company, Aletheia Capital, TAG
4 October 2026
18
ISU Petasys
More to Come
FIGURE 3: 12-MONTH FORWARD PER BAND FOR ISU PETASYS
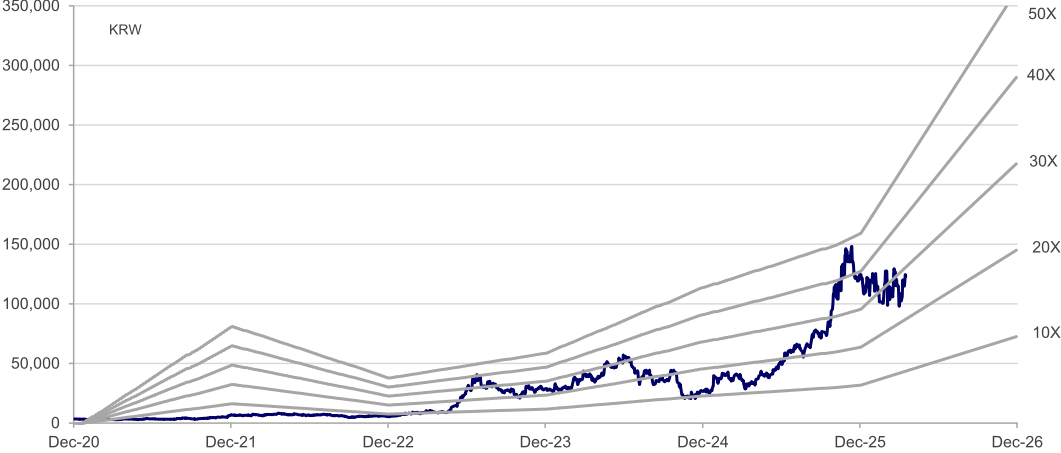
Source: Aletheia Capital, TAG
4 October 2026
19
Financial Statements
| INCOME STATEMENT Dec 31 (KRW bn) | 2023 | 2024 | 2025 | 2026E | 2027E | 2028E | BALANCE SHEET Dec 31 (KRW bn) | 2023 | 2024 | 2025 | 2026E | 2027E | 2028E |
|---|---|---|---|---|---|---|---|---|---|---|---|---|---|
| Revenue | 675 | 837 | 1,088 | 1,795 | 3,254 | 4,567 | Cash/ST investment | 49 | 80 | 164 | 224 | 366 | 412 |
| COGS | -559 | -680 | -806 | -1,331 | -2,411 | -3,377 | Inventory | 176 | 187 | 299 | 380 | 536 | 675 |
| Gross profit | 116 | 157 | 282 | 464 | 843 | 1,190 | Receivable | 152 | 229 | 214 | 359 | 723 | 1,015 |
| Operating expense | -54 | -55 | -78 | -108 | -169 | -203 | Current assets | 384 | 523 | 863 | 1,150 | 1,812 | 2,288 |
| EBITDA | 78 | 125 | 234 | 395 | 734 | 1,085 | Fixed assets | 192 | 202 | 307 | 434 | 620 | 807 |
| Operating profit | 62 | 102 | 205 | 356 | 673 | 987 | Goodwill & intangibles | 4 | 7 | 9 | 12 | 16 | 21 |
| Interest expense (income) | -8 | -9 | -3 | -1 | 24 | 40 | Other LT assets | 46 | 59 | 110 | 110 | 110 | 110 |
| Other expense (income) | 1 | -1 | 0 | -6 | -9 | -10 | LT assets | 243 | 267 | 427 | 556 | 746 | 938 |
| Profit before tax | 55 | 92 | 202 | 349 | 689 | 1,017 | Total assets | 626 | 790 | 1,290 | 1,706 | 2,558 | 3,227 |
| Tax | -7 | -18 | -41 | -77 | -152 | -224 | Payable | 105 | 167 | 204 | 350 | 689 | 614 |
| Net profit (parent) | 48 | 74 | 160 | 273 | 537 | 793 | Other liability | 185 | 211 | 212 | 177 | 180 | 185 |
| FD EPS (KRW) | 755 | 1,171 | 2,278 | 3,766 | 7,318 | 10,803 | Current liabilities | 291 | 377 | 416 | 527 | 869 | 799 |
| Change | LT liabilities | 69 | 85 | 117 | 167 | 168 | 167 | ||||||
| Revenue | 5% | 24% | 30% | 65% | 81% | 40% | Total liabilities | 360 | 463 | 533 | 694 | 1,036 | 966 |
| Gross profit | -29% | 34% | 80% | 65% | 81% | 41% | Common shares | 144 | 144 | 425 | 425 | 425 | 425 |
| Operating profit | -47% | 64% | 101% | 74% | 89% | 47% | Retained earnings | 114 | 172 | 326 | 581 | 1,091 | 1,830 |
| Net profit | -52% | 55% | 117% | 70% | 97% | 48% | Equity | 267 | 328 | 756 | 1,012 | 1,521 | 2,261 |
| EPS | -53% | 55% | 95% | 65% | 94% | 48% | Liability&Equity | 626 | 790 | 1,290 | 1,706 | 2,558 | 3,227 |
| CASH FLOW | RATIO & PER SHARE | DATA | |||||||||||
| Dec 31 (KRW bn) | 2023 | 2024 | 2025 | 2026E | 2027E | 2028E | Dec 31 (KRW) | 2023 | 2024 | 2025 | 2026E | 2027E | 2028E |
| Net profit | 48 | 74 | 160 | 273 | 537 | 793 | Gross margin (%) | 17.2 | 18.7 | 25.9 | 25.9 | 25.9 | 26.1 |
| Dep. & amortization | 15 | 24 | 30 | 45 | 70 | 108 | EBITDA margin (%) | 11.6 | 14.9 | 21.5 | 22.0 | 22.6 | 23.7 |
| Chg in WC | 0 | -29 | -182 | -111 | -173 | -501 | Op. Profit margin (%) | 9.2 | 12.2 | 18.8 | 19.8 | 20.7 | 21.6 |
| Others | -10 | 16 | 160 | 0 | 0 | 0 | Net Profit margin (%) | 7.1 | 8.8 | 14.7 | 15.2 | 16.5 | 17.4 |
| OPN cash flow | 52.5 | 84.9 | 168.8 | 206.4 | 434.9 | 399.2 | ROE (%) | 19.5 | 24.9 | 29.6 | 30.8 | 42.4 | 41.9 |
| Capex | -66 | -62 | -155 | -174 | -260 | -300 | ROA (%) | 8.1 | 10.5 | 15.4 | 18.2 | 25.2 | 27.4 |
| Chg in investment | 5 | 0 | -166 | 0 | 0 | 0 | Gross gearing (%) | 57.4 | 58.5 | 41.4 | 40.7 | 40.5 | 29.9 |
| Others | 0 | 0 | -25 | 0 | 0 | 0 | Net gearing (%) | 59.9 | 45.0 | 6.1 | 3.0 | -7.7 | -7.2 |
| Investing CF | -61.4 | -63.0 | -346.7 | -174.0 | -260.0 | -300.0 | Asset turn (x) | 1.2 | 1.2 | 1.0 | 1.2 | 1.5 | 1.6 |
| Chg in debt | 18 | 9 | -10 | 45 | -5 | 0 | Leverage (x) | 2.4 | 2.4 | 1.9 | 1.7 | 1.7 | 1.5 |
| Equity raised | 0 | 0 | 281 | 0 | 0 | 0 | Payable days | 67 | 73 | 84 | 76 | 79 | 70 |
| Dividend paid | -6 | -6 | -9 | -17 | -28 | -54 | Receivable days | 81 | 83 | 74 | 58 | 61 | 69 |
| Others | -2 | 0 | 1 | 0 | 0 | 0 | Inventory days | 112 | 97 | 110 | 93 | 69 | 65 |
| Financing CF | 10.3 | 3.1 | 262.2 | 28.1 | -32.6 | -53.7 | EPS | 755 | 1,171 | 2,278 | 3,766 | 7,318 | 10,803 |
| FX & other adj | 1 | 7 | -2 | 0 | 0 | 0 | BVPS | 4,218 | 5,179 | 10,733 | 14,120 | 20,724 | 30,796 |
| Chg in cash | 2 | 32 | 82 | 60 | 142 | 45 | Net cash per share | -2,528 | -2,329 | -656 | -429 | 1,586 | 2,206 |
| Beginning cash | 46 | 48 | 80 | 163 | 223 | 365 | SPS | 10,678 | 13,232 | 15,442 | 25,052 | 44,328 | 62,219 |
| End cash | FCFPS | 61 | 458 | 2,117 | |||||||||
| 48.0 | 80.4 | 162.8 | 223.2 | 365.5 | 410.9 | 220 | -2,050 | 932 | |||||
| FCF | 3.9 | 13.9 | -144.4 | 32.8 | 155.4 | 68.4 | DPS | 97 | 146 | 230 | 377 | 732 | 1,080 |
Source: Company, Aletheia Capital /TAG
4 October 2026
20
TTM Technologies
www.aletheia-capital.com
↔ Buy
Intiation #AI #Hardware Initiation
Price: $ 131.87
Target Price: $ 236
No CNY
USD
Upside: 78.9%
Total return: 78.9%
Risk: High
0.089
0.135
Shaotang Lee
+852 91936990
shaotang.lee@aletheia-capital.com
Warren Lau
+852 2534 7404 warren.lau@aletheia-capital.com
Skye Chen
+852 2534 7404
skye.chen@aletheia-capital.com
TTM Technologies
Bloomberg
RIC
TTMI US
TTMI.OQ
Market cap (USDbn)
13.9
Average daily T/O (USD|mn)
391
A Unique Proxy Standing for USA PCB
We initiate coverage of TTM with a BUY and a TP of USD236 on a 27X FY27/28E average PER based on SOTP. We anticipate TTM earnings will double from FY26E to FY28E, driven by strong AI demand (N+M) and a solid footprint in aerospace & defense (A&D). TTM's data center and networking segment will enjoy 79% CAGR sales in 2026-28 along with TPU v8 ramping up. We believe its leading N+M position and franchise in the US will allow TTM to secure more AI server opportunities (like Meta) in the future. The company is also expanding its capacity aggressively in both Asia and the USA to capture more value in both AI and A&D space.
Leading PCB maker in the US
TTM is one of the world's top 10 PCB makers and No.1 in the USA, as well as a total solutions provider for aerospace & defense (A&D) systems. We think its strong franchise in the USA and global footprint (capacity in North America, China and Southeast Asia) can help the company to seize opportunities in 1) content value upgrades in AI PCBs from Google and other ASICs,
2) increasing spending in the A&D area and its tight relationship with the US government, and
3) organic growth in medical and automotive spaces and continued M&A strategy.
AI revenue to accelerate from 2H26 thanks to TPU, more projects to come
The company reported 90% YoY growth of its data center and networking segment in 2Q26, and raised full-year guidance, suggesting this segment would double in 2026 with strong N+M demand. We project 2H26 AI-related growth will accelerate at 150%-200% YoY along with TPU ramping up to meet company guidance. As one of the major PCB suppliers to Google TPU, we see huge upside in this business: 1) TPU's PCB ASP has lifted 2.5x from TPU V5 to V8 with more complex design and upgrades, and 2) we estimate TPU unit demand will grow from 3.6m in 2026 to 8.5/12.0m in 2027/28. Thanks to its strong capability in high-end PCBs, we believe TTM will penetrate more AI projects in the future (like Meta's ASIC).
EPS to double from FY26-FY28E; initiate with BUY and a USD236 TP
We forecast TTM earnings will double from FY26E to FY28E with better product mix and increasing AI exposure. We expect increasing demand to accelerate capacity additions, supported by TTM's leadership in high-end PCB technology, its long-term relationship with key customers and unique industry position (the largest US-based PCB maker). We initiate with a BUY and a target price of USD236 by using a 27x FY27/28 average PER. We use SOTP to derive our target multiple as we think it will better capture its dual growth drivers (AI and A&D), as its irreplaceability, in our view, make TTM the best proxy in the US to capture both AI server and national defence trends. Our 2026E EPS is largely inline with its guidance and consensus.
KEY FINANCIAL AND VALUATION MATRIX
| FYE Dec (US$ mn), non-GAAP | 2022 | 2023 | 2024 | 2025 | 2026E | 2027E | 2028E |
|---|---|---|---|---|---|---|---|
| Revenue | 2,495 | 2,233 | 2,443 | 2,906 | 4,423 | 6,556 | 7,882 |
| Op Profit | 235 | 199 | 234 | 340 | 664 | 1,009 | 1,315 |
| Net Profit | 181 | 140 | 177 | 259 | 505 | 774 | 1,025 |
| FD EPS, GAAP | 0.9 | -0.18 | 0.54 | 1.69 | 3.77 | 6.45 | 8.90 |
| FD EPS, non-GAAP | 1.8 | 1.34 | 1.70 | 2.46 | 4.79 | 7.51 | 9.97 |
| Consensus EPS, non-GAAP | - | - | - | - | 4.84 | 6.91 | 7.87 |
| PER (X), non-GAAP | 9.0 | 10.4 | 14.5 | 39.9 | 27.5 | 17.6 | 13.2 |
| PBR(X) | 1.1 | 0.9 | 1.6 | 5.9 | 6.5 | 4.9 | 3.7 |
| ROA (%) | 5.7 | 4.2 | 5.2 | 7.1 | 12.2 | 15.9 | 17.7 |
| ROE (%) | 12.2 | 9.0 | 11.5 | 15.6 | 25.7 | 31.7 | 32.2 |
Source: Company, FactSet, Aletheia/TAG
Please refer to important disclosures and disclaimers at the end of this report. This report is intended solely for the subscriber.
Unauthorized sharing, distribution, or reproduction may violate applicable regulatory requirements and could result in legal action.
linkedin icon circleçåçæå°çµæ
facebok icon circleçåçæå°çµæ
twiter icon circleçåçæå°çµæ
TTM Technologies
4 October 2026
22
Largest PCB maker in the USA securing its industry position
TTM is one of the world's top 10 PCB makers and No.1 in the US, as well as a total solutions provider for aerospace & defense (A&D) systems. We think TTM's strong franchise in the US and global footprint (capacity in North America, China and Southeast Asia) can help the company seize opportunities in 1) content value upgrades in AI PCB from Google and other ASICs, 2) increasing spending in the A&D area and its tight relationship with the US government, and 3) organic growth in medical and automotive spaces and continued M&A strategy.
In 2025, 44% of company sales came from from A&D and 56% sales from commercials, which consists of data center and networking (31%), automotive (11%), and medical (14%). This year we started to see exponential growth from high-end AI PCB, thanks to a ramp up of N+M products for AI accelerators. We project data center and networking will become the company's biggest segment from this year, climbing to 49%/59%/62% of total sales in 202628E.
FIGURE 1: TTM PRODUCT MIX BY SEGMENT
FIGURE 2: TTM REVENUE TREND BY SEGMENT
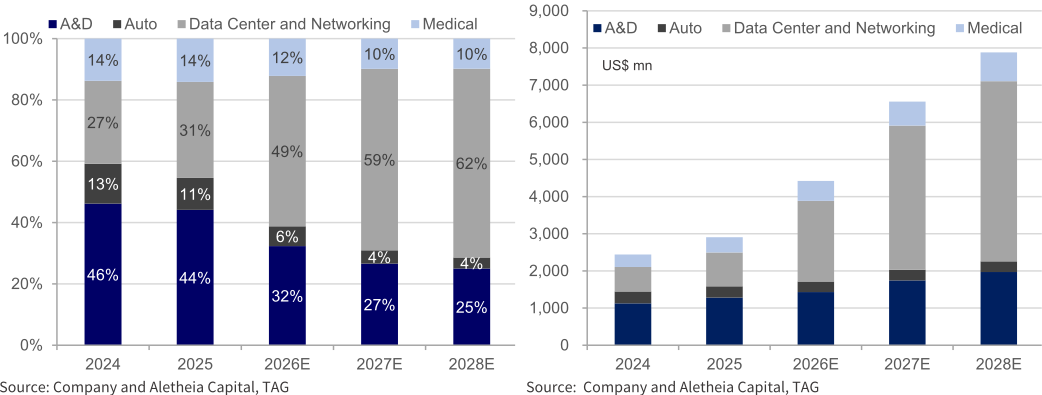
The company has committed to investing over USD1.2bn from FY25-29 in advanced interconnect/PCB, focusing on 1) N+M products for data center and networking (AI-related applications), 2) ultra-HDI products for the A&D segment, and 3) R&D investments in embedded optics and mSAP, for example. The company is also expanding its capacity aggressively in both Asia and the USA to capture more value in both AI and the A&D space.
FIGURE 3: FUTURE ROADMAP OF TTM PCB PRODUCTS
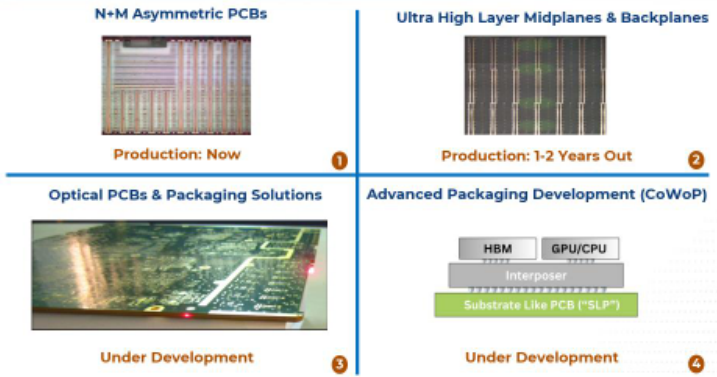
Source: Aletheia Capital, TAG
4 October 2026
Driver 1: advanced AI server PCB from ASIC/GPUs
As one of the major PCB suppliers to Google TPU, we see huge upside for TTM in this business: 1) TPU's PCB ASP has increased 2.5x from TPU V5 to V8 with more complex design and upgrades, and 2) we estimate TPU unit demand will grow from 3.6m in 2026 to 8.5/12.0m in 2027/28. Google's TPU roadmap requires higher ICI bandwidth, HBM density, and compute power, driving a meaningful upgrade on PCB structure and ASP increases. We will elaborate more in the next section.
FIGURE 4: PCB/CCL SPEC AND KEY SUPPLIER FOR AI SERVERS
| Code name | Timeline | PCB specs. | PCB suppliers | CCL specs. | CCL suppliers | |
|---|---|---|---|---|---|---|
| Nvidia | GB200 | 1H25 | 22L HDI 24L (switch) | VGT, Unimicron VGT, TTM, Unimicron (switch) | M8/M4 M8/M2 (switch) | Doosan Shengyi, EMC (switch) |
| Nvidia | GB300 | 1H26 | 22L HDI 24L (switch) | VGT, Unimicron VGT, TTM, Unimicron (switch) | M8/M4 M8/M2 (switch) M8/M4 | Doosan Shengyi, EMC (switch) |
| Nvidia | Vera Rubin | 2H26 | 26L HDI 32L (switch) 44L (mid-plane) | VGT, Unimicron, ZDT VGT, WUS, TTM, Unimicron (switch) | M8/M4 M8 (switch) M8 (mid-plane) | Doosan Shengyi, EMC, Nanya (switch) |
| Nvidia | Rubin Ultra | 2H27 | 30L HDI 32L (switch) 44L (mid-plane) | VGT, Unimicron, ZDT VGT, WUS, TTM, Unimicron, SCC (switch) | M8/M6 M8/M9+ PTFE (switch) M9 (mid-plane) | Doosan Shengyi, EMC/Taiflex (switch) |
| TPU v7 Ironwood | 1H26 | 26L | ISU, LCS, WUS, TTM | M7 | Panasonic, EMC | |
| TPU v8i Sunfish | 4Q26 | 32L M+M | ISU. LCS, WUS, TTM, Dynamic | M8/M6 | Panasonic, EMC, Nanya | |
| TPU v8t Zebrafish | 1Q27 | 34L N+M | ISU, LCS, WUS, TTM, GCE, Dynamic | M8/M6 | Panasonic, EMC, Doosan | |
| TPU v9 Humufish | 2028 | HDI | ISU, LCS, WUS, TTM, Unimicron, Dynamic | M9/M8 | Panasonic, EMC, Doosan | |
| Amazon | Trainium 2e | 1H26 | 26L | GCE, Shengyi, FHT | M8 | EMC, TUC |
| Amazon | Trainium 3 | 2H26 | 26L/40L 22L (switch) | GCE, Shengyi, FHT, WUS, ZDT | M8 | EMC, TUC |
| Amazon | Trainium 4 | 2H27 | 34L 30L (switch) | GCE, Shengyi, ZDT | M9? | EMC, TUC, Nanya |
| AMD | MI450 | 4Q26 | 48L | SCC (major), Unimicron, Dynamic | M8 | EMC, Doosan |
| AMD | MI500 | 4Q27 | 48-52L | SCC (major), Unimicron, Dynamic | M9 | EMC, Doosan |
| OpenAI | Jalapeno | 4Q26 | 40L | GCE and others | M8? | EMC, Doosan |
Source: Aletheia Capital, TAG
FIGURE 5: NVIDIA LPU PCB/CCL SUPPLY CHAIN
| Code name | Timeline | PCB specs. | PCB supplier | CCL specs. | CCL suppliers | |
|---|---|---|---|---|---|---|
| Nvidia | LPU | Late 2H26 | 52L | VGT, WUS, TTM | M9/M8 | Shengyi, EMC |
Source: Aletheia Capital, TAG
To support the performance upgrades, TPU PCB architecture is shifting from standard multilayer (Ghostfish) to N+M structures using dual-grade CCL and multi-lamination in Zebrafish and Sunfish, and ultimately to HDI PCB in Humufish. These transitions increase PCB ASPs by 30% in Ghostfish, 80%-90% in Sunfish/Zebrafish. Based on our estimates, content value per rack for PCBs is up to USD30k-40k and CCL USD12k-18k for TPU v8 (vs USD20k/7k in v7). We expect another 40%-50% in Humufish with HDI adoption. Into TPU V10, given that TDP will further double to 10kW, we can assume that PCB/CCL will be further upgraded to meet the higher requirement.
23
TTM Technologies
A Unique Proxy Standing for USA PCB
FIGURE 6: PCB SPECIFICATION FOR TPU
| ViperFish | GhostFish | SunFish | ZebraFish | HumuFish | TPU v10 | |
|---|---|---|---|---|---|---|
| CCL material grade | M5-m6 | M7 | M8 (signal) + M6 (power) | M8 (signal) + M6 (power) | M8/M9 | M9/M10 |
| Production schedule for PCB | 4Q25 | 4Q26 | 1Q27 | 2028 | 2029 | |
| Layer count | 20-22 | 26 | 32 (15+2+15) | 34 (16+2+16) | ~30-40 | TBD |
| Layer count change | - | 18% | 23% | 31% | - | - |
| Multi-layer | Multi-layer | N+M | N+M | HDI | HDI | |
| N+M sequential lamination is inherently more challenging than a standard multilayer build because it requires multiple lamination cycles, yield rates could see 15-30% loss | N+M sequential lamination is inherently more challenging than a standard multilayer build because it requires multiple lamination cycles, yield rates could see 15-30% loss | N+M sequential lamination is inherently more challenging than a standard multilayer build because it requires multiple lamination cycles, yield rates could see 15-30% loss | N+M sequential lamination is inherently more challenging than a standard multilayer build because it requires multiple lamination cycles, yield rates could see 15-30% loss | HDI PCB requires less layers owing to its high density, but it is more challenging than N+M because it requires multiple cycles of laser drilling, sequential buildup and ultra fine feature formation. That would see further yield rate loss. | HDI PCB requires less layers owing to its high density, but it is more challenging than N+M because it requires multiple cycles of laser drilling, sequential buildup and ultra fine feature formation. That would see further yield rate loss. | |
| ASP Index | 1 | 1.3 | 2.2 | 2.1 | 2.5 | ~5-6 |
Source: Aletheia Capital, TAG
We see an increasing trend for adopting HDI in advanced AI acclerators: 1) it shortens highfrequency signal paths, reducing signal attenuation and latency, 2) it increases circuit density through microvia technology, including blind and buried vias, 3) it saves internal space and 4) it optimizes heat dissipation efficiency. HDI normally requires fewer layers compared to conventional multi-lam PCB due to its higher density, but HDI PCB is still more challenging because it requires multiple cycles of laser drilling, sequential buildup, and ultra-fine feature formation. The longer processing and lower yield rate will further drive up content value for PCB.
We believe its leading N+M position and franchise in the US allows TTM secure more AI server opportunities in the future. Apart from Google, we reckon TTM is also one of the key suppliers for Nvidia switch board PCBs and upcoming LPU, which can generate incremental demand for PCB/CCL with its 52L design with M9/M8 materials. Also, our supply chain suggests TTM is qualified to be one of the major PCB suppliers for Meta's ASICs (MTIA series), which will have more meaningful volume in the coming years.
Driver 2: A&D and medical segment growth from both organic and external
Aerospace & Defense represented approximately 46% of 2025 revenue and has become one of TTM's most important structural growth platforms. According to the company, the current program backlog of A&D has reached an historical high level of USD1.7bn. TTM's A&D strategy is to move vertically through the electronics supply chain from PCB/components to module/system solution providers as shown below. This vertical integration is strategically important because TTM can potentially increase its dollar content as customers move from individual components toward increasingly integrated electronic systems.
FIGURE 7: TTM'S VERTICAL INTEGRATION INTO SYSTEM LEVEL
Source: Aletheia Capital, TAG
4 October 2026
TTM is investing heavily to expand North American capacity for A&D, including ultra HDI, munitions acceleration, defense growth, PCB reshoring and system design & integration. Given the sensitivity of the business, it is critical to build capacity in the US for core components. Management expects these investments to enable more than USD500mn of incremental projected throughput by 2028.
24
TTM Technologies
A Unique Proxy Standing for USA PCB
4 October 2026
FIGURE 8: TTM'S POSITION IN A&D AREA
Source: Company and Aletheia Capital, TAG
Apart from organic growth, the company is also using M&A to aggressive expand its A&D business. In August 2026, TTM announced it would acquire Epiq, a solution provider of RF products, space compute, and electronic warfare applications, for approximately USD$1.1bn (see the press release for more details). The acquisition will elevate TTM's vertical integration capabilities for its integrated electronics products and expands its addressable opportunities in high-priority defense mission areas. According to the company, the acquisition is expected to be immediately accretive to EBITDA margins and accretive to non-GAAP diluted EPS during 2028 for the A&D business.
Earlier this year, TTM also announced two acquisitions: Swiss Technology Group (STG) & ILFA. Both are European PCB companies (see the press release for more details). We view it is a milestone for TTM in establishing its Europe footprint. STG is a Swiss-based PCB company focused on medical (surgical robotics, hearing aids, medical imaging and implantable solutions). Its focus on miniaturized and small form-factor technology is also highly relevant for TTM's A&D business. ILFA has a 45-year legacy as a German provider of complex PCB solutions spanning A&D, industrial, and medical technology markets.
25
4 October 2026
26
BUY: a unique proxy standing for USA PCB
We view TTM as a unique proxy among all PCB peers given its presence in the US with leading advanced capacity and tight relationships with key customers. AI PCB will lead the growth at a 75% CAGR in 2026-28 and boost the group sales CAGR at 39%. We forecast TTM earnings will double from FY26E to FY28E with better product mix and increasing AI exposure. We estimate ROE will expand to 26%/32% in 2026/27.
We expect increasing demand to accelerate capacity additions, supported by TTM's leadership in high-end PCB technology, its long-term relationship with key customers and unique industry position (the largest US-based PCB maker). In the meantime, the continued investment in high-end PCB (ultra HDI) and system integration will further secure TTM's leading position in the A&D space as one of the few key suppliers. We initiate with a BUY and a target price of USD236 by using a 27x FY27/28 average PER.
FIGURE 9: OUR ASSUMPTION OF TTM
| Sales breakdown (US$ m) | 2024 | 2025 | 2026 | 2027 | 2028 | CAGR 26-28 |
|---|---|---|---|---|---|---|
| Aerospace and Defence | 1,128 | 1,284 | 1,429 | 1,744 | 1,970 | - |
| Automotive | 318 | 302 | 286 | 286 | 286 | - |
| Data Center and networking | 660 | 910 | 2,169 | 3,880 | 4,850 | - |
| Medical/Industrial/Instrumentation | 336 | 411 | 538 | 646 | 775 | - |
| Total Sales | 2,443 | 2,906 | 4,423 | 6,556 | 7,882 | - |
| YoY (%) | 2024 | 2025 | 2026 | 2027 | 2028 | |
| Aerospace and Defence | 9% | 14% | 11% | 22% | 13% | 15% |
| Automotive | -10% | -5% | -5% | 0% | 0% | -2% |
| Data Center and networking | 35% | 38% | 138% | 79% | 25% | 75% |
| Medical/Industrial/Instrumentation | -7% | 22% | 31% | 20% | 20% | 24% |
| Total Sales | 9% | 19% | 52% | 48% | 20% | 39% |
| Mix (%) | 2024 | 2025 | 2026 | 2027 | 2028 | |
| Aerospace and Defence | 46% | 44% | 32% | 27% | 25% | - |
| Automotive | 13% | 10% | 6% | 4% | 4% | - |
| Data Center and networking | 27% | 31% | 49% | 59% | 62% | - |
| Medical/Industrial/Instrumentation | 14% | 14% | 12% | 10% | 10% | - |
| Total Sales | 100% | 100% | 100% | 100% | 100% | - |
Source: Aletheia Capital, TAG
We use SOTP to derive our target multiple as we think it will better capture its dual growth drivers (AI and A&D). We give AI-related business (datacenter and networking) a higher multiple at 30x considering its faster growth rate and higher GPM (25-30%), with A&D and the medical segment at 20x for more moderate growth (low teens) and GPM level (15-25%).
FIGURE 10: SOTP VALUATION
| SOTP valuation | 2027 | 2028 |
|---|---|---|
| Sales mix (%) | ||
| A&D | 27% | 25% |
| Auto | 4% | 4% |
| Data Center and Networking | 59% | 62% |
| Medical and others | 10% | 10% |
| G.P. (US$ m) | ||
| A&D | 401 | 493 |
| Auto | 40 | 40 |
| Data Center and Networking | 1,067 | 1,358 |
| Medical and others | 84 | 101 |
| G.P. mix (%) | ||
| A&D | 25% | 25% |
| Auto | 3% | 2% |
| Data Center and Networking | 67% | 68% |
| Medical and others | 5% | 5% |
| Targeted multiple (x) | ||
| Data Center and Networking | 30 | 30 |
| A&D and others | 20 | 20 |
| Implied multiple | 27.6 | 27.8 |
Source: Aletheia Capital, TAG
TTM Technologies
A Unique Proxy Standing for USA PCB
FIGURE 11: 12-MONTH FORWARD PER BAND FOR TTM
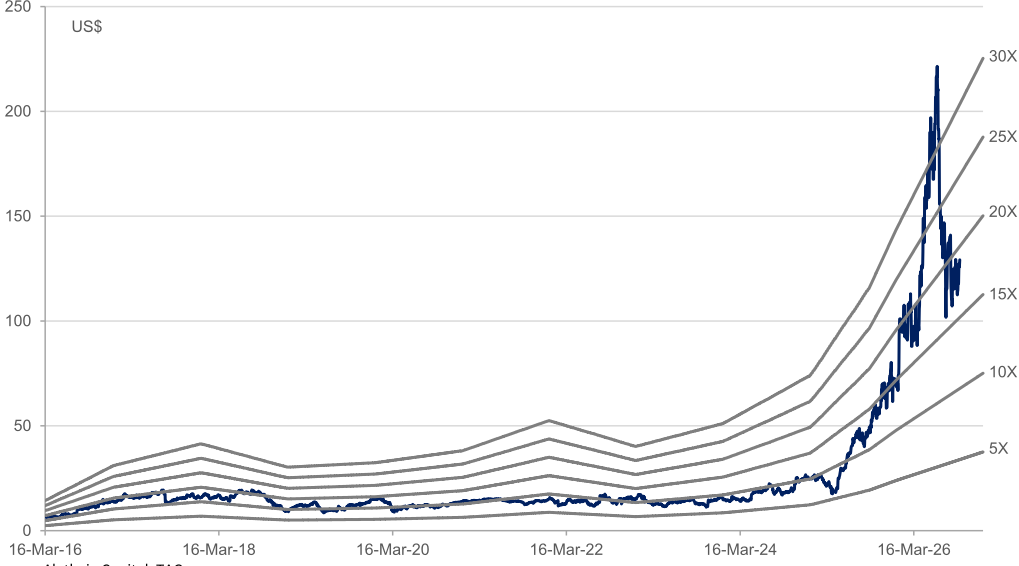
Source: Aletheia Capital, TAG
4 October 2026
27
TTM Technologies
Earnings model
| FYE Dec (non-GAAP, US$ mn) | 1Q26 | 2Q26 | 3Q26E | 4Q26E | 1Q27E | 2Q27E | 3Q27E | 4Q27E | 2023 | 2024 | 2025 | 2026E | 2027E | 2028E |
|---|---|---|---|---|---|---|---|---|---|---|---|---|---|---|
| Aerospace and Defense | 338 | 371 | 377 | 343 | 413 | 453 | 460 | 418 | 1,031 | 1,128 | 1,284 | 1,429 | 1,744 | 1,970 |
| Automotive | 68 | 79 | 73 | 66 | 68 | 79 | 73 | 66 | 351 | 318 | 302 | 286 | 286 | 286 |
| Data Center and networking | 305 | 405 | 567 | 892 | 914 | 932 | 964 | 1,070 | 490 | 660 | 910 | 2,169 | 3,880 | 4,850 |
| Medical/Industrial/Instrumentation | 135 | 148 | 136 | 119 | 162 | 178 | 163 | 143 | 361 | 336 | 411 | 538 | 646 | 775 |
| Others | 0 | 0 | 0 | 0 | 0 | 0 | 0 | 0 | 0 | 0 | 0 | 0 | 0 | 0 |
| Total Sales | 846 | 1,004 | 1,152 | 1,420 | 1,557 | 1,642 | 1,659 | 1,698 | 2,233 | 2,443 | 2,906 | 4,423 | 6,556 | 7,882 |
| Aerospace and Defense | 40% | 37% | 33% | 24% | 27% | 28% | 28% | 25% | 46% | 46% | 44% | 32% | 27% | 25% |
| Automotive | 8% | 8% | 6% | 5% | 4% | 5% | 4% | 4% | 16% | 13% | 10% | 6% | 4% | 4% |
| Data Center and networking | 36% | 40% | 49% | 63% | 59% | 57% | 58% | 63% | 22% | 27% | 31% | 49% | 59% | 62% |
| Medical/Industrial/Instrumentation | 16% | 15% | 12% | 8% | 10% | 11% | 10% | 8% | 16% | 14% | 14% | 12% | 10% | 10% |
| Others | 0% | 0% | 0% | 0% | 0% | 0% | 0% | 0% | 0% | 0% | 0% | 0% | 0% | 0% |
| Total Sales | 100% | 100% | 100% | 100% | 100% | 100% | 100% | 100% | 100% | 100% | 100% | 100% | 100% | 100% |
| Sales | 846 | 1,004 | 1,152 | 1,420 | 1,557 | 1,642 | 1,659 | 1,698 | 2,233 | 2,443 | 2,906 | 4,423 | 6,556 | 7,882 |
| Gross profit | 189 | 220 | 277 | 353 | 377 | 395 | 402 | 418 | 458 | 497 | 618 | 1,039 | 1,592 | 1,992 |
| Opex | 81 | 81 | 94 | 119 | 140 | 147 | 147 | 148 | 259 | 263 | 278 | 375 | 583 | 677 |
| Operating profit | 108 | 138 | 183 | 235 | 236 | 248 | 255 | 270 | 199 | 234 | 340 | 664 | 1,009 | 1,315 |
| Non-OP | -14 | -13 | -22 | -25 | -26 | -27 | -27 | -28 | -41 | -31 | -38 | -74 | -109 | -122 |
| Pretax profit | 94 | 126 | 161 | 209 | 210 | 220 | 228 | 242 | 158 | 203 | 303 | 589 | 900 | 1,192 |
| Net profit | 80 | 107 | 138 | 180 | 181 | 189 | 196 | 208 | 140 | 177 | 259 | 505 | 774 | 1,025 |
| Non-GAAP EPS (US$) | 0.75 | 0.99 | 1.32 | 1.73 | 1.75 | 1.84 | 1.90 | 2.02 | 1.34 | 1.70 | 2.46 | 4.79 | 7.51 | 9.97 |
| Growth | 1Q26 | 2Q26 | 3Q26E | 4Q26E | 1Q27E | 2Q27E | 3Q27E | 4Q27E | 2023 | 2024 | 2025 | 2026E | 2027E | 2028E |
| Sales QoQ | 9.3%18.7% | 14.8% | 23.3% | 9.6% | 5.5% | 1.0% | 2.3% | - | - | - | - | - | - | |
| Sales YoY | 30.4% | 37.4% | 53.1% | 83.4% | 84.0% | 63.6% | 44.0% | 19.6% | -10.5% | 9.4% | 19.0% | 52.2% | 48.2% | 20.2% |
| EPS QoQ | 7.1%32.0% | 33.7% | 30.4% | 1.5% | 4.9% | 3.5% | 6.2% | - | - | - | - | - | - | |
| EPS YoY | 50.0% | 70.7% | 94.7% | 146.6% | 133.5% | 85.6% | 43.6% | 17.0% | -23.4% | 26.9% | 44.7% | 94.7% | 56.8% | 32.7% |
| Margin | 1Q26 | 2Q26 | 3Q26E | 4Q26E | 1Q27E | 2Q27E | 3Q27E | 4Q27E | 2023 | 2024 | 2025 | 2026E | 2027E | 2028E |
| Gross margin | 22.3% | 21.9% | 24.0% | 24.9% | 24.2% | 24.0% | 24.2% | 24.6% | 20.5% | 20.4% | 21.3% | 23.5% | 24.3% | 25.3% |
| Opex | 9.5% | 8.1% | 8.2% | 8.3% | 9.0% | 9.0% | 8.8% | 8.7% | 11.6% | 10.8% | 9.6% | 8.5% | 8.9% | 8.6% |
| OP margin | 12.8% | 13.8% | 15.9% | 16.5% | 15.2% | 15.1% | 15.4% | 15.9% | 8.9% | 9.6% | 11.7% | 15.0% | 15.4% | 16.7% |
| Non-OP | -1.7% | -1.3% | -1.9% | -1.8% | -1.7% | -1.7% | -1.7% | -1.6% | -1.8% | -1.3% | -1.3% | -1.7% | -1.7% | -1.6% |
| Net margin | 9.5% | 10.6% | 12.0% | 12.7% | 11.6% | 11.5% | 11.8% | 12.3% | 6.3% | 7.3% | 8.9% | 11.4% | 11.8% | 13.0% |
Source: Company, Aletheia Capital/TAG
4 October 2026
28
A Unique Proxy Standing for USA PCB
Financial Statements
| INCOME STATEMENT Dec 31 (US$ mn), non-GAAP | 2023 | 2024 | 2025 | 2026E | 2027E | 2028E | BALANCE SHEET Dec 31 (US$ mn) | 2023 | 2024 | 2025 | 2026E | 2027E | 2028E |
|---|---|---|---|---|---|---|---|---|---|---|---|---|---|
| Revenue | 2,233 | 2,443 | 2,906 | 4,423 | 6,556 | 7,882 | Cash/ST investment | 450 | 504 | 501 | 474 | 516 | 928 |
| COGS | -1,775 | -1,946 | -2,288 | -3,384 | -4,964 | -5,891 | Inventory | 213 | 225 | 250 | 379 | 574 | 697 |
| Gross profit | 458 | 497 | 618 | 1,039 | 1,592 | 1,992 | Receivable | 414 | 449 | 564 | 867 | 1,311 | 1,576 |
| Operating expense | -259 | -263 | -278 | -375 | -583 | -677 | Current assets | 1,430 | 1,607 | 1,855 | 2,261 | 2,942 | 3,742 |
| EBITDA | 361 | 385 | 504 | 845 | 1,214 | 1,559 | Fixed assets | 894 | 948 | 1,092 | 1,312 | 1,545 | 1,737 |
| Operating profit | 199 | 234 | 340 | 664 | 1,009 | 1,315 | Goodwill & intangibles | 939 | 862 | 825 | 788 | 751 | 714 |
| Interest expense | -42 | -32 | -54 | -89 | -109 | -122 | Other LT assets | 61 | 56 | 68 | 68 | 68 | 68 |
| Other expense (income) | 1 | 1 | 17 | 15 | 0 | 0 | LT assets | 1,894 | 1,866 | 1,985 | 2,169 | 2,364 | 2,520 |
| Profit before tax | 158 | 203 | 303 | 589 | 900 | 1,192 | Total assets | 3,324 | 3,472 | 3,840 | 4,429 | 5,306 | 6,261 |
| Tax | 19 | 25 | 44 | 84 | 126 | 167 | |||||||
| Net profit (parent) | 140 | 177 | 259 | 505 | 774 | 1,025 | Payable | 335 | 406 | 544 | 759 | 999 | 1,077 |
| EPS $, GAAP | -0.18 | 0.54 | 1.69 | 3.77 | 6.45 | 8.90 | Other liability | 369 | 403 | 419 | 419 | 419 | 419 |
| EPS $, non-GAAP | 1.34 | 1.70 | 2.46 | 4.79 | 7.51 | 9.97 | Current liabilities | 704 | 809 | 962 | 1,178 | 1,418 | 1,495 |
| Change | LT liabilities | 1,109 | 1,100 | 1,116 | 1,123 | 1,135 | 1,147 | ||||||
| Revenue | -10.5% | 9.4% | 19.0% | 52.2% | 48.2% | 20.2% | Total liabilities | 1,813 | 1,909 | 2,078 | 2,301 | 2,553 | 2,642 |
| Gross profit | -2.9% | 8.5% | 24.3% | 68.0% | 53.3% | 25.1% | Common shares | 881 | 911 | 952 | 922 | 882 | 832 |
| Operating profit | -15.2% | 17.3% | 45.6% | 95.0% | 52.1% | 30.2% | Retained earnings | 782 | 838 | 1,016 | 1,412 | 2,077 | 2,993 |
| Net profit | -23.0% | 27.2% | 45.9% | 95.1% | 53.3% | 32.4% | Equity | 1,511 | 1,564 | 1,762 | 2,129 | 2,753 | 3,619 |
| EPS, non-GAAP | -23.4% | 26.9% | 44.7% | 94.7% | 56.8% | 32.7% | Liability&Equity | 3,324 | 3,472 | 3,840 | 4,429 | 5,306 | 6,261 |
| CASH FLOW | RATIO & PER SHARE DATA | RATIO & PER SHARE DATA | RATIO & PER SHARE DATA | RATIO & PER SHARE DATA | RATIO & PER SHARE DATA | RATIO & PER SHARE DATA | RATIO & PER SHARE DATA | RATIO & PER SHARE DATA | RATIO & PER SHARE DATA | RATIO & PER SHARE DATA | RATIO & PER SHARE DATA | RATIO & PER SHARE DATA | RATIO & PER SHARE DATA |
| Dec 31 (US$ mn) | 2023 2024 | 2023 2024 | 2025 | 2026E | 2027E | 2028E | Dec 31 (US$ mn) | 2023 | 2024 | 2025 | 2026E | 2027E | 2028E |
| Net profit | -19 | 56 | 177 | 396 | 665 | 916 | Gross margin (%) | 18.5 | 19.5 | 20.7 | 22.8 | 23.8 | 24.9 |
| Dep. & amortization | 161 | 150 | 147 | 166 | 204 | 244 | EBITDA margin (%) | 9.1 | 10.9 | 14.2 | 16.0 | 16.7 | 18.3 |
| Chg in WC | 100 | -19 | -98 | -217 | -399 | -310 | Op. Profit margin (%) | 1.9 | 4.8 | 9.1 | 12.2 | 13.6 | 15.2 |
| Others | -55 | 49 | 66 | 0 | 0 | 0 | Net Profit margin (%) | -0.8 | 2.3 | 6.1 | 9.0 | 10.1 | 11.6 |
| OPN cash flow | 187 | 237 | 292 | 345 | 471 | 850 | ROE (%) | -1.2 | 3.7 | 10.7 | 20.4 | 27.2 | 28.7 |
| Capex | -160 | -186 | -293 | -350 | -400 | -400 | ROA (%) | -0.6 | 1.7 | 4.9 | 9.6 | 13.7 | 15.8 |
| Chg in investment | 6 | 0 | 0 | 0 | 0 | 0 | Gross gearing (%) | 54.5 | 55.0 | 54.1 | 51.9 | 48.1 | 42.2 |
| Others | 62 | 40 | 19 | 7 | 12 | 12 | Net gearing (%) | 36.1 | 31.2 | 28.3 | 24.7 | 17.6 | 2.0 |
| Investing CF | -92 | -146 | -274 | -343 | -388 | -388 | Asset turn (x) | 0.7 | 0.7 | 0.8 | 1.1 | 1.3 | 1.4 |
| Chg in debt | -7 | -1 | -4 | 0 | 0 | 0 | Leverage (x) | 2.2 | 2.2 | 2.2 | 2.1 | 2.0 | 1.8 |
| Equity raised / Repurchased | -24 | -34 | -18 | -30 | -40 | -50 | Payable days | 70 | 69 | 75 | 70 | 64 | 64 |
| Dividend paid | 0 | 0 | 0 | 0 | 0 | 0 | Receivable days | 72 | 64 | 64 | 59 | 61 | 67 |
| Others | -16 | -1 | 1 | 0 | 0 | 0 | Inventory days | 38 | 41 | 38 | 34 | 35 | 39 |
| Financing CF | -48 | -37 | -21 | -30 | -40 | -50 | EPS | -0.2 | 0.5 | 1.7 | 3.8 | 6.4 | 8.9 |
| FX & other adj | 0 | 0 | 0 | 0 | 0 | 0 | BVPS | 14.7 | 15.0 | 16.7 | 20.4 | 26.7 | 35.2 |
| Chg in cash | 47 | 54 | -2 | -28 | 43 | 412 | Net cash per share | -5.3 | -4.7 | -4.7 | -5.0 | -4.7 | -0.7 |
| Beginning cash | 403 | 450 | 516 | SPS | 21.7 | 23.5 | 42.4 | 63.6 | 76.6 | ||||
| 504 | 501 | 474 | -25.0 | 0.2 | 27.6 -0.2 | 0.7 | 5.4 | ||||||
| End cash | 450 | 504 | 501 | 474 | 516 | 928 | FCFPS | - | - | 1.6 | - | ||
| FCF | -2,566 | 24 | -20 | 74 | 163 | 554 | DPS | - | - | - |
Source: Company, Aletheia Capital /TAG
4 October 2026
29
Elite Material
www.aletheia-capital.com
AdvancedMaterial
Price: TWD 5,185
No CNY
Target Price: TWD 10,000
USD
linkedin icon circleçåçæå°çµæ
twiter icon circleçåçæå°çµæ
facebok icon circleçåçæå°çµæ
Total return: 93%
Risk: High
0.089
0.135
Shaotang Lee
+852 9193 6990 shaotang.lee@aletheia-capital.com
Warren Lau
+852 2534 7404 warren.lau@aletheia-capital.com
Skye Chen
+852 2534 7404
skye.chen@aletheia-capital.com
Elite Material
Bloomberg
RIC
2383 TT
2383.TW
Market cap (USDbn)
58.2
Average daily T/O (USD|mn)
362
Leader in CCL
We transfer coverage and reiterate BUY and set a NT$10,000 target price for EMC, based on 30x FY27/28E P/E, supported by continued material upgrades and price hikes for highend CCL. EMC is the best proxy to seize strong upside from ASIC AI into production ramping up (exposure to both Google TPU and AWS Trn3) into 2H26/2027. We estimate TPU unit demand will grow from 3.6m in 2026 to 8.5/12.0m in 2027/2028. EMC's capacity will double by the end of 2028 (vs '25) to support a strong demand pipeline and new AI CCL opportunities (more ASIC/GPU projects, HDI adoption and PTFE, for example) We think EMC's leading position will be more secured when migrating to more advanced CCL materials with fewer qualified suppliers.
Unstoppable upgrade trend in CCL
We believe the CCL upgrade cycle will continue to surprise the market because 1) stronger AI device unit growth (especially Google TPU we project 8.5/12m units in 2027/28), 2) significant content value growth via CCL material upgrades (M8/M9, PTFE), 3) wider AI end devices (GPU, ASIC, switches, CPU and LPU, for example) will all require high end PCB/CCL to support performance and 4) better cash flow and profitability via prepayment and LTAs. The overall industry is under a severe supply shortage at this stage, especially high-end products, with the key bottleneck in upstream material (CCL, glass fibre and copper foil) to trigger further rounds of price hikes. We believe EMC's leading position will become more solid when migrating to more advanced CCL materials (M8/M9) with 1) fewer and less qualified suppliers, and 2) additional capacity ready.
Capacity to double by end of 2028 (vs 2025) to support strong growth
EMC's capacity will double by the end of 2028 (vs 2025) to support a strong demand pipeline and new AI CCL opportunities, including 1) further CCL upgrades in TPU v9/Trn 4, 2) increasing adoption of HDI in AI accelerators to benefit EMC, 3) more ASIC/GPU projects like AMD/Meta, for example. M8 is becoming a standard material for AI servers/networking and we will see more advanced materials into 2027/28 (M9/PTFE). CCL is the most critical component in PCB and every generational upgrade implies the ASP will nearly double.
Buy with new TP at NT$10,000
We see a clear trend of CCL upgrades continuing into 2028 based on current design roadmaps and product pipelines. Its industry-leading position in high-end CCL and new capacity means EMC is the best proxy for upside from ASIC AI into production ramping up. We reiterate BUY and set a new TP at NT$10,000 with 30x FY27/28 PE. We roll over our valuation period to the average of 2027/28 with longer order visibility and more AI CCL upside for upgrades.
KEY FINANCIAL AND VALUATION MATRIX
ROE (%)
24.3
22.5
30.9
34.2
66.9
78.0
73.0
| Dec 31 (TWD mn) | 2022 | 2023 | 2024 | 2025 | 2026E | 2027E | 2028E |
|---|---|---|---|---|---|---|---|
| Revenue | 38,673 | 41,296 | 64,377 | 94,261 | 209,965 | 365,489 | 525,236 |
| Op Profit | 6,226 | 7,346 | 12,152 | 19,108 | 59,500 | 120,734 | 185,447 |
| Net Profit | 5,073 | 5,488 | 9,578 | 14,649 | 46,159 | 94,281 | 144,819 |
| EPS | 14.77 | 15.78 | 27.32 | 40.81 | 128.72 | 262.85 | 403.76 |
| Consensus EPS | - | - | - | - | 115.10 | 227.24 | 353.24 |
| PER (X) | 351.0 | 328.6 | 189.8 | 127.1 | 40.3 | 19.7 | 12.8 |
| PB (X) | 80.7 | 67.3 | 51.8 | 36.9 | 21.2 | 12.1 | 7.7 |
| Dividend Yield (%) | 0.2 | 0.2 | 0.3 | 0.5 | 1.5 | 3.0 | 4.7 |
Source: Company, FactSet, Aletheia/TAG
Please refer to important disclosures and disclaimers at the end of this report. This report is intended solely for the subscriber.
Unauthorized sharing, distribution, or reproduction may violate applicable regulatory requirements and could result in legal action.
Upside: 93%
Elite Material
Leader in CCL
FIGURE 1: INCOME STATEMENT FOR EMC
| (NT$m) | 1Q26 | 2Q26 | 3Q26E | 4Q26E | 1Q27E | 2Q27E | 3Q27E | 4Q27E | 2024 | 2025 | 2026E | 2027E | 2028E |
|---|---|---|---|---|---|---|---|---|---|---|---|---|---|
| Sales | 33,067 | 47,275 | 58,617 | 71,005 | 75,861 | 83,600 | 96,958 | 109,070 | 64,377 | 94,261 | 209,965 | 365,489 | 525,236 |
| Gross profit | 9,729 | 16,003 | 21,340 | 26,620 | 28,552 | 31,871 | 37,448 | 42,695 | 17,970 | 28,120 | 73,692 | 140,565 | 207,215 |
| Opex | 2,601 | 3,269 | 3,866 | 4,456 | 4,518 | 4,711 | 5,154 | 5,449 | 5,818 | 9,012 | 14,192 | 19,832 | 21,768 |
| Operating profit | 7,128 | 12,734 | 17,474 | 22,164 | 24,034 | 27,160 | 32,294 | 37,246 | 12,152 | 19,108 | 59,500 | 120,734 | 185,447 |
| Non-OP | 66 | 52 | 11 | 20 | 25 | 30 | 35 | 40 | -19 | -232 | 148 | 130 | 210 |
| Pretax profit | 7,194 | 12,785 | 17,485 | 22,184 | 24,059 | 27,190 | 32,329 | 37,286 | 12,133 | 18,876 | 59,649 | 120,864 | 185,657 |
| Tax expense | 1,854 | 2,912 | 3,845 | 4,879 | 5,291 | 5,980 | 7,111 | 8,201 | 2,554 | 4,227 | 13,490 | 26,583 | 40,837 |
| Net profit | 5,340 | 9,873 | 13,640 | 17,305 | 18,768 | 21,210 | 25,218 | 29,085 | 9,578 | 14,649 | 46,159 | 94,281 | 144,819 |
| EPS (NT$) | 14.89 | 27.55 | 38.03 | 48.25 | 52.32 | 59.13 | 70.31 | 81.09 | 27.32 | 40.81 | 128.72 | 262.85 | 403.76 |
| Growth | |||||||||||||
| Sales QoQ | 32.7% | 43.0% | 24.0% | 21.1% | 6.8% | 10.2% | 16.0% | 12.5% | - | - | - | - | - |
| Sales YoY | 52.5%110.0% | 133.1% | 184.8% | 129.4% | 76.8% | 65.4% | 53.6% | 55.9% | 46.4% | 122.7% | 74.1% | 43.7% | |
| EPS QoQ | 42.9% | 84.9% | 38.2% | 26.9% | 8.5% | 13.0% | 18.9% | 15.3% | - | - | - | - | - |
| EPS YoY | 53.9%183.9% | 244.0% | 363.1% | 251.5% | 114.8% | 84.9% | 68.1% | 73.1% | 49.4% | 215.4% | 104.2% | 53.6% | |
| Margin | |||||||||||||
| Gross margin | 29.4% | 33.9% | 36.4% | 37.5% | 37.6% | 38.1% | 38.6% | 39.1% | 27.9% | 29.8% | 35.1% | 38.5% | 39.5% |
| Opex | 7.9% | 6.9% | 6.6% | 6.3% | 6.0% | 5.6% | 5.3% | 5.0% | 9.0% | 9.6% | 6.8% | 5.4% | 4.1% |
| OP margin | 21.6% | 26.9% | 29.8% | 31.2% | 31.7% | 32.5% | 33.3% | 34.1% | 18.9% | 20.3% | 28.3% | 33.0% | 35.3% |
| Non-OP | 0.2% | 0.1% | 0.0% | 0.0% | 0.0% | 0.0% | 0.0% | 0.0% | 0.0% | -0.2% | 0.1% | 0.0% | 0.0% |
| Tax rate | 25.8% | 22.8% | 22.0% | 22.0% | 22.0% | 22.0% | 22.0% | 22.0% | 21.1% | 22.4% | 22.6% | 22.0% | 22.0% |
| Net margin | 16.1% | 20.9% | 23.3% | 24.4% | 24.7% | 25.4% | 26.0% | 26.7% | 14.9% | 15.5% | 22.0% | 25.8% | 27.6% |
Source: Company data, Aletheia/TAG
FIGURE 2: EMC CAPACITY EXPANSION PLAN
| (k sheets/month) | 2025 | 2026 | 2027 | 2028 |
|---|---|---|---|---|
| China | 4,650 | 4,650 | 7,050 | 8,850 |
| Taiwan | 600 | 900 | 1,500 | 1,500 |
| Malaysia | 600 | 600 | 750 | 750 |
| Total | 5,850 | 6,150 | 9,300 | 11,100 |
| YoY | 34% | 5% | 51% | 19% |
Source: Company, Aletheia/TAG
4 October 2026
31
4 October 2026
32
FIGURE 3: ASSUMPTIONS FOR EMC SALES AND GM
| 2023 | 2024 | 2025 | 2026 | 2027 | 2028 | |
|---|---|---|---|---|---|---|
| Sales mix (NT$mn) | ||||||
| Infrastructure | 20,784 | 38,292 | 64,154 | 166,472 | 308,975 | 459,061 |
| Server | 9,198 | 17,703 | 37,380 | 111,715 | 228,836 | 360,965 |
| Switch | 11,014 | 17,521 | 20,533 | 44,610 | 67,260 | 82,441 |
| Basestation | 572 | 3,069 | 6,241 | 10,148 | 12,879 | 15,655 |
| Mobile device | 13,745 | 16,685 | 20,525 | 30,884 | 42,121 | 51,199 |
| Auto and Industry | 6,767 | 9,400 | 9,582 | 12,608 | 14,392 | 14,977 |
| Total | 41,296 | 64,377 | 94,261 | 209,965 | 365,489 | 525,236 |
| Sales mix | ||||||
| Infrastructure | 50% | 59% | 68% | 79% | 85% | 87% |
| Server | 44% | 46% | 58% | 67% | 74% | 79% |
| Switch | 53% | 46% | 32% | 27% | 22% | 18% |
| Basestation | 3% | 8% | 10% | 6% | 4% | 3% |
| Mobile device | 33% | 26% | 22% | 15% | 12% | 10% |
| Auto and Industry | 16% | 15% | 10% | 6% | 4% | 3% |
| Total | 100% | 100% | 100% | 100% | 100% | 100% |
| Growth, YoY | ||||||
| Infrastructure | 32% | 84% | 68% | 159% | 86% | 49% |
| Server | 41% | 92% | 111% | 199% | 105% | 58% |
| Switch | 24% | 59% | 17% | 117% | 51% | 23% |
| Basestation | 82% | 437% | 103% | 63% | 27% | 22% |
| Mobile device | -7% | 21% | 23% | 50% | 36% | 22% |
| Auto and Industry | -17% | 39% | 2% | 32% | 14% | 4% |
| Total | 7% | 56% | 46% | 123% | 74% | 44% |
| Gross margin | ||||||
| Infrastructure | 29.4% | 30.2% | 31.9% | 38.1% | 40.6% | 41.3% |
| Server | 29.5% | 31.4% | 33.7% | 39.2% | 41.6% | 42.0% |
| Switch | 29.5% | 30.3% | 31.3% | 38.4% | 40.6% | 41.4% |
| Basestation | 25.0% | 21.9% | 23.0% | 25.0% | 25.0% | 25.0% |
| Mobile device | 25.5% | 24.3% | 26.6% | 26.2% | 27.0% | 27.0% |
| Auto and Industry | 23.5% | 24.5% | 24.7% | 25.6% | 25.0% | 25.0% |
| Total | 27.4% | 27.9% | 29.8% | 35.1% | 38.5% | 39.5% |
Source: Company, Aletheia/TAG
Financial Statements
INCOME STATEMENT
BALANCE SHEET
| Dec 31 (TWD mn) | 2023 | 2024 | 2025 | 2026E | 2027E | 2028E |
|---|---|---|---|---|---|---|
| Revenue | 41,296 | 64,377 | 94,261 | 209,965 | 365,489 | 525,236 |
| COGS | -29,964 | -46,407 | -66,141 | -136,272 | -224,924 | -318,021 |
| Gross profit | 11,333 | 17,970 | 28,120 | 73,692 | 140,565 | 207,215 |
| Operating expense | -3,987 | -5,818 | -9,012 | -14,192 | -19,832 | -21,768 |
| EBITDA | 8,920 | 14,218 | 20,942 | 62,553 | 124,596 | 190,176 |
| Operating profit | 7,346 | 12,152 | 19,108 | 59,500 | 120,734 | 185,447 |
| Interest expense (income) | -198 | -315 | -216 | -281 | -199 | -119 |
| Other expense (income) | 272 | 297 | -16 | 429 | 329 | 329 |
| Profit before tax | 7,420 | 12,133 | 18,876 | 59,649 | 120,864 | 185,657 |
| Tax | -1,931 | -2,564 | -4,231 | -13,496 | -26,590 | -40,844 |
| Net profit (parent) | 5,488 | 9,578 | 14,649 | 46,159 | 94,281 | 144,819 |
| EPS NT$ | 15.8 | 27.3 | 40.8 | 128.7 | 262.9 | 403.8 |
| Change | ||||||
| Revenue | 6.8% | 55.9% | 46.4% | 122.7% | 74.1% | 43.7% |
| Gross profit | 16.7% | 58.6% | 56.5% | 162.1% | 90.7% | 47.4% |
| Operating profit | 18.0% | 65.4% | 57.2% | 211.4% | 102.9% | 53.6% |
| Net profit | 8.2% | 74.5% | 52.9% | 215.1% | 104.3% | 53.6% |
| EPS | 6.8% | 73.1% | 49.4% | 215.4% | 104.2% | 53.6% |
CASH FLOW
2024 2025 2026E 2027E 2028E Dec 31 (TWD mn)
2023
2024
2025 2026E 2027E 2028E
41,296 64,377 94,261 209,965 365,489 525,236 Cash/ST investment
9,259 14,989 20,008 20,556 38,785 78,897
-3,987 -5,818 -9,012 -14,192 -19,832 -21,768 Current assets
6,135 9,437 16,752 27,254 44,985 63,604
17,196 25,865 36,065 69,988 121,830 175,079
33,675 51,494 73,980 118,954 206,754 318,735
8,920 14,218 20,942 62,553 124,596 190,176 Fixed assets
16,655 21,387 30,864 48,293 59,820 70,480
7,346 12,152 19,108 59,500 120,734 185,447 Goodwill & intangibles
2,222 2,720 2,495 2,442 2,382 2,322
-119 Other LT assets
875
479
574 1,215 1,205 1,195
329 LT assets
19,752 24,586 33,933 51,951 63,407 73,997
7,420 12,133 18,876 59,649 120,864 185,657 Total assets
53,427 76,080 107,913 170,904 270,162 392,732
403.8 Other liability
10,489 15,963 24,518 50,514 83,376 117,886
12,584 14,219 21,713 21,623 21,533 21,443
Current liabilities
23,073 30,182 46,231 72,138 104,910 139,330
LT liabilities
3,544 10,804 11,247 11,147 11,047 10,947
6.8% 55.9% 46.4% 122.7% 74.1% 43.7% Total liabilities
26,617 40,986 57,477 83,284 115,956 150,276
16.7% 58.6% 56.5% 162.1% 90.7% 47.4% Common shares
3,432 3,466 3,583 3,583 3,583 3,583
18.0% 65.4% 57.2% 211.4% 102.9% 53.6% Retained earnings
19,875 25,997 34,744 71,929 138,515 226,766
6.8% 73.1% 49.4% 215.4% 104.2% 53.6% Liability&Equity
26,809 35,094 50,435 87,620 154,205 242,456
53,427 76,080 107,913 170,904 270,162 392,732
RATIO & PER SHARE DATA
Dec 31 (TWD mn)
2023
2024 2025 2026E 2027E 2028E Dec 31 (TWD mn)
2023
2024
2025 2026E 2027E 2028E
Net profit
5,488 9,569 14,645 46,159 94,281 144,819 Gross margin (%)
27.4
27.9
29.8
35.1
38.5
39.5
Dep. & amortization
1,302 1,769 1,849
2,623
3,534
4,400 EBITDA margin (%)
21.6
22.1
22.2
29.8
34.1
36.2
Chg in WC
-2,224 -6,204 -4,901 -18,429 -36,710 -37,359 Op. Profit margin (%)
17.8
18.9
20.3
28.3
33.0
35.3
Others
-1,677 2,129
374
-641
10
10 Net Profit margin (%)
13.3
14.9
15.5
22.0
25.8
27.6
OPN cash flow
2,890 7,263 11,968 29,712 61,114 111,871 ROE (%)
22.5
30.9
34.2
66.9
78.0
73.0
Capex
-3,281 -5,867 -9,490 -20,000 -15,000 -15,000 ROA (%)
11.3
14.8
15.9
33.1
42.7
43.7
Chg in investment
0
0
0
0
0
0 Gross gearing (%)
49.8
53.9
53.3
48.7
42.9
38.3
Others
-776
-34
-398
0
0
0 Net gearing (%)
(2.2)
(0.1)
(5.0)
(3.7)
(14.1)
(25.6)
Investing CF
-4,057 -5,901 -9,888 -20,000 -15,000 -15,000 Asset turn (x)
0.9
1.0
1.0
1.5
1.7
1.6
Chg in debt
2,954
-614 -2,682
-190
-190
-190 Leverage (x)
2.0
2.1
2.2
2.0
1.8
1.7
Equity raised
103
35
117
0
0
0 Payable days
104
104
112
100
109
115
Dividend paid
-2,830 -3,439 -5,894 -8,974 -27,695 -56,568 Receivable days
127
122
120
92
96
103
Others
-118 8,134 11,235
0
0
0 Inventory days
63
61
72
59
59
62
Financing CF
109 4,116 2,776 -9,164 -27,885 -56,758 EPS
15.8
27.3
40.8 128.7 262.9 403.8
FX & other adj
-126
251
163
0
0
0 BVPS
77.1 100.1 140.6 244.3 429.9 676.0
Chg in cash
-1,185 5,729 5,020
548 18,229 40,113 Net cash per share
1.7
0.1
7.0
9.1
60.4 172.8
Beginning cash
10,444 9,259 14,988 20,008 20,556 38,785 SPS
118.7 183.6 262.8 585.4 1,019.0 1,464.4
End cash
9,259 14,988 20,008 20,556 38,785 78,897 FCFPS
4.1
-1.4
6.3
29.5 129.0 270.3
FCF
1,432
-484 2,272 10,564 46,253 96,947 DPS
10.0
16.6
25.0
77.2 157.7 242.3
Source: Company, Aletheia Capital /TAG
4 October 2026
33
4 October 2026
34
Macro/Strategy
Alētheia Research Team
LEAD ANALYST
Sector
LEAD ANALYST
Global Strategy
Asianomics Jonathan Wilmot Technology Hardware Dr. Jim Walker Consumer & Internet
Tech Thematic Strategy
Asia Equity Strategy Keith Woolcock David Scott China Technology Telecoms
China Strategy
Tactical Alpha Strategy
Global Commodities Vincent Chan CrossASEAN
Warren Lau
Nirgunan
Tiruchelvam
Eric Wen
Chris Hoare
Angus Mackintosh
Justin Collazo
Steven Schlegel India MENA
Product Marketing Teams
Serving 300+ clients, 8,000+ touch points, in 20+ geographies with $15tr+ AUM
Al Park Linda Gustafsson Michael Chambers Graeme Bateman
al.porkl#olelheio-copilal.com lindotinordlinkcopilal.com michoel.chambersttolethela-copitol.com groeme.botemonittolethelo-copitol.com
1 201 962 0539
44 791 91 21 365
65 9858 9759
852 2534 7437
AMERICAS - NEW YORK
EUROPE - NORDICS
ASIA - SINGAPORE
ASIA - HONG KONG
Wayne Chang
wayne.chongitlolethela-coplfol.com
1 646 256 3366
AMERICAS - NEW YORK
- Terrence Alford 1 469 403 9936 femence.alfordalethela-copilal.com AMERICAS - DALLAS
- Daren Riley 44 748 31 59 865 doren.rlleyitalefthela-copltal.com EUROPE - LONDON
- Richard Wallace 852 2534 7429 richord.wolloceltalelthelo-copltol.com ASIA / EUROPE - HONG KONG
- Dhananjay Mahurkar 44 777 55 26 870 dhanonjay.moherkartiolethelo-copltal.com EUROPE- LONDON
- Augustine Chen 8869 2739 8793 augustine.chenilaletheio-copitol.com ASIA - HONG KONG
Maulik Pafel
Jaap Meijer
Firm Disclosures
Aletheia Capital Ltd ("Aletheia") is a limited company registered in Hong Kong, located at Unit 2407, World-Wide House, 19 Des Voeux Road, Central, Hong Kong.
Aletheia Analyst Network Ltd ('AAN') is a limited company registered in Hong Kong and is a wholly owned by Aletheia and is regulated by the Hong Kong Securities and Futures Commission, is a registered investment advisor with the U.S. Securities and Exchange Commission and is regulated by the Financial Conduct Authority, Firm Reference Number 794762.
Aletheia Capital (Singapore) Pte Ltd ('ACSG') is a limited company registered in Singapore, UEN 201823248E, and is a wholly owned by AAN and is an Exempt Financial Adviser as defined in the Financial Advisers Act.
This report was published by AAN and is distributed by AAN and ACSG. For investors in Singapore, this material is provided by ACSG pursuant to Regulation 32C of the Financial Advisers Regulations. If there are any matters arising from, or in connection with this material, please contact ACSG, Level 39, MBFC Tower 2, 10 Marina Blvd, Singapore 018983.
Additional information will be made available upon request.