PDF 原檔:報告_GS_AI光網路_20260417_original.pdf
原始內容

GLOBAL TECH
The next mega trend in AI infrastructure
Networking unlocks computing capability for single AI chips, connecting multiple chips (working together), enabling seamless data exchange and low latency, and driving AI to the next level. Along with an AI infrastructure ramp-up and rising computing power per rack, we expect all con fi gurations to enjoy strong growth ahead, opening a further 9x TAM unlock to US$154bn. Speci fi cally, we discover: (1) 16x / 45x dollar content increase in scale out / scale up, (2) 13x larger TAM for optics expanding from scale out to scale up, (3) 10x larger value market for pluggable optical modules in scale out from 2H25 AI server model to 2H27 AI server model. In this report, we analyze: (1) dollar content across di ff erent con fi gurations, (2) Scale-out and Scale-up market opportunities, (3) Component contributions across copper cables, pluggable optical modules, CPO, and PCB midplanes, and (4) EPS upside across the supply chain. We remain bullish on our Optical and PCB coverage, including Buy rated: Innolight, Eoptolink, TFC Optical, Landmark, VPEC, Sumitomo, Mitsubishi, Furukawa, Victory Giant (on CL), WUS, EMC and Shengyi. We expect these companies to see strong growth into 2028E on AI servers ramp up, speci fi cation upgrade, and usage expansion.
Allen Chang +852 2978-2930 allen.k.chang@gs.com Goldman Sachs (Asia) L.L.C.
Verena Jeng +852 2978-1681 verena.jeng@gs.com
Goldman Sachs (Asia) L.L.C.
James Schneider
+1 212 357-2929
jim.schneider@gs.com Goldman Sachs & Co. LLC
Mark Delaney +1 212 357-0535 mark.delaney@gs.com Goldman Sachs & Co. LLC
Ryo Harada +81 3 4587-9865 ryo.harada@gs.com
Goldman Sachs Japan Co., Ltd.
Goldman Sachs does and seeks to do business with companies covered in its research reports. As a result, investors should be aware that the fi rm may have a con fl ict of interest that could a ff ect the objectivity of this report. Investors should consider this report as only a single factor in making their investment decision. For Reg AC certi fi cation and other important disclosures, see the Disclosure Appendix, or go to www.gs.com/research/hedge.html. Analysts employed by non-US a ffi liates are not registered/quali fi ed as research analysts with FINRA in the U.S.
Contributing Authors
Allen Chang +852-2978-2930 allen.k.chang@gs.com Goldman Sachs (Asia) L.L.C.
Mark Delaney, CFA +1(212)357-0535 mark.delaney@gs.com Goldman Sachs & Co. LLC
Michael Ng, CFA +1(212)902-8618 michael.ng@gs.com Goldman Sachs & Co. LLC
Christian Hinderaker, CFA
+44(20)7774-7366 christian.hinderaker@gs.com Goldman Sachs International
Atsushi Ikeda +81(3)4587-9940 atsushi.ikeda@gs.com Goldman Sachs Japan Co., Ltd.
Ryan Huang, CFA +886 2 2730-4084 ryan.huang@gs.com Goldman Sachs (Asia) L.L.C., Taipei Branch
Ting Song +852-2978-6466 ting.song@gs.com Goldman Sachs (Asia) L.L.C.
Al Wang +886(2)2730-4081 al.wang@gs.com Goldman Sachs (Asia) L.L.C., Taipei Branch
Yuri Izumikawa
+81(3)4587-3643 yuri.x.izumikawa@gs.com Goldman Sachs Japan Co., Ltd.
Verena Jeng +852-2978-1681 verena.jeng@gs.com Goldman Sachs (Asia) L.L.C.
Ryo Harada +81(3)4587-9865 ryo.harada@gs.com Goldman Sachs Japan Co., Ltd.
Katherine Murphy +1(212)902-1151 katherine.a.murphy@gs.com Goldman Sachs & Co. LLC
Anmol Makkar +1(212)357-1366 anmol.makkar@gs.com Goldman Sachs & Co. LLC
Evelyn Yu +886 2 2730-4187 evelyn.yu@gs.com Goldman Sachs (Asia) L.L.C., Taipei Branch
Daiki Takayama +81(3)4587-9870 daiki.takayama@gs.com Goldman Sachs Japan Co., Ltd.
Yifan Hu +852-2978-0996 yifan.hu@gs.com Goldman Sachs (Asia) L.L.C.
Zorayda Montemayor +1(212)357-6403 zorayda.montemayor@gs.com Goldman Sachs & Co. LLC
Makoto Takahara +81(3)4587-4270 makoto.takahara@gs.com Goldman Sachs Japan Co., Ltd.
James Schneider, Ph.D. +1(212)357-2929 jim.schneider@gs.com
Goldman Sachs & Co. LLC
Chao Wang +886(2)2730-4195 kuan-chao.wang@gs.com Goldman Sachs (Asia) L.L.C., Taipei Branch
Daniela Costa +44(20)7774-8354 daniela.costa@gs.com Goldman Sachs International
Alexander Duval +44(20)7552-2995 alexander.duval@gs.com
Goldman Sachs International
Bruce Lu +886 2 2730-4185 bruce.lu@gs.com Goldman Sachs (Asia) L.L.C., Taipei Branch
Xuan Zhang +852-2978-1478 xuan.zhang@gs.com Goldman Sachs (Asia) L.L.C.
Hiroki Muramatsu +81(3)4587-9872 hiroki.muramatsu@gs.com Goldman Sachs Japan Co., Ltd.
Tommaso Nocchi +44(20)7552-2232 tommaso.nocchi@gs.com
Goldman Sachs International
Table of Contents
| (1) Blackwell network in details | 4 |
|---|---|
| (2) Rubin network in details | 5 |
| (3) Rubin Ultra network in details | 6 |
| (4) Optical networking supply chain | 7 |
| (5) Scale up / Scale out TAMand EPS implications | 8 |
| (6) Choice of connection: PCB vs. Copper vs. Optics | 13 |
| (7) Optics: speed upgrade continues | 15 |
| (8) CPO with Switch kick o ff in 2026 | 16 |
| (9) Pluggable optical modules: SiPh-based in expansion | 18 |
| (10) Light sourcing: Supply chain and Shortage | 20 |
| (11) Manufacturing: how to make SiPh optical modules and engines in CPO | 22 |
| (12) Attach rate: Pluggable optical modules to GPU / ASIC in scale out | 23 |
| (13) Optical Circuit Switch: Achieving all optics networking | 24 |
| (14) Technology adoption: pace varies on infrastructure | 26 |
| Appendix: Prysmian (PRY.MI, Buy): Largest global cable maker | 26 |
| Appendix: Scale up vs. Sale out vs. Scale across | 27 |
| Appendix: Closed vs. Open ecosystems | 27 |
| Appendix: Illustration of di ff erent connection products | 28 |
| Disclosure Appendix | 29 |
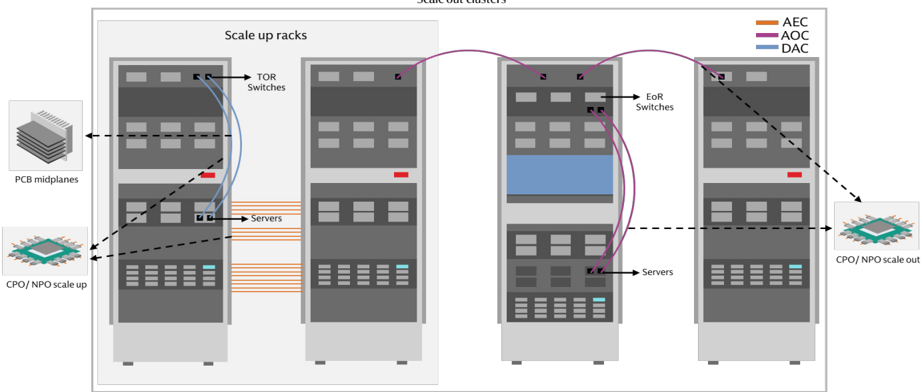
Scale out: Adding more equipment and connecting them through switching technologies, a widely used way of network expansion. Nowadays, AI clusters support scale out connections of 100k+ GPUs.
Scale up: Adding more GPUs and computing resources within the same piece of equipment, typically within the same server rack. Nowadays there are scale-up expansions that connect across racks, or the so-called supernodes, where the networking speed across racks are optimized to close to the connections within the same rack.
Networking is the next frontier in AI infrastructure, poised to enhance computing capability through seamless data exchange and low latency. While an investor concern is on networking con fi guration replacing another, we expect all con fi guration will enjoy strong growth. Speci fi cally:
- Dollar content increase by 16x / 45x in Scale Out / Scale Up per computing unit n from GB300 NVL72 (per computing unit means 72 GPUs per rack to reach NVL72) to Rubin Ultra NVL576 (per computing unit means 72 GPUs per rack, and 8 racks together to reach NVL576), with opportunities across pluggable optical modules, optical engines in CPO, copper cables, and PCB midplanes.
- A 13x larger addressable market for optical modules / optical engines expanding n from scale out (e.g. GB300 NVL72) to scale up (e.g. Rubin Ultra NVL576 level 2 scale up via CPO) per computing unit.
- A 10x larger value market for pluggable optical modules in scale out per n computing unit from GB300 NVL72 to Rubin Ultra NVL576, even with a 29% CPO penetration rate. The numbers of pluggable optical module (1.6T equivalent) per computing unit would increase from 216 units in GB300 NVL72 to 2.5k units in Rubin Ultra NVL576.
We expect the aggregate dollar content per computing unit across scale up and scale out to increase by 29x from US$315k in GB300 NVL72 to US$9.4bn in Rubin Ultra NVL576, and assuming the numbers of racks through the full product cycle are 48k racks for GB300 NVL72, and 16.5k computing units for Rubin Ultra NVL576, the aggregate value TAM across scale up and scale out would increase by 9x from US$15bn in GB300 NVL72 (mainly in 2026 ) to US$154bn in Rubin Ultra NVL576 (mainly in 2028 ). Among the US$154bn value TAM, 69% goes to scale up, or US$106bn, and CPO contributes US$91bn , or 59% of the US$154bn value TAM, assuming CPO at 29% penetration rate in scale out.
We expect signi fi cant EPS upside for key bene fi ciaries across Optical modules and engines (CPO/NPO adoption and optical module upgrades) , CW lasers and EMLs (CPO/NPO adoption and optical module upgrades) , and PCB/CCL manufacturers (PCB midplane adoption). We remain bullish on our optical and PCB coverage, including our Buy rating coverage: Innolight , Eoptolink, TFC Optical, Landmark, VPEC, Sumitomo, Mitsubishi, Furukawa, Victory Giant (on CL), WUS, EMC and Shengyi . We expect these companies to see strong growth into 2028 on AI servers ramp up, speci fi cation upgrade, and usage expansion. The migration would be fi rstly seen in leading global CSPs (cloud services providers), followed by China CSPs, driving sustainable strong growth in the networking supply chain over the coming fi ve years, in our view.
(1) Blackwell network in details
Exhibit 1: Nvidia GB300 AI rack network summary (2025)
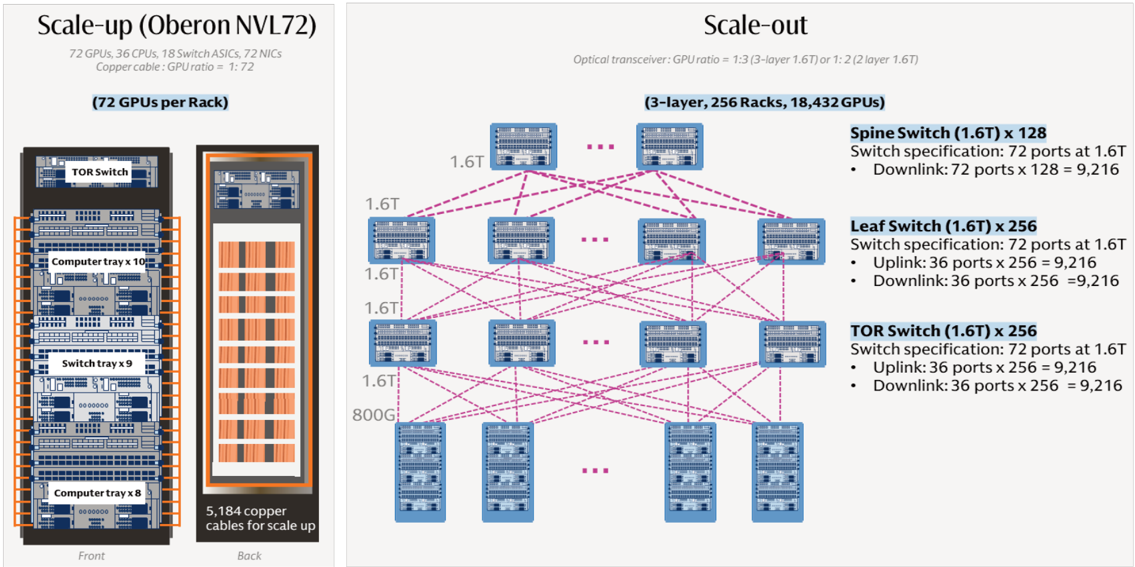
Scale out switch spec refer to Quantum-X800.
Source: Company data, Data compiled by Goldman Sachs Global Investment Research
(2) Rubin network in details
Exhibit 2: Nvidia Vera Rubin AI rack network summary (2026E)
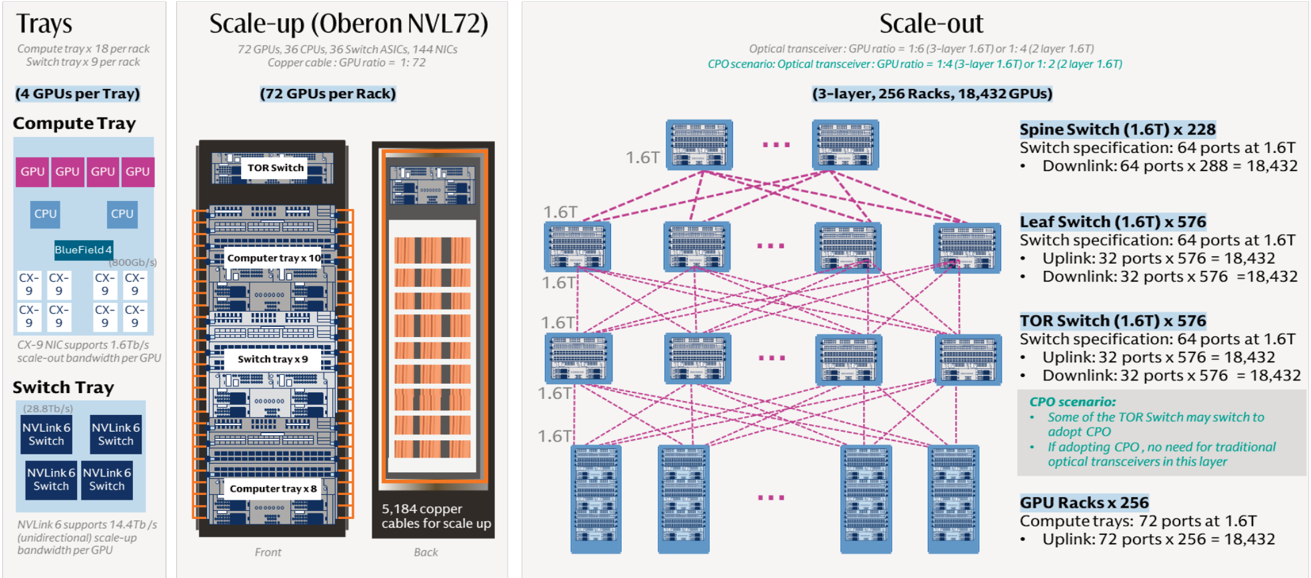
Scale out switch spec refer to Spectrum-6. The data in this exhibit is inferred by GS based on technology roadmap of Nvidia and our supply chain check.
Source: Company data, Goldman Sachs Global Investment Research
(3) Rubin Ultra network in details
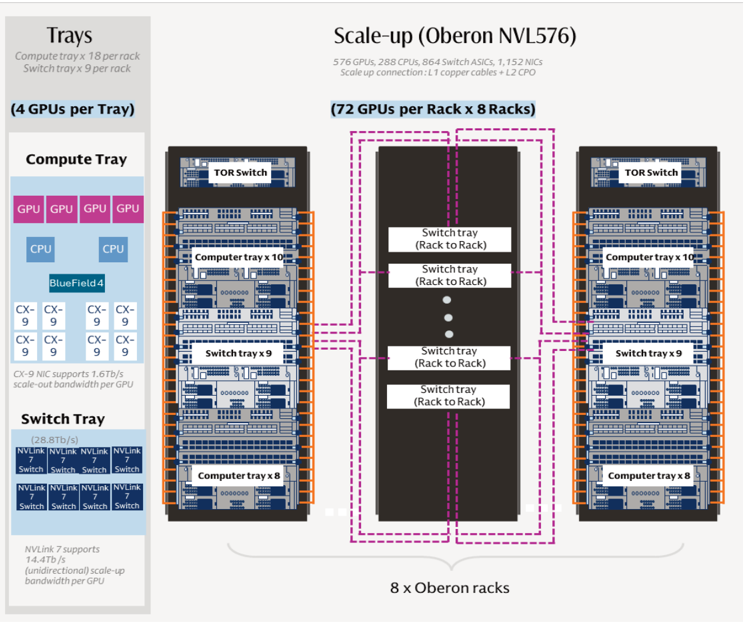
Exhibit 3: Nvidia Rubin Ultra AI rack network summary (2027E)
The data in this exhibit is inferred by GS based on technology roadmap of Nvidia and our supply chain check.
Source: Company data, Goldman Sachs Global Investment Research
(4) Optical networking supply chain
Exhibit 4: Optical supply chain
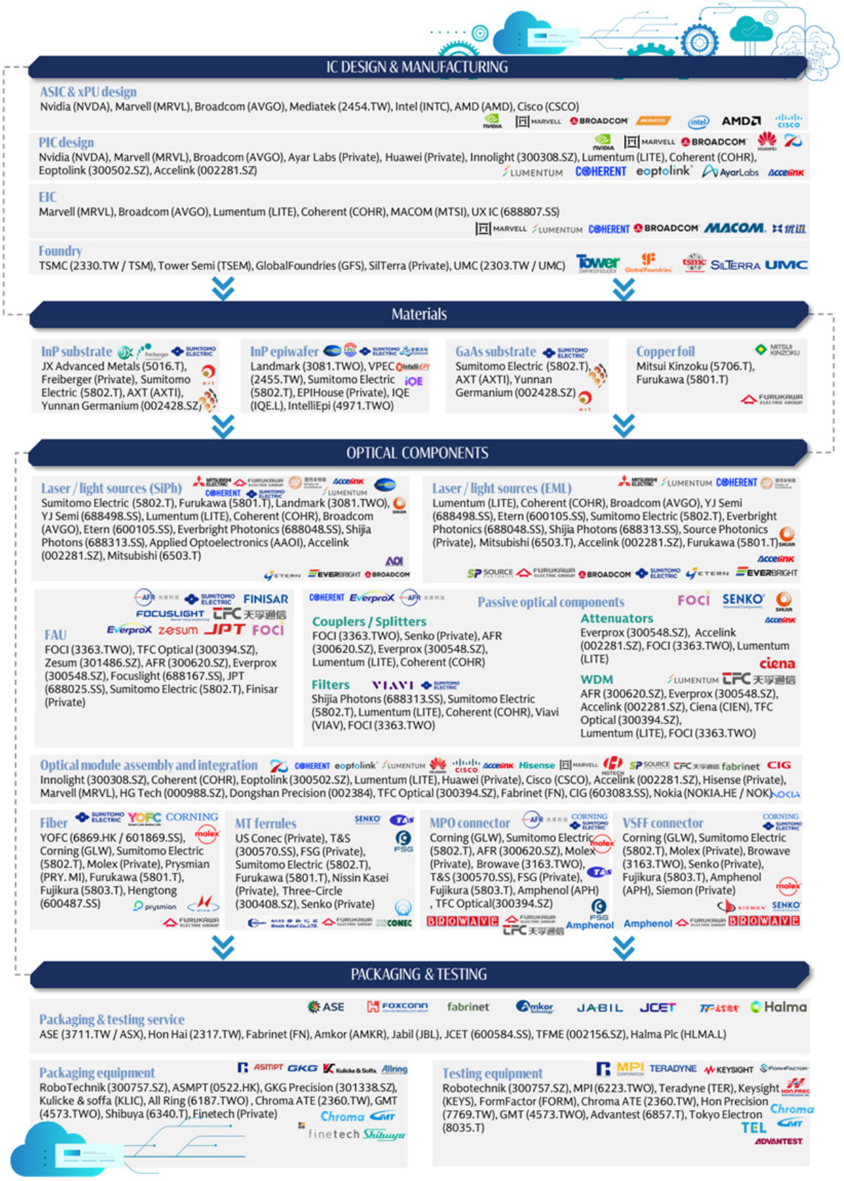
Source: Company data, Data compiled by Goldman Sachs Global Investment Research
(5) Scale up / Scale out TAM and EPS implications
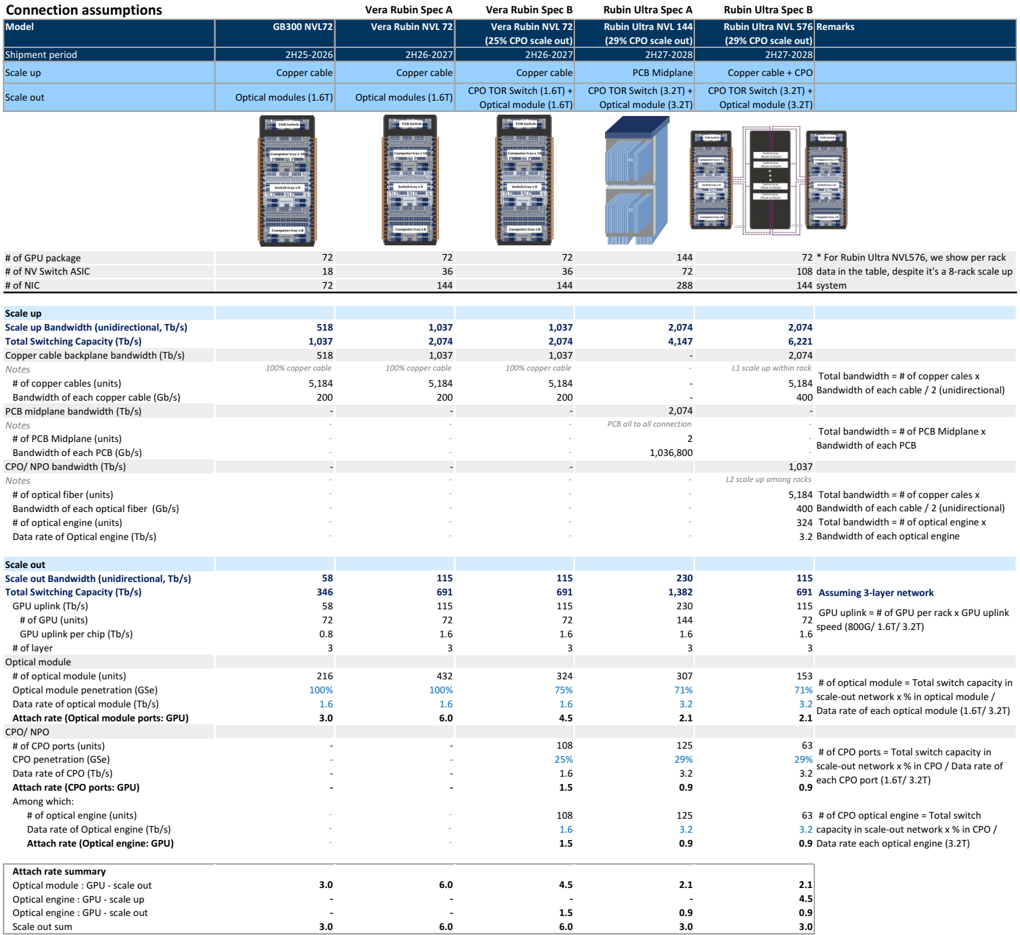
Exhibit 5: Spec Table: We outline four possible rack structure for the upcoming GPU platforms (GSe)
The connection architecture and speci fi cations below are based on Nvidia technology roadmap, supply chain check and our inference based on the networking connections
| Connection assumptions | Vera Rubin Spec A Vera Rubin Spec B Rubin Ultra Spec A Rubin Ultra Spec B | Vera Rubin Spec A Vera Rubin Spec B Rubin Ultra Spec A Rubin Ultra Spec B | Vera Rubin Spec A Vera Rubin Spec B Rubin Ultra Spec A Rubin Ultra Spec B | Vera Rubin Spec A Vera Rubin Spec B Rubin Ultra Spec A Rubin Ultra Spec B | Vera Rubin Spec A Vera Rubin Spec B Rubin Ultra Spec A Rubin Ultra Spec B |
|---|---|---|---|---|---|
| Model | GB300 NVL72 | Vera Rubin NVL 72 | Vera Rubin NVL 72 (25% CPO scale out) | Rubin Ultra NVL 144 (29% CPO scale out) (29% | Rubin Ultra NVL 576 CPO scale out) Remarks |
| Shipment period | 2H25-2026 | 2H26-2027 | 2H26-2027 | 2H27-2028 | 2H27-2028 cable + CPO |
| Scale up | Copper cable | Copper cable | Copper cable | PCB Midplane | Copper |
| Scale out | Optical modules (1.6T) | Optical modules (1.6T) | CPO TOR Switch (1.6T) + Optical module (1.6T) | CPO TOR Switch (3.2T) + Optical module (3.2T) CPO | TOR Switch (3.2T) + Optical module (3.2T) |
| # of GPU package | 72 18 | 72 36 | 72 | 144 72 | 72 * For Rubin Ultra NVL576, we show per rack |
| # of NV Switch ASIC # of NIC | 518 | 36 | 108 data in the table, despite it's a 8-rack scale up | ||
| Scale up | 72 | 144 | 288 | 144 system | |
| Scale up Bandwidth (unidirectional, Tb/s) Total Switching Copper cable backplane (Tb/s) | 1,037 cable | 1,037 | 144 1,037 | 2,074 4,147 - | |
| Capacity (Tb/s) bandwidth Notes # of copper cables (units) Bandwidth of each copper cable (Gb/s) | 518 100% copper 5,184 200 | 2,074 1,037 100% copper cable 5,184 200 - | 2,074 1,037 100% copper cable 5,184 200 - | - L1 - - 2,074 | 2,074 6,221 2,074 scale up within rack Total bandwidth = # of copper cales x |
| PCB midplane bandwidth (Tb/s) Notes # of PCB Midplane (units) Bandwidth of each PCB (Gb/s) CPO/ NPO bandwidth (Tb/s) Notes # of optical fiber (units) Bandwidth of each optical fiber # of optical engine (units) Data rate of Optical engine (Tb/s) | - - - - 58 346 58 72 0.8 3 216 100% 1.6 3.0 - - - | 1.6 3 | 108 1.6 1.5 | 0.9 2.1 | 3.2 0.9 capacity in scale-out network x %in Data rate each optical engine (3.2T) |
| Attach rate summary Optical module : GPU - scale out Optical engine : GPU - scale up Optical engine : GPU - scale out | 3.0 - - | 6.0 - - | 4.5 - | 3.2 | 2.1 |
| Scale out Scale out Bandwidth (unidirectional, Total Switching Capacity (Tb/s) GPU uplink (Tb/s) # of GPU (units) GPU uplink per chip (Tb/s) # of layer Optical module # of optical module (units) Optical module penetration (GSe) | - - - - | 1.5 | - | 4.5 | |
| - - - - - - | 432 100% 1.6 6.0 - - - - - - | - - - - - | connection 2 | 5,184 400 - - - Bandwidth of each cable / 2 (unidirectional) Total bandwidth = # of PCB Midplane x GPU uplink = # of GPU per rack x GPU uplink | |
| - - - - | - - | PCB all to all - | - 1,037 among racks Bandwidth of each PCB | ||
| - | |||||
| - | 1,036,800 L2 | scale up 5,184 Total bandwidth = # of copper cales x | |||
| (Gb/s) | - - - | - - | - - - | 400 324 3.2 Bandwidth of each cable / 2 Total bandwidth = # of optical engine x Bandwidth of each optical engine | |
| - | (unidirectional) | ||||
| Tb/s) | 115 691 115 72 | 115 691 | 115 691 Assuming 3-layer network 115 | ||
| 115 72 1.6 3 | 230 | 72 1.6 153 71% 3.2 2.1 # of optical module = Total switch capacity scale-out network x %in optical module / Data rate of each optical module (1.6T/ 3.2T) speed (800G/ 1.6T/ 3.2T) | |||
| Attach rate (Optical engine: GPU) | - | 1.5 | 1,382 230 144 1.6 3 | CPO | |
| 63 # of CPO ports = Total switch capacity in | |||||
| 75% 1.6 4.5 108 | 0.9 63 # of CPO optical engine = Total switch / | ||||
| 324 | 307 71% 3.2 | 3.2 scale-out network x %in CPO / Data rate each CPO port (1.6T/ 3.2T) | |||
| 29% | |||||
| 3 | |||||
| in | |||||
| Data rate of optical module | |||||
| (Tb/s) Attach rate (Optical module ports: | |||||
| CPO/ NPO | 2.1 | ||||
| GPU) | |||||
| # of CPO ports (units) | 125 | ||||
| CPO penetration (GSe) | 25% 1.6 | 29% 3.2 | of | ||
| Data rate of CPO (Tb/s) | |||||
| Attach rate (CPO ports: GPU) Among which: | 0.9 | ||||
| # of optical engine (units) | 125 | ||||
| Data rate of Optical engine (Tb/s) | |||||
| 0.9 | 0.9 | ||||
| Scale out sum | |||||
| 3.0 | 6.0 | 6.0 | 3.0 | 3.0 |
(1) Shipment period is based on the Nvidia's product roadmap; (2) # of GPU/ NV Switch ASIC/ NIC per rack are based on Nvidia's product roadmap, industry check and our calculation based on the announced speci fi cations; (3) Bandwidth and switching capacity are based on Nvidia's product roadmap.
Source: Company data, Goldman Sachs Global Investment Research
Following the 2026 GTC , where a clear technology roadmap of the next generations of GPU, server rack, and networking solutions are outlined, we present an in-depth analysis of the speci fi cation changes for the next two generations of GPU platforms (Vera Rubin and Rubin Ultra). By integrating insights from the company's announcement (link) and our industry checks with the supply chain, we intend to delineate the inter-connection architecture of the forthcoming server racks (Exhibit 5), breakdown the dollar content for each networking component (Exhibit 6), forecast the TAM opportunity for each
component (Exhibit 8) and assess the EPS impact for our key coverage names (Exhibit 13). With these, we aim to address the frequently asked investor question about how to evaluate the market size resulting from complex server networking upgrades ahead.
The next generation racks: Networking technology continues to evolve in both scale out (across racks / computing unit) and scale up (within one computing unit). Based on the GTC 2026 announcement (link), we discuss the major four con fi gurations in Vera Rubin and Rubin Ultra platform, to evaluate the TAM opportunities and EPS impact across the supply chain. Separately, we consider the CPO penetration rate in scale-out connections in our analysis (Exhibit 5), which is based on industry checks and our optimistic perspective on CPO adoption. As CPO is a next-generation technology, its pace of adoption will signi fi cantly in fl uence the connection TAM opportunity, especially given its dollar content per rack. Detailed speci fi cation assumptions are shown in Exhibit 5 and below.
- Vera Rubin Spec A - NVL72. Scale up adopts copper cable cartridge, i.e. the n Oberon rack. Scale out adopts pluggable optical module connections.
- Vera Rubin Spec B -NVL72 (CPO scale out) . Scale up adopts copper cable n cartridge, i.e. the Oberon rack. Scale out could use CPO or pluggable optical module, and we assume 25% CPO penetration rate.
- Rubin Ultra Spec A - NVL144 (CPO scale up). Scale up adopts PCB midplane for n connection, i.e. the Kyber rack. Scale out could use CPO or pluggable optical module, and we assume 29% CPO penetration rate.
- Rubin Ultra Spec B - NVL576 (CPO scale up). 72 GPU per rack, and eight racks as a n full NVL576 (one computing unit). Scale up adopts copper cable cartridge for the fi rst layer connection (i.e. Oberon rack design for the connections within the server rack) and CPO for the second layer connection (i.e. the connections between the eight racks). Scale out could use CPO or pluggable optical module, and we assume 29% CPO penetration rate.
Based on above, we derive: (1) dollar content per rack across di ff erent con fi gurations, (2) value TAM opportunities (dollar content per rack * number of server racks), and (3) implication to supply chain EPS. Key takeaways: (1) Rubin Ultra brings dollar content increases across scale up and scale out compared to GB300, (2) Rubin Ultra scale up brings dollar content increases across copper cables, PCB midplane, and CPO switch, (3) pluggable optical modules would continue to increase dollar content increase per rack in scale out compared to GB300 despite our assumption of 25-29% CPO switch penetration rate, (4) CPO appears costly considering 3D packaging, high integration, and the need to upgrade devices to semiconductor processing levels; however, the total cost of ownership (TCO) is attractive especially in high bandwidth requirement (e.g. 6.4T, 12.8T) considering the constraints of pluggable optical module and the power e ffi ciency and energy savings, and (5) On the EPS opportunity, we see most suppliers bene fi ting from strong EPS contribution from a single con fi guration that is higher than their 2025 full year EPS, given the AI server racks shipment ramp up and speci fi cation upgrades driving the dollar content increase.
Exhibit 6: Dollar content per rack: GB300, Vera Rubin and Rubin Ultra
Volume assumptions are from the spec table (Exhibit 5), ASP assumptions are based on spec table and our industry checks
| Dollar content | GB300 NVL72 | Vera Rubin Spec A Vera Rubin NVL 72 | Vera Rubin Spec B Vera Rubin NVL 72 | Rubin Ultra Spec A Rubin Ultra NVL 144 | Rubin Ultra Spec B Rubin Ultra NVL 576 |
|---|---|---|---|---|---|
| Shipment period | 2H25-2026 | 2H26-2027 | 2H26-2027 | 2H27-2028 | 2H27-2028 |
| Scale up | Copper cable | Copper cable | Copper cable | PCB Midplane | Copper cable + CPO |
| Scale out | Optical modules (1.6T) | Optical modules (1.6T) | CPO TOR Switch (1.6T) + Optical module (1.6T) | CPO TOR Switch (3.2T) + Optical module (3.2T) | CPO TOR Switch (3.2T) + Optical module (3.2T) |
| # of GPU package | 72 | 72 | 72 | 144 | 72 |
| # of NV Switch ASIC | 18 | 36 | 36 | 430 | 430 |
| # of NIC | 72 | 144 | 144 | 288 | 144 |
| Networking costs per rack (US$ k) | 315 | 489 | 504 | 1,113 | 1,169 |
| Scale-up | 140 | 140 | 140 | 381 | 803 |
| Scale-out | 175 | 349 | 364 | 732 | 366 |
| Scale up dollar content per rack (US$ k) | 140 | 140 | 140 | 381 | 803 |
| Copper cable - backplane (US$ k) | 93 | 93 | 93 | - | 156 |
| Volume (unit) | 5,184 | 5,184 | 5,184 | - | 5,184 |
| ASP (US$) | 18 | 18 | 18 | - | 30 |
| Copper cable - flyover in switch tray (US$ k) | 47 | 47 | 47 | 156 | 78 |
| Volume (unit) | 5,184 | 5,184 | 5,184 | 10,368 | 5,184 |
| ASP (US$) | 9 | 9 | 9 | 15 | 15 |
| PCB midplane (US$ k) | - | - | - | 225 | - |
| Volume (unit) | - | - | - | 2 | - |
| ASP (US$) | - | - | - | 112,500 | - |
| Optical engine &FAU (CPO/ NPO, US$ k) | - | - | - | - | 324 |
| Volume (unit) | - | - | - | - | 324 |
| ASP (US$) | - | - | - | - | 1,000 |
| ELS (CPO/ NPO, US$ k) | - | - | - | - | 65 |
| Volume (unit) | - | - | - | - | 162 |
| ASP (US$) | - | - | - | - | 400 |
| Fiber cable and MPO(CPO/ NPO, US$ k) | - | - | - | - | 156 |
| Volume (unit) | - | - | - | - | 5,184 |
| ASP (US$) | - | - | - | - | 30 |
| Shufflebox (US$ k) | - | - | - | - | 25 |
| Volume (unit) | - | - | - | - | 36 |
| ASP (US$) | - | - | - | - | 700 |
| Scale out dollar content per rack (US$ k) | 175 | 349 | 364 | 732 | 366 |
| Optical module (US$ k) | 173 | 346 | 259 | 491 | 245 |
| Volume (unit) | 216 | 432 | 324 | 307 | 153 |
| ASP (US$) | 800 | 800 | 800 | 1,600 | 1,600 |
| Optical engine &FAU (CPO/ NPO, US$ k) | - | - | 86 | 200 | 100 |
| Volume (unit) | - | - | 108 | 125 | 63 |
| ASP (US$) | - | - | 800 | 1,600 | 1,600 |
| ELS (CPO/ NPO, US$ k) | - | - | 11 | 25 | 13 |
| Volume (unit) | - | - | 27 | 63 | 31 |
| ASP (US$) | - | - | 400 | 400 | 400 |
| Fiber cable and MPO(CPO/ NPO, US$ k) | 2 | 4 | 4 | 6 | 3 |
| Volume (unit) | 108 | 216 | 216 | 216 | 108 |
| ASP (US$) | 18 | 18 | 18 | 30 | 30 |
| Shufflebox (US$ k) | - | - | 4 | 10 | 5 |
| Volume (unit) | - | - | 6 | 14 | 7 |
| ASP (US$) | 700 | 700 | 700 | 700 |
Source: Company data, Goldman Sachs Global Investment Research
Exhibit 7: CPO switch speci fi cation comparison
| Nvidia | Nvidia | Broadcom | Broadcom | |
|---|---|---|---|---|
| Quantum-X Photonics | Spectrum-X Photonics | Tomahawk 5 - Bailly | Tomahawk 6 - Davisson | |
| Network | InfiniBand | Ethernet | Ethernet | Ethernet |
| Switching capacity | 115.2Tb/s | 409.6 Tb/s | 51.2 Tb/s | 102.4 Tb/s |
| # of Switch ASIC | 4 | 4 | 1 | 1 |
| Switch ASIC | 28.8Tb/s | 102.4Tb/s | 51.2Tb/s | 102.4Tb/s |
| Ports | 144 x 800G | 512 x 800G | 128 x 400G | 64 x 1.6T / 128 x 800G |
| Speed | 200G/lane SerDes | 200G/lane SerDes | 100G/lane SerDes | 200G/lane SerDes |
| External laser source | 18 | 64 | TBA | TBA |
| Optical engines | 72 (1.6T) | 128 (3.2T) | 8 (6.4T) | 16 (6.4T) |
| Size | 4U | 5U | 4U | TBA |
Source: Company data, Data compiled by Goldman Sachs Global Investment Research
Exhibit 8: Scale up / Scale out TAM opportunities
The TAM opportunity is based on the connection content value of each rack (Exhbit 6) multiple by GSe shipment of Vera Rubin / Rubin Ultra racks
| Value TAM | GB300 NVL72 | Vera Rubin Spec A Vera Rubin NVL 72 | Vera Rubin Spec B Vera Rubin NVL 72 | Rubin Ultra Spec A Rubin Ultra NVL 144 | Rubin Ultra Spec B Rubin Ultra NVL 576 |
|---|---|---|---|---|---|
| Scale up | Copper cable | Copper cable | Copper cable | PCB Midplane | Copper cable + CPO |
| Scale out | Optical modules (1.6T) | Optical modules (1.6T) | CPO TOR Switch (1.6T) + Optical module (1.6T) | CPO TOR Switch (3.2T) + Optical module (3.2T) | CPO TOR Switch (3.2T) + Optical module (3.2T) |
| Scle up + Scale out TAM (US$m) | 15,070 | 28,291 | 29,158 | 73,458 | 154,313 |
| Copper cable - backplane | 12,742 | 25,369 | 20,375 | 32,390 | 52,918 |
| Copper cable - flyover in switch tray | 2,234 | 2,697 | 7,691 | 23,494 | 23,494 |
| PCB Midplane | - | - | 624 | 16,504 | 1,654 |
| Optical engine & FAU | 93 | 225 | 225 | 428 | 43,196 |
| ELS | - | - | 243 | 643 | 9,197 |
| Fiber cable andMPO | 1 | 1 | 1 | 1 | 20,530 |
| Shufflebox | 1 | 1 | 1 | 1 | 3,327 |
| Scale up TAM (US$ m) | 6,702 | 8,090 | 8,090 | 25,114 | 105,970 |
| Copper cable - backplane | 4,468 | 5,393 | 5,393 | - | 20,529 |
| Copper cable - flyover in switch tray | 2,234 | 2,697 | 2,697 | 10,264 | 10,264 |
| PCB Midplane | - | - | - | 14,850 | - |
| Optical engine & FAU | - | - | - | - | 42,768 |
| ELS | - | - | - | - | 8,554 |
| Fiber cable andMPO | - | - | - | - | 20,529 |
| Shufflebox | - | - | - | - | 3,326 |
| Mix% | 100% | 100% | 100% | 100% | 100% |
| Copper cable - backplane | 67% | 67% | 67% | 0% | 19% |
| Copper cable - flyover in switch tray | 33% | 33% | 33% | 41% | 10% |
| PCB Midplane | 0% | 0% | 0% | 59% | 0% |
| Optical engine & FAU | 0% | 0% | 0% | 0% | 40% |
| ELS | 0% | 0% | 0% | 0% | 8% |
| Fiber cable andMPO | 0% | 0% | 0% | 0% | 19% |
| Shufflebox | 0% | 0% | 0% | 0% | 3% |
| Scale out TAM (US$ m) | 8,367 | 20,200 | 21,067 | 48,344 | 48,344 |
| Optical module | 8,274 | 19,976 | 14,982 | 32,390 | 32,390 |
| Optical engine & FAU | - | - | 4,994 | 13,230 | 13,230 |
| ELS | - | - | 624 | 1,654 | 1,654 |
| Fiber cable andMPO | 93 | 225 | 225 | 428 | 428 |
| Shufflebox | - | - | 243 | 643 | 643 |
| Mix% | 100% | 100% | 100% | 100% | 100% |
| Optical module | 99% | 99% | 71% | 67% | 67% |
| Optical engine & FAU | 0% | 0% | 24% | 27% | 27% |
| ELS | 0% | 0% | 3% | 3% | 3% |
| Fiber cable andMPO | 1% | 1% | 1% | 1% | 1% |
| Shufflebox | 0% | 0% | 1% | 1% | 1% |
| Assumption: GPU Rack forecast (GSe, k units, full lifecycle) | Assumption: GPU Rack forecast (GSe, k units, full lifecycle) | Assumption: GPU Rack forecast (GSe, k units, full lifecycle) | Assumption: GPU Rack forecast (GSe, k units, full lifecycle) | Assumption: GPU Rack forecast (GSe, k units, full lifecycle) | Assumption: GPU Rack forecast (GSe, k units, full lifecycle) |
| GB300 | 48 | ||||
| Rubin Ultra | 66 | 132 |
Source: Company data, Goldman Sachs Global Investment Research
Exhibit 9: How CPO works in data transmission
Source: Company data, Compiled by Goldman Sachs Global Investment Research
Exhibit 10: Our high end estimate imply a CPO TAM totalling US$97bn in 2026-28E
High-end based on GB300, Vera Rubin/Rubin Ultra Spec B; Low-end based on GB300, Vera Rubin/ Rubin Ultra Spec A
Value TAM by year
| Value TAM range (high-end, Spec B) | 2026E | 2027E | 2028E |
|---|---|---|---|
| Scale up TAM (US$ m) | 7,228 | 30,697 | 82,837 |
| Scale out TAM (US$ m) | 10,921 | 27,023 | 39,835 |
| CPO TAM (US$ m) | 1,024 | 24,840 | 70,881 |
| Optical engine & FAU | 864 | 16,269 | 43,858 |
| ELS | 108 | 2,763 | 7,961 |
| Fiber cable and MPO | 10 | 4,734 | 15,965 |
| Shufflebox | 42 | 1,074 | 3,096 |
| Value TAM range (low-end, Spec A) | 2026E | 2027E | 2028E |
| Scale up TAM (US$ m) | 7,228 | 12,321 | 20,358 |
| Scale out TAM (US$ m) | 10,771 | 26,408 | 39,733 |
| CPO TAM (US$ m) | - | 3,557 | 12,093 |
| Optical engine & FAU | - | 3,007 | 10,223 |
| ELS | - | 376 | 1,278 |
| Fiber cable and MPO | - | 28 | 96 |
| Shufflebox | - | 146 | 497 |
(1) CPO TAM refers to CPO components applied in both scale up and scale out connections; (2) By year estimate is based on the Server rack allocation among years and the full lifecycle TAM in Exhibit 7; (3) High end is based on Spec B and Low end on Spec A of each model
Source: Company data, Goldman Sachs Global Investment Research
Exhibit 12: Connections in data center: Scale-up vs. Scale out
TOR Switch: Top of rack switch; EoR Switch: End of row switch
Source: Company data, Data compiled by Goldman Sachs Global Investment Research
Exhibit 11: Our high end estimate imply a demand for 110k scale out CPO switch in 2028E
High-end based on GB300, Vera Rubin/Rubin Ultra Spec B; Low-end based on GB300, Vera Rubin/ Rubin Ultra Spec A
Volume TAM by year
| Volume TAM range (high-end, Spec B) | 2026E | 2027E | 2028E |
|---|---|---|---|
| CPO TAM (k units) | |||
| Optical engine & FAU | 1,080 | 16,027 | 40,172 |
| ELS | 270 | 6,907 | 19,902 |
| Fiber cable and MPO | 540 | 158,674 | 532,330 |
| Shufflebox | 60 | 1,535 | 4,423 |
| Key data | |||
| Nvidia AI rack shipment (k units) | 50 | 77 | 121 |
| Scale out CPO penetration | 5% | 25% | 29% |
| Scale out CPO switch (k units*) | 15 | 88 | 110 |
| Volume TAM range (low-end, Spec A) | 2026E | 2027E | 2028E |
| CPO TAM (k units) | |||
| Optical engine & FAU | - | 1,879 | 6,389 |
| ELS | - | 940 | 3,195 |
| Fiber cable and MPO | - | 940 | 3,195 |
| Shufflebox | - | 209 | 710 |
| Key data | |||
| Nvidia AI rack shipment (k units) | 50 | 77 | 121 |
| Scale out CPO penetration | 0% | 11% | 27% |
| Scale out CPO switch (k units*) | - | 26 | 89 |
(1) CPO TAM refers to CPO components applied in both scale up and scale out connections; (2) assume 72 optical engines per scale out switch (*); (3) By year estimate is based on the Server rack allocation among years and the full lifecycle TAM in Exhibit 7; (4) High end is based on Spec B and Low end on Spec A of each model
Source: Company data, Goldman Sachs Global Investment Research
Exhibit 13: Earning implications to key suppliers
Earnings impact based on the Value TAM (Exhibit 8) x market share assumption (GSe) x margin assumption (GSe) for each supplier
| Earning implications | Earning implications | Vera Rubin Spec A | Vera Rubin Spec B | Rubin Ultra Spec A | Rubin Ultra Spec B | |||
|---|---|---|---|---|---|---|---|---|
| Model | Model | 2025 Actual | GB300 NVL72 | Vera Rubin NVL 72 | Vera Rubin NVL 72 (25% CPO scale out) | Rubin Ultra NVL 144 (29% CPO scale out) | Rubin Ultra NVL 576 (29% CPO scale out) | Products |
| 2H25-2026 | 2H26-2027 | 2H26-2027 | 2H27-2028 | 2H27-2028 | ||||
| Shipment period Key assumptions | Shipment period Key assumptions | Key assumptions | ||||||
| Scale up | Scale up | 100% copper cables | 100% copper cables | 100% copper cables | PCB miplane | L1 copper cables; L2 CPO Key | assumptions are based on the spec table (Exhibit 5) | |
| Scale out | Scale out | 100% pluggableOM (1.6T) | 100% pluggableOM (1.6T) | 75% pluggableOM (1.6T); 25% CPO | 71% pluggableOM (3.2T); 29% CPO | 71% pluggableOM (3.2T); 29% CPO OMrefers to optical module | 71% pluggableOM (3.2T); 29% CPO OMrefers to optical module | |
| EPS implications (LCY) | EPS implications (LCY) | 2025 Diluted EPS | EPS opportunities (LCY) | |||||
| Innolight Optical module/ Optical engine | 300308.SZ | 9.8 | 6.0 | 14.6 | 11.4 | 24.8 | 28.6 | Optical engine, Optical module |
| Eoptolink | 300502.SZ | 9.5 | 4.2 | 10.0 | 8.0 | 17.5 | 21.6 | Optical engine, Optical module |
| TFC Optical | 300394.SZ | 2.7 | 2.7 | 3.9 | 3.3 | 6.0 | 12.4 | FAU, Optical module |
| Sumitomo | 5802.T | 345.9 | - | - | 29.6 | 69.2 | 311.0 | FAU, Optical engine |
| Mitsubishi | 6503.T | 162.9 | - | - | 8.8 | 23.3 | 98.6 | Optical engine |
| Furukawa | 5801.T | 747.3 | - | - | 103.0 | 245.5 | 1,092.1 | FAU, Optical engine |
| Fujikura | 5803.T | 582.4 | - | - | 18.8 | 24.9 | 153.6 | FAU |
| CWlaser/ EML | CWlaser/ EML | |||||||
| Landmark | 3081.TWO | 4.6 | 2.3 | 6.1 | 7.1 | 14.4 | 73.4 | CWlaser |
| VPEC | 2455.TW | 3.0 | 0.6 | 1.7 | 1.9 | 3.9 | 20.1 | EPI wafer |
| Sumitomo | 5802.T | 345.9 | 8.6 | 21.0 | 22.5 | 49.6 | 142.4 | CWlaser/EML |
| Mitsubishi | 6503.T | 162.9 | 4.1 | 9.7 | 8.3 | 21.3 | 43.9 | CWlaser/EML |
| Furukawa | 5801.T | 747.3 | 1.2 | 7.0 | 20.3 | 41.3 | 210.6 | CWlaser/EML |
| PCB | PCB | |||||||
| Victory Giant | 300476.SZ | 5.0 | - | - | - | 13.3 | - | PCB Midplane |
| WUS | 002463.SZ | 2.0 | - | - | - | 2.4 | - | PCB Midplane |
| Unimicron | 3037.TW | 4.3 | 0.9 | PCB Midplane | ||||
| EMC CCL | 2383.TW | 40.8 | - | - | - | 100.7 | - | CCL for PCB Midplane |
| Shengyi | 600183.SS | 1.3 | - | - | - | 0.3 | - | CCL for PCB Midplane |
| Net income implications (US$ m) | Net income implications (US$ m) | 2025 Net income | Net | income opportunities (US$ m) | ||||
| Optical module/ Optical engine | Optical module/ Optical engine | |||||||
| Innolight | 300308.SZ | 1,510 | 947 | 2,286 | 1,785 | 3,894 | 4,497 | Optical engine, Optical module |
| Eoptolink | 300502.SZ | 1,326 | 577 | 1,394 | 1,111 | 2,435 | 3,004 | Optical engine, Optical module |
| TFC Optical | 300394.SZ | 290 | 291 | 421 | 357 | 651 | 1,348 | FAU, Optical module |
| Sumitomo | 5802.T | 1,740 | - | - | 149 | 348 | 1,565 | FAU, Optical engine |
| Mitsubishi | 6503.T | 2,142 | - | - | 116 | 306 | 1,297 | Optical engine |
| Furukawa | 5801.T | 340 | - | - | 47 | 112 | 497 | FAU, Optical engine |
| Fujikura | 5803.T | 1,037 | - | - | 33 | 44 | 273 | FAU |
| CWlaser | CWlaser | |||||||
| Landmark | 3081.TWO | 14 | 7 | 19 | 22 | 44 | 225 | CWlaser |
| VPEC | 2455.TW | 18 | 4 | 10 | 12 | 24 | 123 | EPI wafer |
| Sumitomo | 5802.T | 1,740 | 43 | 105 | 113 | 250 | 717 | CWlaser/EML |
| Mitsubishi | 6503.T | 2,142 | 53 | 128 | 109 | 279 | 577 | CWlaser/EML |
| Furukawa | 5801.T | 340 | 1 | 3 | 9 | 19 | 96 | CWlaser/EML |
| PCB | PCB | |||||||
| Victory Giant | 300476.SZ | 603 | - | - | - | 1,622 | - | PCB Midplane |
| WUS | 002463.SZ | 535 | - | - | - | 647 | - | PCB Midplane |
| Unimicron | 3037.TW | 222 | - | - | - | 45 | - | PCB Midplane |
| EMC CCL | 2383.TW | 488 | - | - | - | 1,188 | - | CCL for PCB Midplane |
| Shengyi | 600183.SS | 449 | - | - | - | 114 | - | CCL for PCB Midplane |
Source: Company data, Goldman Sachs Global Investment Research
(6) Choice of connection: PCB vs. Copper vs. Optics
Source: Company data
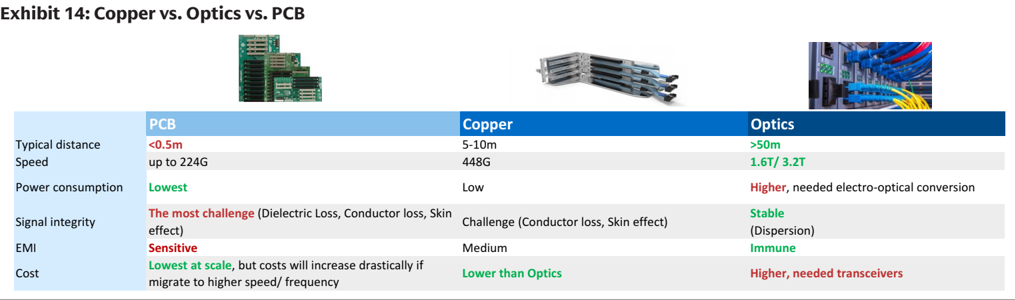
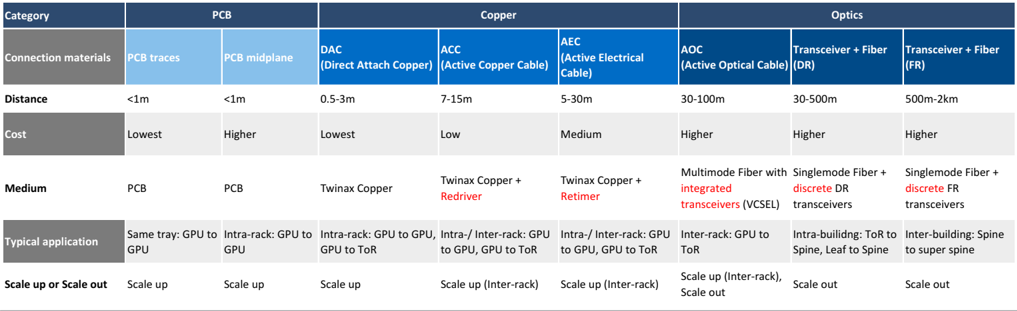
Copper cables and PCBs are commonly used materials for short-distance connections. PCBs handle the short connections within servers, while copper cables connect inside or between servers. Both o ff er lower cost and power consumption in short distances; however, signal quality degrades rapidly over longer distances or higher speeds, leading to optical fi ber connections to stand out for long distance or high speed interconnections. AI data centers are being designed for faster bandwidth, larger scale, easier deployment and lower costs. There are many di ff erent options for AI data center connections (as we list in Exhibit 15), and connection technologies change over time. Major trends recently include (1) copper cables evolving from DAC to ACC to AEC, toward longer distance connection, (2) PCBs evolving from intra-tray use to intra-rack connections, and (3) optics evolving from scale out to scale up, with AOC and CPO switches, covering shorter distance connection.
Exhibit 15: From PCB to Fiber: di ff erent types of connections for di ff erent distances
Source: Company data, Data compiled by Goldman Sachs Global Investment Research
Scale up con fi gurations: (1) From short to longer distances: In general, PCB traces are for connections within a server tray, DAC copper cables for connections within a server rack (e.g. GB200's copper cartridge) and AEC copper cables for connections among server racks (e.g. AmazonTrn2-Ultra64). AEC cables come with retimers that drives the connection distance to reach 5-30m (vs. <3m of DACs). (2) PCB midplane: Server trays and switch trays could be connected directly to a PCB midplane, which is likely to feature M9 CCL materials and 78 or more layers. The initial costs could be higher, though the midplane could be easier to assemble and more competitive in costs-to-performance ratio for higher speed requirements (e.g. Rubin Ultra NVL144). (3) Optics show strength in longer interconnections and larger bandwidth, which Google uses in part of its scale-up 3D torus. To meet the larger bandwidth demands and shorten connection distances, Optics connections are expanding from pluggable optical modules to onboard optics (NPO), and co-packaged optics (CPO), which could be seen in scale up con fi gurations (e.g. Rubin Ultra NVL576 level 2 scale up). Scale out con fi gurations: in general, optics are for AI cluster scale out given the requirement on high speed and larger interconnection size.
Exhibit 16: Connection solutions of mainstream AI servers
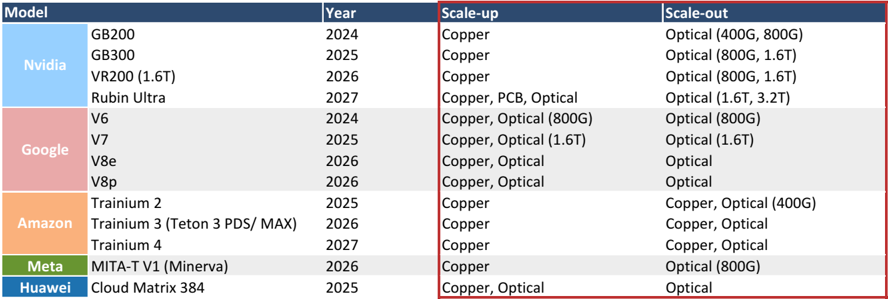
400G/ 800G/ 1.6T/ 3.2T refers to the fastest data rate in the network, while there can be lower speed ports in the network
Source: Company data, Data compiled by Goldman Sachs Global Investment Research
(7) Optics: speed upgrade continues
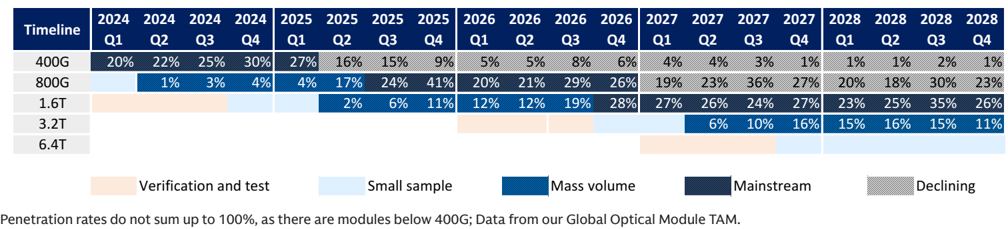
Exhibit 17: Roadmap of data center connection speed
Source: Company data, Goldman Sachs Global Investment Research
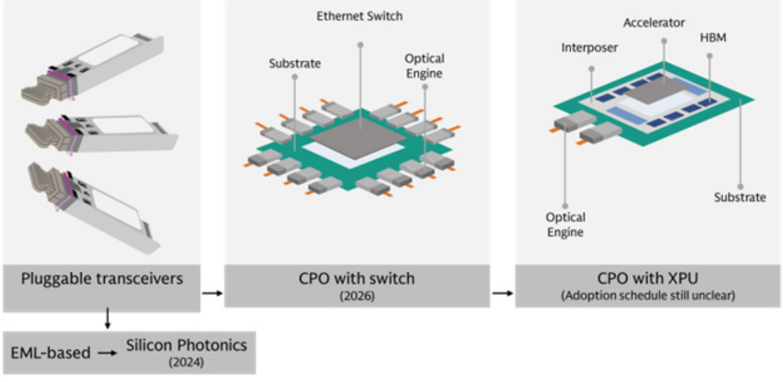
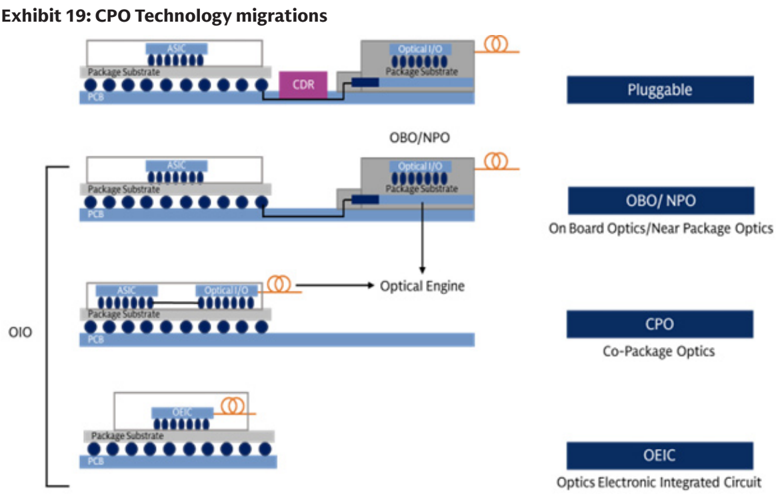
We expect the speed migration to continue through 2028E, from 800G to 1.6T in 2026, and toward 3.2T and above in the following years, and followed by China Cloud speed migration to lengthen the migration cycle. To meet the increasing demand on bandwidth, power consumption, and miniaturization, the form of optical connection is evolving (Exhibit 18): (1) pluggable optical module are shifting towards silicon photonics from EML, which come with higher integration, lower cost and reduced reliance on laser supply, (2) expanding from pluggable optical module to onboard optics (NPO) and co-packaged optics (CPO), covering short distance connection with high bandwidth and better power e ffi ciency. CPO will initially be integrated with switch ASIC, followed by XPUs (GPU, CPU, ASICs, etc.).
Exhibit 18: Optics technology migrations
Source: Company data, Data compiled by Goldman Sachs Global Investment Research
(8) CPO with Switch kick o ff in 2026
Source: Company data, Data compiled by Goldman Sachs Global Investment Research
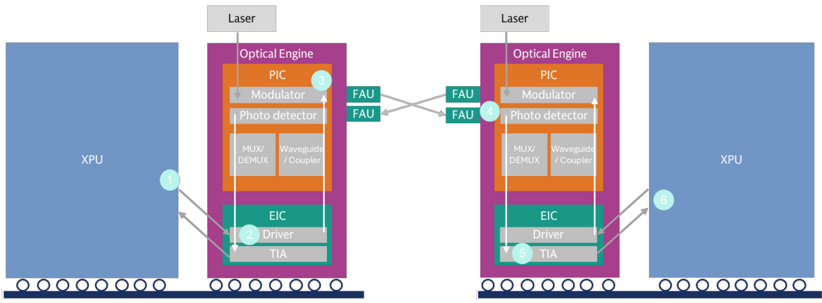
CPO expands optics to cover short distance connection and higher bandwidth. It places optical engines as close as possible to the chips, shortening the electrical paths from several centermeters to millimeter level and lower power consumption. The shorter transmission path could also reduce latency and save DSPs and retimers, along with the power consumption by these devices. The higher integration also brings smaller size. On other hand, CPO requires supply chain technology migration rather than single devices upgrade, which could take time to develop; in addition, the co-packaging leads to higher maintenance costs: in a pluggable optical module, if the optical engine fails, one replaces the optical module, and the switch system remains intact, while in (1) onboard optics / NPO, it would need to replace the switch PCB, (2) CPO with the switch, failure would
a ff ect the switch ASIC, and (3) CPO with XPU, failure would a ff ect the XPU (e.g. GPU, CPU, NPU, etc.). The lifecycle of PIC and EIC are di ff erent, with PIC are more delicate, leading to the design of pluggable optical module. As a result, we expect (1) pluggable optical module would co-exist with NPO / CPO, and on continuous speed migration toward 3.2T, (2) CPO would be more attractive to clients in short distance and higher bandwidth that pluggable optical module could not achieve, and (3) pluggable optical module suppliers would also enjoy new optics devices opportunities in NPO / CPO, such as optical engine, FAU, ELS module, etc.
Exhibit 20: CPO: key development of major players
| Key players | Progress | Progress details | Highlights |
|---|---|---|---|
| Nvidia | - CPO Switch commercially avaiable in 2026 (Scale out) | Mar-2025: Announced CPO switch (Quantum-X InfiniBand, Spectrum-X Ethernet) Early 2026: Commercial availability of CPO switch | Adopt MRM(Micro Ring Modulator) technology, achieving higher density and efficiency |
| Broadcom | - Davisson (102.4T) CPO switch sampling in Oct 2025 (Scale-out and scale-up) | Mar-2022 : world's first 25.6T CPO Demo June-2023: 51.2T CPO sampling Mar-2024: Bailly (51.2T) CPO switch deliverd to customers Oct-2025: Davisson (102.4T) CPO switch delivered to customers | Adopt MZM (Mach-Zehnder Modulator), which is more matured, while also developing MRM |
| Marvell | - CPO ethernet swith sampling in 2027 (Scale-out) - Developing CPO for XPUs (Scale-up) | Feb-2026: Acquired Celestial AI, a startup focusing on CPO for XPUs 2027: CPO (204T) Ethernet switch sampling | CPO solution to combine with custom XPUs for CSPs |
| Ranovus x Mediatek | Announced co-developed CPO for ASIC in 2024 | Mar-2024: Announced Odin CPO solutions (6.4T) collaborating with Mediatek's ASIC platform | Targeting CPO technology on XPU |
Source: Company data, Data compiled by Goldman Sachs Global Investment Research
Exhibit 21: CPO development: Nvidia and Broadcom taking the lead
Nvidia and Broadcom's ecosystem
| Ecosystem | Nvidia | Broadcom |
|---|---|---|
| Time line | Mar-2025: Announced CPO switch (Quantum-X InfiniBand, Spectrum-X Ethernet) Early 2026: Commercial availability of CPO switch | Oct-2025: Davisson (102.4T) CPO switch delivered to customers 2026: Davisson to start production |
| Compute | ||
| GPU | Nvidia (Blackwell, Rubin etc) | Open (Nvidia, AMD, Intel etc) |
| Network | ||
| Switch ASIC | Nvidia | Broadcom (Tomahawk 5/ Tomahawk 6) |
| Switch system | Nvidia (Spectrum-X, Quantum-X) | Open ecosystem (Delta Electronics, Micas Networks) |
| Optics | ||
| CPO chip | ||
| CPO platform name | N.A. | Bailly/ Davission |
| CPO chip fabrication | TSMC (2330.TW) | TSMC (2330.TW) |
| CPO chip test | SPIL (3711.TW) | TBA |
| Other componets | ||
| Optical engine FAU | TFC Optical (300394.SZ), Browave (3163.TWO), TSMC (2330.TW), Innolight (300308.SZ), Eoptolink (300502.SZ), PCL Tech (4977.TW) FOCI (3363.TWO), TFC Optical (300394.SZ), Innolight (300308.SZ), Advanced Fiber Resources (300620.SZ) | TFC Optical (300394.SZ), Browave (3163.TWO), TSMC (2330.TW), Innolight (300308.SZ), Eoptolink (300502.SZ), PCL Tech (4977.TW) FOCI (3363.TWO), TFC Optical (300394.SZ), Innolight (300308.SZ), Advanced Fiber Resources (300620.SZ) |
| CPO connector | Nextronics (8417.TWO) | COXOC (6205.TW) |
| Optical connectors | Senko (Private) | TBA |
| Shuffle Box | Browave (3163.TWO) | Browave (3163.TWO) |
| Laser Sources/ CWLaser | Sumitomo (8053.T), Furukawa (5801.T)/ VPEC (2455.TW), Landmark (3081.TWO), YJ Semitech (688498.SS), Lumentum (LITE), Coherent | Sumitomo (8053.T), Furukawa (5801.T)/ VPEC (2455.TW), Landmark (3081.TWO), YJ Semitech (688498.SS), Lumentum (LITE), Coherent |
| ELS module | Senko (Private), Sumitomo (8053.T), Innolight (300308.SZ), PCL Tech (4977.TW) | Senko (Private), Sumitomo (8053.T), Innolight (300308.SZ), PCL Tech (4977.TW) |
| Fiber | Corning (GLW) | Corning (GLW) |
| Cage thermal module | Nextronics (8417.TWO) | COXOC (6205.TW) |
| System-level assembly | Hon Hai (2317.TW), Fabrinet (FN) | TBA |
| Equipment | ||
| CPO coupling | Robotechnik (300757.SZ), ASMPT (0522.HK), All Ring (6187.TWO) | Robotechnik (300757.SZ), ASMPT (0522.HK), All Ring (6187.TWO) |
| CPO test | Robotechnik (300757.SZ), All Ring (6187.TWO) | Robotechnik (300757.SZ), All Ring (6187.TWO) |
Source: Company data, Data compiled by Goldman Sachs Global Investment Research
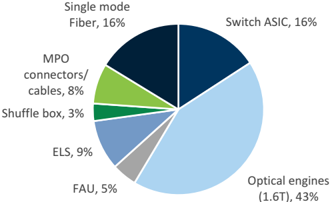
Exhibit 22: CPO Switch BoM breakdown, by value (GSe)
CPO switch BoM (Quantum-X Photonics)
| US$ | # | ASP | Value |
|---|---|---|---|
| Switch ASIC | 4 | 3,000 | 12,000 |
| Optical engines (1.6T) | 72 | 450 | 32,400 |
| FAU | 72 | 50 | 3,600 |
| ELS | 18 | 400 | 7,200 |
| Among which: CWlaser (300mw) | 144 | 30 | 4,320 |
| Shuffle box | 1 | 2,500 | 2,500 |
| MPO connectors/ cables | 144 | 40.0 | 5,760 |
| Single mode Fiber | 1,152 | 11 | 12,343 |
| BoM | 75,803 | ||
| Markup | 62,220 | ||
| Selling price | 130,000 |
ASP estimates are based on industry checks
Source: Company data, Goldman Sachs Global Investment Research
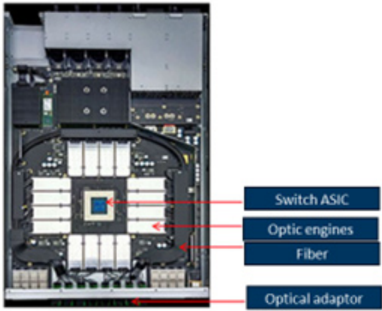
Exhibit 24: NPO Switch by Ruijie
Picture from Ruijie
Source: Company data
Exhibit 23: CPO Switch BoM breakdown, by % (GSe)
Source: Company data, Goldman Sachs Global Investment Research
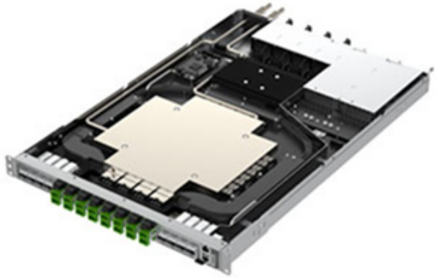
Exhibit 25: NPO Switch by Ruijie
Picture from Ruijie
Source: Company data
(9) Pluggable optical modules: SiPh-based in expansion
Exhibit 26: We expect SiPh's penetration in datacom market to increase from 6% in 1Q24 to 46% in 4Q28E
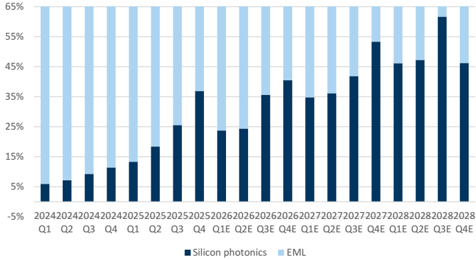
Global Optical Module TAM.
Source: Company data, Goldman Sachs Global Investment Research
Exhibit 27: Inside a Silicon photonics chip
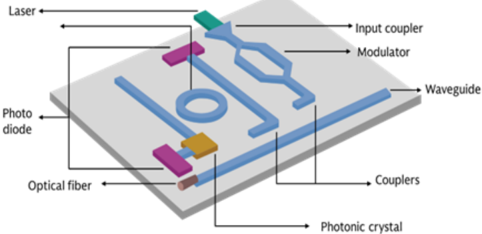
Source: Company data
We expect the adoption of silicon photonics in optical transceiver modules to grow from 6% in 1Q24 to 45% in 4Q28 (Exhibit 26). Silicon Photonics provides advantage over traditional discrete optical transceivers due to (1) a higher level of integration and smaller size, (2) lower power consumption, and (3) lower costs. These advantages will become more prevalent when the industry migrates to faster speeds. Nevertheless, the EML would also co-exist in AI data center, especially for long distance transmission given CW lasers require high power to deliver similar performance to EML in long distances. In short distance, some clients would still choose EML considering it is a long-established technology with a longer track record, and the reliability of the network is critical for AI computing, and GPU remains the major cost contributor, making the cost reduction from the light source less signi fi cant. The price of like for like products declines as scale ramps up, similar to many other technology components; nevertheless, the speed migration toward 800G / 1.6T / 3.2T would continue to drive the blended ASP expansion. Gross margin of optical module suppliers will ramp to 48%-55%, driven by product mix migration, as higher speed products would shift towards SiPh-based optical modules, bene fi ting from lower laser costs.
Exhibit 28: 800G: SiPh has 26% BoM advantage and 15% price advantage
800G Optical module BoM
| 800G BoM (US$) | EML | EML | Silicon Photonics | Silicon Photonics | Diff |
|---|---|---|---|---|---|
| Components | # | Value | # | Value | Value |
| TOSA (excl. laser, driver) | 1 | 15 | - | - | (15) |
| Laser | 8 x 100G EML | 96 | 4 x 70mw | 16 | (80) |
| Driver | 2 | 20 | 2 | 20 | - |
| ROSA (excl. TIA) | 1 | 20 | - | - | (20) |
| TIA | 2 | 20 | 2 | 20 | - |
| Silicon Photonics chip | - | - | 2 | 40 | 40 |
| DSP | 1 | 80 | 1 | 80 | - |
| PCBA | 1 | 30 | 1 | 25 | (5) |
| Others | 29 | 29 | - | ||
| Total BoM | 310 | 230 | -80 | ||
| Cost advantage of SiPh | -26% | ||||
| ASP | 430 | 365 | -65 | ||
| GM | 28% | 37% | -23% | ||
| Price advantage of SiPh | -15% |
Source: Company data, Data compiled by Goldman Sachs Global Investment Research
Exhibit 30: EML-based optical transceivers: more discrete devices inside
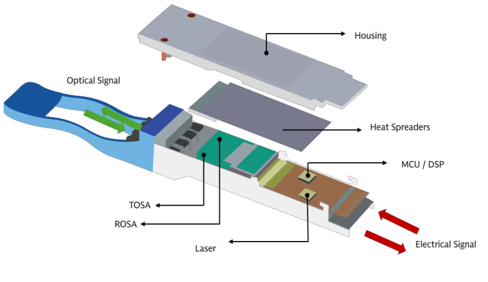
Source: Company data
Exhibit 29: 1.6T: SiPh has 32% BoM advantage and 20% price advantage for 1.6T applications
1.6T Optical module BoM
| 1.6T BoM (US$) | EML | EML | Silicon Photonics | Silicon Photonics | Diff |
|---|---|---|---|---|---|
| Components | # | Value | # | Value | Value |
| TOSA (excl. laser, driver) | 1 | 15 | - | - | (15) |
| Laser | 8 x 200G EML | 160 | 4 x 70mw | 16 | (144) |
| Driver | 2 | 30 | 2 | 30 | - |
| ROSA (excl. TIA) | 1 | 60 | - | - | (60) |
| TIA | 2 | 30 | 2 | 30 | - |
| Silicon Photonics chip | - | - | 2 | 70 | 70 |
| DSP | 1 | 130 | 1 | 130 | - |
| PCBA | 1 | 35 | 1 | 25 | (10) |
| Others | 40 | 40 | - | ||
| Total BoM | 500 | 341 | -159 | ||
| Cost advantage of SiPh | -32% | ||||
| ASP | 1,000 | 800 | -200 | ||
| GM | 50% | 57% | 21% | ||
| Price advantage of SiPh | -20% |
Source: Company data, Data compiled by Goldman Sachs Global Investment Research
Exhibit 31: Silicon photonic optical transceivers: higher integration with simpli fi ed structure

Source: Company data
Exhibit 32: Silicon photonic optical transceivers: how data transmission works
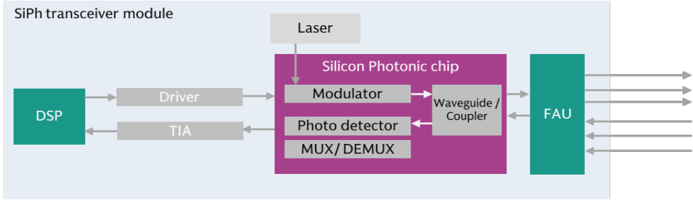
Source: Company data, Compiled by Goldman Sachs Global Investment Research
(10) Light sourcing: Supply chain and Shortage
Exhibit 33: Optical chip supply chain
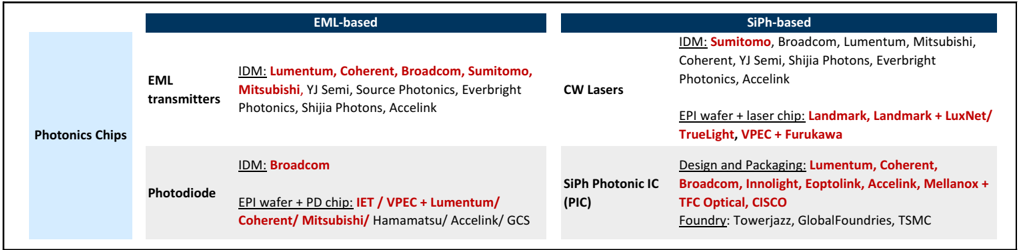
| IDM: Lumentum, Coherent, Broadcom, Sumitomo, Mitsubishi , YJ Semi, Source Photonics, Everbright Photonics, Shijia Photons, Accelink | IDM: Sumitomo , Broadcom, Lumentum, Mitsubishi, Coherent, YJ Semi, Shijia Photons, Everbright Photonics, Accelink EPI wafer + laser chip: Landmark, Landmark + LuxNet/ SiPh-based | IDM: Sumitomo , Broadcom, Lumentum, Mitsubishi, Coherent, YJ Semi, Shijia Photons, Everbright Photonics, Accelink EPI wafer + laser chip: Landmark, Landmark + LuxNet/ SiPh-based |
|---|---|---|
| IDM: | TrueLight, VPEC + Furukawa Design and Packaging: Lumentum, Coherent, | TrueLight, VPEC + Furukawa Design and Packaging: Lumentum, Coherent, |
| Broadcom EPI wafer + PD chip: IET / VPEC + | Broadcom, Innolight, Eoptolink, Accelink, Mellanox + TFC Optical, CISCO Foundry: Towerjazz, GlobalFoundries, TSMC | Broadcom, Innolight, Eoptolink, Accelink, Mellanox + TFC Optical, CISCO Foundry: Towerjazz, GlobalFoundries, TSMC |
| Lumentum/ | ||
| Coherent/ Mitsubishi/ Hamamatsu/ Accelink/ | ||
| GCS | ||
| Photodiode | Photodiode |

Source: Company data, Data compiled by Goldman Sachs Global Investment Research
Supply tightness remains in 2026, across both EML and CW lasers, due to (1) strong demand driven by AI servers ramp up, speed migration, and optical connections expansion, (2) InP substrate supply constraints, which are used in both EML and CW lasers, and across PD (receivers) and LD (transmitters), and under geopolitical tension / export controls by the China government, and (3) it takes time for capacity expansion and ramp up across the supply chain. Nevertheless, we see continuous capacity expansion plans from the supply chain, such as: VPEC plans to expands InP MOCVD from 60 units to 64 units in 2H26, both Landmark and YJ Semi commits on signi fi cant capacity expansion in 2026, Lumentum plans to expand capacity by 40% from CY3Q25 to CY2Q26, and likely to bring more capacities online in 2026 (Read more in FY2Q26 earnings call), and Coherent has also committed to doubling the capacity (Read more in FY2Q26 earnings call). Overall, we expect light source supply to remain tight through 2027, and could turn more balanced in 2H28 post supply chain capacity expansion, or a slowdown in AI servers speci fi cation upgrades as the industry shifts to inferencing from training, or ease of geopolitical tension / export controls by the China government.
Exhibit 34: Light source supply

Source: Goldman Sachs Global Investment Research
Exhibit 35: Di ff erent level of vertical intergration of optical chip suppliers
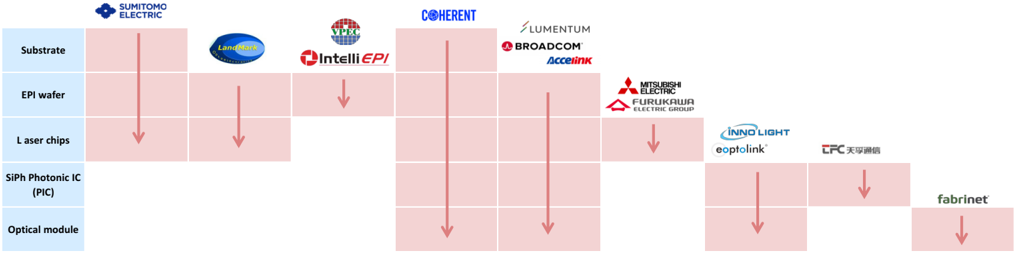
As of Apr 2026
Source: Company data, Data compiled by Goldman Sachs Global Investment Research
VCSEL: Vertical-Cavity Surface-Emitting Laser
Light sourcing in CPO could also vary: CW lasers stand out as the most widely adopted light source in optical modules, and could serve longer-distance connection, ful fi lling both scale out and scale up. VCSEL also bene fi ts from technology readiness and has higher energy e ffi ciency (lower power consumption) than CW laser solutions. Although its e ff ective reach is shorter than that of CW laser, the distance is su ffi cient for scale up. MicroLED is another potential choice in scale up, with high energy e ffi ciency, and low latency, while the technology readiness is lower compared to CW lasers and VSCEL.
Exhibit 36: Di ff erent choices of laser for CPO
| SiPh + CWLaser | VCSEL | MicroLED | |
|---|---|---|---|
| Energy efficiency | Lower | High | High |
| Effective reach (meter) | >1km | <100m | <20m |
| Latency | Low to Medium | Low to Medium | Low |
| Cost per bit | Medium | Low | Low |
| Technology readiness | High | High | Low |
Source: Company data, Data compiled by Goldman Sachs Global Investment Research
(11) Manufacturing: how to make SiPh optical modules and engines in CPO
Exhibit 37: Optical module assembly and test process and key equipment suppliers
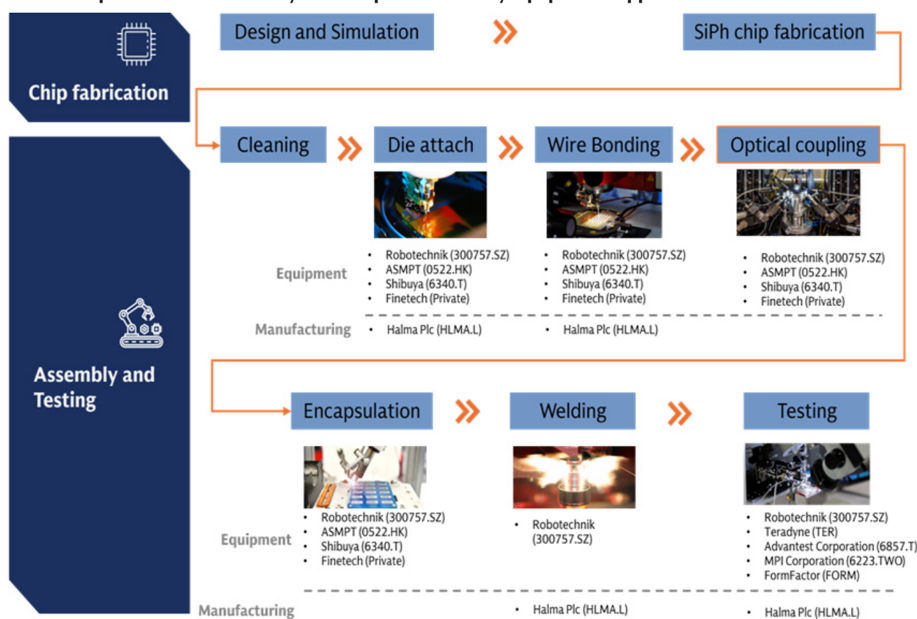
Source: Company data, Compiled by Goldman Sachs Global Investment Research
(12) Attach rate: Pluggable optical modules to GPU / ASIC in scale out
Exhibit 38: Optical transceiver attach rate
| Model | Year | Attach rate (GSe) | Data rate | |
|---|---|---|---|---|
| Nvidia | GB200 | 2024 1: 2~3 | 800G | |
| Nvidia | GB300 | 2025 | 1: 2~3 | 1.6T |
| Nvidia | VR200 | 2026 | 1: 4~6 | 1.6T |
| Nvidia | Rubin Ultra | 2027 | TBA | 3.2T (GSe) |
| V6 | 2024 | 1:4 | 800G | |
| V7 | 2025 | 1:4 | 1.6T | |
| Amazon | Trainium 2 | 2025 | 1:4 | 400G |
| Amazon | Trainium 3 (Teton 3 PDS/ MAX) | 2026 | 1:4 | TBA |
| Meta | MITA-T V1 (Minerva) | 2026 | 1:8~12 | 800G (GSe) |
| Huawei | Cloud Matrix 384 | 2025 | 1:18 | 400G |
| Biren | BR20x | 2026 | TBA | 400G/800G |
400G/ 800G/ 1.6T/ 3.2T refers to the fastest data rate in the network, while there can be lower speed ports in the network
Source: Company data, Compiled by Goldman Sachs Global Investment Research
The Chip-to-optical module attach ratio depends on (1) network structure : a large cluster with 10 thousand GPUs requires three layers of network, while smaller clusters can be supported by two layers. (2) the adoption % of optics in connections. Nvidia's upcoming VR200 racks will come with an attach ratio of 1: 4~6 (1.6T), doubling comparing to GB300's 1: 2~3 (1.6T). The increase of optical module usage is driven by the increase in port rate on the server side (i.e. VR200's compute tray support 1.6T per GPU, while GB300's compute tray is at 800G per GPU), while the data rate at the networking side remains the same at 1.6T. The Optical module attach rate of Google and Amazon ASIC are at similar level of 1:4, as they adopt copper cables and OCS switch in scale-up/ scale-out networking. Meta's ASIC can come with a higher attach ratio of 1:8~ 1:12 (800G), per our industry check, given their complicated DSF (Disaggregated Scheduled Fabric) network design. Similarly, Huawei's Cloud Matrix 384 comes with attach ratio of 1:18 as it adopts all optics connection. Other Chinese GPU/ ASIC other than Huawei usually use a standardized 8 GPU per server design, and 1:4~6 attach ratio (800G) is commonly seen.
Exhibit 39: Ruijie's network solution: optical module attach rate at 1:4/ 1:6 for 2-/ 3-layer network (800G)
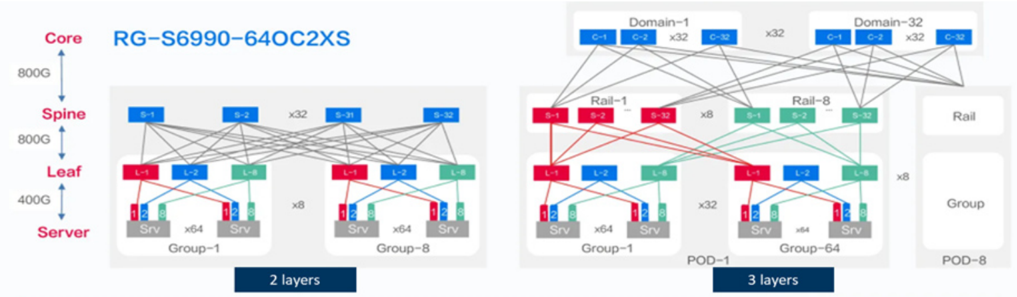
Exhibit from Ruijie
Source: Company data
(13) Optical Circuit Switch: Achieving all optics networking
Exhibit 40: Google's Palomar OCS based on MEMS technology
Source: Company data, Goldman Sachs Global Investment Research
Exhibit 41: Optical modules are not needed on OCS switch, while still needed on server motherboards
Source: Company data, Compiled by Goldman Sachs Global Investment Research
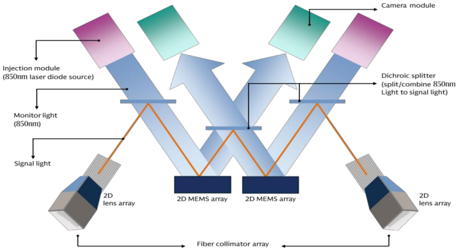
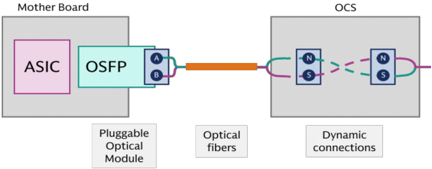
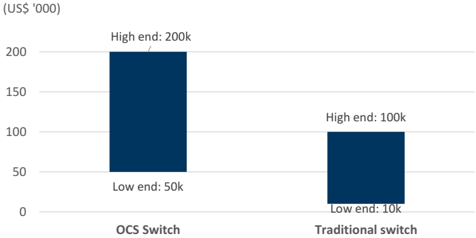
As more optical connections are adopted in data centers, OCS (Optical Circuit Switch) will be an alternative option. Compared to traditional data center switches, which require optical-electrical-optical transformation, the OCS switch is completely based on optical signals , which allows for higher bandwidth, power e ffi ciency, and scalability. The OCS switch provides an analog light path from the input fi ber to the output fi ber, and it passes through 800G/ 1.6T/ 3.2T lights in the same way. Therefore, by deploying the OCS switch, AI data center does not need to replace their switch when upgrading to faster data rate, and a same OCS switch can support di ff erent data rate at the same time. This feature makes it an optimal solution for today's fast changing AI clusters. Key progress: (1) Innolight targets SiPh OCS in 2027, (2) Robotechnik announced that they obtained an order of ' fully automated OCS (Optical Switch) packaging line' from its Europe customer. The order is worth EUR 7.7m, (3) Lumentum's optical circuit switches (OCS) backlog reached beyond $400 million in Feb 2026, (4) Coherent: per management, the company has engaged with over 10 customers on OCS as of Feb 2026. Shipments and backlog include 64x64 systems and 320x320 systems, and expected OCS revenue to grow sequentially in the coming quarters after Feb 2026.
Exhibit 42: The development timeline of OCS
| Development timeline of OCS | Development timeline of OCS |
|---|---|
| 2015 | Google launched the Apollo OCS project to develop the OCS switch |
| 2023 | Google announced TPU v4 is the first supercomputer to deploy OCS, with 4096 chips interconnected by 48 internally-developed OCS |
| 2025 | Google's TPU v7 SuperPod adopts OCS to interconnect 9,216 chips OCP announced new OCS project, with participants including Lumenutm, iPronics, Google, Nvidia, Coherent, Microsoft , etc. |
| 2026 | Lumentum announced that it's scaling rapidly to meet extraordinary customer demand that has already driven our backlog well beyond $400 million Coherent expects OCS revenue to ramp through this year and next, with over 10 customers engagements now |
Source: Company data, Data compiled by Goldman Sachs Global Investment Research
Exhibit 43: OCS: major technology options
| MEMS | LC/LCoS | Piezo/ DLBS | SiPh | |
|---|---|---|---|---|
| What does it mean | MEMS Mirror or Micro-electromechanical systems | Liquid crystal | Direct Light Beam-Steering | Silicon Photonics |
| How does it work | Control the deflection of the mirrors by applying voltage, thereby changing the propagation path of the light. | Beam deflection utilizing the electro-optic effect of liquid crystals and the cascading of crystal wedges. | Two collimator arrays are placed face to face to form a switch matrix. Electric field drive the the collimators to shift and tilt, aligning corresponding ports and achieve optical switching. | Constructing defined optical path matrix on a silicon-based chip, allowing optical signals to be transmitted along a predetermined path. |
| Advantages and Disadvantages | Matured solution with mass production track record | Pros: Higher reliability as there's no mechanical moving parts, low voltage and low power consumption Cons: switching time is slow | Pros: More reliable and Lower loss than MEMS Cons: hard to support very large port numbers | Pros: Fast switching time. Potential low cost for mass production Cons: High insertion loss |
| Progress | Mass production, now the major solutoin | Mass production | In qualification | In qualification |
| Switching time | Medium (<100ms) | Slow (>100ms) | Medium (<100ms) | Low (nanosecond) |
| Reliability | Low | High | High | High |
| Drive voltage | ~ 100V | <= 10V | ~ 10V | Low |
| Insertion Loss | Low (~ 3dB) | Low (~ 4dB) | Low (~ 2.5dB) | High (~ 6dB) |
| Crosstalk | Low | Low | High | High |
| Key players | OCS switch designer: Gooogle (GOOGL), (LITE), Calient (Private), | OCS switch designer: Coherent | OCS switch designer: Huber+Suhner | OCS switch designer: Innolight (300308.SZ), iPronics (Private), Taclink |
| Supply chain | Lumentum Accelink (002281.SZ) MEMS: Sai MicroElectronics (300456.SZ), XDLK Microsystem (688582.SS) VSCEL: Lumentum (LITE), Coherent/Finisar (COHR) FAU: Corning (GLW) Optical fiber cable: Ezconn (6442.TW) System ODM: Advanced Fiber Resource (300620.SZ) | (COHR) Optical component: Optowide (688195.SS) Equipment: Robotechnik (300757.SZ) Packaging: Halma Plc (HLMA.L) | (HUBN.SW) System ODM: Luster (688400.SS) Equipment: Robotechnik (300757.SZ) | (688205.SS) SiPh chip: HGTech (000988.SZ) System ODM: Taclink (688205.SS), Innolight (300308.SZ) Equipment: Robotechnik (300757.SZ) |
Source: Company data, Data compiled by Goldman Sachs Global Investment Research
Exhibit 44: ASP of OCS vs. traditional switch
As of Apr 2026
Source: Company data, Data compiled by Goldman Sachs Global Investment Research
Exhibit 45: OCS switch by Accelink
Source: Company data
(14) Technology adoption: pace varies on infrastructure
Exhibit 46: Technology adoption by CSP
| Nvidia | Microsoft | Meta | Amazon | Oracle | Chinese CSP | ||
|---|---|---|---|---|---|---|---|
| Optical module | |||||||
| 800G | √ | √ | √ | √ | √ | √ | √ |
| 1.6T | √ | √ | O (2027) | O (2026) | O (2027) | O (2027) | O |
| 3.2T | O (2028) | O (2028) | |||||
| CPO | |||||||
| Scale up | O | O | |||||
| Scale out | O | O | O | ||||
| OCS | |||||||
| Scale up or scale out | √ |
Note:
√:
adopted
Source: Company data, Data compiled by Goldman Sachs Global Investment Research
While the networking technology migration is a certain trend, the pace of adoption varies depending on the clients' data center infrastructure readiness and their speci fi c design needs. Key factors that a ff ect technology migrations include: (1) Depreciation and utilisation of older facilities. If current generation capacities have not yet been fully depericiated, the fi nancial pressure of moving quickly to the next generation can be signi fi cant. (2) New infrastructure readiness. Sometimes the technology migration is slowed by the construction time for new buildings, power grids and heat dissipation infrastructure. (3) Waiting for cost reduction . When a new technology is put into use, the cost can be substantially higher than in the later stage where it enters mass production. (4) Uncertain technology direction. When the technologies are still developing and there are multiple potential directions, heavy early investment could pose a risk in an evolving technology landscape.
Appendix: Prysmian (PRY.MI, Buy): Largest global cable maker
Prysmian (PRY.MI, Buy, covered by Daniela Costa) Prysmian is the largest global cable maker focused primarily on electricity cables, with 8% of revenues from fi ber and fi ber optic cable sales. It is one of the largest manufacturers of raw fi ber along with Corning, Sumitomo, Fujikura and others. Prysmian's Digital Solutions sales exposure is ~4% to raw fi ber sold to other OEMs and ~96% to cables, of which Telecom Solutions account for ~66% and data centers ~16%, mainly exposed to long distance and intra campus connectivity. Within its Digital Solutions business, Prysmian has ~46% exposure to EMEA, ~40% to North America, ~10% to APAC, and ~4% to Latin America. In 2025, Prysmian acquired Channell, strengthening its positioning by adding fi ber management systems, enclosures, and connectivity hardware, and enabling a more complete end to end o ff ering alongside its cable portfolio.
We expect Prysmian to see strong pricing tailwinds from higher fi ber prices, driven by data center demand. The company notes it has a full order book through 2026 from its Fiber customers and is seeing customers willing to sign long term framework agreements at current price levels. Prysmian's vertically integrated production capabilities-covering preform, fi ber drawing, and cabling-allow it to bene fi t from tight market conditions, with the group producing around two-thirds of its fi ber requirements in-house and outsourcing lower spec products. Given sustained demand, Prysmian is planning brown fi eld capacity expansions in fi ber. Alongside its leading manufacturing footprint,
O: See progress in adoption
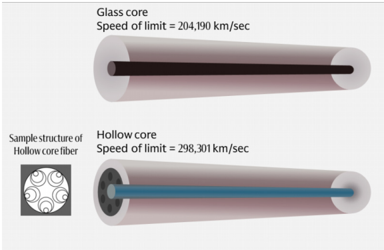
the company continues to invest in next generation technologies, including hollow core fi ber to reduce latency in high density environments and the fi rst commercially available 160 micron bend insensitive fi ber.
Appendix: Scale up vs. Sale out vs. Scale across
Exhibit 47: Illustration of scale up, scale out and scale across connections
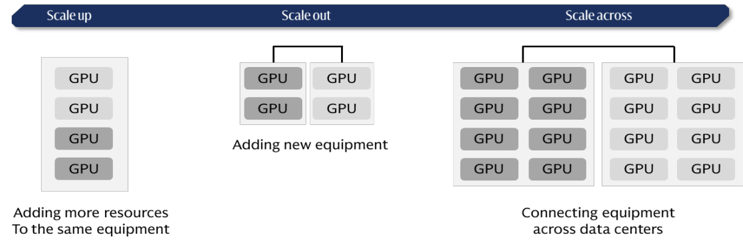
Source: Company data, Goldman Sachs Global Investment Research
Given the increasing need for high speed AI computing, the industry has been trying to connect more GPUs to expand the size of AI clusters. There are three major ways of expansion: (1) Scale up : adding more GPUs and computing resources within the same piece of equipment, typically within the same server rack (e.g. Nvidia's Vera Rubin rack connects 72 GPUs in a rack); nowadays there are scale-up expansions that connect across racks, or the so-called supernodes, where the networking speed across racks are optimized to close to the connections within the same rack; (2) Scale out: adding more equipment and connecting them through switching technologies, a traditional way of network expansion. Nowadays, AI clusters support scale out connections of 100k+ GPUs; (3) Scale across: connecting servers across data centers in di ff erent locations; Nvidia introduced their solutions for scale-across networking via in-house Ethernet switch and NIC (network interface controller) products.
Appendix: Closed vs. Open ecosystems
Nvidia is also a participant of ESUN although its the major bene fi ciary of closed scale-up ecosystem.
There is an ongoing competition of closed ecosystem and open ecosystem for networking in data centers. In scale-up networking , it is dominated by Nvidia's closed ecosystem, in which Nvidia design its own switch ASICs and switch equipment and delivery 'full rack' designs such as Vera Rubin racks. However, the establishment of ESUN (Ethernet for Scale-Up Networking) in Oct 2025, OCP marked a step forward of the open ecosystem entering the scale up domain; the goal of ESUN is to adopt the Ethernet technology to scale-up applications. UALink is another open networking initiative focusing on GPU-GPU scale-up networking, and has announced 200G 1.0 Speci fi cation in May 2025. In scale-out networking , Nvidia's in fi niBand (closed ecosystem) is challenging the dominance of Ethernet. In fi niBand comes with higher performance including lower latency and higher bandwidth, while Ethernet remains the cost e ff ective and compatible choice. In order to upgrade the Ethernet performance, the UEC (Ultra Ethernet Consortium) was established in Aug 2023 with the goal of optimizing Ethernet for AI and HPC application, and the consortium announced the 1.0
speci fi cation in June 2025.
Exhibit 48: Scale up networking: Closed vs. Open ecosystems
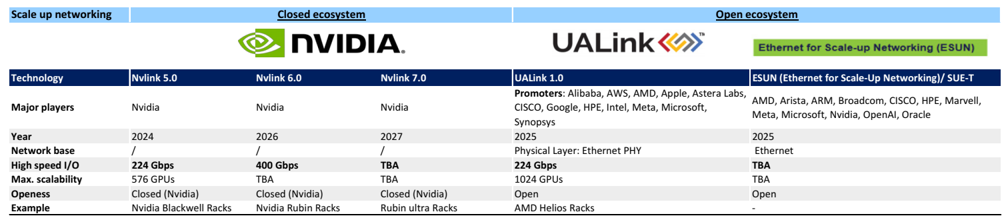
Source: Data compiled by Goldman Sachs Global Investment Research, Company data
Exhibit 49: Scale out networking: Closed vs. Open ecosystems
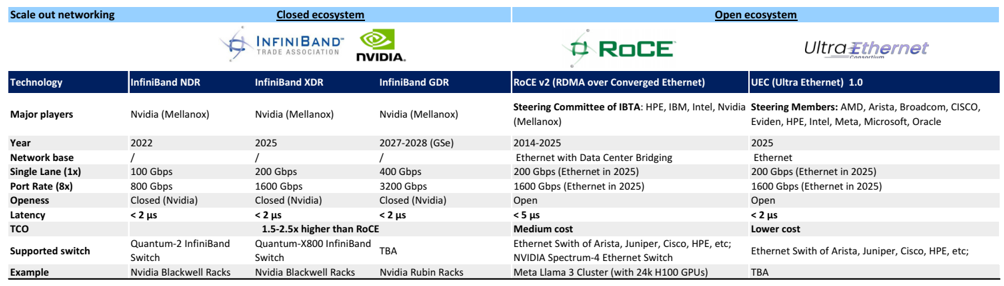
| Scale out networking | Closed ecosystem | Closed ecosystem | Closed ecosystem | Open ecosystem | Open ecosystem |
|---|---|---|---|---|---|
| Technology | InfiniBand NDR | InfiniBand XDR | InfiniBand GDR | RoCE v2 (RDMA over Converged Ethernet) | UEC (Ultra Ethernet) 1.0 |
| Major players | Nvidia (Mellanox) | Nvidia (Mellanox) | Nvidia (Mellanox) | Steering Committee of IBTA : HPE, IBM, Intel, Nvidia (Mellanox) | Steering Members: AMD, Arista, Broadcom, CISCO, Eviden, HPE, Intel, Meta, Microsoft, Oracle |
| Year | 2022 | 2025 | 2027-2028 (GSe) | 2014-2025 | 2025 |
| Network base | / | / | / | Ethernet with Data Center Bridging | Ethernet |
| Single Lane (1x) | 100 Gbps | 200 Gbps | 400 Gbps | 200 Gbps (Ethernet in 2025) | 200 Gbps (Ethernet in 2025) |
| Port Rate (8x) | 800 Gbps | 1600 Gbps | 3200 Gbps | 1600 Gbps (Ethernet in 2025) | 1600 Gbps (Ethernet in 2025) |
| Openess | Closed (Nvidia) | Closed (Nvidia) | Closed (Nvidia) | Open | Open |
| Latency | < 2 μs | < 2 μs | < 2 μs | < 5 μs | < 2 μs |
| TCO | 1.5-2.5x higher than RoCE | Medium cost | Lower cost | ||
| Supported switch | Quantum-2 InfiniBand Switch | Quantum-X800 InfiniBand Switch | TBA | Ethernet Swith of Arista, Juniper, Cisco, HPE, etc; NVIDIA Spectrum-4 Ethernet Switch | Ethernet Swith of Arista, Juniper, Cisco, HPE, etc; |
| Example | Nvidia Blackwell Racks | Nvidia Blackwell Racks | Nvidia Rubin Racks | Meta Llama 3 Cluster (with 24k H100 GPUs) | TBA |
Source: Data compiled by Goldman Sachs Global Investment Research, Company data
Appendix: Illustration of di ff erent connection products
Exhibit 50: DAC/ ACC/ AEC/ ADC: widely used in scale up and scale out connections
Copper (DAC/ AAC/ AEC) vs. Optical cables (ADC)
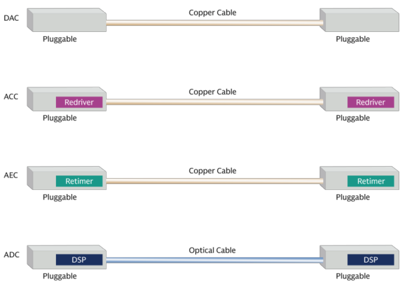
Micron
Source: Company data
Exhibit 51: Hollow core fi ber: potentially for scale-across connections
Hollow core fi ber support extra low latency comparing to traditional fi ber
Source: Company data