PDF 原檔:報告_Nomura_AI半導體伺服器循環是否見頂_20260630_original.pdf
野村《Asia AI Semi & Server — Is the cycle over?》Anchor Report,2026-06-30,119 頁。核心論點:SOX 自 3 月 +85%/自 2025/5 +211% 後近期回檔屬健康修正,但循環尚未見頂(hyperscaler 2027F capex 仍有上修空間、自有資料中心建置追蹤續升、greenfield 需 2 年使供給吃緊延續至 2027F)。瓶頸由 TSMC(CoW)轉向 WoS 與眾多小元件;漲價與獲利上修為最大催化劑。九檔調升目標價:2330_台積電(市)、3711_日月光投控(市)、5274_信驊(市)、2454_聯發科(市)、6488_環球晶圓(市)、2449_京元電(市)、2383_台光電(市)、6274_台燿(櫃)、4958_臻鼎科技(市)。
圖片清單(已驗證 2026-06-30)
size 篩 ≥40KB 候選後逐張 Read 驗證分類。嵌入 lib/ 頁只挑「真資料圖」,圖說照抄親眼所見。其餘未個別列出之圖多為券商評論 / 財報模型表(docling 已 OCR 成文字)或裝飾性投影片。
| 檔名 | 對應 Fig | 分類 | 親眼所見內容 |
|---|---|---|---|
| _001 | 封面 | 裝飾·banner | 馬拉松路跑者照片(封面,呼應 "Is the cycle over"),無資料 |
| _003 | Fig 2 | 真資料圖 | 各 CSP/neocloud 資料中心建置時程甘特圖:operator × infra partner × location × 2024–2030,標 GW 規模(如 Prometheus 1GW、Stargate、Project Rainier 等) |
| _021 | Fig 23 | 真資料圖 | Hyperscaler 自研晶片路線圖:Google/AWS/Meta/Microsoft 之 Accelerator+CPU 逐年節點(TPU v1→v9、Trainium、Inferentia、MTIA、Maia、Cobalt、Axion、Graviton) |
| _032 | Fig 34 | 真資料圖 | nVidia AI 平台路線圖規格表 Ampere→Hopper→Blackwell→Rubin→Rubin Ultra→Feynman:邏輯節點、電晶體數、interposer 尺寸、HBM 規格、TDP、NVLink、PCB/CCL、散熱方案 |
| _038 | Fig 42 | 真資料圖 | Intel Foundry「AI is driving Scaling of Advanced Packaging」EMIB 縮放路線圖:2023(~4x)→2026(~8x)→2028+(~12x)→Future(>24x reticle) |
| _040 | Fig 46 | 真資料圖 | TSMC 2026 技術論壇 CoWoS roadmap:3.3-reticle(8xHBM3,2024)→5.5(12xHBM3E/4,2026)→9.5(12xHBM4E,2027)→14(20xHBM5,2028)→>14(24xHBM5E,2029);5.5-reticle >98% yield in 2026 |
| _043 | Fig 50 | 真資料圖 | TSMC-SoIC roadmap:N7 9um(2023)→N5 6um(2025)→N3P/N2P 6um→A14-on-A14 4.5um(2029);56X 互連密度、5X 能效 vs CoWoS 2.5D |
| _045 | Fig 52 | 真資料圖 | AMD MI300 剖面圖:8 stacks HBM、6 XCD、3 CCD、4 IOD、carrier silicon、passive silicon interposer、IOD-IOD/IOD-HBM links(示意 SiC carrier 替代位置) |
| _058 | Fig 67 | 真資料圖 | ASPEED BMC TAM 堆疊柱狀圖 2026–2030(BMC for General / AI-related General / GPU / AI ASIC server,單位百萬顆,2030 達 ~66mn) |
| _060 | Fig 71 | 真資料圖 | Top-5 CSP capex consensus 柱狀圖 2023–2027F,y-y 60%→72%→80%→25%,年增額 +172/+328/+182bn |
| _065 | Fig 76 | 文字卡 | SOX 走勢圖配野村多年觀點註解(歷史回顧,文字密集,低嵌入價值) |
原始內容
ANCHOR REPORT
Global Markets Research 30 June 2026

Asia AI Semi & Server
Is the cycle over?
With SOX surging by 85% since our last cycle update in March and up 211% since we revisited the AI theme in May 2025, we have noticed a share price collapse of late. To us, a pullback is healthy following such a surge, particularly when some risks have to be digested. However, we do not seem to have reached the cycle peak yet, given hyperscalers' spending upside into 2027F (despite having insufficient FCF), and our global new data center build tracking showing further upside. More importantly, the two years of greenfield build for new capacity from late-2025 suggests insufficient supply heading into 2027F. Price hikes and earnings revision remain the biggest catalysts, in our view.
Key analyses included in this report:
- Update of our proprietary global new data center build tracking ·
- CoWoS 2027F allocation considering the severe shortages of WoS vs CoW ·
- Unprecedented component supply-mismatch from 2H26F with potential to worsen further into 2027F ·
- xPU/ASIC 2027F outlook: when the elephants fight, the grass get trampled ·
- Renewal of our latest view on the AI and general server market outlook ·
- CPU demand upside and (benefiting) OSATs' CoWoS-like process ·
- SoIC and CoPoS to counter EMIB-T; and benefit to relevant supply chains ·
Research Analysts
Asia Technology
Aaron Jeng, CFA - NITB aaron.jeng@nomura.com
+886(2) 21769962
Anne Lee, CFA - NITB anne.lee@nomura.com +886(2) 21769966
Donnie Teng - NIHK donnie.teng@nomura.com +852 2252 1439
Vivian Yang - NITB vivian.yang@nomura.com +886(2) 21769970
Eric Chen, CFA - NITB eric.chen@nomura.com +886(2) 21769965
Carol Hu - NITB carol.r.hu@nomura.com +886(2) 21769963
Production Complete: 2026-06-29 20:51 UTC
EQUITY: TECHNOLOGY
Asia AI Semi & Server
EQUITY: TECHNOLOGY
Is the cycle over?

Research Analysts
There could be a few valid factors that may explain the recent share price pullback, but likely we have not yet reached the peak of this cycle
Where are we in this AI infra investment cycle?
With SOX surging by 85% since our last cycle update in March (report ) (and up 211% since we revisited the AI theme in May 2025; Fig. 76 ), we have noticed a share price collapse of late. To us, a pullback is healthy following such a surge over such a short period, particularly when we see some risks that have to be digested, e.g., the likely biggest-ever component supply mismatch, hyperscalers' 2027F free cash flow (FCF) issue, execution of many cutting-edge technologies beyond 2027F, and macro risks related to a yield uptrend. However, we do not seem to have reached the cycle peak yet given that hyperscalers' spending may need to show upside further into 2027F (despite insufficient FCF particularly driven by surging memory costs, as this might be a 'go big or go home' competition), and our proprietary global new data center build tracking suggesting further upside from our March update . On the supply side, the two years for greenfield build for new capacities from late-2025 suggests insufficient supply into 2027 (and very likely the supply bottleneck shifting from tech giants such as TSMC [2330 TT, Buy] to other, smaller component makers). Furthermore, price hikes and ongoing earnings upward revision would still be the biggest catalysts. As such, we would still be buyers into weakness. We raise target prices for nine AI tech companies (mentioned below) with this Anchor Report.
TSMC turning aggressive on CoW plan, but the bottleneck could shift to WoS
We now expect TSMC to 'target' chip-on-wafer-on-substrate (CoWoS) capacity of 2,000kpcs in 2027F, from 1,100kpcs in 2026F, and forecast that it would need 2,5003,500kpcs of CoWoS output by 2029F, depending on the scale of annual price hikes, to achieve its 'high-50%' AI revenue CAGR over 2024-29E. In addition, if Feynman production fully migrates to chip-on-panel-on-substrate (CoPoS) in 2029F, TSMC would need to build 700-800kpcs CoPoS capacity by 2029F. However, our contrarian view is that 'WoS' and many other small components would very likely become a bigger bottleneck than 'CoW' in the remaining of 2026F and also into 2027F - which is not a bad reading for long-term cycle sustainability, in our view, but would likely drive short-term share price volatility. As such, we only 'model' 1,800kpcs of CoWoS output in 2028F - which would have profound implications for different GPU/ASIC vendors in 2027F, i.e. when the elephants (nVidia [NVDA US, Not rated] and Google [GOOGL US, Not rated]) fight, the grass (other xPU/ASIC) would get trampled, we think. Separately, outsourced semiconductor assembly and test (OSAT) vendors would not only benefit from TSMC's growing WoS outsourcing but also from further price hikes (given ongoing material cost inflation) and upside from their own CoWoS-like full process (driven by CPUs).
SoIC and CoPoS to counter EMIB-T; relevant supply chains to benefit
Intel's (INTC US, Not rated) embedded multi-die interconnect bridge with TSV (EMIB-T) appears to be emerging as potentially the biggest threat to TSMC's advanced packaging. During TSMC's 2026 North America Symposium in April, TSMC launched its 14x reticle size CoWoS roadmap (2028E) vs a prior roadmap for an interposer size up to 9.5x reticle (2027E). However, our view is that system-on-integrated-chips (SoIC) and CoPoS are two equally critical technologies for TSMC to stay ahead of its competition in advanced packaging. We expect Feynman to target the first-ever GPU-on-GPU SoIC stack. In our view, there would be multiple implications from this: First, the bigger footprint and high thermal design power (TDP) of Feynman would start to drive the adoption of silicon carbide (SiC) carrier. Second, SoIC capacity demand would skyrocket through 2028-29F.
Asia Technology
Aaron Jeng, CFA - NITB aaron.jeng@nomura.com +886(2) 21769962
Anne Lee, CFA - NITB anne.lee@nomura.com +886(2) 21769966
Donnie Teng - NIHK donnie.teng@nomura.com
+852 2252 1439
Vivian Yang - NITB vivian.yang@nomura.com +886(2) 21769970
Eric Chen, CFA - NITB eric.chen@nomura.com +886(2) 21769965
Carol Hu - NITB carol.r.hu@nomura.com +886(2) 21769963
TSMC
Delta
Hon Hai
ASE
EMC
Unimicron
Quanta
Lenovo
AVC
BESI
Wiwynn
Zhen Ding
Rating
Market cap
(USDmn)
Target price (LCY)
New
Old
Stocks for action: Raising target prices across nine AI semi/hardware companies
5,800.0
2,800.0
352.0
730.0
6,880.0
1,350.0
479.0
417.0
524.0
35.0
3,130.0
We reiterate our Buy ratings with higher target prices on:
- TSMC: AI chip enabler ·
Buy
Buy
147,569
109,420
- ASE (3711 TT): upside from WoS and CoW ·
- ASPEED (5274 TT): outright CPU beneficiaries ·
- MediaTek (2454 TT): TPU upside ·
45,836
45,810
- GWC (6488 TT): SiC opportunities in Feynman ·
- KYEC (2449 TT): beneficiary of AI chip testing ·
3,400.0
2,800.0
352.0
575.0
5,285.0
1,350.0
479.0
417.0
524.0
35.0
3,130.0
- EMC (2383 TT)/TUC (6274 TT): CCL benefiting from AI upgrade trends and more price upside from being one of the major supply bottlenecks · 720.0 510.0
ASPEED
Wistron
TUC
GWC
KYEC
Bizlink
Soitec
280.0
- ZDT (4958 TT): an emerging AI PCB/HDI maker ·
19,100.0
280.0
We also like the following Buy-rated stocks: BESI (BESI NA; CPO and GPU-on-GPU SoIC), Soitec (SOI FP; SOI wafer for CPO), Unimicron (3037 TT; substrate also benefiting from multiple trends and more price upside from being another major supply bottleneck), Victory Giant (300476 CH / 2476 HK; AI PCB beneficiary), Compeq (2313 TT), Delta (2308 TT; power top pick), AVC (3017 TT; thermal top pick), Samsung Electronics (005930 KS; memory leader), Bizlink (3665 TT; rack power and data upgrades), as well as Hon Hai (2317 TT) and Lenovo (992 HK) in ODMs.
Fig. 1: Stocks for action
Note: Priced as of 26 June 2026.
Source: Bloomberg Finance L.P., Nomura estimates
11,500.0
1
Last close
(LCY, as of
26 June 2026)
2,340.0
339,000.0
3,880.0
1,810.0
248.5
632.0
5,255.0
975.0
342.4
319.6
362.0
23.4
2,255.0
282.7
4,280.0
580.0
15,615.0
153.0
1,580.0
936.0
308.0
1,855.0
222.5
114.4
Downside
46.4%
97.6%
49.5%
54.7%
41.6%
15.5%
30.9%
38.5%
39.9%
30.5%
44.8%
49.3%
38.8%
20.3%
98.6%
24.1%
22.3%
83.0%
33.9%
28.2%
26.6%
72.5%
55.1%
118.6%
Executive summary
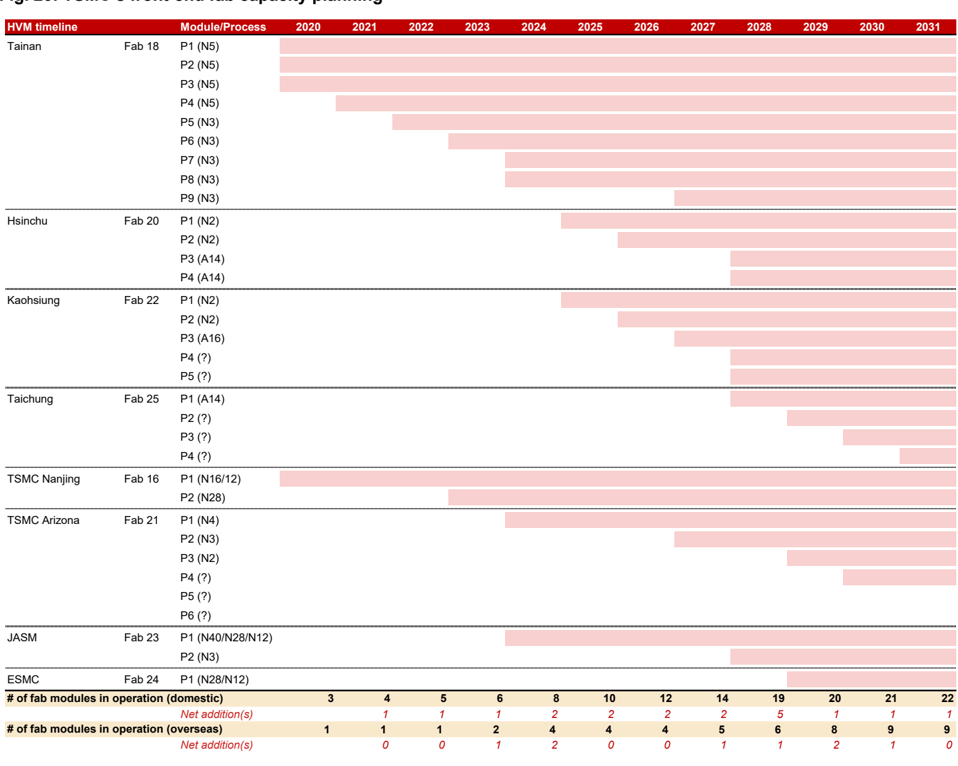
Big picture: We believe there are growing signs of the cycle peaking using conventional signals such as price hikes, LTAs, and possible overbooking. However, given our view that AI demand is real (report ) and AI's impact is dramatic, we have refrained from leveraging conventional cycle wisdom (which has helped us come to the correct conclusions during semi cycle peaks and bottoms over the past decade; Fig. 76 ) during this AI-driven cycle over the past two years. Since 4Q25, we have tracked global new data center build plans as a leading demand indicator for the Asia semi hardware supply chain - which enhanced our conviction on AI amid market concerns/noise in December 2025 (report ) and March 2026 (report ), respectively. In this report, we would like to refresh where we are in the AI cycle. On the supply side , it generally takes two years to build new greenfield capacity (which began in late-2025, when all hyperscalers significantly raised their chip/hardware forward demand outlooks; the earliest signal in our coverage was BMC; refer to our August 2025 ASPEED [5274 TT, Buy] report ), which suggests still likely constrained supply over the next year (e.g., TSMC's next big jump in front-end capacities will be in 2028F; Fig. 20 ). What's more, we have noted that WoS (Wafer-on-Substrate) and many other small components could become a bigger bottleneck than CoW (Chip-on-Wafer) in 2027F - which might not be a bad reading for long-term cycle sustainability, but would likely drive short-term share price volatility.
With demand side factors (hyperscalers' capex upside, our global data center tracking, token consumption trends, etc., see Appendix: CSP comments on AI and investments ) sustaining, across-the-supply-chain price hikes will likely continue, we think. Sustainable upward consensus earnings estimate revisions for Asia semi hardware supply chain companies would still be the biggest catalyst in driving share prices higher - as we predicted to happen through 2026 (report ) - in our view. Risk-wise , we believe AI infrastructure investment momentum is critical (so far, so good based on our tracking), while new technology breakthroughs will be needed from 2028F. We believe lots of cutting -edge technologies need to happen beyond 2027F before the AI chip hardware roadmap can be extended further, including, but not limited to: EMIB-T, CoPoS, GPU-onGPU SoIC, microchannel lid (MCL), co-packaged optics (CPO), 336G/448G SerDes, M9Q/M10Q PCB, PTFE, and new tools/materials for high-density interconnect (HDI) PCB. Owing to surging memory costs, hyperscalers could start facing insufficient FCF in 2027F (Fig. 71 to Fig. 75 ; our latest AI server sales forecast for 2027 suggests eventual upside to hyperscaler capex) - which could cause investor concerns, particularly with the macro risk of yield on an uptrend driven by growing inflation but still decent unemployment rates in the US (report and report ).
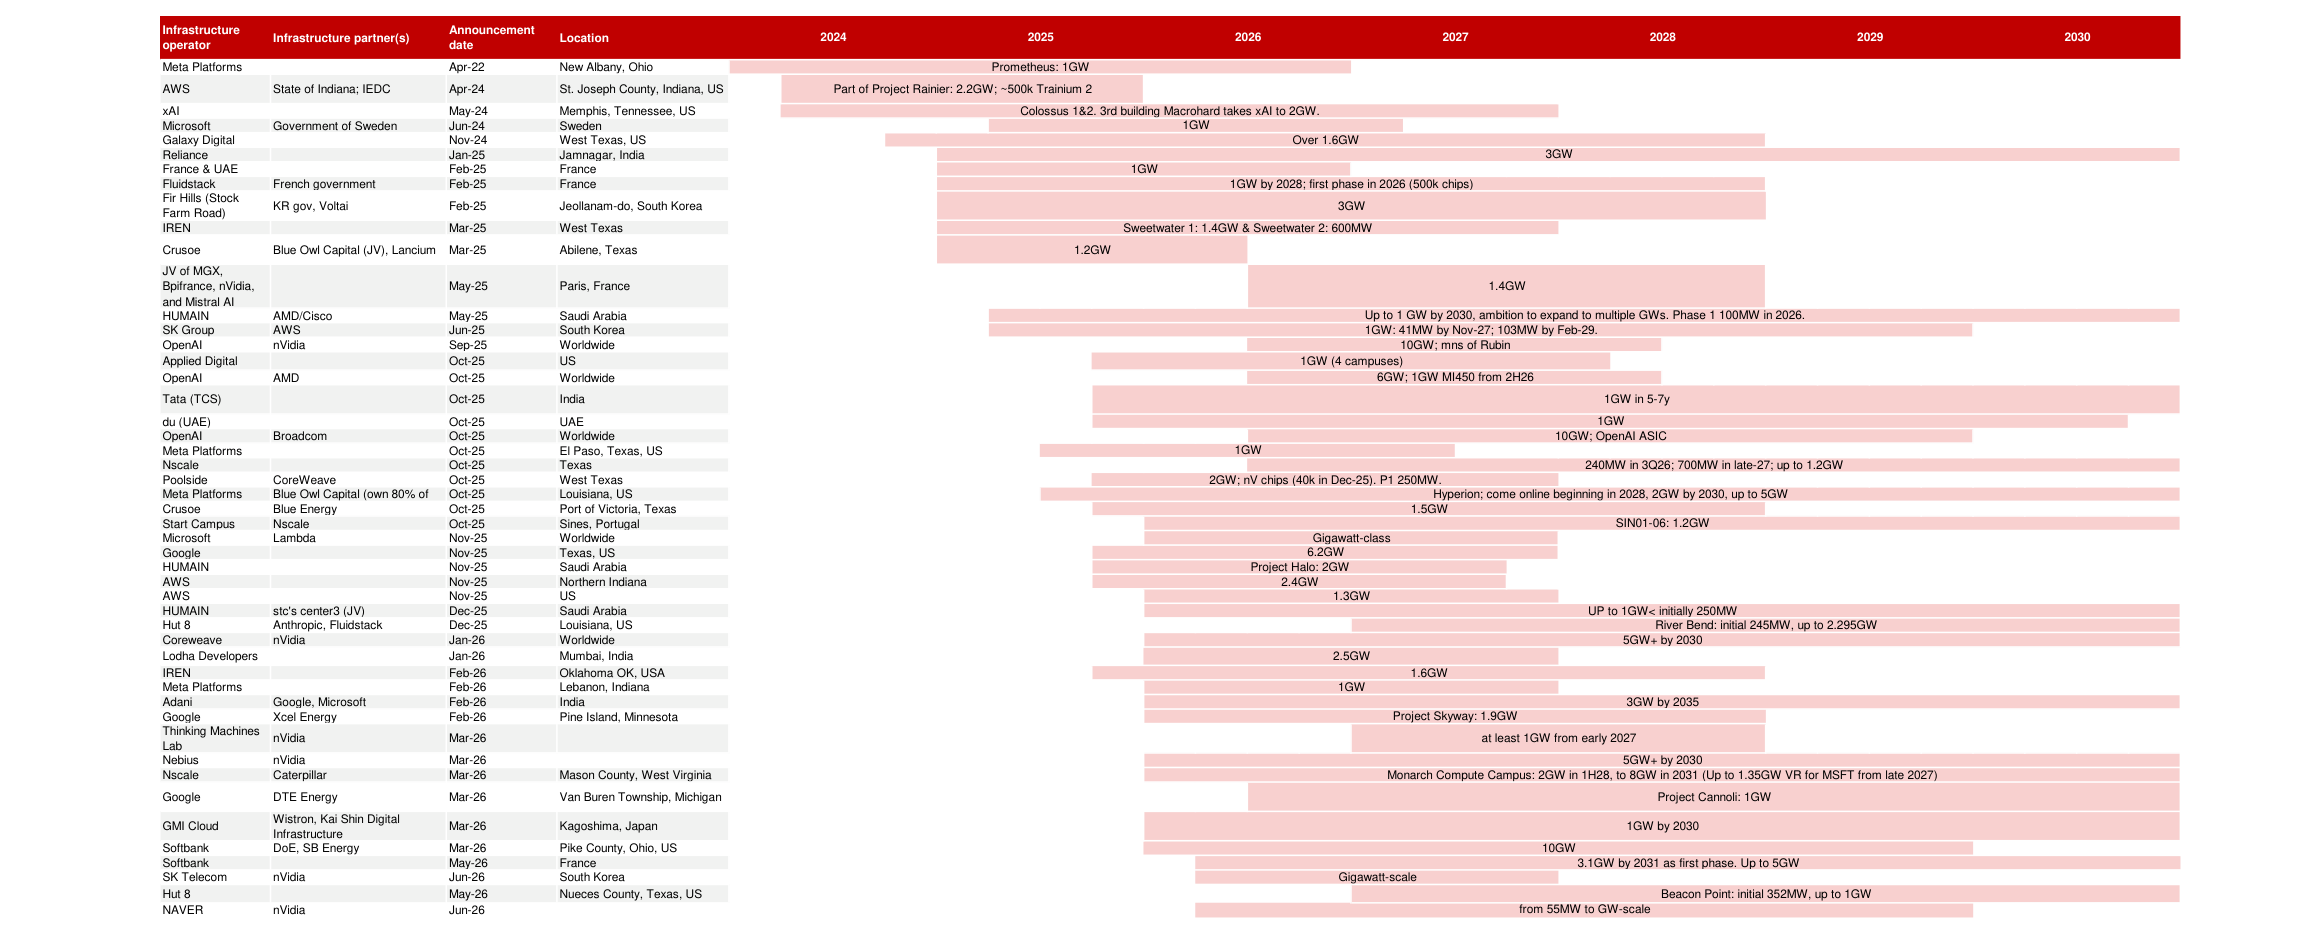
Our latest Global new data center build tracking suggests further upside from our March update three months ago. The total number of projects has increased to 280 (from 240), while the gigawatt (GW) level project number has increased to c.50 from 40+. The incremental capacity deployment in 2027F, measured in GW, would grow to 32GW (from 28GW) from 26GW (unchanged) in 2026F. We do not have full-year visibility yet, but the tracking so far suggests 23GW demand in 2028F (up from 21GW). Fig. 2 - Fig. 4 compile our latest findings. Given the surge of AI chip/hardware share prices over the past three months, we hope to see growing 2028 visibility over the next 3-6 months.
We have noticed quite a few interesting points to highlight with respect to TSMC's CoWoS capacity-expansion plan. First, TSMC has turned aggressive in responding to surging AI chip demand and is likely to defend itself from competition from EMIB-T and fanout panel-level packaging (FOPLP), in our view. We thus now expect TSMC to target CoWoS capacity of 2,000kpcs in 2027F, from 1,100kpcs in 2026F. Though we do not have 2028-29F visibility, our back-of-the-envelope calculation suggests that TSMC would need somewhere from 2,500-3,500kpcs of CoWoS output by 2029F, depending on the scale of annual price hikes, to achieve management's goal of a 'high-50% AI revenue CAGR' (Fig. 21 and Fig. 22 ). Another interesting exercise we have done in terms of long-term CoWoS plans is asking, ' How would CoPoS affect the CoWoS capacity plan? '. A year ago, our view on TSMC's CoPoS plan (report ) was that we expected CoPoS to enter mass production only from 2029F (much later than the Street estimate). Despite this, we hope that TSMC could pull forward its schedule to meet nVidia's Feynman GPU timeline (2H28). With our 'napkin math' assuming nVidia Feynman production fully migrates to CoPoS in 2029F, TSMC would need to build 700800kpcs CoPoS capacity by 2029F (How will TSMC's CoWoS capacity shape up
through 2029F? ). We believe 50% of CoWoS capacity in 2029F would need to find new customers in this scenario (however, we note that in reality, product transitions do not happen overnight).
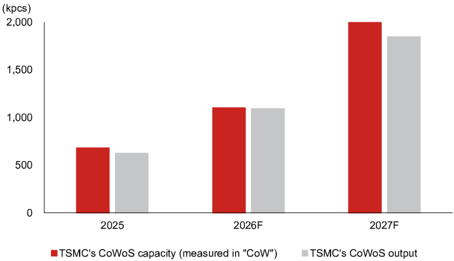
Though TSMC has turned aggressive in its CoWoS plan (precisely, its CoW plan), our tech team's contrarian view is that 'WoS' (not controlled by TSMC) and many small components would very likely become a bigger bottleneck than 'CoW' (controlled by TSMC) into 2027F - which is not a bad reading for long-term cycle sustainability, but would likely drive short-term share price volatility. Taking these new factors into consideration, we only model 1,800kpcs of CoWoS output in 2027F (despite our view of TSMC's target of 2,000kpcs) - which would have profound implications for different GPU/ASIC vendors in 2027F, in our view.
We believe there will be an unprecedented component supply-mismatch period in 2H26F, and we expect it will get worse in 2027F , as in 2H25 many component suppliers still underestimated (more so than TSMC) the order upside potential from AI when they made their capacity expansion plans. In addition to the well-known advanced node/packaging, memory, and CPU shortages, PCB/CCL, IC substrate, higher-end capacitors, power management IC (PMIC), and optical components, are also already in shortage currently, and we forecast demand-supply conditions will further deteriorate when Rubin and Trainium 3 ramp from 2H26. This could further affect the supply for nonAI subsectors such as consumer and auto, in our view. Also, supply chain price hikes could continue or increase with worsening shortages , we think.
In view of our assumptions and observations above, we are raising our 2026-27F server market forecasts on stronger AI and general/CPU server sales (Fig. 69 ). We now forecast global server revenue growth of 74%/65% y-y for 2026F/2027F (vs 43% y-y for 2026F previously), with AI server revenue growth rates at 78%/76% y-y for 2026F/2027F (previously 58% y-y for 2026F) and general/CPU server revenue growth rate at 67%/43% y-y for 2026F/2027F (previously 16% y-y for 2026F). For 2026F, considering rising capex guidance from top US CSPs YTD and increase in neoclouds, we raise our GB/VR rack shipment assumption from 50k units to 54.5k units for 2026F (Fig. 69 ). Of this, we assume VR200 to account for 15-20% in 2026F, with concentration in 4Q26F . We assume a transition from GB300 to VR200 during late-2Q26F to 3Q26F, as top CSPs will likely prefer to wait for VR200, instead of continuing to install more GB300s. In the transitional period, we expect neoclouds to play a bigger role in buying more systems to support the continued token demand growth at AI companies. We also introduce our forecast of 62k racks for 2027F , with a potential transition from Rubin to Rubin Ultra happening in 2Q27F.
In 2H25, we concluded in our AI Semi & Server Anchor Report that nVidia would continue to secure 60% of CoWoS allocation (along with other key materials such as T-glass), as nVidia had booked 'strategic resources' well ahead of its peers to crowd out competitors. This strategy has worked out well, in our view - e.g., Google, despite Geminis' impressive breakthrough from late 2025 (news ), hasn't been able to acquire much more support in 2026. AMD's (AMD US, Not rated) GPU and AWS's (AMZN US, Not rated) ASIC have progressed through 2026 with downside to beginning-of-the-year expectations. Looking into 2027F CoWoS allocation, we expect the following dynamics (many of which are contrarian). First, CoW capacity allocation would be less critical than whether GPU/ASIC vendors can secure support from substrates and other smaller components (e.g., CCL, capacitors); Second , Google's tensor processing unit (TPU) share in CoWoS could rise further to 26% in 2027 from 23% in 2026 (nearly double y-y growth) on its proven Gemini performance, complete Google ecosystem and share gain; Third , despite our view that nVidia would continue to strive for 60% allocation, our models build in our assumption that nVidia's share in CoWoS would slide to c.55% in 2027F given the squeeze by TPU; Fourth , the other GPU/ASIC vendors would be squeezed even more, e.g., we assume AMD's CoWoS capacity share would only marginally improve y-y despite a low base, while AWS's CoWoS capacity share might even fall y-y in 2027F; Fifth , we raise our AI revenue growth estimate for TSMC to 77%/67% for 2026F/27F (from 69%/24% previously), vs the company's target of a 'high-50% revenue CAGR over 2024-29E' (Fig. 26 ); Sixth , despite our c.55% CoWoS allocation assumption for nVidia in 2027F, we see upside to consensus revenue forecast if it can sell out all those booked capacities (Fig. 72 ); Seventh , though we expect TPU to enjoy the fastest growth in 2027F among AI logic semi, the majority of growth would be taken by MediaTek (its share in TPU could more than double to 30%+ in 2027F from c.15% in 2026).
TSMC's more aggressive attitude on expanding CoW capacity would benefit OSATs directly, in our view, given TSMC's current full outsourcing of WoS. Though we believe WoS supply constraints could limit shipment upside for OSATs, the likely ongoing price hikes for substrates could drive OSAT packaging prices higher, too. Separately , we expect the next growth catalyst for OSATs to shift to their own CoWoS-like full processes. Other than technology readiness, we believe another key factor hindering OSATs from engaging in CoW processes is the enormous losses that would be incurred if there were to be immature assembly yield. That, in our view, is the reason why the high-performance computing chips using OSATs' CoW to ramp up volume from 2H26 are mostly CPUs (Fig. 37 ; which do not carry expensive HBM content), such as AMD's Venice CPU by ASE/SPIL or nVidia's Vera CPU by Amkor (AMKR US, Not rated) . Fig. 57 summarizes the skyrocketing TAM outlook for the server CPU market; also see Appendix: other critical developments and key quotes from major server CPU players for more details.
In the meantime, Intel's (INTC US, Not rated) EMIB-T appears to be emerging as potentially the biggest threat to TSMC's advanced packaging given its capability of large-reticle size packaging. The most closely watched EMIB-T project now is Google's v9 TPU in collaboration with MediaTek given its high complexity and large volume (set to ramp-up in 2028, according to our industry survey). The >9x reticle-size chip-level footprint (details in our February 2026 MediaTek report ) is something that could not be addressed by TSMC's CoWoS roadmap by the time when Google's decision was made, we suppose. Also, TSMC probably was not looking to expand CoWoS capacity that much at end-2025 (refer to our December 2025 Anchor Report ). Fig. 44 summarizes our view on EMIB-T supply chain beneficiaries.
Now, it appears to us that TSMC has turned more aggressive on its advanced packaging investments. C.C. Wei, the company's chairman, made it clear during TSMC's April 2026 earnings call that the company 'works very hard to meet all the demand' and 'doesn't leave any business on the table'. During its 2026 North America Symposium in Apr i l , TSMC launched its 14x reticle size CoWoS roadmap (by 2028E; Fig. 46 ) vs a prior roadmap of up to 9.5x reticle size (2027E; Fig. 45 ). However, our view is that SoIC and CoPoS are two equally critical technologies for TSMC to stay ahead of its competition in advanced packaging. We previously wrote that the CoPoS will enter mass production in 2029F, but we hope TSMC could pull this forward and ramp it along with the Feynman timeline (2H28F). What's more, we expect Feynman to target the first-ever GPU-on-GPU SoIC stack -which would lead to higher computational power even with limited growth in interposer reticle stitching size. Our latest study suggests a Feynman interposer reticle size at c.6x (footprint in Fig. 49 ; up from c.5x from Rubin) by using SoIC. We believe there would be multiple implications from this: first, the bigger footprint and high TDP of Feynman would start to drive the adoption of SiC (an upgrade of carrier silicon - concept and location illustrated in Fig. 52 , a cross-sectional view of AMD MI300); second, SoIC capacity demand would skyrocket through 2028-29F. We expect SoIC capacity to double in 2027F (mainly driven by nVidia's CPO) and double again in 2028F (mainly driven by nVidia's Feynman, see Fig. 51 ).
All together, we largely keep our structurally bullish stance and reiterate our Buy ratings on TSMC, ASE, MediaTek, ASPEED, GWC, KYEC, EMC, TUC, and ZDT with higher target prices. We would be mindful about rising volatility from component supply mismatches and the macro yield rate outlook. Structurally, we look forward to full-year 2028F global new data center build visibility over the next 3-6 months. In the upstream semiconductor space, we also like BESI for CPO and GPU-on-GPU SoIC opportunities, Soitec for SOI wafers in CPO, and Samsung Electronics for its memory leadership.
Within the downstream space, we reiterate our Buy rating on Unimicron, as we think its IC substrate business will be a top beneficiary of multiple future trends, such as EMIB-T, CoPoS, and CPO. We like CCL companies, such as EMC and TUC, as we expect them to continue to benefit from supply tightness (with price-hike potential), material upgrades from low-loss requirements for future AI PCBs, and increasing numbers of peripheral boards such as CPUs and switches in addition to AI GPU/ASIC boards.
For the PCB sector, we reiterate our Buy ratings on ZDT and Compeq. We think the strong growth of optical module mSAP boards will be margin-accretive growth drivers for Unimicron, ZDT and Compeq. For AI PCB/HDI, we believe the increasing number of boards for AI GPU/ASIC/networking/CPU and spec upgrades will fuel the growth of the AI PCB market, benefiting ZDT and Unimicron. ZDT is an emerging AI PCB/HDI maker, and is well positioned to penetrate into nVidia, Google, and AWS's PCB/HDI more
meaningfully from 2H26F, in our view.
For the power supply sector, we believe recent concerns about a delay in 800VDC shipments have been overdone and reiterate our Buy rating on Delta, as we believe it will be a leading supplier for the upcoming +/-400VDC project ramp-up from 2H26F and we believe the +/-400VDC volume, if ramped up smoothly, will be substantial enough to beat market expectations on HVDC in 2027F (not much contribution needed from 800VDC). For thermal plays, our top pick is AVC, and we expect the ramp-up of VR200 and Trainium 3 and its new penetration into Google's TPU will be positive catalysts in 4Q26F.
Global new data center build tracking
Steady stream of project rollouts to provide robust latent hardware demand over next 2-3 years, in our view
Projects have been announced in succession with GW-scale
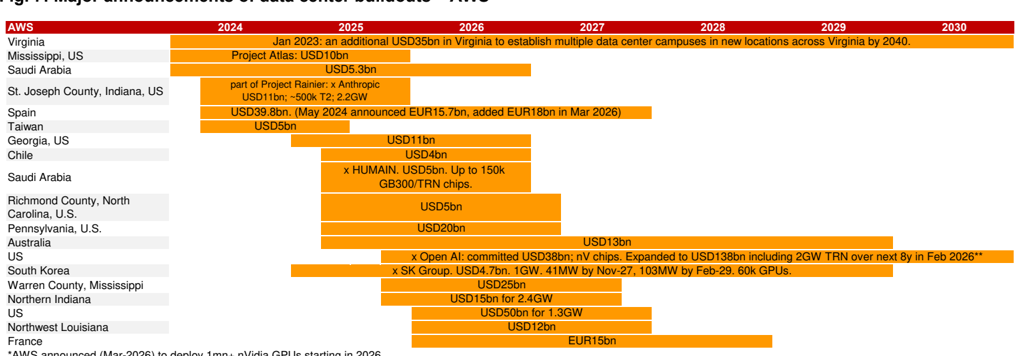
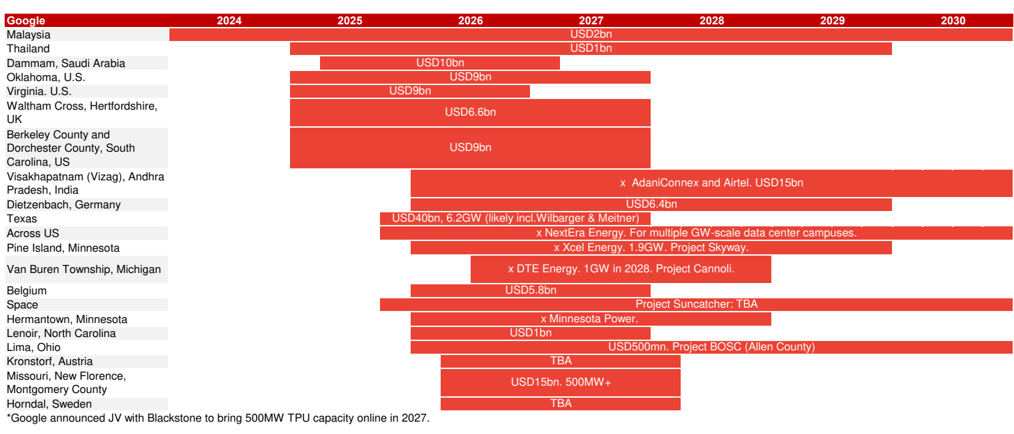
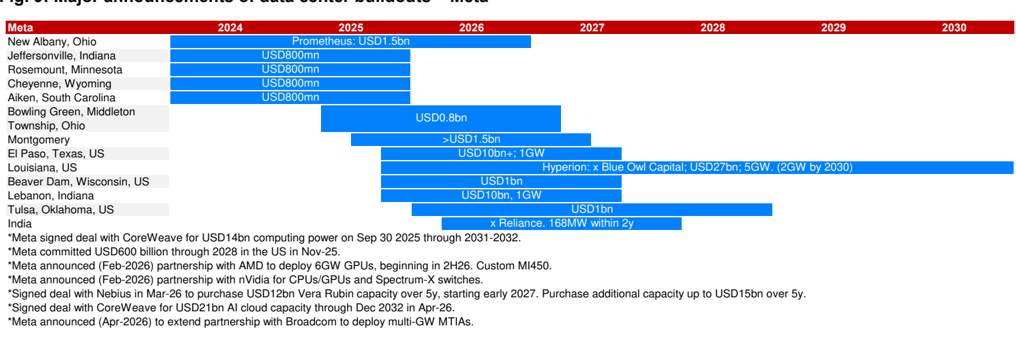
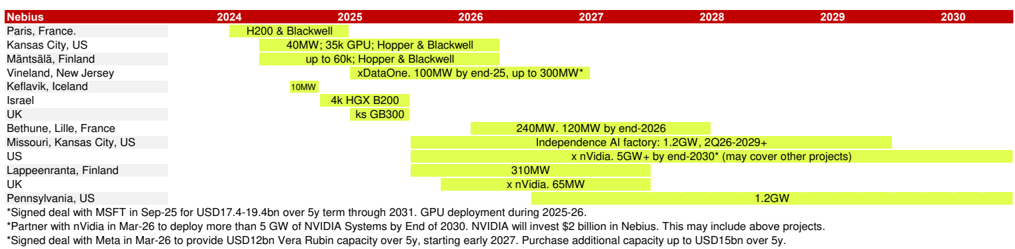
Since our last update at end-March (report ), we have continued to see more projects rolling out, and our datacenter project universe has increased from ~240 to ~280. Notably, we see some GW-scale projects such as Nebius's (NBIS US, Not rated) 1.2GW data center project in Pennsylvania (news ), Softbank's (9984 JP, Buy) 5GW project in France (press ), and SK Telecom's (SKM US, Not rated) gigawatt-scale AI cloud in Korea. By project owner, we see fewer GW-scale projects announced by the top-4 CSPs in this update. However, we still observe these hyperscalers investing globally, such as Microsoft's (MSFT US, Not rated) investment plans in Singapore, Japan, and Australia; Google's investment plans in Austria, Missouri (US) and Sweden; Meta's (Meta US, Not rated) investment plans in Tulsa, Oklahoma (US), and AWS's investment plan in France. That said, less new projects from top-4 CSPs announced with GW-scale, either no disclosure on capacity or with smaller scale.
Our selected GW-scale projects increased to ~50 this time. Similar to our March update , we see more projects supporting stronger hardware deployment in 2027F, and as time goes by, we also see more projects spanning into 2028F. The incremental capacity deployment is 32GW/23GW in 2027F/2028F from these handpicked projects, on our estimates (vs 28GW/21GW last time), indicating demand for 4-6mn AI chips per year (Fig. 3 ).
To better capture potential hardware demand, we further review the rest of the projects within our sample universe. For the rest of the projects, excluding 'shell-only' projects, there are ~40 projects smaller than 1GW in scale, and ~100 projects for which power consumption has not been disclosed. The average power consumption of small projects is 300MW, and we simply assume the rest of the projects to be 100MW each, which could represent an additional 20GW+ in hardware demand. 20GW is equivalent to 3-4mn Rubin chips, or 420k CoWoS demand throughout the deployment period.
Some projects halted
However, we also note some projects have ceased: Crusoe (unlisted) announced on 10 June that it will cease the expansion of Project Jade on a client request, a 1.8GW (up to 10GW) project. We have removed this project from our calculation base. It was also reported on 10 May that Microsoft and G42's (unlisted) USD1bn data center project in Kenya had been halted on payment issues. Our simulation this time reflects these developments.
China ecosystem is also aggressively accelerating datacenter build-outs
We acknowledge the aggressive expansion intention in China, through both national strategies and massive capital expenditures by technology giants. In June 2026, Bloomberg News reported (link ) that China's government has drafted an unprecedented nationwide AI computing network plan, aiming to invest USD295bn (~CNY2tn) over the next five years to achieve a fully interconnected national grid of distributed data centers by 2028 (report ). Besides the announcement, notable datacenter infrastructure activities in China include:
- Eastern Data and Western Computing: announced in May 2021. The plan proposed a new computing network system that integrates data centers, cloud computing, and big data, as well as Eastern Data and Western Computing demonstration projects that will enable high-quality, green data centers. ·
- Chindata Group (unlisted): The company continues to announce datacenter projects. Several years ago, it announced that the Taihang Mountain Energy and Information Technology Industrial Campus in Datong, Shanxi went into operation (ba ck in Oct 2020 ). Recently, the company also announced a partnership with HEC Group (600673 SH, Not rated) for new AI compute projects. ·
However, we do not specifically include these China data center projects in our calculation base, as these projects are likely aiming to adopt domestic compute chips, which are less relevant to our CoWoS capacity estimates. Although companies such as Chindata Group have also announced data centers beyond China (in regions such as Malaysia ), the scale is relatively small, and they are not included in our selected samples.
Fig. 2: Major data center infrastructure buildouts
Source: Company data, Nomura research
Fig. 3: Our back-of-the-envelope calculation on GW deployment trends
We see growing GW deployments into 2026-28F
| 2025F | 2026F | 2027F | 2028F | 2029F | 2030F | |
|---|---|---|---|---|---|---|
| Incremental capacity deployment (GW) | 5.98 | 26.70 | 32.30 | 22.85 | 16.85 | 6.76 |
| - OpenAI | - | 3.50 | 7.50 | 8.50 | 6.50 | - |
| - OpenAI (%) | 0% | 13% | 23% | 37% | 39% | 0% |
| - Top 4 CSPs | 2.35 | 8.58 | 6.97 | 1.56 | 0.93 | 0.93 |
| - Top 4 CSPs ((%) | 39% | 32% | 22% | 7% | 6% | 14% |
| - Others | 3.63 | 14.61 | 17.83 | 12.78 | 9.43 | 5.83 |
| - Others (%) | 61% | 55% | 55% | 56% | 56% | 86% |
From GW to Chips
Computing power % as an infra
Chip (W)
GB300
VR200
Rack power incl. redundancy (kW)
GB300 NVL72
VR NVL72
70%
TDP
1,400
2,300
180
266
Racks # per GW
3,895
2,630
Chips # per GW (k)
280
189
| 2025F | 2026F | 2027F | 2028F | 2029F | 2030F | |
|---|---|---|---|---|---|---|
| Incremental capacity deployment (GW) | 5.98 | 26.70 | 32.30 | 22.85 | 16.85 | 6.76 |
| Assume all are GB300 for 2024-26F: | ||||||
| Implied chip demand (k) | 1,678 | 7,487 | ||||
| Implied CoWoS demand (k/16) | 105 | 468 | ||||
| Assume all are VR for 2027-30F: | ||||||
| Implied chip demand (k) | 6,118 | 4,327 | 3,192 | 1,280 | ||
| Implied CoWoS demand (k/9) | 680 | 481 | 355 | 142 |
Source: Nomura estimates
ve nave sechmure projeul vundoulo Uvel tie paol
35
30
25
20
15
10
5
Fig. 4: Incremental capacity deployment (GW)
We have seen more project buildouts over the past several months
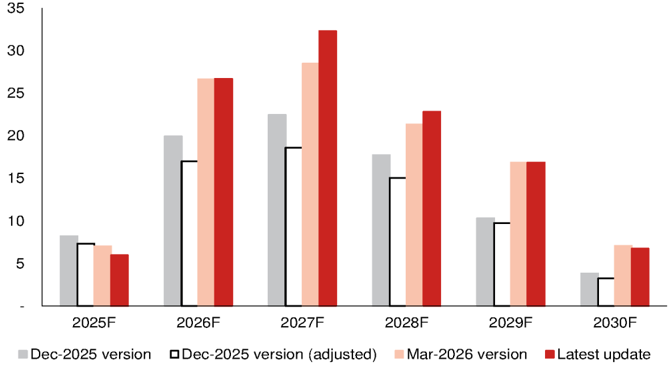
Note: Adjusted: We removed same infrastructure projects for better comparison.
Source: Nomura research
CSPs are scrambling for compute capacity
Neoclouds continue to play a role
Back in March , we mentioned that nVidia had signed deals with CoreWeave (CRWV US, Not rated) and Nebius in 2026 to deploy 5GW+ AI infrastructure each by 2030. nVidia also invested USD2bn in each of the companies. We also pointed out that in March, IREN (IREN US, Not rated) only announced a purchase agreement with nVidia. Not surprisingly, in May-2026, IREN and nVidia further announced a similar deal, under which two companies will deploy up to 5GW nVidia DSX-aligned AI infrastructure overtime. Furthermore, IREN has issued a five-year right for nVidia to purchase up to 30mn shares of ordinary stock of IREN. Note that for these three deals, we record individual projects for IREN and recorded 5GW as a whole for CoreWeave and Nebius, as IREN's projects are larger and clearer, and the two others are relatively scattered. We note Meta also expanded the deal with CoreWeave in Apr-26, when it signed a long-term agreement for AI cloud capacity that will last until Dec 2032, with a USD21bn deal value (initial deployments will be nVidia Vera Rubin platforms).
We believe neocloud is in an attractive position as a favorable choice for CSPs to access computing capacity, given that CSPs can: 1) shorten lead time (compared to CSPs' own buildouts); 2) gain faster access to the latest technologies (some neoclouds have priority to the latest AI chips); 3) mitigate risks for demand erosion; and 4) in part provides some financial flexibility. Also, during platform transition periods, CSPs may not be willing to expand more capacity for current generation chips, but still need tokens to fill the gap before new generation chips are ready, thus turning to neo clouds.
In the meantime, we see these agreements to turn into real orders. In Nov-25, when IREN announced a multi-year agreement with Microsoft (USD9.7bn), it also entered into an agreement with Dell (DELL US, Not rated; USD5.8bn) to purchase GPUs and ancillary equipment. In Mar-26, IREN announced another USD3.5bn purchase agreement with Dell. In May-26, IREN separately signed a five-year AI infrastructure cloud service contract with nVidia (USD3.4bn), and then announced to purchase USD1.6bn GPUs from Dell to support this USD3.4bn contract. These announcements are encouraging, in our view, as they indicate real hardware demand.
Shell-only projects gradually find their tenants
We removed some shell-only projects in our March update for conservativism, and we keep the same approach this time for our calculation base. However, we note that more shell-only (campus-only) projects have found tenants. For example, Applied Digital (APLD US, Not rated) continued to announced new lease deals for its data center campuses. CoreWeave is one of the lessee named . Lodha Developers (LODHA NS, Not rated) mentioned Amazon when it announced a data center plan in Jan-26, and Meta also announced that it had signed a lease deal with Reliance (RELIANCE NS, Not rated) for
168MW capacity within two years in June-26. These lease agreements boost confidence in potential hardware demand.
Cipher (CIFR US, Not rated) is another name frequently mentioned, and we also classified the company's projects as 'shell-only'. That said, we see more engagements between the company and hyperscalers. Its Barber Lake campus partners with Google and Fluidstack (unlisted), and the company has also signed lease contract with Amazon ( press ). Cipher also further announced that it had signed a new 15-year data center campus lease in Mar-26 with an undisclosed hyperscale tenant. As of June-26, Cipher already contracted 700MW capacity.
Similar to Core Scientific (CORZ US, Not rated) and Hut 8 (HUT US, Not rated), Cipher is pivoting from crypto mining companies to AI/HPC datacenter landlords. Hut 8 also announced AI data center lease deal for its River Bend Campus and Beacon Point Campus . These companies have competitive advantages in securing land, robust grid interconnections, and power capacities. IREN is another similar player that has transformed from Bitcoin miner to AI infra player, but IREN not only acts as colocation landlord, it also purchases GPUs directly.
From our understanding, the supply chain could be:
Power and land developers secure land/water/electricity as well as authority approval, then infrastructure companies build shells and facilities (Level L0/L1). ODMs are L2. Hardware buyers such as CSPs/Neo clouds/LLM players are L3/L4. In a neo-cloud leasing business model, companies such as CoreWeave become L0/L1 companies' tenants, purchase hardware (either through or not through L2), and then sign computing power deals with hyperscalers/LLM players (L3/L4). Note that the distinctions between each layer have been blurring, and some companies such as IREN operate hybrid business models in different projects. The simple classification (L0-L4) is just for better understanding of business model and supply chain.
Some examples of the value chain:
- Applied Digital builds campus, CoreWeave leases campus, purchases GPUs from nVidia, and sells computing power to hyperscalers. We only record CoreWeave's agreement with nVidia's 5GW GPU as a ceiling. ·
- IREN, through Dell, built its own data center, and sold computing power to Microsoft and nVidia. We record individual projects given scale (>1GW) and clarity. ·
In our sample collection for CoWoS demand calculation, we do not include projects without tenants, and do not necessarily include all L0/L1 projects with lease contracts to avoid double count. That said, we view more tenants disclosed a positive sign for future hardware demand.
SpaceX - a new source of computing power?
As discussed in our Global Satellites report , SpaceX (SPCX US, Not rated) has entered into computing capacity supply agreements with third-parties to fully utilize/monetize its datacenter capacity. This kind of business model may become more common, in our view. Companies with more capital/resources on hand may aggressively build own datacenter, while if not fully utilized for internal operations and models, they can in turn rent this capacity out to those who urgently need immediate access of computing power, and enhance the clusters' Model FLOPS Utilization (MFU).
SpaceX entered into Cloud Service Agreements with Anthropic (unlisted) in May 2026. Anthropic is able to access the compute capacity across Colossus and Colossus II, paying USD1.25bn per month through May 2029, with capacity ramping up in May and June 2026 at a reduced fee. SpaceX would retain its ownership and intellectual property rights in its content, AI models, and related data. Through the structure, SpaceX could still reallocate the capacity for its own internal initiatives if needed in the future, according to the prospectus. SpaceX believes that it has sufficient capacity to provide compute for its AI models, and expects to enter into more similar contracts for compute capacity with third parties.
On 5 June 2026, SpaceX announced that it had signed multi-year Cloud Service Agreements with Alphabet, in which Google would pay USD920mn each month starting October 2026 to June 2029 to lock in SpaceX's compute capacity.
MO UI MUI LU<U
100%
90%
80%
70%
60%
50%
40%
30%
20%
10%
0%
— Other
Anthropic is growing strongly and worth tracking
Following ChatGPT's strong breakthrough and Gemini's emergence, Claude is also gaining traction in the market (Fig. 5 - Fig. 6 ). This is also reflected in Anthropic's revenue the run-rate of which surged from USD9bn at the end of 2025 to >USD47bn in May 2026. We also see increasing engagements with a sizable amount of deals between Anthropic and other key players in the AI world. Just as OpenAI's (unlisted) aggressive Stargate announcement, Anthropic in Nov-25 announced a USD50bn investment in American computing infrastructure, building datacenters with Fludistack in Texas and New York. The investment amount shall cover most below computing power purchase agreements, as well as its collaboration with Hut 8 and Fluidstack, in our view.
AWS and Anthropic's relationship can be traced back to 2023-24, when Amazon made USD4bn investments each in 2023 and 2024. Since then, AWS has continued to be Anthropic's major cloud partner. One of AWS's key data center projects, Project Rainier , was the result of this collaboration. Anthropic actively used Project Rainier (featuring 500k Trainium 2 chips) to build and deploy Claude. In Apr-26, it expanded the deal, and Anthropic signed a new agreement with Amazon to secure up to 5GW capacity for training and deploying Claude. In the same agreement, Anthropic is to commit more than USD100bn over the next ten years to AWS technologies, spanning Graviton and Trainium 2/3/4, with the option to purchase future generations when available. Built on the existing USD8bn investments, Amazon is investing USD5bn in Anthropic along with the announcement in Apr-26, up to an additional USD20bn in the future.
Google was also an early investor of Anthropic from 2023 to early 2025. The relationship extended when Anthropic announced it would expand adoption of Google Cloud technologies, including up to 1mn TPUs (over 1GW capacity online in 2026) in Oct-25. In Apr-26, Anthropic announced that it signed a new agreement with Google and Broadcom (AVGO US, Not rated) for multiple gigawatts of next-generation TPU capacity coming online starting in 2027. While not officially announced, Google reportedly will invest up to USD40bn in Anthropic, and Anthropic is committed to spending USD200bn with Google Cloud over five years.
Note that besides AWS and Google ASICs, Anthropic also bonded relationship with other players on nVidia GPU platforms.
- In Nov-2025, Anthropic, nVidia and Microsoft announced strategic partnerships, when Anthropic committed to up to 1GW nVidia GB/VR systems. nVidia and Microsoft were committed to invest up to USD10bn and USD5bn, respectively, in Anthropic. Although this has not yet been officially confirmed by the companies, news outlets have reported than Microsoft is negotiating with Anthropic to serve its in-house ASICs as well. ·
- Anthropic also utilized compute capacity from SpaceX/xAI's Colossus for Claude (based on nVidia GPUs), as mentioned in above paragraphs. ·
- CoreWeave announced a multi-year agreement with Anthropic in Apr-26. The collaboration between Anthropic and CoreWeave will initially focus on a phased infrastructure rollout, with the potential to expand over time. ·
Fig. 5: Gen AI website traffic share
As of Apr 2026
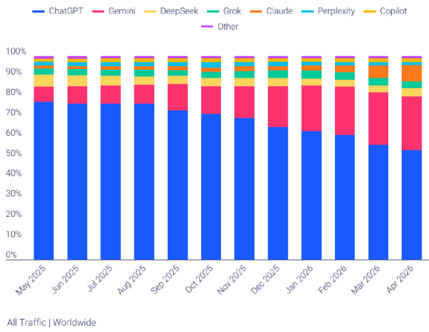
Source: Similarweb, Nomura research
Fig. 6: Gen AI website traffic share Gemini and Claude continued to grow
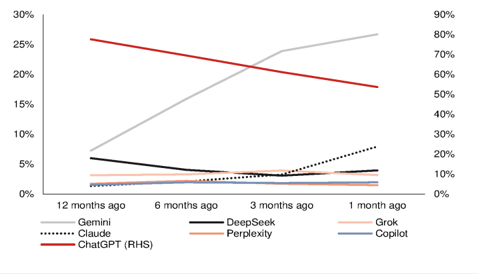
Source: Similarweb, Nomura research
— Perplexity - Copilot
Demll allu vlauue bolltmluel lu gruw
30%
1 month ago
Grok
Copilot
90%
80%
70%
60%
50%
40%
30%
20%
10%
0%
Fig. 7: Major announcements of data center buildouts - AWS
*AWS announced (Mar-2026) to deploy 1mn+ nVidia GPUs starting in 2026
Source: Company data, Nomura research
Fig. 8: Major announcements of data center buildouts - Google
Source: Company data, Nomura research
Fig. 9: Major announcements of data center buildouts - Meta
Source: Company data, Nomura research
Fig. 10: Major announcements of data center build-outs - Microsoft
*MSFT signed letter of Intent with Nscale for up to 1.35GW VR NVL72, deployment beginning in late 2027.
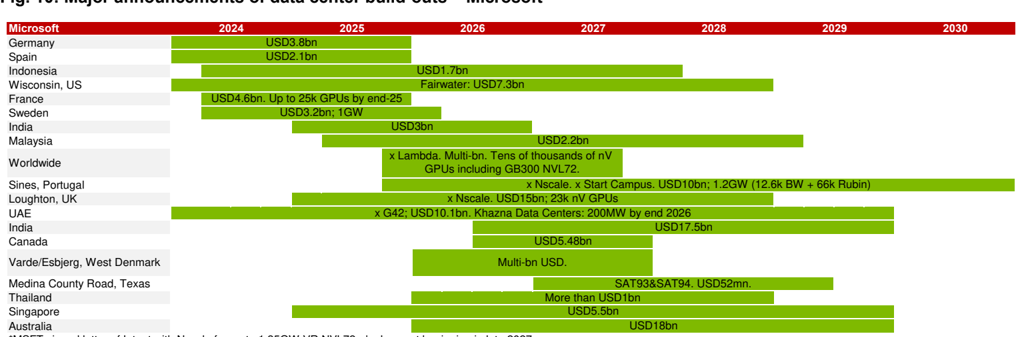
*Crusoe announced to build 900MW datacenter for MSFT in Abilene, Texas on 27 March 2026. The first building expected to be energized in mid-2027.
Source: Company data, Nomura research
Fig. 11: Major announcements of data center build-outs - HUMAIN
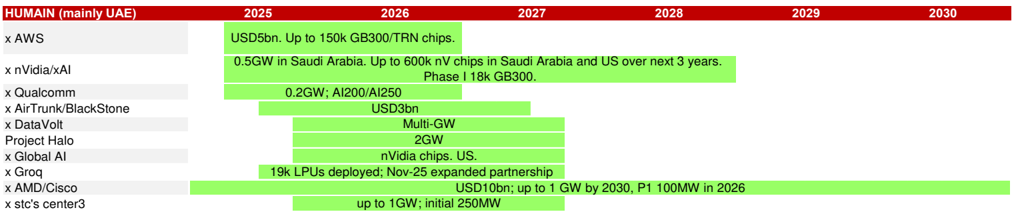
Source: Company data, Nomura research
Fig. 12: Major announcements of data center buildouts - CoreWeave

Source: Company data, Nomura research
Fig. 13: Major announcements of data center buildouts - Oracle
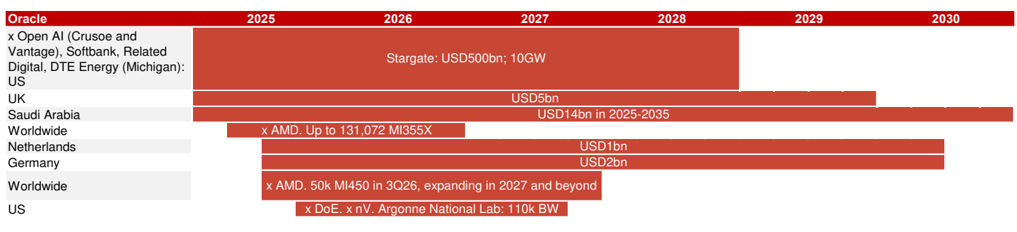
Source: Company data, Nomura research
Fig. 14: Major announcements of data center build-outs - OpenAI
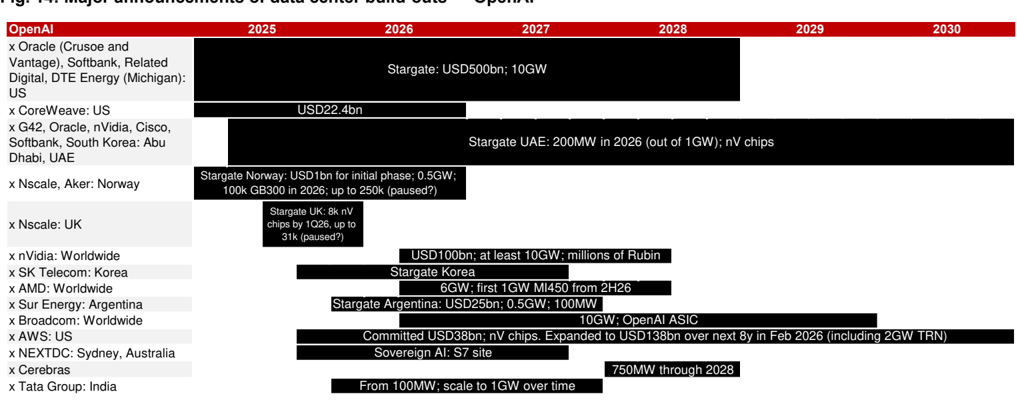
Source: Company data, Nomura research
Fig. 15: Major announcements of data center build-outs - Nscale
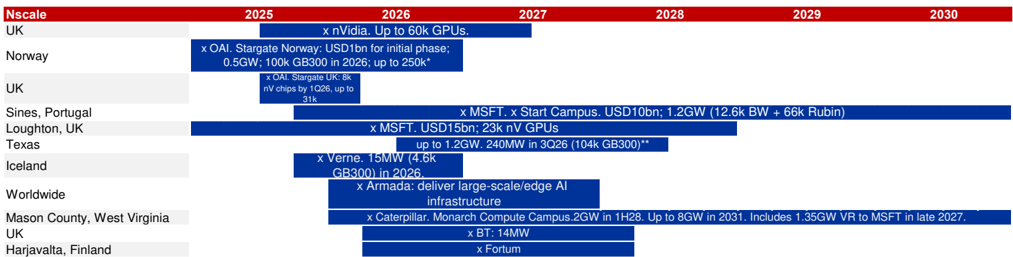
Source: Company data, Nomura research
Fig. 16: Major announcements of data center build-outs - Nebius
Source: Company data, Nomura research

Source: Company data, Nomura research
unparlorol
(kpcs)
600
500
400
300
200
100
0
(kpcs)
2,000
TSMC turning aggressive on 2027F CoW capacity, but WoS will become bottleneck, in our view
TSMC has turned aggressive in responding to surging demand and to defend against (future) competition
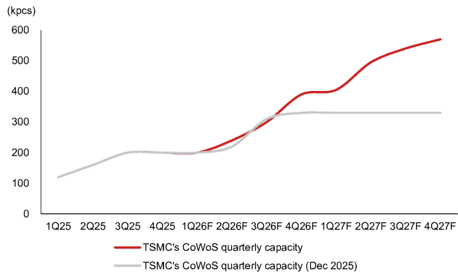
In our last update in December , we flagged TSMC's intention to dial up its CoWoS capacity build-out in 2026F by expediting equipment delivery, in response to nVidia's request (although ~60% of TSMC's CoWoS capacity has already been booked by nVidia) and ASIC customers' (led by Broadcom) eagerness to secure more capacity support. Despite this, we believe TSMC would still keep a disciplined stance on its CoWoS capacity additions and will not overreact to customers' 'potentially inflated' demand forecasts, and likewise for TSMC's fabrication capacity despite a likely 3nm demand surge in 2026F due to a somewhat 'synchronized' large-die AI chip migration cadence (e.g., nVidia's Rubin, Google's TPU v8t/v8i and AWS' Trainium 3).
To date, TSMC's supply is apparently still constrained across the front-end and the back-end given the demand strength from AI, and the company has expressed its commitment to expand its capacity in due course, citing that it 'works very hard to meet all the demand ' and 'doesn't leave any business on the table ' (see remarks from 4Q25 and 1Q26 results ). Interestingly, TSMC's management has decided to step up capex investment to increase its 3nm capacity - in contrast to its old plan, in which TSMC did not add new capacity to a node once it reached the target capacity (about 130-150kwpm, in our view) - with additions in Taiwan, Japan, and the US. TSMC has laid out its plan to drive N5/N3 combined capacity growth (a 25% CAGR over 202227E) with equipment commonality and technology integrations (see our takeaways from the Technology Symposium ).
Our latest supply chain survey suggests TSMC will likely expand its CoWoS capacity to 1,100kpcs in 2026F (or c.130kwpm by the end of 2026F) vs our previous assumption of 1,0501,100kpcs (or c.110kwpm by year-end), increasing this to 2,000kpcs in 2027F vs our previous assumption of 1,300-1,350kpcs. Although TSMC has turned more aggressive in its CoWoS plan (more precisely, its 'CoW' plan), our contrarian view is that 'WoS' (not controlled by TSMC) and many small components would very likely become a bigger bottleneck than 'CoW' (controlled by TSMC) in 2027F. We only model 1,800kpcs of CoWoS output in 2027F (despite our assumption of a TSMC target of 2,000kpcs).
At the front end, we model TSMC to form 160kwpm 3nm capacity by end-2026F (from 130kwpm by end-2025, mostly driven by cross-node conversion) and 175kwpm by end-2027F. We expect 225kwpm of 3nm capacity by end-2028F, with the fabs in Arizona and Kumamoto joining the production lineup. All told, we reason the magnitude of capacity builds remains prudent, judged by not only the 'demand forecasts' of AI chip customers (which occasionally could be misleading against the backdrop of shortage), but more importantly by new data center build trackers (elaborated on in the 'Global new data center build tracking ' section of this report, which we view as a leading indicator beyond Asia supply chain data points). Also see the below section, 'When the elephants fight, the grass gets trampled for our refreshed view on TSMC's AI revenue, CoWoS allocation assumptions and competitive landscape observations in terms of AI chips.
Fig. 18: TSMC turning more aggressive on CoW capacity expansion
Source: Company data, Nomura estimates
Fig. 19: But the output will be constrained by "WoS"
Source: Company data, Nomura estimates
2027F
TSMC's CoWoS output
Fig. 20: TSMC's front-end fab capacity planning
| HVM timeline | Module/Process | 2020 2021 | 2022 2023 | 2024 | 2025 2026 | 2027 | 2028 | 2030 | 2031 | ||||
|---|---|---|---|---|---|---|---|---|---|---|---|---|---|
| Fab 18 | P1 | Tainan (N5) | |||||||||||
| P2 (N5) | |||||||||||||
| P3 (N5) | |||||||||||||
| P4 (N5) | |||||||||||||
| P5 (N3) | |||||||||||||
| P6 (N3) | |||||||||||||
| P7 (N3) | |||||||||||||
| P8 (N3) | |||||||||||||
| P9 (N3) | |||||||||||||
| Hsinchu | Fab 20 | P1 (N2) | |||||||||||
| Hsinchu | P2 (N2) | ||||||||||||
| Hsinchu | P3 (A14) | ||||||||||||
| Hsinchu | P4 (A14) | ||||||||||||
| Kaohsiung | Fab 22 | P1 (N2) | |||||||||||
| Kaohsiung | P2 (N2) | ||||||||||||
| Kaohsiung | P3 (A16) | ||||||||||||
| Kaohsiung | P4 (?) | ||||||||||||
| Kaohsiung | P5 (?) | ||||||||||||
| Taichung | Fab 25 | P1 (A14) | |||||||||||
| Taichung | P2 (?) | ||||||||||||
| Taichung | P3 (?) | ||||||||||||
| Taichung | P4 (?) | ||||||||||||
| TSMC Nanjing | Fab 16 | P1 (N16/12) | |||||||||||
| TSMC Nanjing | P2 (N28) | ||||||||||||
| TSMC Arizona | Fab 21 | P1 (N4) | |||||||||||
| TSMC Arizona | P2 (N3) | ||||||||||||
| TSMC Arizona | P3 (N2) | ||||||||||||
| TSMC Arizona | P4 (?) | ||||||||||||
| TSMC Arizona | P5 (?) | ||||||||||||
| TSMC Arizona | P6 (?) | ||||||||||||
| JASM | Fab 23 | P1 (N40/N28/N12) | |||||||||||
| JASM | P2 (N3) | ||||||||||||
| ESMC | Fab 24 | P1 (N28/N12) | |||||||||||
| # of fab modules in operation | # of fab modules in operation | Net addition(s) (domestic) | 3 | 5 1 | 6 1 | 8 2 | 10 2 | 12 2 | 14 2 | 19 5 | 20 1 | 21 1 | 22 1 |
| # of fab modules in operation (overseas) | # of fab modules in operation (overseas) | # of fab modules in operation (overseas) | 1 | 1 | 2 | 4 | 4 | 4 | 5 | 6 | 8 | 9 | 9 |
| Net addition(s) | 0 | 1 | 2 | 0 | 0 | 1 | 1 | 2 | 1 | 0 |
Source: Company data, Nomura estimates
How will TSMC's CoWoS capacity shape up through 2029F?
While we have no clear bottom-up estimates about how TSMC is going to expand its CoWoS capacity beyond 2027F, we try to triangulate a possible trajectory based on TSMC's AI semi growth guidance and our assumptions of manufacturing content added. See Fig. 21 for our simulation.
TSMC guided its AI accelerator revenue would grow to a high-50% CAGR over 2024-29E, implying USD115bn of revenue from AI by 2029E. Additionally, we generalize from our proprietary TSMC AI logic semi model, which analyzes major AI accelerator revenue contributions, that roughly 30-35% of its manufacturing content comes from advanced packaging. For simplicity, we assume all the advanced packaging revenue to TSMC comes from CoWoS (e.g., ignoring SoIC, which is an accretion to back-end content). Altogether, TSMC's guidance might hint to form 2,500-3,500kpcs in annual CoWoS capacity by 2029F, vs 680kpcs in 2025, and this would suggest a 40-50% capacity CAGR over 2025-29F compared to a >80% CAGR planned for 2022-27E (report ).
Fig. 21: A simulation of TSMC's long-term CoWoS capacity planning
| USD mn | 2023 | 2024 | 2025 | 2026F | 2027F | 2028F | 2029F |
|---|---|---|---|---|---|---|---|
| TSMC's revenue | 69,298 | 90,083 | 122,424 | 274,911 | |||
| Revenue from AI | 3,921 | 11,692 | 22,131 | 115,126 | |||
| AI revenue% | 6% | 13% | 18% | 42% | |||
| Content breakdown assumption | |||||||
| Fabrication | 70% | 70% | 70% | 70% | |||
| Packaging | 30% | 30% | 30% | 30% | |||
| Imputed AI packaging revenue | 1,176 | 3,508 | 6,639 | 34,538 | |||
| Assumed CoWoS price/wafer | 10,000 | 10,000 | 10,000 | 11,000 | 12,100 | 12,100 | 12,100 |
| Imputed CoWoS output (kpcs) | 118 | 351 | 664 | 2,854 |
Source: Company data, Nomura estimates
A question stemming from the above-mentioned long-run analysis is how TSMC would build its CoWoS capacity in view of an ultimate transition to CoPoS. While, again, we do not have any clear bottom-up estimates since the CoPoS platform remains in the R&D stage at this moment, we have attempted some 'napkin math' about the capacity formation trade-off. TSMC's current AI revenue guidance with our assumed 30-35% content from back-end in 2029E should imply c.USD35bn from AI chip advanced packaging, and nVidia alone could consume ~1,400kpcs of CoWoS capacity if it keeps on securing ~50% of the supply.
- If we tentatively assume the Feynman GPU has an interposer sizing up to 6x reticle (vs Rubin's ~5x reticle) and all the capacity taken by nVidia in 2029E is directed for Feynman production, then the total Feynman output would be 11.4mn units. ·
- The 6x reticle size interposer yields about 8 units on a round 300mm carrier. If the same interposer is produced on a square 300mm panel carrier, each carrier could output about 15 units. We note that AMD believes interposers at >8x reticle size are moving toward panel level packaging for better economics (report ); our 'napkin math' shows that for an 8x reticle size interposer, a round 300mm carrier outputs 5-6 units vs 9-10 units on a square 300mm panel. ·
- If all the 11.4mn Feynman unit outputs move from CoWoS to CoPoS (310x310mm), we believe TSMC would have to prepare 700-800k panels of CoPoS annual capacity instead of c.1,400kpcs of CoWoS for nVidia in 2029E. ·
Although the simulation might be radical, it explains to a certain extent why TSMC has been very prudent with its CoWoS capacity investments that may face a long-run migration to CoPoS, which could result in a huge chunk of spare CoWoS capacity.
Fig. 22: Sensitivity of TSMC's CoWoS capacity planning
| kpcs | Packaging content in AI | Packaging content in AI | Packaging content in AI |
|---|---|---|---|
| 2,854 | 30% | 35% | 40% |
| USD 12,100 | 2,854 | 3,330 | 3,806 |
| 13,100 | 2,636 | 3,076 | 3,515 |
| 14,100 | 2,449 | 2,858 | 3,266 |
| 15,100 | 2,287 | 2,668 | 3,050 |
| 16,100 | 2,145 | 2,503 | 2,860 |
| 17,100 | 2,020 | 2,356 | 2,693 |
Source: Company data, Nomura estimates
When the elephants fight, the grass gets trampled
nVidia and Google are the elephants in AI Semi
AI semi forecast refresh: nVidia and Google will compete for resources at TSMC in 2026-27F, at the cost of other AI chips, in our view
We review our AI logic semi revenue model (from the perspective of TSMC) and key assumptions to assess the demand trajectory for nVidia and ASIC following upward capacity assumption revisions (see TSMC turning aggressive on 2027F CoW capacity, but WoS will become bottleneck, in our view ).
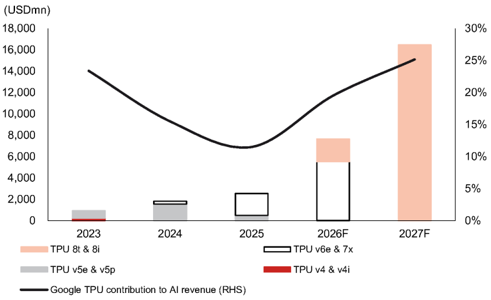
We are raising our 2026F AI semi forecast to 77% y-y growth (from 69% previously) and model 2027F growth of 67% (vs +24% y-y previously), compared to TSMC's AI revenue CAGR guidance of 'toward high-50% CAGR from 2024-29'. See Fig. 35 for a complete summary of our analysis. We estimate AI to make up mid-20% of TSMC's revenue in 2026F (from a high-teens percentage in 2025), further jumping to >30% in 2027F, with nVidia remaining the largest AI revenue contributor at 60%/53% in 2026F/27F (was 56%/51%), followed by Google's 20%/25% (previously 18%/17%). As nVidia and Google together already account for c.80% of TSMC's AI revenue (vs 70-75% a few years ago), the competition between nVidia and Google to secure capacity at TSMC (and possibly elsewhere in the Asia AI supply chain) could come at the cost of other AI chips.
Fig. 23: Hyperscalers' custom silicon roadmap
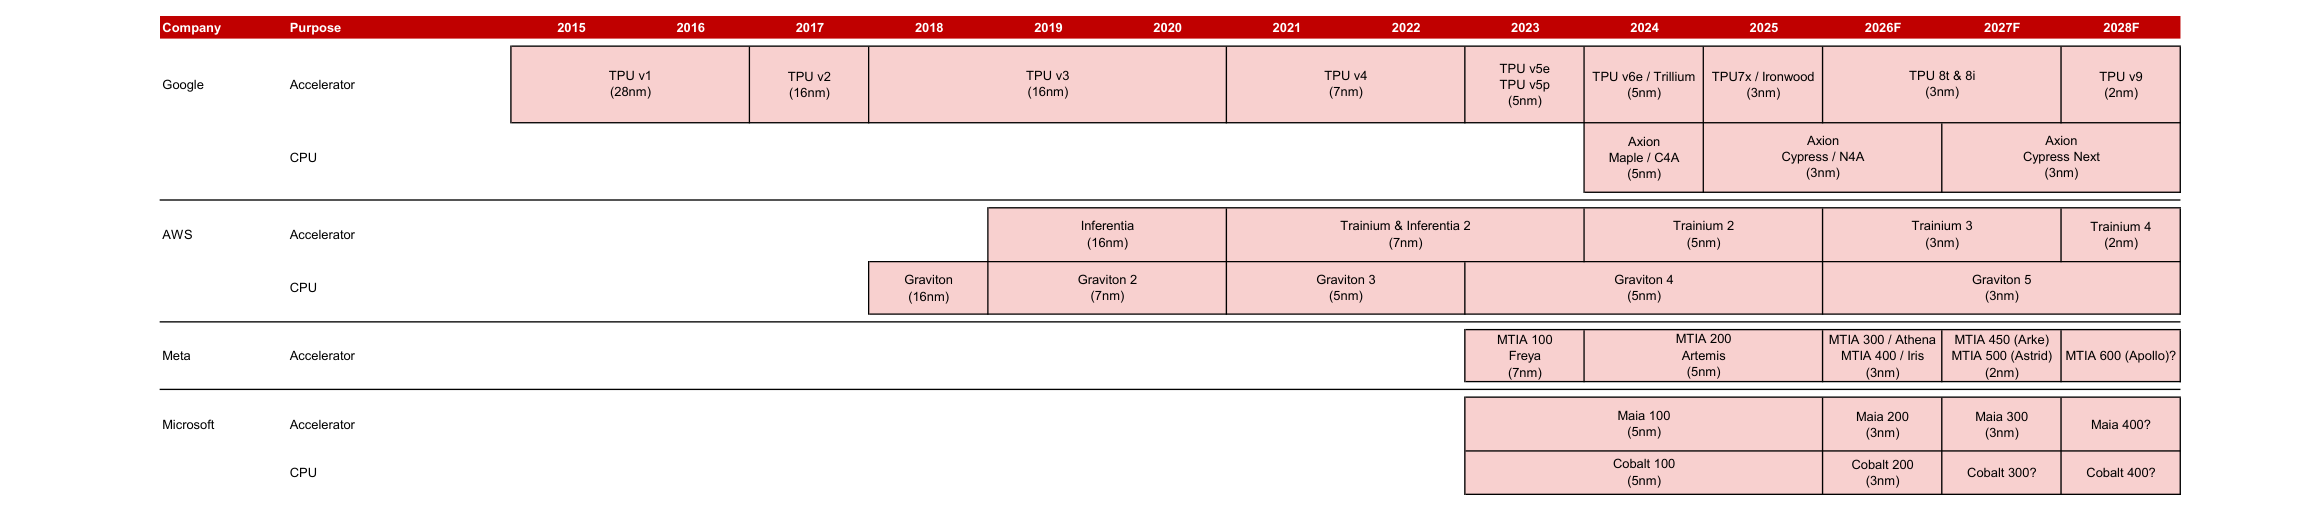
Source: Company data, Nomura estimates
In our December 2025 projection , we expected TSMC to allocate c.60% of its CoWoS capacity to nVidia in 2026F because of the intention to retain 'strategic resource' to crowd out ASIC supply, and the production mix would shift toward more Blackwell than Rubin. We expected TSMC to allocate more CoWoS capacity to Google TPU (primarily via its design service partner Broadcom) to support the product ramp-up in 1H26F (Ironwood/TPU7x). We then also observed increasing traction in AMD's AI GPUs in the supply chain, after the October 2025 announcement of the strategic partnership between OpenAI and AMD (press release ).
With changes in TSMC's capacity expansion scale and its initial planning for 2027F capacity allocation around the corner, we offer a preview of how TSMC's 2027F AI production mix could shape up, as well as elaborate on our observations about TSMC's major AI customers below nVidia should remain as aggressive, and we suppose Google could be more proactive in securing supply.
- nVidia: We do not expect much change to nVidia's CoWoS capacity bookings at TSMC in 2026F (c.60% of capacity share), but see incrementally lower units of Rubin production, with overall output mix skewing a bit more toward Blackwell. We do not expect Rubin GPU production to ramp up significantly until 4Q26F, which implies that actual rack shipments in mass volume could be even later, and one of the bottlenecks is the HBM4 schedule (report ). Another notable change is the design of Rubin Ultra (slated for production in 2027E, according to nVidia), the floorplan of which could scale down to Rubin-like (2 GPU dies per package) vs prior expectation of two Rubin modules connected on a substrate (CoWoS-L + MCM; four GPU dies per package, see our report about a compromised architecture given unreadiness of CoPoS). Such a change is validated by nVidia's demo of the Kyber compute blade, which accommodates four GPUs (Fig. 62 ) vs the showcase of two GPUs per blade last ·
(kpcs)
2,000
1,500
1,000
500
0
100%
80%
year, implying a smaller package footprint. We assume nVidia to take c.55% CoWoS capacity allocation at TSMC in 2027F, and the AI GPU builds will be completely made of Rubin and Rubin Ultra. We therefore estimate TSMC will generate 60%/53% of its AI revenue from nVidia in 2026F/2027F, recording +68%/+47% growth.
- Google TPU: We continue to expect revenue contribution upside for TSMC from TPU and raise our unit build assumption for TSMC in 2026-27F. We expect 2026F revenue/chip volume upside to come from TPU7x (codenamed Hammer) and TPU v8t (codenamed Mad Dog) vs our December projection, despite lower revenue/volume from TPU v8i (codenamed Hell Cat) because of a slower-thanexpected ramp-up. We believe MediaTek (the ASIC design partner of TPU v8t) will benefit from more aggressive TPU capacity bookings by Google in 2026-27F, while the dynamics in 2028F remain a mystery to us, subject to the execution of Google and Intel's EMIB-T. On the back of more aggressive procurement by Google in 2027F, we estimate Google's TPU contribution to TSMC's AI revenue will grow by 200% (we previously forecasted +120% y-y) in 2026F and +116% in 2027F, and the output by TSMC could translate into 4.2mn/8.3mn TPU builds by Google in 2026F/27F. · · Meta
2025
- AMD: We refresh our underlying spec assumptions for MI455X after AMD demonstrated the chip during CES 2026, featuring an even larger footprint (measured at ~5.5x reticle size CoWoS-L by our estimates) than we had previously thought, with compute chiplets built on TSMC 2nm. We have noticed more positive feedback by ODMs' clients on AMD's MI350/375 systems, and increasing ODM/component supplier interest after the partnership between OpenAI and AMD was announced in late 2025, but the CoWoS ordering momentum by AMD in 2026F turns out a bit softer than we had expected in December 2025. As the Asia AI supply chain is already busy preparing for nVidia Rubin and Google TPU, we observe that AMD might appear to be a lower priority and thus, AMD has fine-tuned its upstream demand forecasts in 2026F. That being said, our supply chain checks indicate AMD remains aggressive with 2027F planning, and could seek more CoWoS allocation at TSMC into 2027F. We project AMD's AI GPUs to contribute 9%/10% of TSMC's AI revenue in 2026F/27F. ·
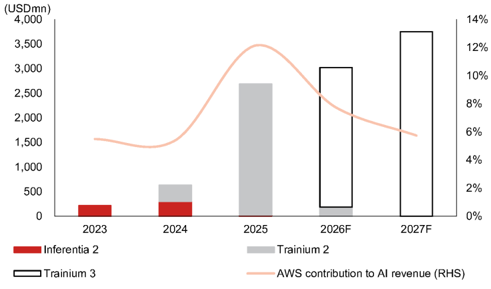
- AWS Trainium: Compared to our AI logic semi model in December, AWS Trainium appears to be another victim in the supply chain suffering from the competition for strategic resources between nVidia and Google. We lower CoWoS capacity allocation assumptions of AWS Trainium in 2026-27F, and estimate AWS's Trainium contribution to TSMC's AI revenue pool to grow 13%/24% in 2026F/2027F (was 56%/14%). ·
Fig. 24: TSMC's CoWoS output breakdown
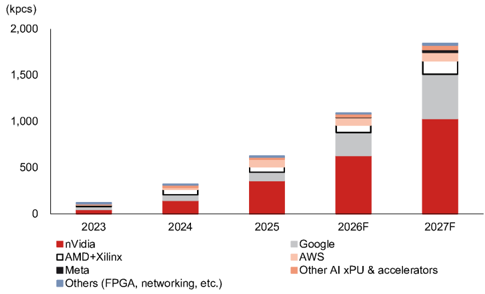
Source: Company data, Nomura estimates
Fig. 25: TSMC's CoWoS output allocation
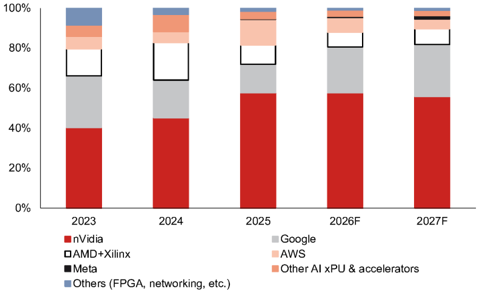
Source: Company data, Nomura estimates
AWS
Other Al XPU & accelerators
2026F
2027F
8,000
35,000
7,000
30,000
60,000
6,000
50,000
5,000
25,000
20,000
40,000
4,000
3,000
30,000
15,000
20,000
10,000
5,000
2,000
1,000
10,000
0
0
0
Rubin & Rubin Ultra
Hopper
Fig. 26: TSMC's AI revenue breakdown
| MI200
→ MI350/355
35%
70%
16%
60%
30%
14%
12%
25%
10%
20%
100%
(USDmn)
(USDmn)
18,000
4,000
3,500
80%
16,000
14,000
3,000
60%
12,000
2,500
10,000
2,000
40%
8,000
6,000
1,500
1,000
20%
500
4,000
2,000
0
0%
0
TPU 8t & 8i
• Inferentia 2
TPU v5e & v5p
— Google TPU contribution to Al revenue (RHS)
12%
Fig. 27: TSMC AI revenue mix by customer
25%
10%
8%
20%
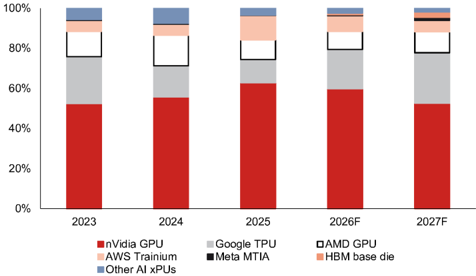
→ Trainium 3
Source: Company data, Nomura estimates
Fig. 29: Google TPU's contribution to TSMC's AI revenue
Source: Company data, Nomura estimates
Fig. 31: AWS' contribution to TSMC's AI revenue
Source: Company data, Nomura estimates
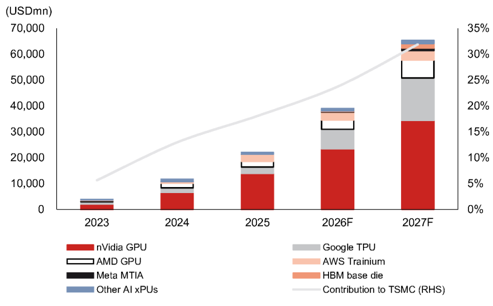
Source: Company data, Nomura estimates
Fig. 28: nVidia's contribution to TSMC's AI revenue
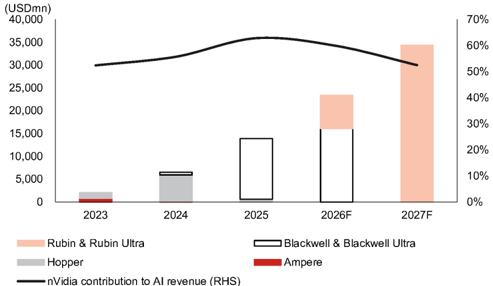
Source: Company data, Nomura estimates
Fig. 30: AMD's contribution to TSMC's AI revenue
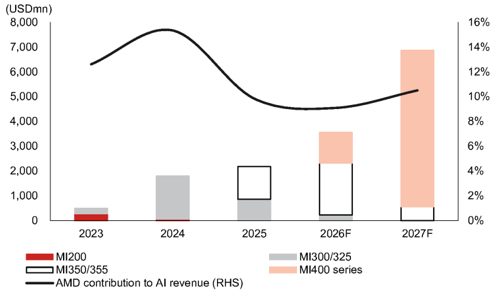
Source: Company data, Nomura estimates
novellee
Platform
Codename
Year of introduction
1,200
1,000
GPU layout
800
600
Logic fabrication
Transistors (bn)
400
Assembly
200
Interposer size
(1x reticle~830mm*)
FP8 Tensor core performance (dense)
MTIA 300
HBM specs
Max HBM capacity
DRAM layer technology
HBM I/Os
Substrate dimension (mm*)
Chip max TOP
Board level
ARM-based CPU
Superchip max TDP
LPU
DPU
NIC (max bandwidth)
Optical module
Socket usage
PCB/CCL
Rack level
Form factor
FP8 Tensor core performance (dense)
GPU-GPU NVLink
(max bandwidth)
Cable connector
Rack-Rack Infiniband
(max bandwiath/port)
Rack-Rack Ethernet
(max bandwidth/port)
ower requiremen without redundancy
Mainstream thermal solutions
10%
(USDmn)
2,000
1,500
1,000
500
Rubin Ultra
2027F
Rubin
2026F
Feynman
Feynman
2028F
Fig. 33: HBM base die contribution to TSMC's AI revenue
25 PFLOPS (inference)
17.5 PFLOPS (training)
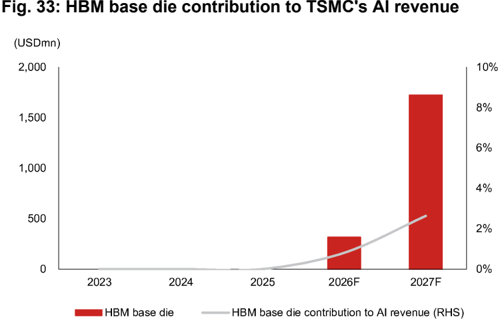
Source: Company data, Nomura estimates
BlueFieid-4
CX9 (1.6Tbps)
3.2Tbps
N.A.
Blackwell
Blackwel
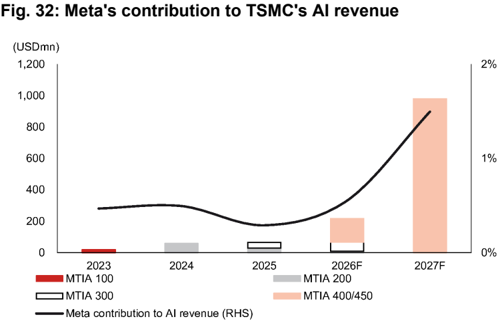
1.000W (GH200)
Source: Company data, Nomura estimates
BlueField-3
CX6 (200Gbps)
CX7 (400Gbps)
BlueFleid-3
CX7 (400Gbps)
2,700W (GB200)
CX7 (400Gbps)
3,100W (GB300)?
CX8 (800Gbps)
Fig. 34: Our take on the nVidia AI platform roadmap
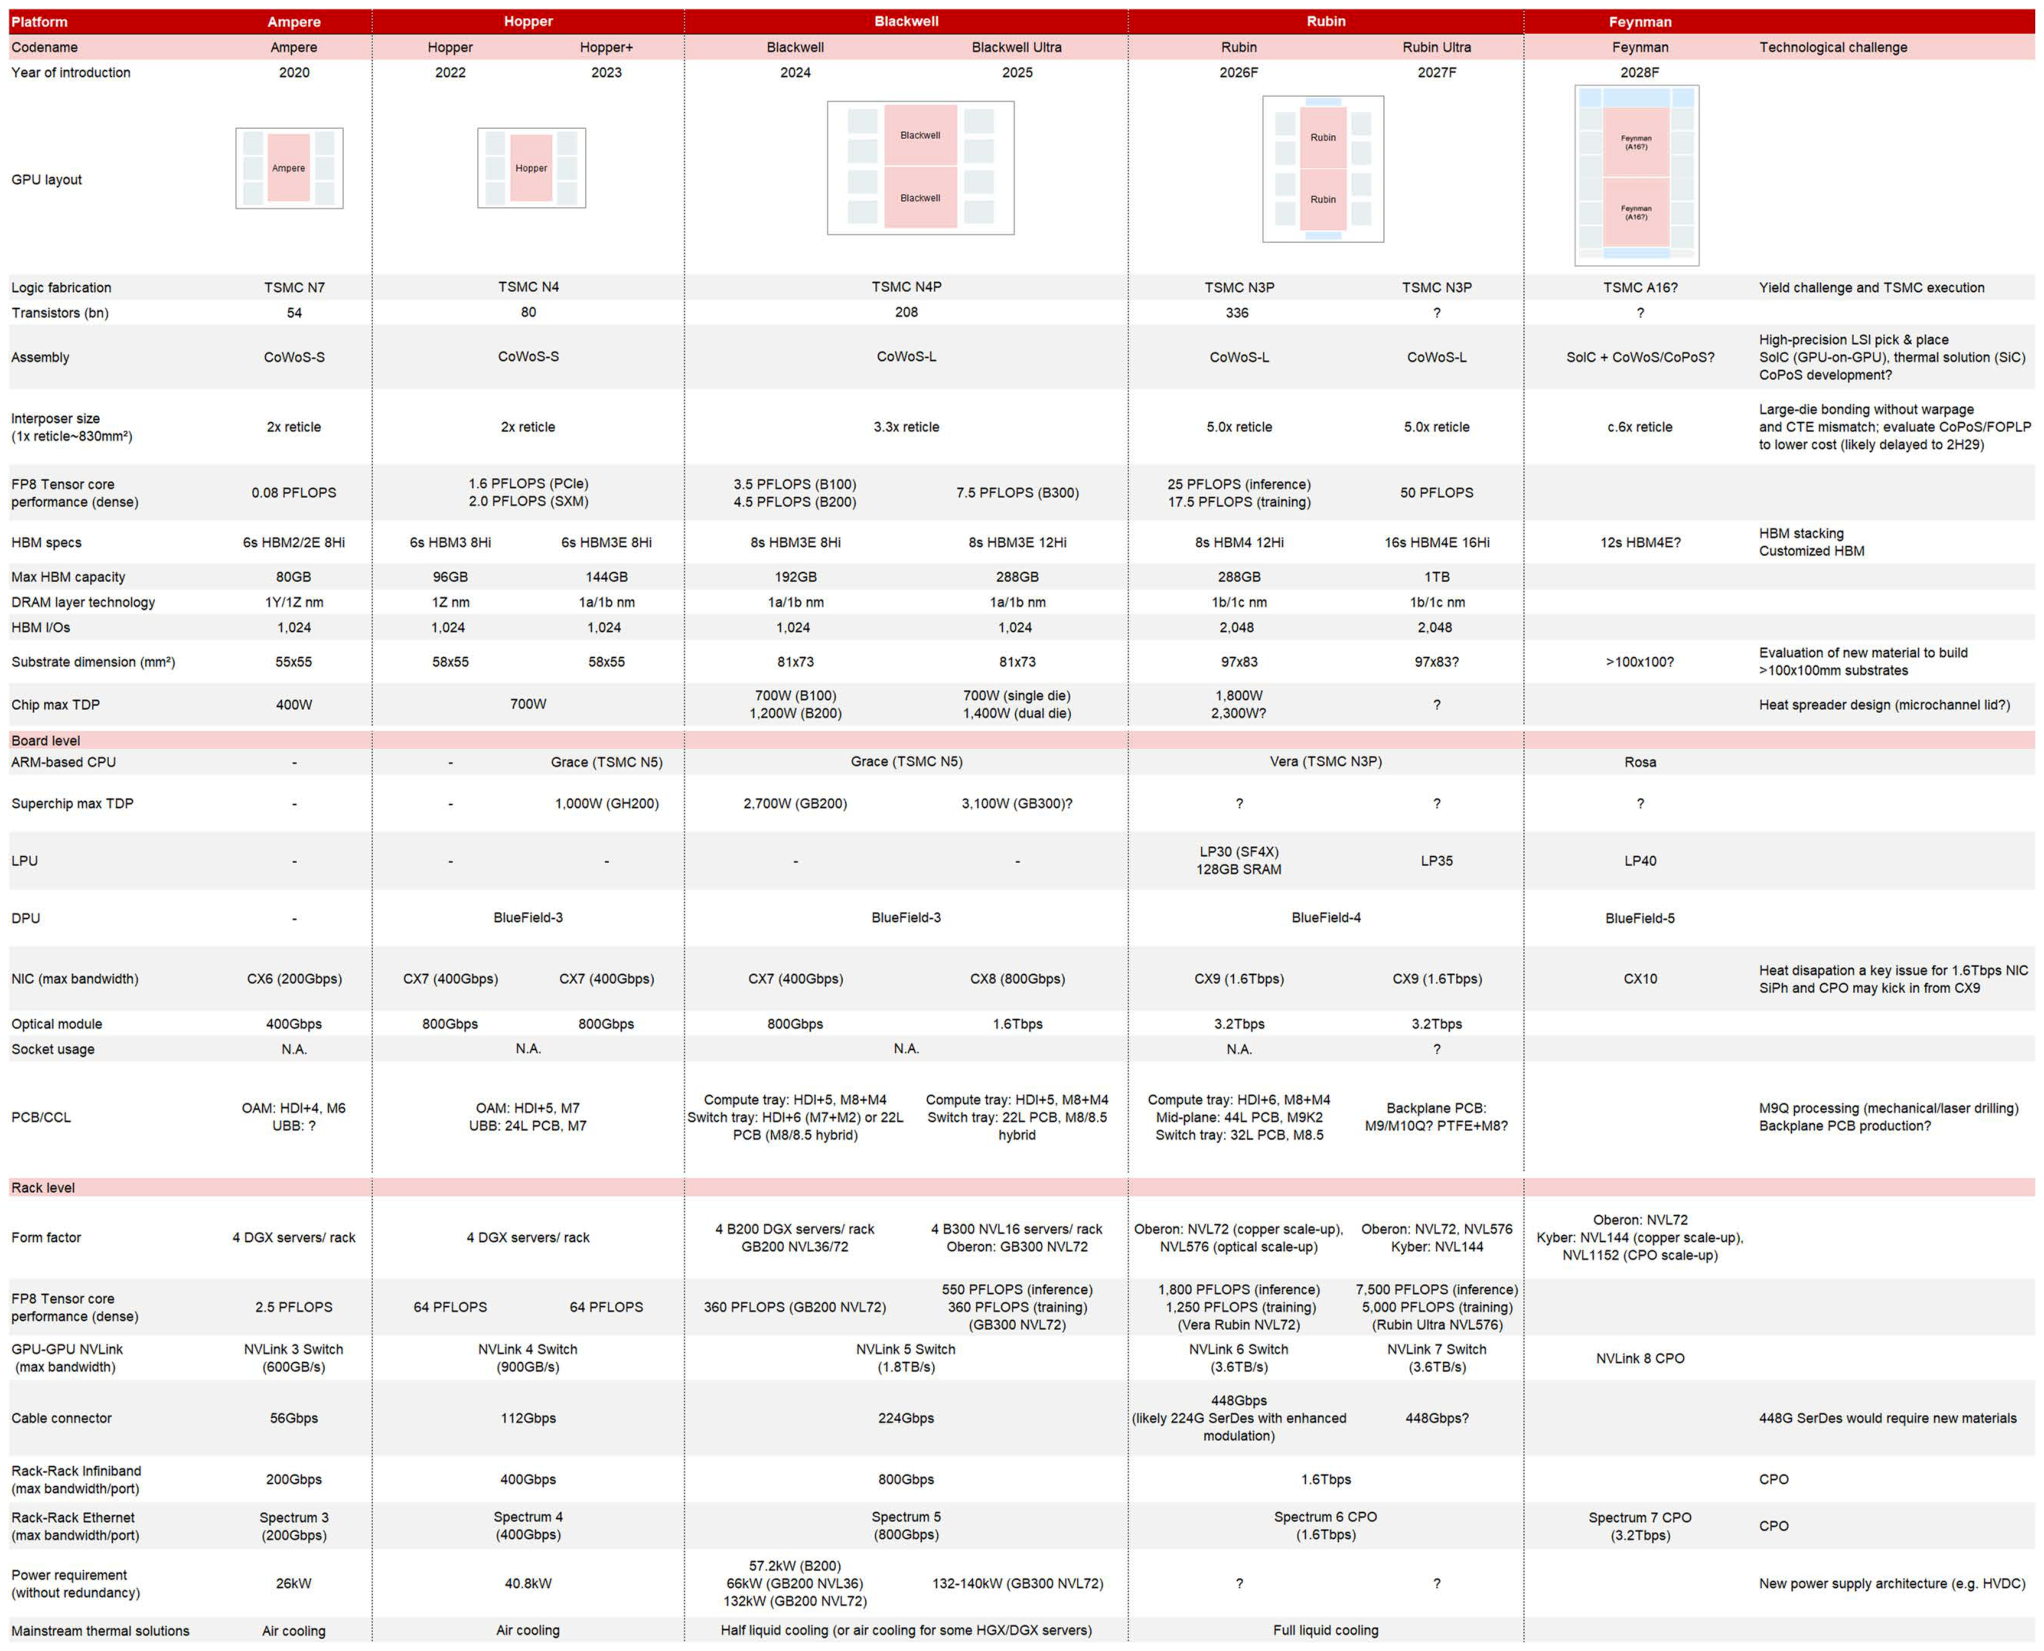
| DAM: HDI+4, Me JBB: * | OAM: HDI+5, M7 UBB: 24L PCB, M7 | Compute tray: HDI+5, M8+M4 PCB (M8/8.5 hybrid | Switch tray: HDI+6 (M7+M2) or 22L | Compute tray: HDI+5, M8+M4 Switch tray: 22L PCB, M8/8.5 hybrid Compute tray: HDI+6, M8+M4 Mid-plane: 44L PCB. M9K2 Switch tray: 32L PCB. M8.5 | Backplane PCB: M9/M10Q2 PTFE+M8? | M9Q processing (mechanicallaser drilling Backplane PCB production? | |
|---|---|---|---|---|---|---|---|
| 4 DGX servers/ rack | 4 DGX servers/ rack | 4 B200 DGX servers/ rack GB200 NVL36/72 | 4 B200 DGX servers/ rack GB200 NVL36/72 | 4 B300 NVL 16 servers/ rack Oberon: GB300 NVL72 360 PFLOPS (GB200 NVL72) 550 PFLOPS (inference) 360 PFLOPS (training) NVL576 (optical scale-up) | peron: NVL72 (copper scale-up). Oberon: NVL72, NVL5 yber: NVL1 7,500 PFLOPS (inference Oberon: NVL72 Kyber: NVL144 (copper scale-up). NVL. 1152 (CPO scale-up) | peron: NVL72 (copper scale-up). Oberon: NVL72, NVL5 yber: NVL1 7,500 PFLOPS (inference Oberon: NVL72 Kyber: NVL144 (copper scale-up). NVL. 1152 (CPO scale-up) | |
| 2.5 PFLOPS /Link 3 Switc 600GB/- | 64 PFLOPS 64 PFLOPS VLink 4 Switc 900GB/s | Link 5 Switc | 1.8TB/s | (GB300 NVL72) 1,250 PFLOPS (training) (Vera Rubin NVL72) NVLink 6 Switc (3.6TB/s | 5,000 PFLOPS (training (Rubin Ultra NVL576) VVLink 7 Switc 3.6TB/s | NVLink 8 CPO | |
| 56Gbps | 112Gbps | 224Gbps | 448Gbps (likely 224G SerDes with enhanced modulation) | 448Gbps? | 448G SerDes would require new materials | ||
| 200Gbps | 400Gbps | 800Gbps | 1.6Tbps | CPO | |||
| Spectrum 3 (200Gbps) | Spectrum 4 (400Gbps) | 57.2KW (B200) | 57.2KW (B200) | (800Gbps) | Spectrum 6 CPO (1.6Tbps) | Spectrum 7 CPO (3.2Tbps) | CPO |
| 26KW | 40.8KW | 66KW (GB200 NVL36) | 132KW (GB200 NVL72) | 132-140KW (GB300 NVL72) ? | ? | New power supply architecture (e.g. HVDC) | |
| Air cooling | Air cooling | Haif liquid cooling (or air cooling for some HGX/DGX servers) | Full liquid cooling |
Source: Company data, Nomura estimates
1.6Tbps
CX9 (1.6Tbps)
3270p.
BlueFieid-5
CX10
2020
2022
Hopper+
2023
Blackwell|
2024
Blackwell Ultra
2%
2025
Rubin
Technological challenge
Ph and CPO may kick in from C)
eat disapation a key issue for 1.6 Tbps N
Fig. 35: TSMC - AI revenue summary
| 2023 | 2024 | 2025 | 2026F | 2027F | |
|---|---|---|---|---|---|
| TSMC AI revenue breakdown (USD mn) | |||||
| nVidia GPU | 2,055 | 6,515 | 13,898 | 23,410 | 34,358 |
| Google TPU | 918 | 1,813 | 2,548 | 7,641 | 16,472 |
| AMD GPU | 494 | 1,793 | 2,175 | 3,554 | 6,867 |
| AWS Trainium | 215 | 631 | 2,687 | 3,025 | 3,751 |
| Meta MTIA | 18 | 58 | 64 | 216 | 979 |
| HBM base die | 0 | 0 | 0 | 314 | 1,722 |
| Other AI xPUs | 220 | 881 | 749 | 954 | 1,255 |
| Total | 3,921 | 11,692 | 22,121 | 39,114 | 65,406 |
| Contribution to TSMC | 6% | 13% | 18% | 24% | 32% |
| TSMC's revenue (USD mn), NMRe | 69,298 | 90,083 | 122,424 | 164,742 | 205,101 |
| AI revenue from nVidia GPU | |||||
| Ampere | 844 | 94 | 0 | 0 | 0 |
| Hopper | 1,211 | 5,840 | 616 | 0 | 0 |
| Blackwell & Blackwell Ultra | 0 | 582 | 13,283 | 16,104 | 0 |
| Rubin & Rubin Ultra | 0 | 0 | 0 | 7,306 | 34,358 |
| nVidia contribution to AI revenue | 52% | 56% | 63% | 60% | 53% |
| AI revenue from Google TPU | |||||
| TPU v4 & v4i | 243 | 0 | 0 | 0 | 0 |
| TPU v5e | 173 | 346 | 0 | 0 | 0 |
| TPU v5p | 502 | 1,204 | 502 | 0 | 0 |
| TPU v6e | 0 | 264 | 369 | 0 | 0 |
| TPU7x | 0 | 0 | 1,677 | 5,535 | 0 |
| TPU 8t | 0 | 0 | 0 | 1,462 | 5,147 |
| TPU 8i | 0 | 0 | 0 | 643 | 11,325 |
| Google contribution to AI revenue | 23% | 16% | 12% | 20% | 25% |
| AI revenue from AMD GPU | |||||
| MI200 | 279 | 70 | 0 | 0 | 0 |
| MI300/325 | 215 | 1,724 | 862 | 229 | 0 |
| MI350/355 | 0 | 0 | 1,313 | 2,097 | 559 |
| MI400 series | 0 | 0 | 0 | 1,229 | 6,308 |
| AMD contribution to AI revenue | 13% | 15% | 10% | 9% | 10% |
| AI revenue from AWS Trainium | |||||
| Inferentia 2 | 215 | 299 | 30 | 0 | 0 |
| Trainium 2 | 0 | 332 | 2,657 | 183 | 0 |
| Trainium 3 | 0 | 0 | 0 | 2,842 | 3,751 |
| AWS contribution to AI revenue | 5% | 5% | 12% | 8% | 6% |
| AI revenue from Meta MTIA | |||||
| MTIA 100 | 18 | 0 | 0 | 0 | 0 |
| MTIA 200 | 0 | 58 | 29 | 10 | 0 |
| MTIA 300 | 0 | 0 | 35 | 58 | 0 |
| MTIA 400/450 | 0 | 0 | 0 | 148 | 979 |
| Meta contribution to AI revenue | 0% | 0% | 0% | 1% | 1% |
Source: Company data, Nomura estimates
OSATs' CoWoS-like full processes could start emerging from 2027F
CPUs are low-hanging fruits to capitalize on
Venice and Vera CPUs are manifestations of OSATs monetizing alternative CoW opportunities
We first wrote about TSMC's prudent approach to CoW capacity expansion in our Asia AI Semi & Server Anchor report in August 2025 , and noted that such planning was critical for OSATs as it had driven most AI chip customers to look for alternative CoW suppliers, thereby benefiting ASE (see our upgrade report ). Amkor is also an alternate CoW partner, and management highlighted over a dozen 2.5D engagements (silicon interposer-based, as per Amkor's definition) and expected high-density fan-out RDL devices (i.e., organic interposer-based) ramping up production in 2026E and bridge-type solution for AMD in 2027E (see Amkor's Investor Day 2026 ). We compare major OSATs' advanced packaging platforms with TSMC's equivalent technologies in Fig. 36 , and observe that many 2.5D/molded interposer based packages in the pipeline of OSATs are for CPUs (Fig. 37 ). In our view, the wider RDL line/space and fewer RDL layers in CPU packages than AI accelerators could possibly relax some technological requirements for OSATs to participate in advanced packaging. Other than technology readiness, we believe another key factor hindering OSATs from engaging in CoW processes is the enormous losses that would be incurred if there were to be immature assembly yield. That, in our view, is the reason why the high-performance computing chips using OSATs' CoW to ramp up volume from 2H26F are mostly CPUs, which do not carry expensive HBM content.
We will discuss CPU architectures in detail in the section 'CPUs: different architectures & surging demand ' and focus on OSATs' advanced packaging capacity planning here. We estimate ASE could form 25kwpm of FOCoS capacity by end-2026F, from 5kwpm installed by end-2025. We believe the major consumption of ASE's FOCoS capacity will go to AMD's Venice CPUs in 2026-27F, which utilize ASE's FOCoS-B platform, and estimate USD350mn/1.4bn of revenue from this project for ASE in 2026F/27F, or 10%/20% of its leading-edge advanced packaging (LEAP) revenue. In our view, another organic interposer based package of significant volumes could be nVidia's Vera CPUs, which are assembled at TSMC (CoWoS-R) and Amkor (S-SWIFT). Our assumption is the TSMC track makes up c.40% of nVidia's Vera backend supply.
Fig. 36: 2.5D advanced packaging solution comparison
| 2.5D chip-last | TSMC | Intel Foundry | Samsung Foundry | ASE | SPIL | Amkor | Powertech |
|---|---|---|---|---|---|---|---|
| Silicon/TSV interposer | CoWoS-S (~3.3x ret.) | Foveros-S (~4x ret.) | I-CubeS H-Cube | 2.5D | 2.5D | 2.5D | 2.5D |
| Fan-out RDL | CoWoS-R (~5.5x ret.) | Foveros-R (production in 2027E) | n.a. | FOCoS | FO-MCM | S-SWIFT | CLIP (PLP) |
| Fan-out bridge (embedded in RDL) | CoWoS-L (>14x ret. by 2029E) | Foveros-B (production in 2027E) | I-CubeE | FOCoS-B | FO-EB | S-Connect | PiFO (PLP) (~9x ret. by 2028E) |
| Fan-out bridge (embedded in IC substrate) | - | EMIB (>12x ret. by 2028E) | - | - | - | - | - |
Source: Company data, Nomura research
Fig. 37: Major CoW projects at OSATs
| Fan-out RDL | Fan-out bridge | |
|---|---|---|
| ASE/SPIL | AMD Medusa? | AMD Venice |
| Amkor | nVidia GB10 nVidia Vera Microsoft Cobalt 200 | AMD Venice? (2027E) |
| Powertech | AMD Medusa? (PLP) | AMD's next gen? (PLP) |
Source: Company data, Nomura research
Fig. 38: Vera CPU packaged on TSMC CoWoS-R
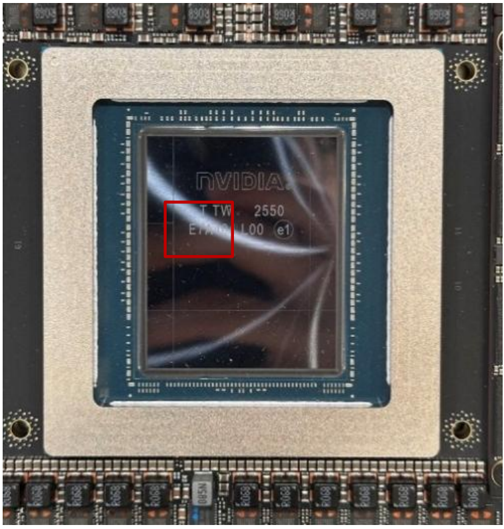
Source: Company data, Nomura research
Fig. 39: Vera CPU packaged at Amkor S-SWIFT
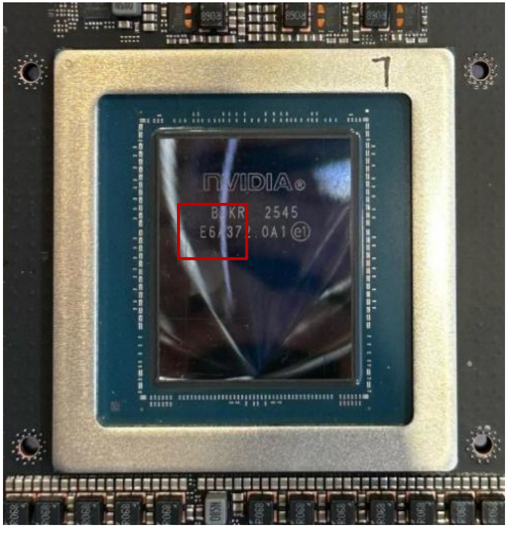
Source: Company data, Nomura research
Die 1
Die 2
Intel's EMIB-T: major competitor to TSMC's advanced packaging
EMIB-T appears worth monitoring with increasing adoption
EMIB-T emerges as a 'must-succeed' alternative packaging solution for AI chips
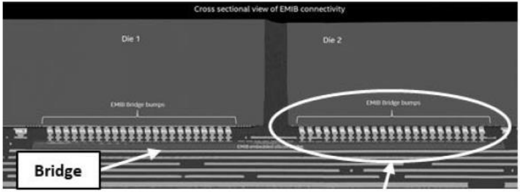
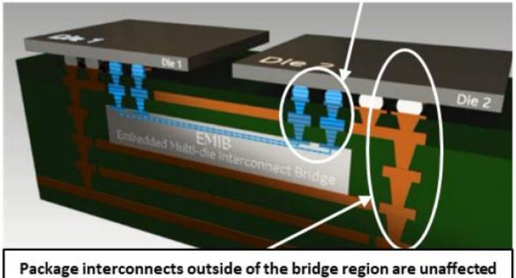
We believe certain AI ASIC customers might have started evaluating Intel's EMIB-T as a logic+HBM integration alternative because of concerns about insufficient capacity support at TSMC. We think Google's potential reliance on Intel's EMIB-T for the next-generation TPU v9 (partnering with MediaTek) could be a critical litmus test for Intel's advanced packaging capabilities. Since 2017, Intel's EMIB has utilized silicon bridges buried in the build-up layers of an IC substrate to connect chiplets on top without any interposer (Fig. 40 ). Previously, in EMIB configuration, the I/O power delivery paths of top dies are cantilevered, and power from the substrate underneath had to traverse on the perimeter of the silicon bridge and across its thin metal layers to reach the microbumps. A longer routing distance, however, could cause intermediate resistance drop (IR drop) or lower actual voltage reaching transistors which adversely affected device functionality and performance. With the most advanced AI chips moving toward HBM4, power integrity becomes a more critical issue since HBM4 doubles the I/O bump density from HBM3E, operates at a higher current and is more sensitive to IR drop.
The new EMIB-T technology aims to incorporate through-silicon vias (TSVs) within the bridge die to create a vertical power delivery network, thereby shortening the routing distance to improve power delivery efficiency and performance (Fig. 41 ). According to Intel, EMIB-T targets HBM4/4E and logic chiplet interconnectivity with the lowest possible cost, and the company's roadmap is to scale to the integration of >8x reticle size total top silicon area on a ~120x120mm substrate by 2026E and >12x reticle size top silicon area on a >120x180mm substrate by 2028E (Fig. 42 ). In addition, the process flow of EMIB-T is not significantly different from the conventional EMIB, except that TSV bridge dies are placed into substrate cavities with a solder joint formation.
In our Greater China Semi Anchor Report , we highlighted Intel's strong commitment to leading substrate partners such as Ibiden (4062 JP, Buy), Unimicron, and Shinko (unlisted) to bring the EMIB-T technology into mass production, and leading substrate companies are expanding their capacities for Intel aggressively through co-investment. Nevertheless, Intel's experience of handling EMIB integration is largely grounded to internal products, with 12-14x silicon bridges in one package at max (Fig. 43 ). Our supply chain feedback indicates that the TPU v9 could have close to 30 silicon bridges buried in the large substrate, with potentially many silicon capacitors embedded as well. We believe the deviation of specs from the current AI/HPC substrate structure could lead to production yield challenges.
Fig. 40: An illustration of EMIB
-4x
Reticle size
EMIB power delivery path
2026
EMIB-T power delivery path
2028 +
Future
Fig. 41: EMIB-T shortens the power delivery routing distance to reduce IR drop
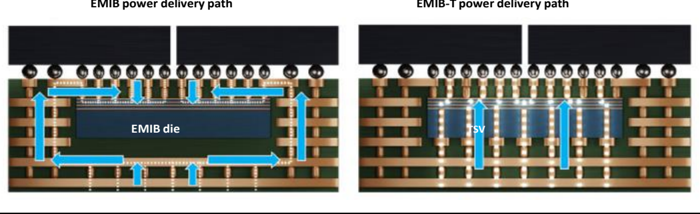
Source: Intel, Nomura research
Fig. 42: Intel's EMIB roadmap
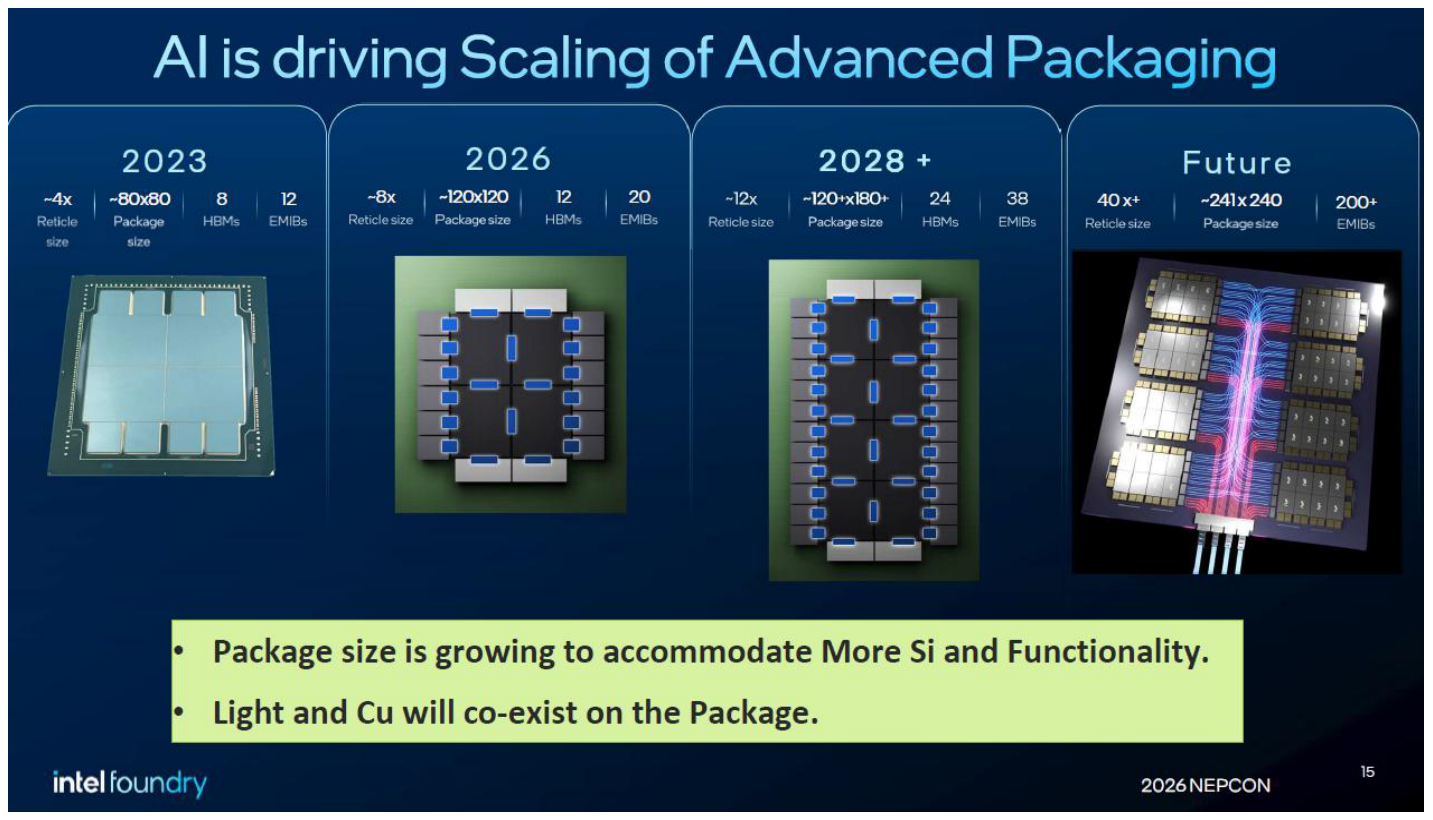
Source: Intel, Nomura research
Fig. 43: Intel's internal products based on EMIB interconnects
| Codename | Product type | Launch time | Remarks |
|---|---|---|---|
| Kaby Lake-G | Client CPU | 2017 | Integrates Intel Kaby Lake CPU, AMD Radeon RX Vega MGPU, and HBM2. |
| Ponte Vecchio Falcon Shores | AI accelerator AI AI | 2023 | Co-EMIB (3.5D); 11 EMIB dies. |
| accelerator | Cancelled | ||
| Jaguar Shores | accelerator | 2026-27E | |
| Sapphire Rapids | Server CPU | 2023 | 10x EMIB dies in SPR XCC. 14x EMIB dies in SPR HBM. |
| Emerald Rapids | Server CPU | 2023 | 3x EMIB dies. |
| Granite Rapids | Server CPU | 2024 | 12x EMIB dies. |
| Sierra Forest | Server CPU | 2024 | |
| Diamond Rapids | Server CPU | 2026E | |
| Clearwater Forest | Server CPU | 2026E | 12x EMIB dies. |
| Coral Rapids | Server CPU | 2028-29E | |
| Stratix 10 | FPGA (Altera) | 2017 | 6x EMIB dies. |
| Agilex | FPGA (Altera) | 2019 | 5x EMIB dies. |
Source: Company data, Nomura estimates
2026 NEPCON
15
Fig. 44: EMIB supply chain
| Process | Companies involved |
|---|---|
| Flip-chip assembly | |
| Bumping | Powertech (6239 TT), Amkor (AMKR US) |
| Die bond | ASMPT (522 HK), K&S (KLIC US) |
| Laser marking | E&R (8027 TT) |
| Plasma cleaning | E&R (8027 TT) |
| EMIB substrate | |
| IC substrate | Ibiden (4062 JP), Unimicron (3037 TT), Shinko (unlisted) |
| ABF film lamination | EPM (7795 TT) |
| Bridge die bond | Toray (3402 JP) |
| Electroplating | ASMPT NEXX (unlisted) |
| Laser via drilling | Mitsubishi (6503 JP) |
| Baking oven | Group Up (6664 TT) |
| Other components | |
| Silicon capacitor | AP Memory (6531 TT), SEMCO (009150 KS) |
| Silicon capacitor foundry | Powerchip (6770 TT), UMC (2303 TT), Winbond (2344 TT) |
Source: Company data, Nomura research
Interposer Size
• CoWos-S has been in production for over 10 years with interposer size up to 3.3-reticle cullergy can poorer
CoWos® Enables Al Compute Scaling
• World's largest 5.5-reticle size CoWoS in production with >98% yield in 2026
TSMC's countering measures: CoPoS and SoIC
A sneak peek into AI semi manufacturing chain in 2028F: it is all about execution 12 HBM3E/4
Admittedly, we do not have a clear picture about how TSMC would allocate its front-end and back-end capacity to AI customers in 2028F since the AI logic semi manufacturing chain dynamics remain fluid into 2028F, and TSMC's 'installed capacity' is not the only bottleneck. Key components and materials supporting TSMC's production turnkey such as IC substrates are also in short supply. Meanwhile, given constrained CoWoS supply at TSMC, Intel Foundry appears to be more aggressive targeting ASIC customers with alternative EMIB-T solutions to address the rather 'low-hanging fruit' compared to frontend wafers. Our view is that SoIC and CoPoS are two equally critical technologies for TSMC to stay ahead of its competition in advanced packaging, and below we provide a few topics worth monitoring. 12xHBM3E/4 2026
Could TSMC bring CoPoS online by 2028F?
TSMC showcased its production roadmap to 14x reticle size CoWoS by 2028E and >14x reticle size CoWoS in 2029E during the Technology Symposium (report ). Our back-ofthe-envelope calculation shows only one or two interposers output per CoWoS wafer when the CoW sizes are up to 14x reticle, making the economics a puzzle to us. Facing the challenge from alternative options like Intel's EMIB-T, we understand TSMC has the incentive to 'work very hard to meet all the demand' and 'not leave any business on the table', but apparently 'CoWoS' is not an economically viable solution at such a large CoW size. As such, we believe TSMC does have the motivation to get CoPoS ready earlier vs our prior projection of mass production in 2029F (report ) if TSMC's AI customers do not compromise their chip design floor plans. The current status of CoPoS is mini-line build-out by mid-2026F, and TSMC's management currently expects a volume ramp-up in two to three years from now. How quick can TSMC complete the development and turn that into high-volume production is noteworthy, in our view.
Fig. 45: TSMC's CoWoS roadmap laid out in 2025 Technology Symposium
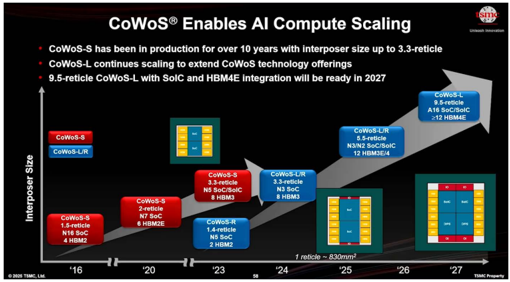
Source: TSMC, Nomura research
Fig. 46: TSMC updates its CoWoS roadmap during the 2026 Technology Symposium
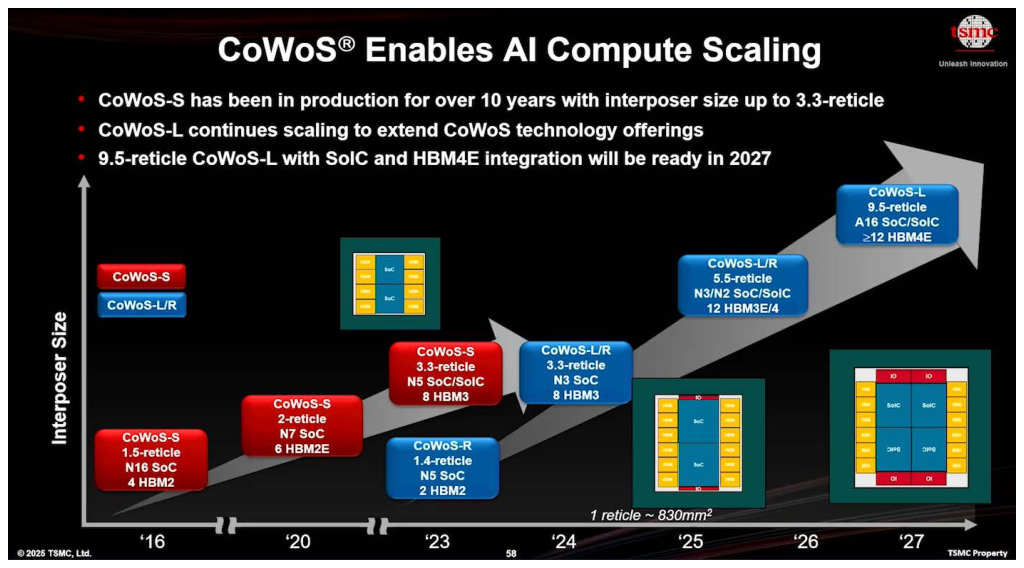
Source: TSMC, Nomura research
9.5-reticle
12xHBM4E
2027
14-reticle
2028
>14-reticle
24xHBMSE
2029
Fig. 47: Taiwan-based FOPLP equipment suppliers
| Process | Equipment | Domestic supplier(s) |
|---|---|---|
| Carrier bond and release | Temporary bonder/debonder | C SUN (2467 TT) Skytech (6937 TT) |
| Seed layer deposition Thin-film deposition | Physical vapor deposition (PVD) Atomic layer deposition (ALD) | UVAT (3580 TT) Lincotec (3644 TT) Skytech (6937 TT) Group Up (6664 TT) |
| RDL patterning | Copper electroplating | UVAT (3580 TT) Lincotec (3644 TT) |
| RDL patterning | Wet etch | GPTC (3131 TT) Scientech (3583 TT) Manz (unlisted) |
| Clean (after etch, photoresist removal and debond) | Wet bench, Single wet | GPTC (3131 TT) Scientech (3583 TT) |
| Die bond | Die sorter, die bonder | GMM (6640 TT) Saultech (6812 TT) |
| Underfill | Underfill dispenser | All Ring (6187 TT) |
| Curing & Devoid | Oven, Pressure curing oven | C SUN (2467 TT) AblePrint (7734 TT) |
| Thermal (TIM, ring, lid) | TIM/Heat sink attach | All Ring (6187 TT) HTA (7751 TT) |
| Automated optical inspection (AOI) | Inspection | GPM (5443 TT) Utechzone (3455 TT) Machvision (3563 TT) HYE (6877 TT) All Ring (6187 TT) HTA (7751 TT) Ta Liang (3167 TT) V5 (7822 TT) CMIt (7853 TT) |
Source: Company data, Nomura research
SoIC/3D stacking to be adopted in Feynman?
We believe the development of SoIC at TSMC is worth tracking and the company is committed to further shrinking bond pitches for logic devices, and is currently targeting N2-on-N2 with a 6um bond pitch to be in production in 2028E, and A14-on-A14 with a 4.5um bond pitch to be in production by 2029E (Fig. 50 ). TSMC has been producing N7on-N7 with a 9um bond pitch since 2023, and stacking with a 6um bond pitch has also been in volume production since 2025. The vertical logic stacking of SoIC theoretically could augment transistor counts per package, an outright indicator of computing power, without extra footprints (vs CoWoS/2.5D packaging that expands horizontally to accommodate more chips).
nVidia at GTC unveiled the plan to adopt 3D stacking starting from the Feynman platform (report ). Currently, AMD leads the adoption of SoIC at TSMC (starting from MI300series), and in the latest MI450, we believe AMD stacks four top dies (four XCD) on two reticle-sized active interposers (I/O dies), in which each top die scales to about 1/3 reticle size (Fig. 48 ). However, we are not sure whether nVidia will be more aggressive in chip specs by stacking a reticle-sized GPU die on top of another for the Feynman platform ( Fig. 49 ). Such a practice theoretically exacerbates thermal dissipation challenges and requires very high hybrid bonding yields. If nVidia and TSMC manage to overcome the design and manufacturing challenges, it might cement nVidia's AI computing performance dominance and possibly trigger an unprecedented AI industry scramble for SoIC capacity allocation at TSMC.
Apart from logic-on-logic stacking, TSMC's Compact Universal Photonic Engine (COUPE) could also serve as a key capacity driver, in our view, and the company is exploring DRAM-on-logic for high bandwidth and low latency for future AI inference decoding applications. TSMC has laid out the plan to grow SoIC capacity at a >90% CAGR over 2022-27E (report ). Our current assumption is that TSMC could install >40kwpm of SoIC capacity by end-2028F, from 5kwpm by end-2025.
Dummy
1/0
• Solc with 3D interconnect offers 56X interconnect density and 5X power-
HBM4
HBM4
10X
HBM4
5X
1/0
HBM4
Interconnect 10 Count
HBM4
Source: TSMC, Nomura research
HBM4
Dummy
1/0
HBM4E
HBM4E
IIMIALA
HBM4E
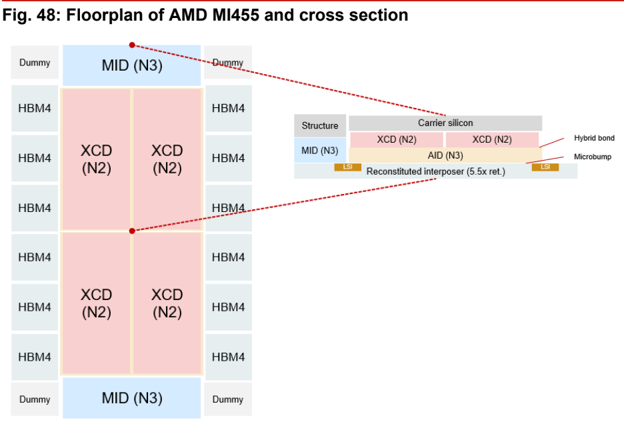
Source: Company data, Nomura research
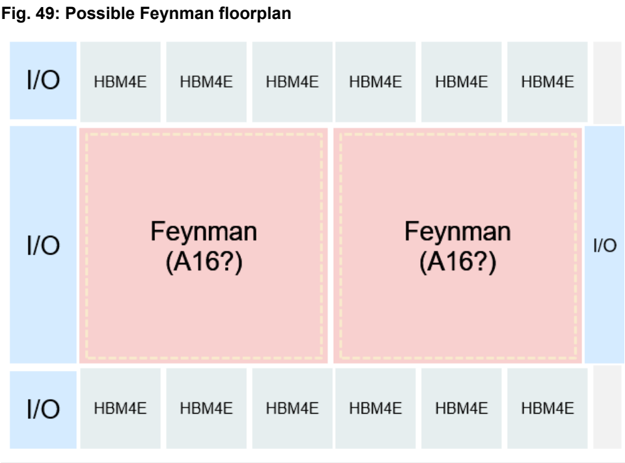
Source: Company data, Nomura estimates
Fig. 50: TSMC's latest SoIC roadmap
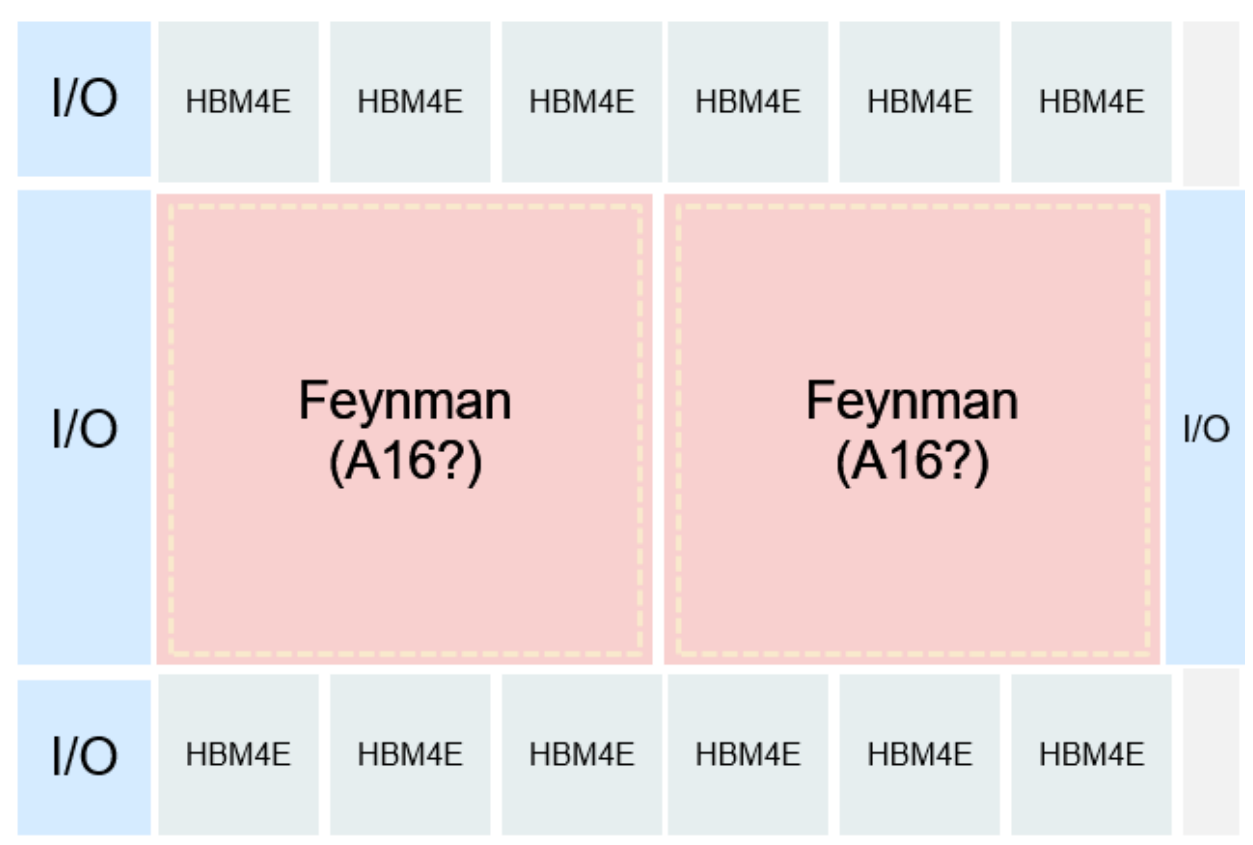
Source: TSMC, Nomura research
HBM4E
HBM4E
HBM4E
10
2026F
2027F
•SoIC capacity (by year end, kwpm)
20+
40+
2028F
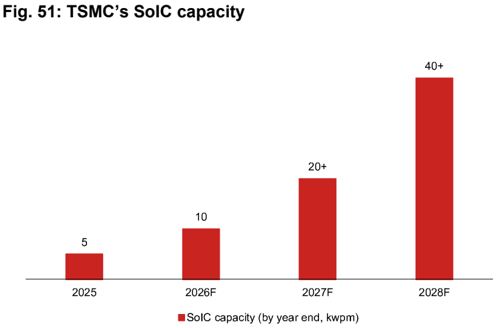
Source: Company data, Nomura estimates
larNe
SiC thermal solution is emerging because of SoIC
We observe that silicon carbide (SiC) is emerging as a highly thermal conductive material of interest due to even more stringent heat dissipation requirements for AI/HPC chips whose TDP skyrockets, noting that vertical stacking high-performance computing chips could exacerbate already concerning thermal management. SiC is a very competitive material, due to: 1) >3x higher thermal conductivity than silicon ; and 2) high mechanical strength, chemical stability, and durability in harsh operating environments, which SiC has demonstrated in power electronics applications like MOSFET and IGBT. More importantly, we believe SiC's cost structure has become more favorable than it was 5-6 years ago because of an industry-wide capacity expansion (notably in China).
In our Asia AI Thermal Anchor Report in October 2025 , we noted an application route of SiC in thermal management under study is the use of SiC to replace carrier silicon which are dummy dies bonded onto top logic dies to fill the structural void for better mechanical stability and prevent warpage of the entire complex during the assembly phase (see an example of carrier silicon in AMD MI300 in Fig. 52 ). As the passive die sits in the middle of the heat path from the heat source (processor die), to the thermal interface material (TIM1), and to the heat spreader, the substitution of silicon with SiC - whose thermal conductivity is much higher - could improve the heat dissipation efficiency. We see the SiC mechanical carrier potentially gaining traction on the back of its better thermal performance than current carrier silicon in tandem with broader adoption of TSMC's SoIC in coming years, since 3D stacking increases active silicon area and simultaneously power density in a given module footprint than sheer 2.5D/2D packaging. Manufacturing breakthroughs are nevertheless pending due to: 1) growth of large diameter SiC substrates (12') is more complicated and costly than 6' and 8' ones; and 2) although a dummy die is already simple per se, fabrication on brittle SiC wafers is more difficult than silicon wafers, along with other processing challenges.
We note that GWC has relevant SiC carrier solutions in the commercialization pipeline. Largan's (3008 TT, Buy) subsidiary, Taiwan Applied Crystal (TAC; unlisted), is also actively developing SiC chip-level thermal solution.
Fig. 52: Carrier silicon helps facilitate mechanical stability of the package, and material substitution with SiC might augment thermal performance
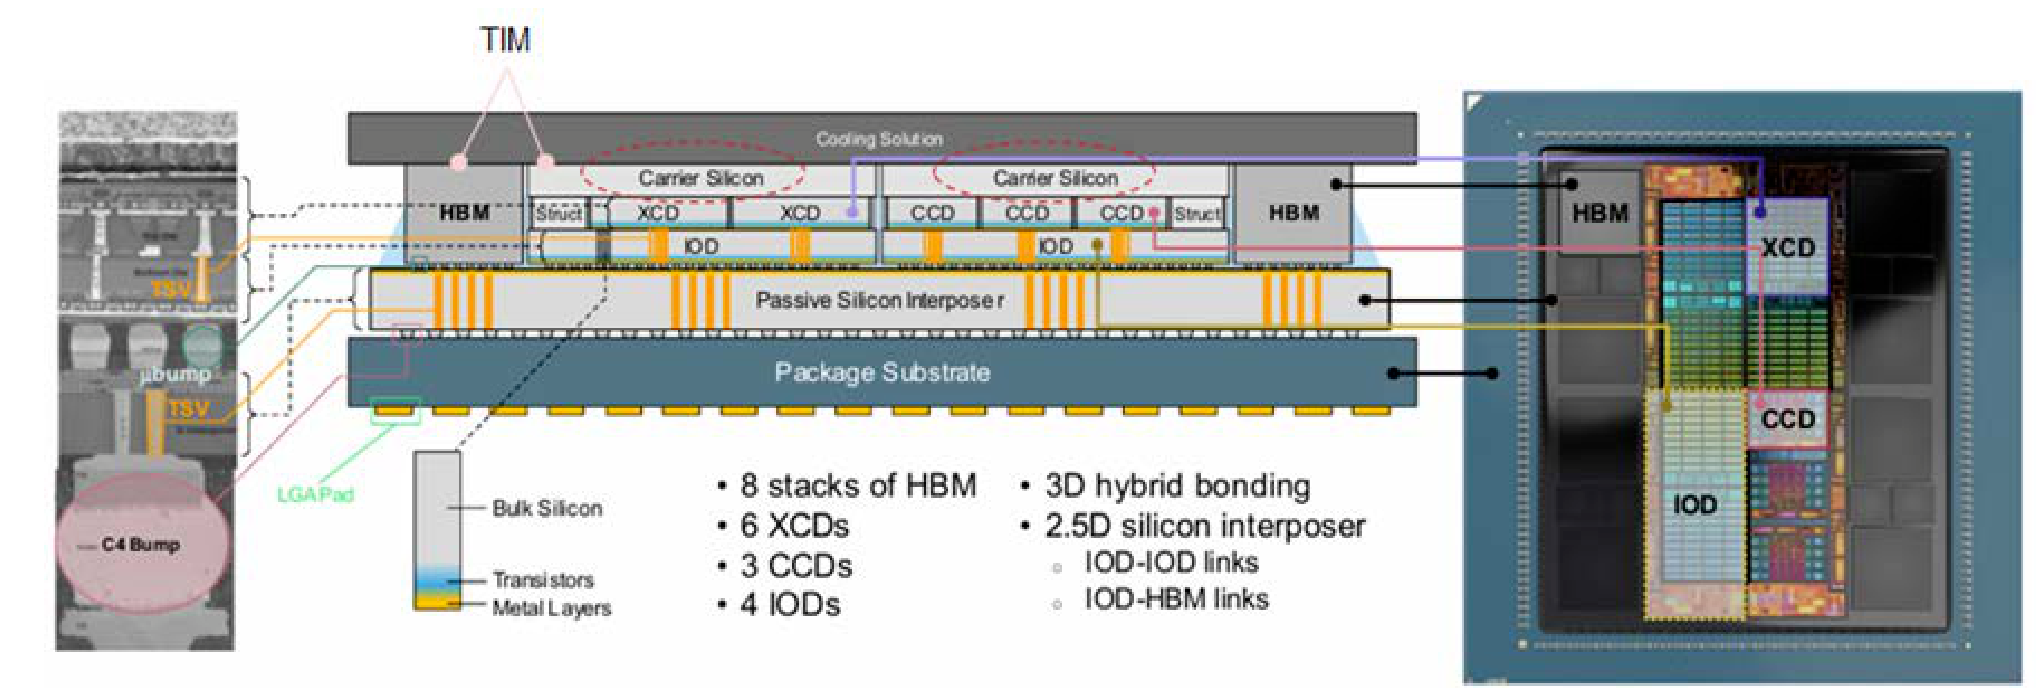
Source: AMD, Nomura research
IOD
XCD
CCD
CPUs: different architectures & surging demand Paradigm shift in CPU architectures
We understand that CPUs in AI servers are currently not included in the scope of TSMC's AI revenue, for which TSMC's chairman C.C. Wei shared in the April 2026 earnings call that '…it is not able to differentiate conventional server CPU vs AI server CPU ' yet, admitting that 'CPUs become more and more important in today's AI data center '. nVidia's CEO Jensen Huang at the COMPUTEX keynote speech this year also spent more time on Vera CPUs and mentioned that 'Agent is a new workload. We built CPUs for humans in the past. We need CPUs for agents, agentic systems. The properties are different - why would the old CPUs be the same? ' and '…This is the beginning of a new market, a market that never existed before! It is not going to take away from the old market, but this is a new market CPU for agents. This market will surely be larger than the last. '
We identified some interesting industry dynamics about CPUs in our August 2025 Anchor Report , including an accelerated share gain by ARM-based (ARM US, Not rated) CPUs from x86 CPUs and packaging technology changes in nVidia and AMD's next-generation server CPUs. Below we provide an update on nVidia and AMD's CPU hardware architecture.
- nVidia Vera: We previously believed Vera could utilize CoWoS-R (instead of FCBGA by Grace) to package one compute die, one I/O die and four memory interface chiplets on a 2.2x reticle-sized organic interposer. Our recent field trip to the COMPUTEX indicates the majority of Vera CPUs are packaged at Amkor's Korea facility using S-SWIFT (akin to CoWoS-R) and some at TSMC (CoWoS-R). nVidia's CEO Jensen Huang also discussed the shift in CPU requirements for agentic AI during his keynote speech, explaining that traditional CPUs are designed to maximize 'cores per socket' while Vera is specifically built for agentic AI to deliver 'low latency' (40% lower peak memory latency vs x86 CPU) and 'high memory bandwidth" (3x more bandwidth per core vs x86 CPU with DDR5) so as to direct workloads to GPUs and maximize AI factory outputs. nVidia emphasizes all 88 Olympus cores are in one monolithic compute mesh without 'chiplet tax' in core-tocore communication, and builds separate dies for memory controllers and I/Os to maximize the compute die area utilization for compute purposes. We think the chip design philosophy to offload memory controller blocks from the core compute complex may eventually become a common practice by ARM-based CPU designers and even AI accelerators (e.g., TPU v9 has independent memory fabrics, in our view; MediaTek has publicly illustrated such a concept, see Fig. 55 ) to leave the precious die area to core compute. ·
- AMD Venice: We previously believed AMD's Zen 6 'Venice' server CPUs could also utilize CoWoS-L to connect I/O dies (IODs) and core complex dies (CCDs). Our latest supply chain research suggests Venice will leverage ASE's FOCoS-B (akin to CoWoS-L) to package 2x IODs in the middle and 8x CCDs side by side on a c.2.9x reticle-sized reconstituted interposer. Based on AMD's decision to invest >USD10bn in Taiwan ecosystem (press release ), AMD is dedicated to developing 2.5D bridge interconnect technology 'embedded fan-out bridge (EFB)' in wafer form with ASE and in panel form with Powertech (6239 TT, Not rated). We reason localized high-density silicon bridges could increase die-to-die interconnect bandwidth at favorable economics, presenting a good balance for server-grade CPUs. We learned from SEMICON Taiwan that AMD's strategy is to reuse EFB IP in panel forms to ensure compatible design rules and seamless transition, and more importantly to localize high-bandwidth die-to-die interconnects to silicon bridges and relax line/space (L/S) requirements at panel-level RDL (report ). ·
We wrote in our December 2025 report that we observed that an increasing number of CSPs were developing their own ASIC CPUs for AI assistance purposes, in addition to the typical x86 CPU general servers. The trend does not recess at this moment (and likely will not), and we are witnessing more complicated chip layouts in the pipeline.
- Google Axion: We had flagged demand upside from Axion N4A (on TSMC 3nm; codenamed 'Cypress') to the Asia supply chain in August and December last year, as well as possible elimination of CPU sockets, potential upgrades in PCB/CCL, and potential market share reshuffle between ODMs. As the CPUs in the latest TPU 8t/8i racks shift from x86 to Google Axion, we believe the strength of this project is ·
manifested by those supply chain names including GUC (3443 TT, Neutral) and EMC. The current Google Axion C4A and N4A are still monolithic design, but our industry checks suggest the next generation may be a dual-die configuration, still utilizing FCBGA package, for releases in 2028F.
- AWS Graviton: AWS Graviton is the ASIC CPU of the largest volume, accounting for the majority of AWS' general server demand, based on our supply chain observations. Designed by Annapurna Labs under AWS with production turnkey completely handled internally, Graviton is now in the fifth generation. In the first two models, AWS opted for monolithic die layouts, while starting from Graviton 3, the floor plan has shifted to chiplet designs and the backend integration (of Graviton 3/4) is allegedly facilitated by Intel Foundry amongst the first-wave EMIB offerings to external customers as former CEO Pat Gelsinger's initiative. Specifically in Graviton 3/4, we notice the attempts by AWS to pull memory controller PHY and I/O blocks out from the compute complex and make them independent chiplets, and unsurprisingly such layouts should reserve as many die areas as possible for more intensive compute workloads over time. Nonetheless, in the latest Graviton 5, AWS appears to consolidate those chiplets back into the compute SoC. As such, we suspect the logic density of each individual silicon might be compromised, likely leading to a subpar transistor density vs TSMC's regular N3P for HPC applications, and supposedly this may explain why AWS has to integrate four identical chips on the substrate for Graviton 5 in order to make up for the performance shortfall in one single die. In addition, we observe Graviton 5 could have not considered Intel's EMIB scheme and embrace FCBGA package at Amkor (Korea factory). The modification might be reasonable and more economical particularly against the backdrop of substrate shortage and further embedding yield scrap from EMIB substrate production, in our view. ·
- Microsoft Cobalt: Following the introduction of Cobalt 100 in 2024, Microsoft unveiled its 132-core Cobalt 200 (based on TSMC 3nm) in 2025. We believe GUC is the design service partner for both Cobalt 100 and 200, in charge of supply chain logistics and expect it to stay involved in the next generation ASIC CPU. Cobalt 200 physically differs from its predecessor with a chiplet-based layout, and our survey suggests this could be assembled using Amkor's S-SWIFT. However, we believe Microsoft's Cobalt CPU volume might still be negligible in the supply chain at this moment. ·
- Arm AGI: Arm delivered its first silicon, 136-core AGI CPU (on TSMC 3nm), in March 2026, and we believe Arm is working with its design service partner Socionext (6526 JP, Neutral) on the project. The CPU places 2x half reticle-sized chiplets on a substrate using FCBGA, based on our observation. Arm recently also confirmed its CPU collaboration with Oracle (ORCL US, Not rated) and ByteDance (unlisted) in addition to the lead customer Meta and OpenAI. According to Arm's management, the follow-on AGI CPU 2 is slated for release in 2027E with AGI CPU 3 development already underway. ·
CCD
CCD
CCD
CCD
Axion Next
Olympus core
Fig. 53: An overview of CPU layout
1/0
Graviton 5
Grace
Vera
CCD CCD
CCD
CCD
I/O
CCD
CCD
VO
CCD
CCD
Venice
Turin
N4A
C4A
Graviton 4
Graviton 3
hlt 00
Cobalt 100
AGII
Source: Company data, Nomura estimates
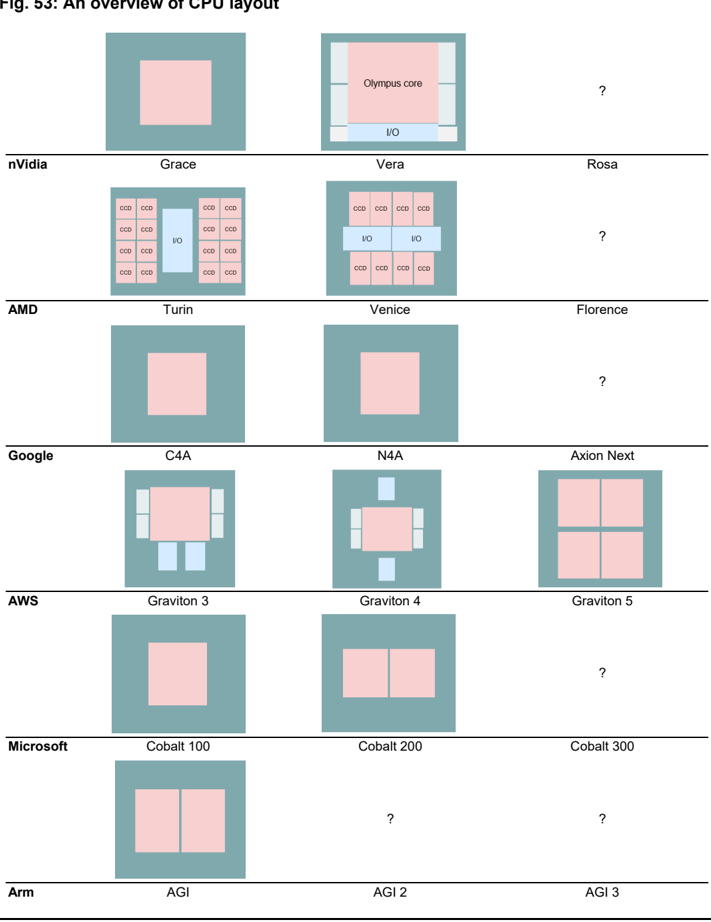
Fig. 54: Select CPU specs overview
| Vendor | Chip | Process Node | Cores/Threads | Core Platform |
|---|---|---|---|---|
| nVidia | Grace Vera | N5 N3 | 72/72 88/176 | Neoverse V2 Olympus |
| EPYC Turin Classic | N4 | 128/256 | Zen5 | |
| AMD | EPYC Turin Dense | N3 | 192/384 | Zen5c |
| EPYC Venice | N2 | 256/512 | Zen6 | |
| Xeon 6 (Sierra Forest-AP) | Intel 3 | 288/288 | Crestmont | |
| Intel | Xeon 6 (Granite Rapids) | Intel 3 | 86/172 | Redwood Cove |
| Xeon 6+ (Clearwater Forest) | Intel 18A | 144/144 | Darkmont | |
| Ampere (Softbank) | AmpereOne M(12 channel) | N5 | 192/192 | Custom Arm |
| AmpereOne MX | N3 | 256/256 | Custom Arm | |
| Arm (Softbank) | Arm AGI CPU | N3 | 136/136 | Neoverse V3 |
| AWS | Gravition5 | N3 | 192/192 | Neoverse V3 |
| Axion C4A | N3 | 72/72 | Neoverse V2 | |
| Axion C4A.metal | N3 | 96/96 | Neoverse V2 | |
| Axion N4A | N3 | 64/64 | Neoverse V3 | |
| Microsoft | Cobalt 200 | N3 | 132/132 | Neoverse V3 |
Source: TrendForce, Nomura research
Fig. 55: Offloading memory controller interface blocks to chiplets
Memory
I/O
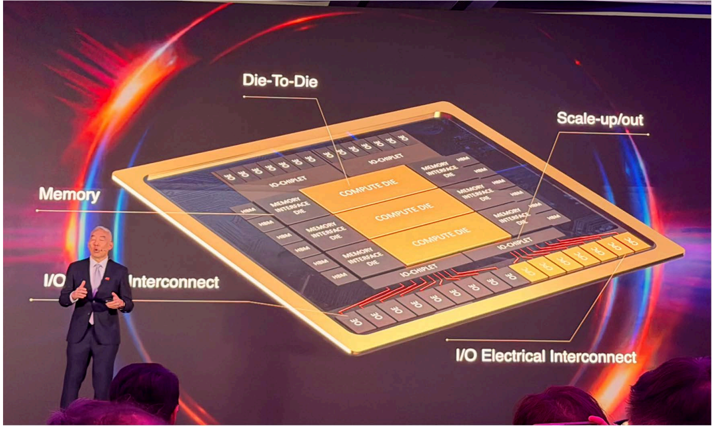
Source: MediaTek, Nomura research
We would also like to temporarily move away the scope of AI/servers to highlight some intriguing changes in client CPUs.
- nVidia DGX/RTX Spark: One new (yet somewhat well anticipated) announcement by nVidia during COMPUTEX was the launch of RTX Spark. We believe RTX Spark and DGX Spark launched last year share the same chip, codenamed GB10. The chip packages 1x Blackwell RTX die and 1x Grace ARM-based CPU die together. MediaTek is responsible for custom CPU design to earn royalty charges, and our observation at the COMPUTEX affirms our view that the chip assembly is carried out by Amkor's Korea factory based on S-SWIFT (akin to CoWoS-R). Our unit build assumption is 1mn/2mn in 2026F/27F. ·
- AMD's next-gen CPU "Medusa": Our supply chain checks indicate AMD's Zen 6 client CPU "Medusa" might embrace chip-last FOPLP package at Powertech, while the predecessor "Strix (Zen 5)" is assembled based on TSMC's chip-first InFO-oS to house 2x CCD and 1x IOD (where GPU and NPU are). Apart from TSMC's capacity constraints, our best guess of the packaging technology change reason is similar to Apple's (AAPL US, Not rated) application processor migration to chip-last WMCM from chip-first InFO-PoP to enable potentially more RDL layers at finer L/S (report ). ·
Boom in Agentic AI leads to unexpected CPU demand
Since 2H25, there have been growing discussions about server CPUs, and we also observe CPU shortage, alongside some crowding out of capacity for PC/SP applications, as reflected in Intel and AMD's business results. In this section, we describe some trends in server CPUs and quote industry-leading players' comments, while providing more details in the Appendix: other critical developments and key quotes from major server CPU players .
Server CPU covers plain CPU for non-AI general servers, head-node CPUs paired with accelerators, and CPUs used for AI workloads (but not with accelerators). We believe the second and third categories are driving substantial demand for server CPUs, especially the last one after Agentic AI boom. Along with the prosperity, major players in the field also provide encouraging TAM forecasts (Fig. 57 ). Notably, AMD in May-26 doubled its server CPU TAM forecast from USD60bn in Nov-24 to USD120bn+ by 2030E; nVidia and Qualcomm (QCOM US, Not rated) both look for USD200bn.
uru demand lo booming.hom sevelal all gies, unvel bout anelly of maneully by ri
AI PHASE
CONVERSATIONAL AI
REASONING AI
CPU cores will also increase
Fig. 56: Agentic AI is driving server CPU demand
AGENTIC AI
- Infrastructure-wide orchestration
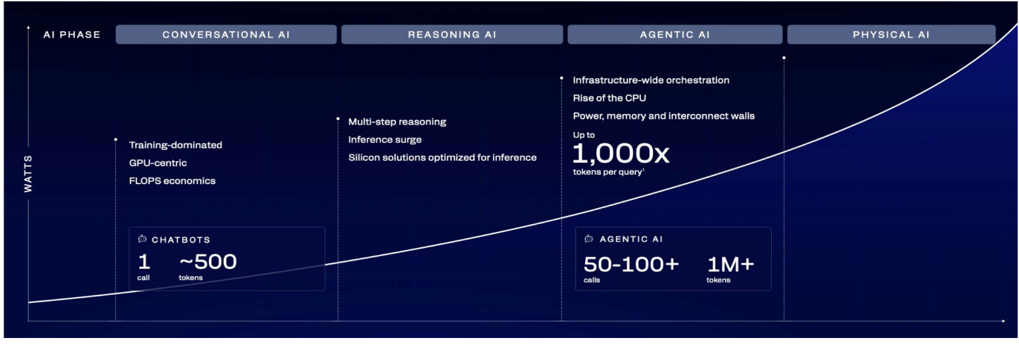
Source: Qualcomm, Nomura research
Fig. 57: Server CPU TAM forecast by major players
Company Server CPU TAM forecasts
Arm
When we look at what's going on with agentic AI, the growth of CPUs, the benefit that power-efficient CPUs bring in the data center, we think this represents about a USD100 billion TAM for us in the future. (Rene Haas, Arm Everywhere 2026)
AMD
nVidia
Based on the demand signals we are seeing today and the structural increase in CPU compute requirements driven by agentic AI, we now expect the server CPU TAM to grow at greater than 35% annually, reaching over USD120 billion by 2030. (Lisa Su, 1Q26 Earnings Call)
Vera CPU opens a brand-new USD200 billion TAM for nVidia, a market we have never addressed before, and every major hyperscale and system maker is partnering with us to get it deployed. We have visibility to nearly USD20 billion in total CPU revenue this year, setting us up to become the world's leading CPU supplier. (Jensen Huang, 1Q27 Earnings Call)
Qualcomm USD200bn by FY29 (Tony Pialis, 2026 investor day)
Source: Company data, Nomura research
Fig. 58: The growing importance of server CPU
CPU demand is booming…from several angles, driven both directly or indirectly by AI
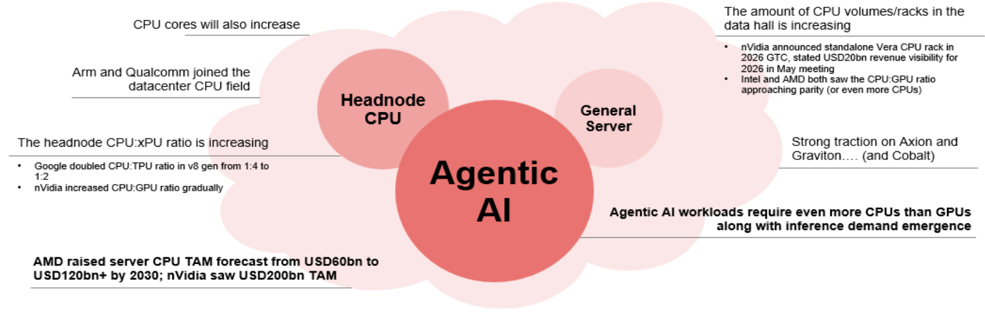
Source: Company data, Nomura research
CPU in AI head node to pair with GPU - the CPU:xPU ratio is increasing
The headnode CPU amount paired with accelerators has been widely discussed after Google released its latest TPU v8t/v8i in late April 2026. The company specially mentioned that it has doubled the CPU usage per server, and it has increased adoption of in-house Axion CPUs; previous this was usually paired with x86 CPUs. nVidia has also gradually increased its CPU:GPU ratios from Hopper to the current Blackwell/Rubin architecture.
WATTS
PHYSICAL AI
data hall is increasing
The amount of CPU volumes/racks in the
cavela
UrUs
Blackwell
Ultra GPU
nuull or us ull a compute tay
Jupiter Network
Grace CPU
Grace CPU
ur uo t ta nuvill or us ull a bullpule lay our us vel solvel will - nou ur
ca vola
Up to PCle Gen6 x16
Up to PCle Gen5 x16
Up to PCle Gen5 x4
Blackwell
Distributed
Global WAN
Blackwell
Blackwell
Google unveiled v8 TPUs in Apr-26 with 2x usage of CPUs:
Gen6 x16
M.2
- 'We doubled the physical CPU hosts per server, moving to our custom Axion Armbased CPUs.' (Amin Vahdat, Google) · B3240 DPU (E-W) Supports breakout 2x400Gb/s
(N-S)
- Previous generations: 4 TPUs paired with 1 x86 CPU ·
NVMe
NVMe
NVMe
TPU 8t racks
- From v8i & v8t gen: 4 TPUs paired with 2 Axion CPUs ·
ICI (inter-Chip Interconnect)/ SPOCS
multi-datacenter sites
Expandable to
Data center building
nVidia has also increased its CPU:GPU ratio over time:
- HGX/Hopper: 8 GPUs per server with 2 x86 CPUs ·
- Blackwell & Rubin/Oberon: 2x Grace CPUs + 4x Blackwell GPUs or 2x Vera CPUs + 4x Rubin GPUs on a compute tray ·
- Rubin Ultra/Kyber: 2x Vera CPUs + 4x Rubin Ultra GPUs on a compute blade ·
Fig. 59: TPU 8t rack level connectivity
4 TPUs paired with 2 Axion CPUs
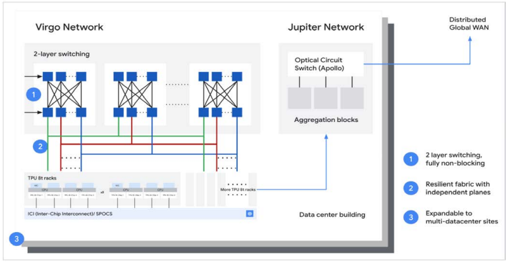
Source: Company data, Nomura research
Fig. 61: Blackwell compute tray logical design
2x Grace CPUs + 4x Blackwell GPUs or 2x Vera CPUs
Fig. 60: H100 data-network configuration
8GPUs per server with 2 x86 CPUs
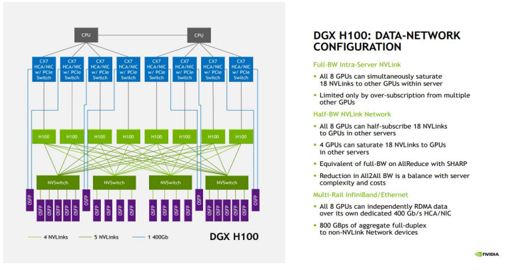
Source: Company data, Nomura research
Fig. 62: Rubin Ultra compute blade
2x Vera CPUs + 4x Rubin Ultra GPUs on a compute blade
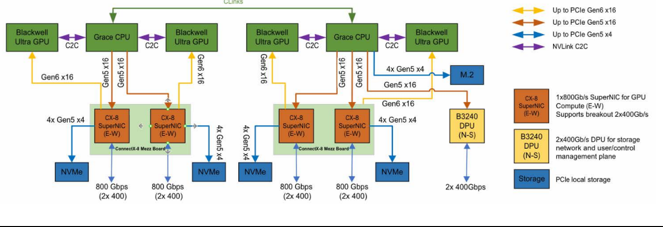
Source: Company data, Nomura research
Fig. 63: Rubin compute tray
2x Vera CPUs + 4x Rubin GPUs on a compute tray
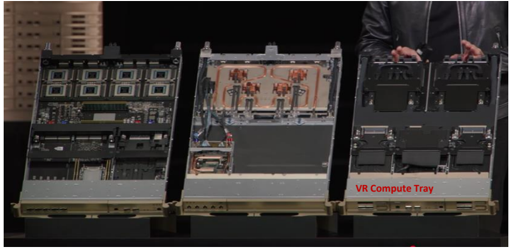
Source: nVidia, Nomura research
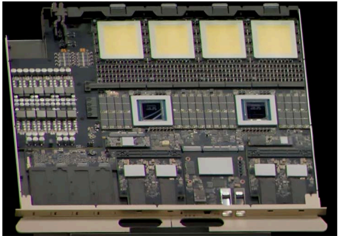
Source: Company data, Nomura research
Fig. 64: Rubin compute tray
2x Vera CPUs + 4x Rubin GPUs on a compute tray
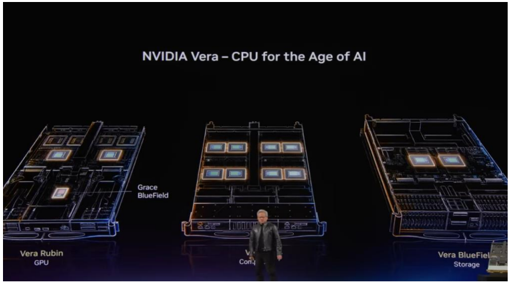
Source: nVidia, Nomura research
B3240
DPU
(N-S)
2x400Gb/s DPU for storage network and usericontro
management plane
Storage
NSwitch
NVSwitch
PCle local storage
- Winke
Vera Rubin compute blade
CPU
DGX H100: DATA-NETWORK
CONFIGURATION
Full-BW Intra-Server NVLink
NVIDIA Vera - CPU for the Age of Al
• All 8 GPUs can simultaneously saturate
1e Nyanks to oter Orus wiunin serve
• Limited only by over-subscription from multiple other Crus
Half-BW NVLink Network
• All 8 GPUs can half-subscribe 18 NVLinks o GPus in other serven
• 4 GPUs can saturate 18 NVLinks to GPUs in other servers
• Equivalent of full-BW on AllReduce with SHARP
• Reduction in AlIZAIl BW is a balance with server complexity and costs
Multi-Rail InfiniBand/Ethernet
• All 8 GPUs can independently RDMA data over its own dedicated 400 Gb/s HCA/NIC
800 GBos of aggregate full-duple o non-NVLink Network devic
Vera BlueFie
Storage
Grace
NSwitch
8155 55555
DGX H100
CPU volumes/racks in data halls increasing
From another perspective, CPUs' growth may not necessarily come from increasing the ratio of CPUs to accelerator, as the structure is also limited to overall server design and shall consider physical area within a tray and thermal/power relevant issues. Instead, we may see more CPU racks within a data center campus to operate workloads such as orchestration and management. As mentioned in the above section, this could be partially evidenced in nVidia's grand launch of standalone Vera CPU rack in 2026 GTC in Mar-2026, and the longer time nVidia's CEO Jensen Huang spent on CPUs during its GTC Taipei Keynote in June 2026. The company also disclosed CPU revenue visibility of USD20bn during its earnings call in May 2026.
nVidia announced standalone Vera CPU rack in 2026 GTC
- 'This is the Vera system, twice the performance per watt of any CPUs in the world today. It is also in production. Well, we never thought we would be selling CPU stand-alone. We are selling a lot of CPU stand-alone. This is already, for sure, going to be a multibillion-dollar business for us. So I'm very, very pleased with our CPU architects. ' (Jensen Huang, nVidia) ·
- 'Vera CPU opens a brand-new 200 billion TAM for NVIDIA a market we have never addressed before. And every major hyperscale and system maker is partnering with us to get it deployed. We have visibility to nearly $20 billion in total CPU revenue this year, setting us up to become the world's leading CPU supplier .' (Colette Kress, nVidia) ·
- 'We're going to need a lot more CPUs, and Vera was designed to be an agentic CPU. The CPUs of the past were designed to have many cores so that it could be easily rentable. People rent at cores. Well, agents don't rent cores. They just want the work to be done fast. The economics of the past was dollars per core. That's the economics of cloud computing of the past. The economics of the AI of the future is tokens per dollar or dollars per token. And so what we need to do in the future is to generate tokens, process tokens as fast as possible, and that's what Vera does incredibly well.' (Jensen Huang, nVidia) ·
Arm shared the view of more CPUs inside a data hall and mentioned nVidia's standalone Vera CPU racks in May 2026.
- ' T he ratios are going to change from a CPU core count, maybe not a chip count. Where we'll see the growth, in my opinion, is not so much in the head node to a GPU architecture because that's a little bit fixed given the way the GPU is architected and how it feeds to CPU. But will you see many, many more CPUs inside a data hall, dedicated racks of CPUs that are doing Agentic orchestration and scheduling and management, 100%. You simply just have to look at NVIDIA announcing a dedicated Vera rack, 256 Vera CPU chips, 88 cores per chip and a 200-kilowatt liquid-cooled rack that is designed to sit in a data center adjacent to a Vera Rubin system. And that's simply because of the size of the system, it's liquid cooled. So imagine a world where you had scores of Vera Rubin racks, now you may actually have a Vera rack in between or 2 Vera racks. So that changes the ratios completely. ' (Rene Haas, Arm) ·
Fig. 65: Standalone Vera CPU rack
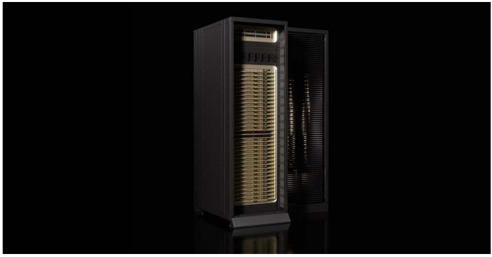
Source: Company data, Nomura research
Fig. 66: Vera CPUs on compute tray, CPU tray, and storage tray
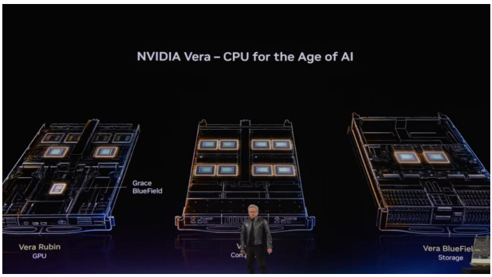
Source: nVidia, Nomura research
NVIDIA Vera - CPU for the Age of Al
Vera BlueFiel
Storage
70
60
50
40
30
20
10
Growing CPU demand directly enlarges BMC TAM
Following the wave of agentic AI, we see ASPEED as a clear beneficiary of the booming CPU trend. ASPEED saw strong demand from AI-related general server for agentic AI workload and simple inference tasks, and the company separated the category in its latest forecasts in Mar-26. We observe that ASPEED's customers continue to ask for more, reflecting in its growing backlog into 2027F.
Fig. 67: ASPEED's BMC TAM forecast
ASPEED saw strong demand from AI-related general server
- 2026 2027 2028
BMC for General Server
• BMC for Al-related General Server
2029
• BMC for GPU Server
2030
• BMC for AI ASIC Server
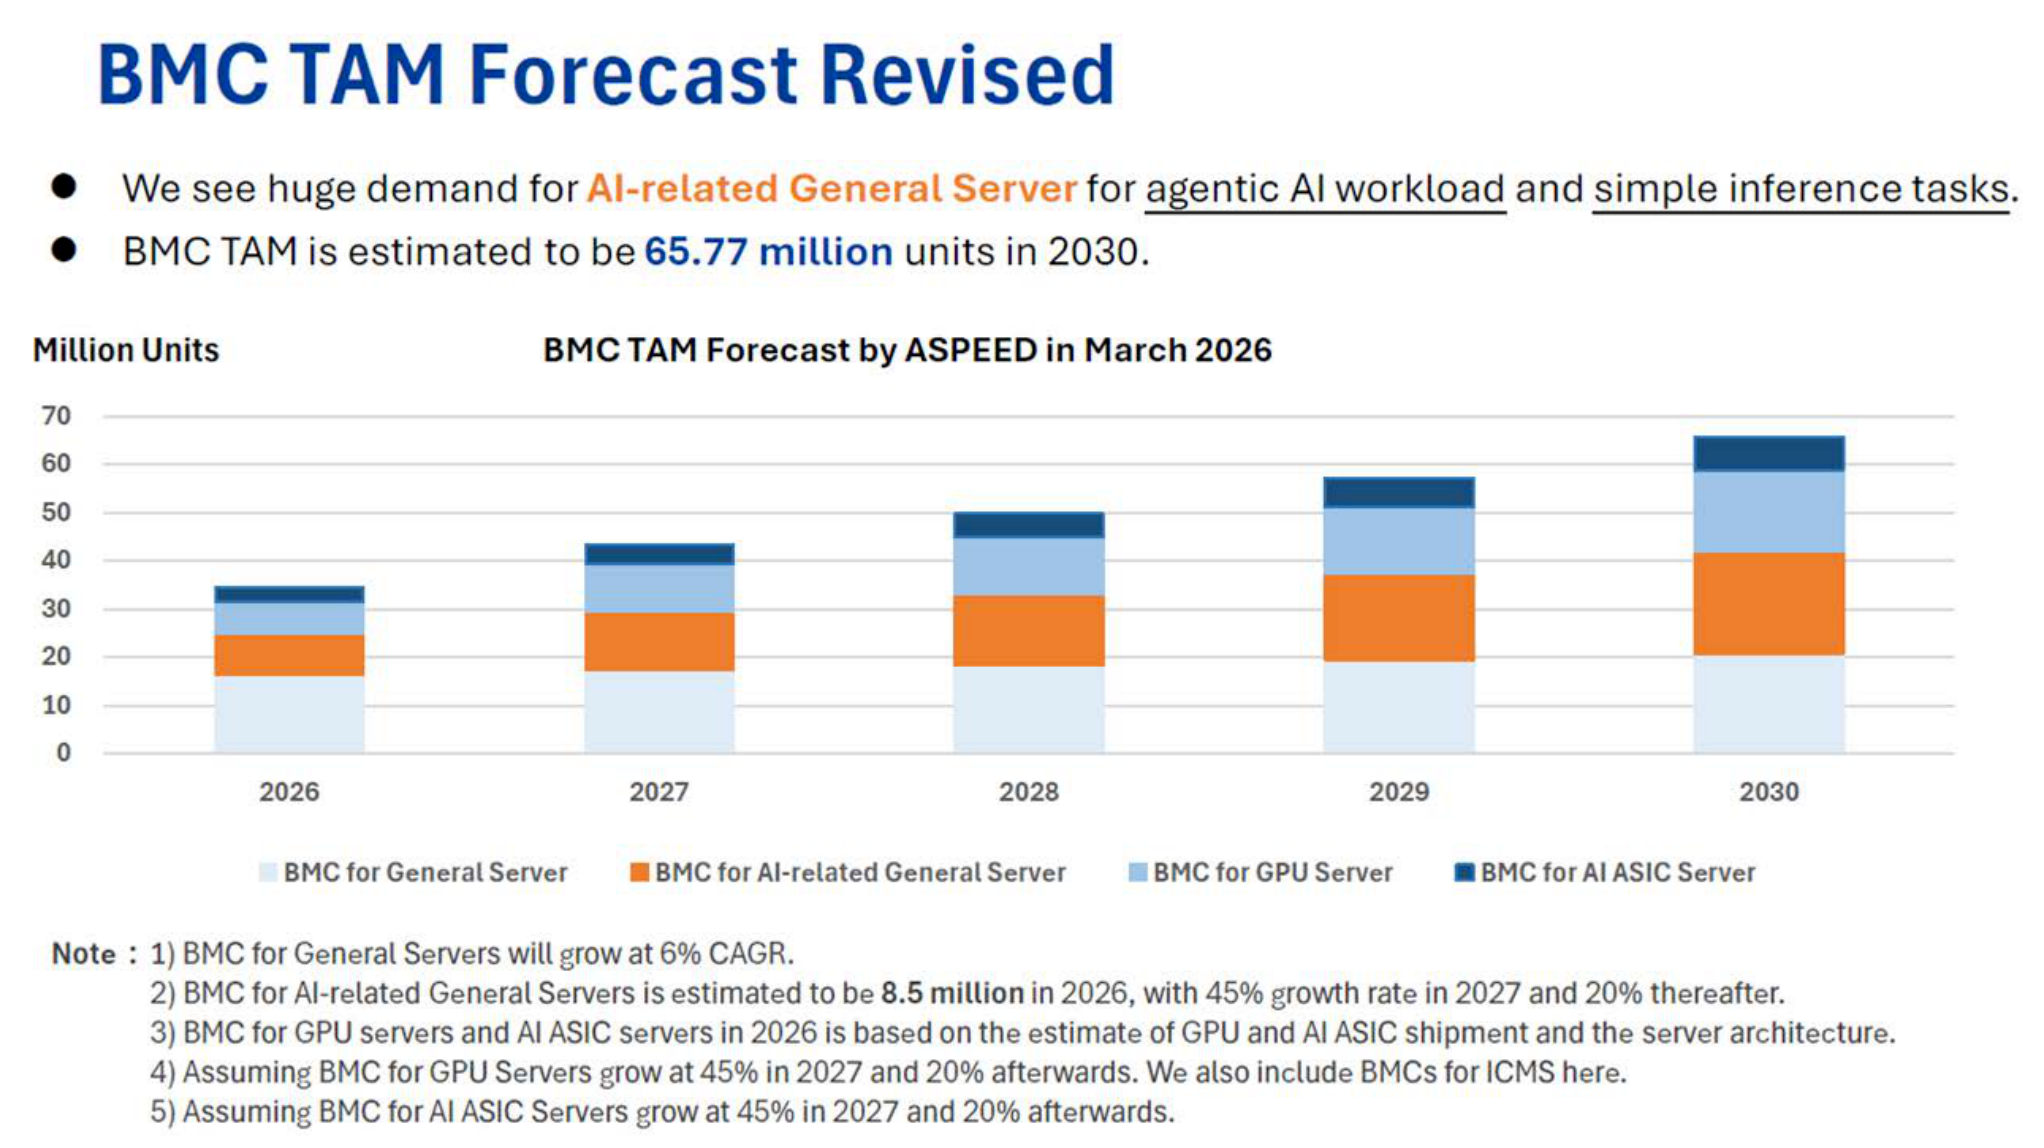
Source: Company data, Nomura research
Server forecast updates
We forecast TSMC's CoWoS capacity to grow by over 80% in 2027F, but…
We believe TSMC could expand its CoWoS capacity to c.2mn wafers in 2027F from c.1.1mn in 2026F, which implies 80%+ y-y growth, likely due to rising AI capex commitments from CSPs, neoclouds, sovereign AIs, AI GPUs and ASIC makers, as well as potential competition from Intel's EMIB-T.
... we conservatively factor in 60-65% growth for its 2027F CoWoS output in our server forecasts, given unprecedented mismatch of component supply
However, we are also experiencing unprecedented supply mismatch in various components (including but not limited to the well-known shortage of memory and CPUs), even before the full-scale ramp-up of Rubin and Trainium 3 - which are the most important new AI server platforms in 2026F - from late-3Q26F. We are concerned that the broad-based component shortage situation will deteriorate in 2H26F and 2027F, and such supply chain imbalance will likely cap the growth rate of servers (as well as all the other electronic products) in 2027F and beyond. Hence, we conservatively apply a 10% discount to the CoWoS output (i.e., around 1.8mn wafers, 60-65% y-y growth) for 2027F , and we need to closely monitor the impact of shortage issues.
Deteriorating structural shortages in 2027-28F, with risk of paradigm shifts in 2028F or beyond
In our view, there are several structural challenges to AI server supply chain in 2027-28F.
Unprecedented component shortages
Given the 2-3-year market view of a 60-80% CAGR for AI servers, a 20-30% CAGR for CPU/general servers (a new market view from early-2026), and a 30-50% CAGR for networking switches, the scope and magnitude of component shortage in the tech universe this time is unprecedented, as most of the capacity planned in late-2025 didn't fully consider the additional growth from CPU servers and networking on top of AI GPU/ASICs, and suppliers also tend to discount the growth target from AI customers.
We believe the broad-based component shortage is going to increasingly squeeze non-AI tech products (e.g., consumer products), and even other sectors, including automotive and industrial sectors, from 2H26F to 2027-28F. In addition to the well-known memory and CPU shortage, PCB/CCL, IC substrate, higher-end capacitors, power ICs, optical components, and various other components are already in shortage at this moment, and supply is going to deteriorate further.
The challenges to ease the shortage are: 1) we note the expansion magnitudes of leading component players are usually by a CAGR of 30-50% during 2026-27F. In 2026-1H27F, the most timely capacity expansion will mostly come from brownfield sites left from the prior bull cycle, which already have buildings and infrastructure. After the brownfield sites are used up, to build large-scale greenfield capacity (building everything from scratch) normally take 1.5-2.5 years, depending on industry difference, but the lead times for most equipment tools are lengthened at this moment, prolonging the greenfields' lead time in general to two years or more. This is why we may rarely see component makers easily 'double' their capacity output for AI in 2027F. 2) Materials, materials' materials, and even the key components to make equipment tools are also getting tight or already in shortage . As these upstream material or key component makers are usually serving a wide range of industries, not just the technology sector, they may not fully understand the urgency of capacity expansion of their customers or the AI industry, and their expansion lead time is usually longer than downstream components. 3) Many component suppliers switch/convert capacity from other applications to AI-use to fulfill immediate demand growth from AI. Although we believe this has been the case since 2025 and non-AI demand (e.g., smartphone and PC) indeed looks weak in 2026-27F, the conversion will accelerate in 2H26-27F, squeezing consumer products and even automotive and industrial sectors severely.
Potential breakthroughs in physical walls representing higher risks of technology changes and paradigm shifts for 2028F and beyond
We sense 2028F will be the next technological leap for AI server technologies, after the leap in 2H24-2025 (e.g., nVidia's Oberon architecture for GB200/300, VR200). The
current AI platforms in 2025-26F are mostly based on existing technologies, but by 2028F, based on most AI GPU/TPU players' roadmaps, the new-generation AI platforms by that time will need various breakthroughs in physical limits in technologies and materials to achieve those upgrades.
For example, we believe faster connectivity, e.g., SerDes to 336G or 448G, will be one of the top challenges in next-gen AI beyond 2027F. Even if the chipsets are ready, the peripheral components in the system also need to be upgraded and re-designed thoroughly to accommodate the faster speed, in our view. For PCB/CCL , while M9Q/M10Q, PTFE , or other CCL materials which can support lower signal losses will be required, those materials (e.g., Q glass, and PTFE) are mostly not proven for PCB mass production yet. HDI PCB which has features of shorter circuit routing and lower losses, will likely be increasingly considered vs the current high-layer-count (HLC) PCB, but the manufacturing processes of HDI, which require laser drilling and processes for finer pitch line space/line width, are more expensive and require new investments of equipment for HLC makers to convert to HDI. Not to mention, using HDI to process new materials, e.g., Q glass, PTFE, will likely require new kinds of laser drilling equipment tools (e.g., picosecond green or femtosecond IR lasers ) than current mainstream CO2 lasers.
Copper vs optical transmission : In our view, the necessity of using optical transmission for scale-up is getting higher and higher, because the faster interconnect to 336G and 448G in the future will be close to the limits of copper wiring and the shorter transmission distance of copper wires under such high speed will be against the trends of developing larger scale-up AI clusters. Meanwhile, the upgrades to optical scale-up can somehow improve the performance of AI server platforms, enabling them to serve as a back-up if other required new technologies for new AI architectures fail to break through in time. For example, nVidia is likely developing CPO/near-packaged optics (NPO) to help performance upgrades for its next-gen Rubin Ultra under the current Oberon architecture, if the new Kyber architecture is not ready in time for Rubin Ultra in 2H27F. For Kyber (likely in 2028F for Feynman), CPO/NPO can also serve as a more powerful scale-up technology for larger and higher-density AI server clusters. However, CPO technology still has a lot of challenges in mass-volume, fully automated production and testing processes. We believe before CPO technology gets more mature for mass volume applications, alternative transitional technologies, such as NPO, Extra-dense pluggable optics (XPO), and co-packaged copper (CPC) , will likely be considered in 2027-28F. However, in our view, given the high uncertainties (e.g., various different designs, processes, unclear scale/timing and sustainability) of those new technologies, it is challenging for investors to identify clear winners in this early stage, and it is also difficult for companies to make investment decisions, if the processes are not fixed and scale is undefined. And, we believe there could be higher risks in the medium term (e.g., 3-5 years) to the investments related to transitional technologies, like CPC, XPO, and NPO , given that CPO could be the ultimate solution in the end. In the longer run (e.g., 5-7 years), the PCB-based system architectures will likely need to be scrutinized, if optical I/O (OIO) can be materialized, in our view .
Copper-based connectivity technologies (e.g., direct attach cable [DAC], active electrical cable [AEC], CPC, PCB, and various connectors) also continue to upgrade to cope with faster transmission speed and lower loss requirements, as they are still the more cost-effective, and energy-efficient solutions vs optical solutions, if they can achieve the requirements.
In advanced packaging, we believe in order to achieve higher performance and larger size requirements, various new technologies, such as EMIB-T and GPU-on-GPU SoIC , etc., are required for the next-next gen GPU (e.g., Feynman likely needs SoIC) and TPU (v9 needs EMIB-T) in 2028F. For the longer term, we believe technologies such as CoPoS and glass-core/ceramic-core substrates will also be discussed in 2029-31F. More powerful ICs will likely require more powerful thermal solutions, including MCL, vapor chamber lid (VC lid), SiC, etc. (refer to our Anchor report published in October 25). We have discussed in detail about the challenges for those new technologies in the prior sections.
We believe all these new technological developments show rising risk to investments and execution in 2028F or beyond, given the potential technology shifts. We think it will be a dilemma for companies to invest in some 'transitional' technologies. It will also be a dilemma for investors to invest based on either a 1-2year view (mostly very profitable based on existing or transitional technologies) or
on 3-5-year potential (likely based on unproven technologies with high risk of paradigm shifts), in our view.
In 2027F, nVidia and Google to continue as winners of CoWoS allocations, with Google's share incrementally up the most
As mentioned earlier, we forecast TSMC's CoWoS output to grow to 1.8mn wafers (vs capacity of 2mn units) in 2027F, up from c.1.1mn in 2026F. Within the 1.8mn output in 2027F, we assume that nVidia will get around 54-56% (vs 2026F of 56-58%), Google (Broadcom+Mediatek) c.27% (2026F: c.20%), AMD (including Xilinx) 8-9% (2026F: 78%), and AWS (including Al chip and others) 5-6% (2026F: 6-7%). We expect Google' s share to expand from 20% in 2026F to 27% in 2027F, growing the most y-y.
nVidia upstream: keeping mid-50s share in CoWoS, with mix shifting to Rubin/Rubin Ultra in 2027F
We assume nVidia's CoWoS capacity allocation at TSMC will increase, from 350370kpcs in 2025E and 620-640kpcs in 2026E, to 980-1,030Kpcs in 2027F , and its mix will change from Blackwell (60-62%), Rubin (33-35%), and Vera (4-5%) in 2026F, to c.90% for Rubin and Rubin Ultra and 8% for Vera.
Although there were HBM4 issues and heat spreader design changes for Rubin earlier this year, we believe those bottlenecks have been largely resolved, with certain compromises in performance (e.g., Rubin likely to achieve 1,800W in 2H26F, but not 2,300W, the over-clock performance). We think nVidia will ramp up Rubin rapidly in late-3Q-4Q26F (we assume c.2mn units of Rubin in 2026F , vs our prior assumption of 2.5mn units made in December 2025); at the same time, nVidia will keep doing more optimisations or system design changes in order to drive higher performance, but we think that will only materialize in early 2027F on an upgraded system version of Rubin or by mid-2027F on Rubin Ultra.
We assume Rubin Ultra, the majority of which will be 2-GPU per CoWoS package version, similar to Rubin, will ramp up production from mid-2027F . Given the similarity of package design and system architecture , we expect the transition to Rubin Ultra will likely be smooth and quick, just like GB200 to GB300, except for the uncertain readiness of CPO/NPO scale-up connectivity for Oberon, which could be an optional version if the technology is not mature enough.
nVidia downstream: raising our NVL72 rack shipment estimate to 54.5k (from 50k) for 2026F, and introducing our forecast of 62k for 2027F
For 2026F, considering rising capex guidance from top US CSPs YTD and increase in neoclouds, we raise our GB/VR rack shipment assumption from 50k units to 54.5k units for 2026F (see Fig. 69 ). Of this, we assume VR200 to account for 15-20% in 2026F, with concentration in 4Q26F . We assume a transition from GB300 to VR200 during late-2Q26F to 3Q26F, as top CSPs will likely prefer to wait for VR200, instead of continuing to install more GB300s. In the transitional period, we expect neoclouds to play a bigger role to buy more systems to support the continued token demand growth in AI companies.
We also introduce our forecast of 62k racks for 2027F , with a potential transition from Rubin to Rubin Ultra happening in 2Q27F.
Our HGX vs GB/VR mix assumption for nVidia modules has some swings this time. We change our HGX:GB/VR mix assumption for 2026F to 30%/70% , vs our previous estimate of 18%/82%. Because nVidia needs to produce more Blackwell GPUs against the backdrop of lowered Rubin shipments in 2026F caused by above-mentioned bottlenecks, in order to consume all the promised CoWoS from TSMC, we think HGX type offers better flexibility to consume the excess Blackwell GPUs to smaller customers. However, for 2027F, our HGX/VR mix assumption is now 20%/80%, as we think VR200 demand will outpace supply in the initial stage.
18
16
14
12
10
8
6
4
2
0
16
16
16
Fig. 68: Our quarterly forecasts for GB/VR rack shipments
12
0.7 0.7
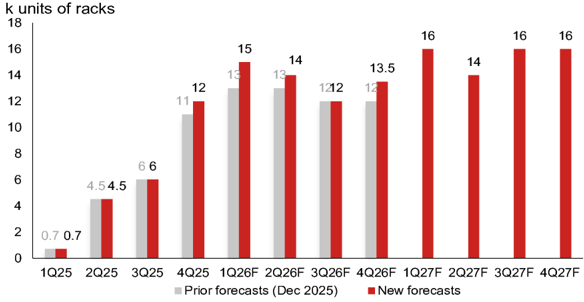
Source: Nomura estimates
AMD: rising traction recently in MI455
We currently assume AMD's CoWoS volume (including Xilinx) would grow c.80% y-y in 2027 , with its share in our covered company TSMC's CoWoS slightly up to 8-9% in 2027F, from 7-8% in 2026F. We notice that AMD's top customers for MI455 are OpenAI (through Oracle and Microsoft), Meta, Anthropic, and several neoclouds . MI455 will be the first rack-level system of AMD, similar to nVidia's Oberon. The leading NPI ODM of MI455 is Sanmina (SANM US, Not rated), which bought ZT systems (unlisted; mainly rack and cluster engineering team and manufacturing) from AMD in October 2025. Although we have not heard or seen records of severe bottlenecks of MI455 so far and AMD's public announcements all show optimistic progress on the project, we think whether the severe mismatches of component supply could impact AMD's production ramp-up in 2H26 remains noteworthy, in our view.
Google's TPU: growing the fastest in 2027F
We assume TSMC's CoWoS allocation to Google's TPUs (through Broadcom and MediaTek) would increase over 115% y-y to 480kpcs in 2027F (our assumption factors in Google's internal use as well as external customers) . We estimate the split between Broadcom and MediaTek would be roughly 66-68:32-34 in 2027F.
However, the largest debate in TPU is its roadmap in 2028 and beyond. TPU v9 (code name A5922), led by MediaTek and based on Intel's EMIB-T package, is scheduled to have its first tape-out by end-2026E, which could be the first reality check on the timing of the new EMIB-T technology.
On the other side, Broadcom's TPU v8i (Sunfish) has been pushed out to late-2026E (from originally 3Q26); the next-gen TPU from Broadcom would be a combination of two v8i TPUs in one multi-chip module (MCM) package, likely codenamed Whalefish, and might come onstream in late-2027E, according to management. We think the relative positioning of TPU v9 and Whalefish in Google's TPU roadmap for its internal use or for external demand in 2028F will likely depend on the progress of EMIB-T, which is still unclear at this moment .
We notice that Broadcom has partnered with Apollo Global Management (APO US, Not rated) and Blackstone (BX US, Not rated) to launch the AI XPV platform in June 2026 ( press ), backed by a monumental USD35bn in initial financing. This strategic alliance aims to deliver over 20GW of AI computing capacity through 2028 to support leading AI research labs, including OpenAI and Anthropic. Specifically, the initial funding will directly fuel Anthropic's AI infrastructure expansion, enabling it to deploy over 1GW of computing infrastructure starting in mid-2026. Simply assuming 1,000W TDP for TPUs/ASICs, 20GW could translate to 7mn+ units of TPUs, equivalent to 360-460k CoWoS demand. The vendor-backed financing phenomenon somewhat enhances our confidence, as Broadcom leverages its own robust balance sheet to backstop (offering residual value guarantees) massive infrastructure loans for these LLM makers.
1212
12
Raising 2026-27F server market forecasts, with stronger AI and general/CPU servers
Compared with our forecasts in December , the demand outlook for AI token growth is now more robust, and the development of agentic AI is also accelerating CPU server growth in AI inference. As such, we raise our global AI server revenue estimate by 12% for 2026F, and the new forecast represents 78% revenue growth in 2026F (vs 58% previously) for AI servers, led by stronger demand and higher ASPs from component cost inflation. In this report, we also introduce our 2027F AI server revenue growth forecast of 76%, similar to the 2026F level, in which our AI server unit growth forecast is at 43% (slower than 67% in 2026F), with the rest coming from cost inflation.
We also raise our general/CPU server forecasts substantially, lifting unit/revenue by 14%/48% for 2026F. After the revisions, we now forecast general/CPU servers to grow by 31% in units (vs prior 15%) in 2026F and 26% in units in 2027F , from an estimated 19% growth in 2025F. To reflect rising costs, especially that of memory, we assume the ASPs of general/CPU servers would also increase by 28% in 2026F and 13% in 2027F. All in, our general/CPU server revenue forecasts are growth of 67% in 2026 and 43% in 2027F. We provide a detailed discussion about CPU server market demand for AI inference and comments from top AI and chipset companies in other section of this report (please see Appendix: other critical developments and key quotes from major server CPU players ).
Therefore, we now forecast global server revenue growth of 74%/65% y-y in 2026F/2027F (Fig. 69 ) (vs 53%/43% y-y in 2025F/26F previously), with the AI server revenue growth rate at 78%/76% y-y in 2026F/2027F (previously 76%/58% y-y for 2025F/26F) and general/CPU server revenue growth rate at 27%/67%/43% y-y in 2026F/2027F (previously 23%/16% y-y for 2025F/26F).
Fig. 71 , Fig. 72 , and Fig. 73 suggest that our latest 2027 forecast for AI server sales would eventually translate into upside to current consensus forecast on hyperscaler capex, regardless of hyperscalers' FCF into 2027 (Fig. 75 ).
Fig. 69: Our assumptions of global server market and nVidia's AI GPU supply and demand
| nVidia | Current | Old forecast (Dec 2025) | Change | |||
|---|---|---|---|---|---|---|
| 2024 | 2025 | 2026F | 2027F | 2026F | 2026F | |
| Supply: CoWoS-based GPU unit supply (k units) | ||||||
| A100 | 134 | - | ||||
| H100/200/20 | 4,932 | 476 | - | - | ||
| B200/300 (if assuming no B300A) | 263 | 5,265 | 5,835 | 225 | 5,100 | 14% |
| Rubin | 2,024 | 9,093 | 2,468 | -18% | ||
| Total (a) | 5,329 | 5,741 | 7,859 | 9,318 | 7,568 | 4% |
| Module: GPU unit forecasts (k units) | ||||||
| HGX | 4,538 | 1,527 | 1,976 | 1,426 | 1,190 | 66% |
| GB or VR (Oberon) | 78 | 3,234 | 4,613 | 5,704 | 5,258 | -12% |
| Total (b) | 4,616 | 4,761 | 6,589 | 7,130 | 6,448 | 2% |
| The gap of module level/ GPU volume [1-b/a] | 13% | 17% | 16% | 23% | 15% | |
| Server type mix% for AI GPUs using CoWoS (%) | ||||||
| HGX | 98% | 32% | 30% | 20% | 18% | |
| GB or VR (Oberon) | 2% | 68% | 70% | 80% | 82% | |
| AI server units (k) | ||||||
| A/H/B/R100/200/20/300 (8 GPUs per server) | 567 | 191 | 247 | 178 | 149 | 66% |
| GB200/300/VR... (4 GPUs per server) | 20 | 809 | 1,153 | 1,426 | 1,314 | -12% |
| # of NVL72 Racks (ideal) (K racks) | 0.15 | 45.9 | 64.1 | 79.2 | 73.0 | |
| Potential yield loss, or component bottlenecks? | 65% | 49% | 15% | 22% | 32% | |
| # of NVL72 Racks (reality) (K racks) | 0.1 | 23.2 | 54.5 | 62.0 | 50.0 |
Old forecast
(Dec 2025)
2026F
15,600
2,446
18,046
121,720
299,907
421,627
15%
61%
19%
16%
58%
43%
Overall server market
General/CPU server units (k)
AI server units (k)
Total server units (k)
General/CPU server revenue (US$mn)
AI server revenue (US$mn)
Total server revenue (US$mn)
y-y (%)
General/CPU server units (k)
AI server units (k)
Total server units y-y (%)
General/CPU server revenue (US$mn)
AI server revenue (US$mn)
Total server revenue (US$mn)
Source: IDC, company data, Nomura estimates
2024
11,444
877
12,321
85,037
107,476
192,513
9%
130%
13%
11%
182%
68%
Current forecast
2025
13,600
1,475
15,075
107,895
188,206
296,101
19%
68%
22%
27%
75%
54%
2026F
17,820
2,462
20,282
180,680
335,049
515,728
31%
67%
35%
67%
78%
74%
2027F
22,490
3,523
26,013
258,772
590,571
849,343
26%
43%
28%
43%
76%
65%
Change
2026F
14%
1%
12%
48%
12%
22%
(USDbn)
1,000
900
800
700
600
500
400
300
200
100
72%
80%
Fig. 70: Server supply chain
2023
У-у
90%
80%
70%
60%
50%
(USDbn)
600
500
400
у-У
160%
140%
120%
100%
+147bn
180%
160%
140%
120%
| System/board | Amazon | Microsoft | Meta | NVIDIA AI GPU | AMD AI GPU | Tesla/xAI | Dell | HPE | ||
|---|---|---|---|---|---|---|---|---|---|---|
| ODM/EMS | CPU/general server | Quanta, Hon Hai, Inventec, Wiwynn | Hon Hai, Wiwynn, Inventec, Quanta, Lenovo | Quanta, Inventec, Hon Hai, Celestica | Wiwynn, Quanta | N.A. | N.A. | Hon Hai, Wistron Inventec, Compal | Inventec, Hon Hai, Wistron | |
| ODM/EMS | AI ASIC | Wiwynn (cards, L6, L10 racks), Accton (cards, L6), Fabrinet (L6) Jabil, Flex (L10 racks) | Quanta? | Celestica, Flex | Quanta (Iris), Celestica, Wiwynn (old gen) | N.A. | N.A. | Dojo: Wistron (baseboard) | ||
| ODM/EMS | GPU (NV, AMD, etc.) | Quanta | Hon Hai (GB200/300, VR200), Quanta (potential 2nd source?) | Quanta (GB200/300), Hon Hai (VR200) | Quanta (GB200, GB300), Hon Hai (GB300), potentially Wiwynn? | Hon Hai (module/cards/ switches), Wistron (module/baseboard) | Wistron (baseboard), Sanmina, Wiwynn, others | Dell, Lenovo, Supermicro | Wistron (L10) Rack in house | |
| Chassis | Chassis | Chenbro, AVC, Hon Hai | Uneec, ? | N.A. | N.A. | |||||
| Server Slide Rail | Server Slide Rail | King Slide, Repon, Fositek | King Slide, Repon | King Slide, ? | King Slide | |||||
| Power supply | Power supply | Lite-On Tech, Flex power, AEIS, Megmeet, and etc | Lite-On Tech, Flex power, AEIS, Megmeet, and etc | Lite-On Tech, Flex power, AEIS, Megmeet, and etc | Lite-On Tech, Flex power, AEIS, Megmeet, and etc | Lite-On Tech, Flex power, AEIS, Megmeet, and etc | Lite-On Tech, Flex power, AEIS, Megmeet, and etc | Lite-On Tech, Flex power, AEIS, Megmeet, and etc | Lite-On Tech, Flex power, AEIS, Megmeet, and etc | Lite-On Tech, Flex power, AEIS, Megmeet, and etc |
| BBU | BBU | Lite-On (AES battery), Delta (Dynapack), Panasonic | Panasonic | Delta (Dynapack), Panasonic | Many in RVL | |||||
| CPU sockets | CPU sockets | Lotes, FIT, TE, Amphenol | Lotes, FIT, TE, Amphenol | Lotes, FIT, TE, Amphenol | Lotes, FIT, TE, Amphenol | Lotes, FIT, TE, Amphenol | Lotes, FIT, TE, Amphenol | Lotes, FIT, TE, Amphenol | Lotes, FIT, TE, Amphenol | Lotes, FIT, TE, Amphenol |
| Switch | Switch | Accton, Celestica | Cisco (Wistron?), Arista? | Celestica | Accton, Celestica? | Hon Hai | ||||
| Thermal | Thermal | (Thermal Module - air cooling) AVC, Auras, Nidec-CCI, CoolerMaster, Hon Hai (Cold plates): AVC, CoolerMaster, Auras, Delta, Furukawa, Boyd, etc. (CDU): Vertiv, Motivair, CoolIT, Delta, Quanta, Nidec, Auras etc. (CDM): Kaori, Auras, CoolerMaster (Heat spreader) Jentech | (Thermal Module - air cooling) AVC, Auras, Nidec-CCI, CoolerMaster, Hon Hai (Cold plates): AVC, CoolerMaster, Auras, Delta, Furukawa, Boyd, etc. (CDU): Vertiv, Motivair, CoolIT, Delta, Quanta, Nidec, Auras etc. (CDM): Kaori, Auras, CoolerMaster (Heat spreader) Jentech | (Thermal Module - air cooling) AVC, Auras, Nidec-CCI, CoolerMaster, Hon Hai (Cold plates): AVC, CoolerMaster, Auras, Delta, Furukawa, Boyd, etc. (CDU): Vertiv, Motivair, CoolIT, Delta, Quanta, Nidec, Auras etc. (CDM): Kaori, Auras, CoolerMaster (Heat spreader) Jentech | (Thermal Module - air cooling) AVC, Auras, Nidec-CCI, CoolerMaster, Hon Hai (Cold plates): AVC, CoolerMaster, Auras, Delta, Furukawa, Boyd, etc. (CDU): Vertiv, Motivair, CoolIT, Delta, Quanta, Nidec, Auras etc. (CDM): Kaori, Auras, CoolerMaster (Heat spreader) Jentech | (Thermal Module - air cooling) AVC, Auras, Nidec-CCI, CoolerMaster, Hon Hai (Cold plates): AVC, CoolerMaster, Auras, Delta, Furukawa, Boyd, etc. (CDU): Vertiv, Motivair, CoolIT, Delta, Quanta, Nidec, Auras etc. (CDM): Kaori, Auras, CoolerMaster (Heat spreader) Jentech | (Thermal Module - air cooling) AVC, Auras, Nidec-CCI, CoolerMaster, Hon Hai (Cold plates): AVC, CoolerMaster, Auras, Delta, Furukawa, Boyd, etc. (CDU): Vertiv, Motivair, CoolIT, Delta, Quanta, Nidec, Auras etc. (CDM): Kaori, Auras, CoolerMaster (Heat spreader) Jentech | (Thermal Module - air cooling) AVC, Auras, Nidec-CCI, CoolerMaster, Hon Hai (Cold plates): AVC, CoolerMaster, Auras, Delta, Furukawa, Boyd, etc. (CDU): Vertiv, Motivair, CoolIT, Delta, Quanta, Nidec, Auras etc. (CDM): Kaori, Auras, CoolerMaster (Heat spreader) Jentech | CoolIT, Motivair, Lite-On | |
| TPUs, AI ICs, AI GPUs | TPUs, AI ICs, AI GPUs | Amazon Microsoft Google Meta NVIDIA AI GPU AMD AI GPU Tesla/xAI | Amazon Microsoft Google Meta NVIDIA AI GPU AMD AI GPU Tesla/xAI | Amazon Microsoft Google Meta NVIDIA AI GPU AMD AI GPU Tesla/xAI | Amazon Microsoft Google Meta NVIDIA AI GPU AMD AI GPU Tesla/xAI | Amazon Microsoft Google Meta NVIDIA AI GPU AMD AI GPU Tesla/xAI | Amazon Microsoft Google Meta NVIDIA AI GPU AMD AI GPU Tesla/xAI | Amazon Microsoft Google Meta NVIDIA AI GPU AMD AI GPU Tesla/xAI | ||
| IC partner | IC partner | Marvell, Alchip | GUC, Marvell | Broadcom, MediaTek, Marvell, GUC | Broadcom | Broadcom, Alchip, GUC | ||||
| Foundry | Foundry | TSMC | TSMC | TSMC | TSMC | TSMC | TSMC | TSMC, Samsung Foundry | ||
| IC substrate | IC substrate | Unimicron, SEMCO | Unimicron? | Unimicron, Toppan, NYPCB, ZDT? EMIB-T: Ibiden, Unimicron, Shinko | Unimicron, others? | Ibiden, Unimicron, Kinsus, SEMCO, ZDT? | MIxxx: AT&S, Ibiden | SEMCO, Kinsus? | ||
| Packaging | Packaging | TSMC, ASE, Intel (EMIB) | TSMC, Amkor | TSMC, Intel (EMIB- T)? | TSMC, Intel (EMIB)? | TSMC, UMC (2.5D interposer), SPIL, Amkor | TSMC, SPIL | TSMC | ||
| Testing | Testing | TeraPower, Amkor, SPIL | KYEC?, ASE? | KYEC, TeraPower, ASE | KYEC? | KYEC | SPIL, Tongfu? | KYEC | ||
| Test interface | Test interface | Probe card: MPI, TPI | Probe card: MPI | Probe card: MPI, CHPT+TPI, KSMT? Socket: WinWay | Probe card: MPI | Probe card: RDA/CHPT +TPI FT socket: WinWay SLT socket: IDI | FT/SLT socket: WinWay/IDI | Probe card: CHPT | ||
| CCL/PCB | CCL/PCB | Amazon (AI ASIC) | Microsoft | Google (AI ASIC) | Meta | NVIDIA AI GPU | AMD AI GPU | Tesla/xAI | Dell | HPE |
| CCL AI GPU OAM | CCL AI GPU OAM | Panasonic, EMC | Panasonic, EMC | Panasonic, EMC | Panasonic, EMC | Doosan | Doosan | Doosan | Doosan | Doosan |
| HDI or PCB CCL | Shengyi, ZDT, UMTC, others? EMC, TUC | EMC, TUC? | Panasonic, EMC | EMC | Unimicron, VGT EMC, Shengyi | EMC, Doosan | ||||
| AI GPU UBB, CPU/switch boards | PCB | Shengyi, GCE, First Hi-tec, others? | GCE | ISU (major), WUS, VGT, TTM, GCE, ZDT | WUS, TTM, ISU | VGT, WUS, TTM | SCC | |||
| General/CPU server | CCL | Purley: ITEQ, TUC, Whitley: ITEQ, EMC, others Eagle Stream: EMC, ITEQ, others | Purley: ITEQ, TUC, Whitley: ITEQ, EMC, others Eagle Stream: EMC, ITEQ, others | Purley: ITEQ, TUC, Whitley: ITEQ, EMC, others Eagle Stream: EMC, ITEQ, others | Purley: ITEQ, TUC, Whitley: ITEQ, EMC, others Eagle Stream: EMC, ITEQ, others | Purley: ITEQ, TUC, Whitley: ITEQ, EMC, others Eagle Stream: EMC, ITEQ, others | Purley: ITEQ, TUC, Whitley: ITEQ, EMC, others Eagle Stream: EMC, ITEQ, others | Purley: ITEQ, TUC, Whitley: ITEQ, EMC, others Eagle Stream: EMC, ITEQ, others | Purley: ITEQ, TUC, Whitley: ITEQ, EMC, others Eagle Stream: EMC, ITEQ, others | Purley: ITEQ, TUC, Whitley: ITEQ, EMC, others Eagle Stream: EMC, ITEQ, others |
| PCB | GCE, Tripod, Hannstar, ZDT, others | GCE, Tripod, Hannstar, ZDT, others | GCE, Tripod, Hannstar, ZDT, others | GCE, Tripod, Hannstar, ZDT, others | GCE, Tripod, Hannstar, ZDT, others | GCE, Tripod, Hannstar, ZDT, others | GCE, Tripod, Hannstar, ZDT, others | GCE, Tripod, Hannstar, ZDT, others | GCE, Tripod, Hannstar, ZDT, others |
Source: Company data, Nomura research
Fig. 71: Top-5 CSP capex consensus
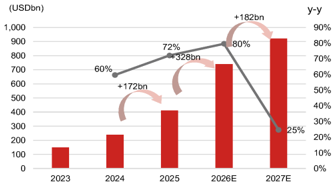
Source: Bloomberg Finance L.P., Nomura research
142%
+168n
+153bn
(USDbn)
700
600
500
400
Fig. 72: nVidia's data center sales consensus
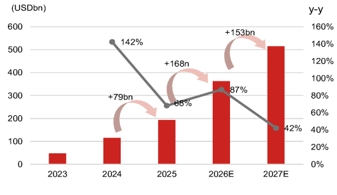
Source: Bloomberg Finance L.P., Nomura research
182%
+256bn
Fig. 73: Our AI server revenue forecasts
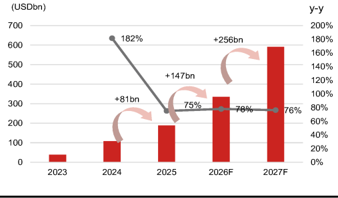
Source: Nomura estimates
1,200
1,000
800
600
400
200
0
Fig. 74: US top CSPs' capital spending
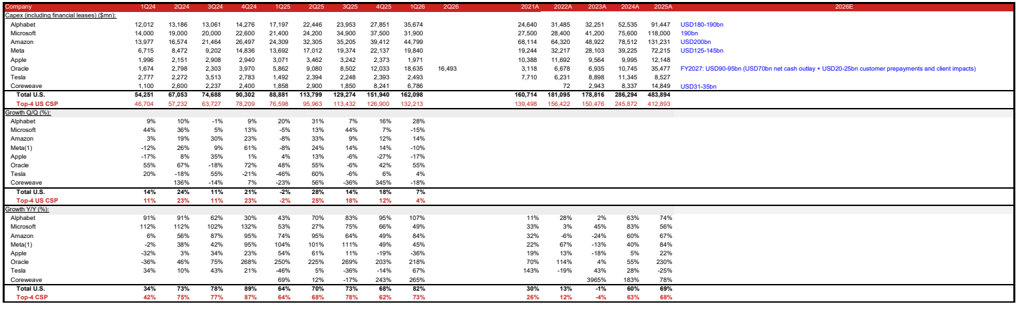
| Company Capex (including financial leases) ($mn): |
|---|
Source: Company data, Bloomberg Finance L.P., Nomura research
Fig. 75: Top 5 Hyperscalers' FCF, based on consensus capex from Fig. 71
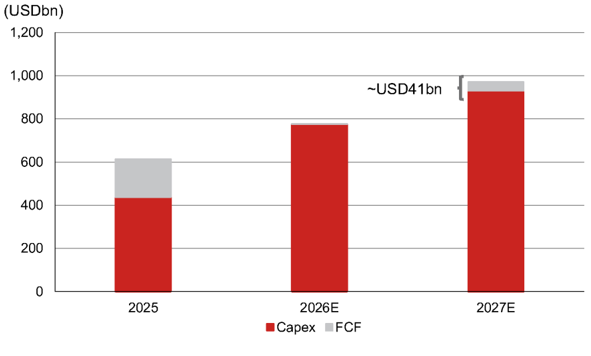
Source: Bloomberg Finance L.P., Nomura research
(%)
6.5
6
5.5
12,000
4
3.5
10,000
3
2.5
2
8,000
1.5
2024
6,000
4,000
2,000
Nov-20
30yr cash bonds - OIS
More datapoints supporting a stronger 2027
Swaps richen
Our refreshed data center tracking analysis
It's all about Al indicated increasing Al hardware demand
across 2026-2030F, but still a stronger
We would be buyers on
2027F than 2026F with a better mic weakness for the rest of 2024
(vs. most of the time through
2023 our stance being active
60
buyers)
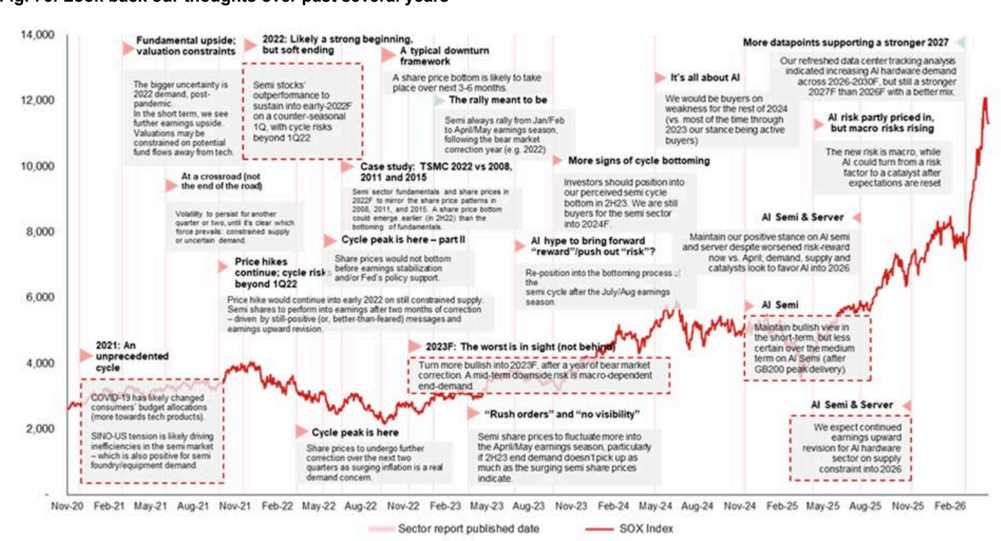
Source: Nomura research
Nomura strategist Naka Matsuzawa recently provided a somewhat contrarian macro view in a 19 June report : regarding interest rates and rate hikes, the market currently expects about 1.5 US rate hikes before year-end followed by cuts, whereas the median FOMC dot plot projects one "insurance" hike in 2026 and one cut each in 2027 and 2028, moving toward a 3.1% neutral rate. However, our strategist expects the Fed to keep rates unchanged in 2026 and warns that AI-driven economic acceleration could force the Fed into a normal tightening cycle, turning precautionary insurance hikes into earnest, consecutive rate increases. In terms of yields, current US two-year real yields are near 2.00%, and if the Fed proceeds with earnest hikes of at least 100bp, 10-year Treasury yields would likely far exceed 5.00% ; as expectations emerge for a global economic recovery, which is a major contender for the next market theme, yields will face upward pressure globally, but differences in fiscal and monetary policy stances across countries should be reflected in the extent of yield increases and the shape of yield curves. Yield curves in the US and Europe would likely bear flatten, while Japan's yield curve would bear steepen. Additionally, the Fed projects the US unemployment rate at 4.3% for both 2026 and 2027, and 4.2% in 2028, indicating that FOMC members are largely unconcerned about economic or inflation overheating.
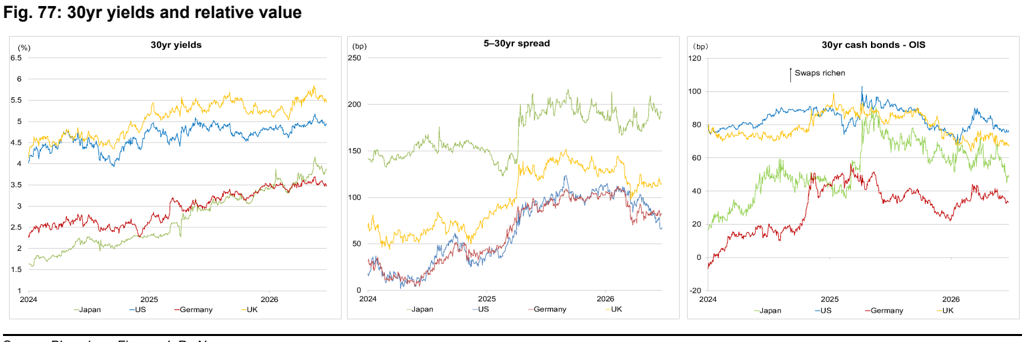
Source: Bloomberg Finance L.P., Nomura
Al risk partly priced in, but macro risks rising
The new risk is macro, while valuation constraints
aluv
(bp)
250
2022: Likely a strong beginning.
5-30yr spread
A typical downturn framework
Appendix: Reference charts
Valuations may be to April/May earnings season,
Fig. 76: Look back our thoughts over past several years
but soft ending
(bp)
120
(%)|
2.8
2.6
2.4
2.2
2
1.8
1.6
1.4
1.2
0.8
0.6
0.4
(%)|
4.4
Fig. 78: G3 policy rate expectations
-26/212|
(%)
3.2
3
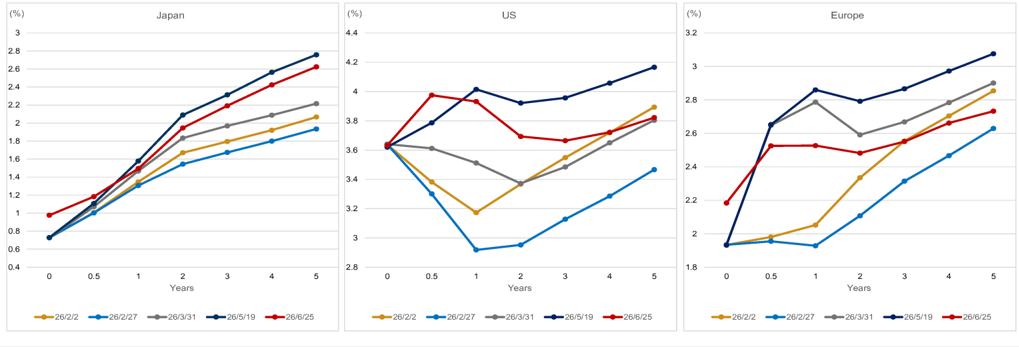
Note: OIS forward rates for each maturity. Source: Bloomberg Finance L.P, Nomura
US
Europe
Appendix: other critical developments and key quotes from major server CPU players
CPU cores within single CPU chip will also increase
Arm believes the increased CPU increased demand could be reflected in more CPU cores within one chip, rather than in chip volume. As well, more cores inside the silicon is driving up CPU ASP. Intel has also witnessed a significant core count increase.
- 'We are seeing literally not only an explosion of CPU demand, but one of the areas that we're seeing growth in terms of CPU is number of cores per CPU.' (Rene Haas, Arm) ·
- 'Maybe a more straightforward way to think about it is each of these agents are running a batch or running a job themselves. There is certainly a level of complexity in terms of the way the branch prediction coding is handled and essentially the way you would code the example. But if you just think about the nature of an asynchronous workload for an agent, it runs a job, it does some scheduling, it stops, it waits, it pauses. It's actually pretty good for a single core design to handle that as opposed to having multi-cores having to run that all together in unison. It's going to be more power efficient if you run it through a single core. And the more cores you have, in theory, the more batches you can run. So our viewpoint is very much one of more cores is better. And that's why I think you're going to see increasingly larger core counts in these CPU chips. So you'll see more CPUs cores being shipped. TAM, whatever the number is, largely, it's going to be driven by the fact that these CPU chips are going to have lots of CPU cores, which will drive ASP up. But I think it' s a per core best job, not multiple instructions across multiple cores.' (Rene Haas, Arm) ·
- 'Obviously, core count is increasing significantly in the data center CPU space.' (David Zinsner, Intel) ·
More players actively joining the field
We have seen more engagement between large names in the CPU world. Meta is aggressively sourcing CPUs from third parties such as AWS and Arm. Qualcomm was once a fabless company specializing in smartphone/mobile chips. It tried to break into datacenter areas through its AI200/AI250 accelerators in Oct-2025. Further, it announced that the company had developed a dedicated agentic CPU in Apr-2026, founded on its expertise in consumer SoCs. Another remarkable move, in our view, is Arm venturing into providing chips, from selling silicon IPs in Mar-2026. Its first product - Arm AGI CPU for datacenters - is anchoring key clients such as Meta and Open-AI, and the company has already announced there will be iterative development of the product in its multigenerational roadmap.
Meta signed an agreement with AWS to power agentic AI on Amazon's Graviton chips (Apr-2026)
- 'The deployment starts with tens of millions of Graviton cores, with the flexibility to expand as Meta's AI capabilities grow. The deal reflects a shift in how AI infrastructure gets built: while GPUs remain essential for training large models, the rise of agentic AI is creating massive demand for CPU-intensive workloads - realtime reasoning, code generation, search, and orchestrating multi-step tasks.' (Amazon) ·
Qualcomm is developing a dedicated CPU for agentic experiences in the data center, and will provide more details in June (Apr-2026)
- 'Agent orchestration is predominantly CPU- bound and Qualcomm has the world's best-performing CPU across smartphones, PCs, auto and soon the data center.' (Cristiano Amon, Qualcomm) ·
- Qualcomm and Meta announced a strategic multi-generation agreement on data center CPUs on June 2026. The C1000 CPU is planned to power Meta's nextgeneration server fleet, underscoring the growing importance of high-performance, power-efficient compute in large-scale scale-out environments. ·
Multi-generation portfolio with hyperscaler wins
Support for air- and liquid-cooled rack offerings
Agentic CPU
Hieh throughput for
Al use cases
INTRODUCING
Qualcomm
Dragonfly
C1000 CPU
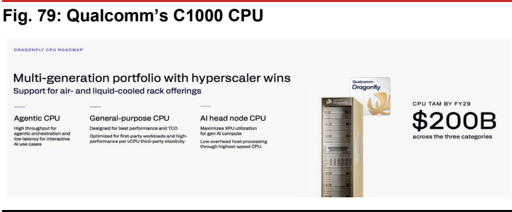
Source: Qualcomm, Nomura research
Fig. 80: Qualcomm's C1000 CPU
i oldency
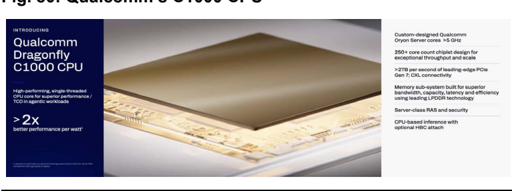
Source: Qualcomm, Nomura research
Arm announced an AGI CPU in its ARM Everywhere event (Mar-2026)
- 'These agentic workloads require CPUs to coordinate tasks, move data, manage memory, enforce security and orchestrate workaround accelerators. As Agentic AI scales, data centers will require more than 4x today's CPU capacity, creating a data center CPU market opportunity of more than $100 billion by 2030 .' (Rene Haas, Arm) ·
- Raised the revenue guidance from USD1bn in Mar-26 to USD2bn in May-26: 'Customer response to the Arm AGI CPU has been very strong. We now have more than USD2bn in customer demand across fiscal 2027 and fiscal 2028. This is more than double what we stated at launch.' (Rene Haas, Arm) ·
Key comments from Intel and AMD
As Intel and AMD are two dominant players in server CPUs, their comments on CPUs are critical for monitoring technical trends and supply/demand status. Both companies emphasized the growing importance of CPUs in a datacenter, commenting on higher CPU to GPU ratios, and AMD particularly raised CPU TAM from USD60bn in Nov-24 to USD120bn+ by 2030 in May-26.
Intel:
- 'In recent months, we have seen clear signs that the CPU is reinserting itself as the indispensable foundation of the AI era. CPU now serves as the orchestration layer and critical control plane for the entire AI stack.' ·
- ' The most important is the reinforced learning, the orchestration of all the different agents and then also the optimizing for some of the workload and CPU is even more important. ' ○
- 'The backbone of AI computing in production remain a CPU anchored architecture. That is good news for the x86 ecosystem.' ·
- CPU to GPU ratio: ·
- 'Customers are deploying server CPUs along accelerators in the ratio that is moving back towards CPU.' ○
- ' If you look at training solutions, they're generally running in the kind of 7 to 8 GPUs to 1 CPU. ' ○
- ' As we look into inference, it's probably getting into like the 3 to 4:1 kind of level. And as you get into agentic and multi-agent, it's one potentially even flip in the other direction a little bit. Inference side, I think in terms of orchestration, control plane and also managing all the different agent with data, CPU is much more efficient. So I think the ratio of CPU to GPU used to be 1 and 8, and now it's 1:4 and I think towards parity or even better. So I think the demand is very strong. ' ○
- ' And now even some of them tell me it's 4:1. So 4 CPU to 1 GPU, so the inference and agent. ' ○
- ' Our outlook for server CPU demand has improved over the last 90 days, and we expect a strong year of double-digit unit growth for the industry and for us with momentum extending into 2027. ' ·
- Unit vs ASP: 'We think the unit volume is going to be the biggest driver. Now that's on an ASP per core basis. Obviously, core count is increasing significantly in the data center CPU space. As core count increases, we get the lift on the ASPs from that, and that obviously is meaningful. ' ○
CPU TAM BY FY29
Gon7: X. connectivit
AMD:
- Raised server CPU TAM forecast from USD60bn in Nov-24 to USD120bn+ by 2030E in May-26 ·
○
- ' W e outlined the server CPU market growing at approximately 18% annually over the next 3 to 5 years. Based on the demand signals we are seeing today and the structural increase in CPU compute requirements driven by Agentic AI, we now expect the server CPU TAM to grow at greater than 35% annually, reaching over $120 billion by 2030. '
- ' O ver the last few months, as we've talked to our customers and we've seen how AI adoption is really unfolding, we're seeing significant more CPU demand from really every major cloud provider as well as enterprise customers. And the way that comes across is as AI adoption scales, you need more inferencing. As inferencing scales and you have more agents and Agentic AI, they all require CPUs for all of the orchestration and the data processing and these other tasks. ' ○
- Three categorizes to drive TAM upward revision: ○
- General purpose compute TAM: increasing at low double digits ○
- Head nodes that really support the AI accelerators: also growing but smalle ○
- CPUs just for all of the Agentic AI work: really stemming from all of the Agentic processes. ○
- ' W hat we see going forward is as core counts increase, obviously, we will see ASP increase. And that's the direction that we're going in as we go forward. But the largest portion of this is the Agentic AI, the CPUs that are serving these Agentic AI workloads in terms of the TAM increase.'
○
- Competition: ' I think you're going to see people actually use x86 and ARM for many of the large hyperscalers. And even for those who are developing their own, they're still buying lots of CPUs in the merchant market for the reason that I just stated, which is unique different CPUs for the different types of workloads, and there's very high demand at the moment. ' ·
- CPU function ·
- ' A s AI adoption scales, demand is increasing, not only for accelerators, but also for the high-performance CPUs that power and orchestrate those workloads. ' ○
- ' Inferencing and Agentic AI are increasing the need for server CPU compute as these workloads require additional CPU processing for orchestration, data movement and parallel execution in addition to serving as the head nodes for GPUs and accelerators. As a result, we are seeing both stronger near-term demand and deeper engagement with customers on long-term capacity planning. ○
- Agentic CPU growth is additive to AI TAM (not at the expense of GPU) ·
- ' I t's largely additive to the TAM. So you should think about we need all of the accelerators to run these foundational models, and then as these agents do work, they spawn more CPU tasks. So I would say largely incremental. The key is to make sure -- what we're seeing is in these deployments, the key is to make sure the ratio of CPUs to GPUs are the right ratio. So if you're installing a gigawatt of compute, there's a percentage of CPU as part of that gigawatt will increase. ' ○
- CPU to GPU ratio: ' W e certainly see the movement towards where in the past, the CPU to GPU ratio was primarily just as a host node in like a 1:4 or 1:8 configuration node, now changing and getting closer to a 1:1 configuration or even -- you can even imagine if you get lots and lots of agents that you could have more CPUs and GPUs. ·
- ' T he key is that everyone is now planning and thinking about CPUs at the same time that they're thinking about their accelerator deployments, which is a good thing. ' ○
- ' T he good thing about this is we're now talking about '27 CPU demand, we're talking about '28 CPU demand. And so that allows us to just plan much better as we go forward. ·
Appendix: CSP comments on AI and investments
Fig. 81: Microsoft's relevant comments on AI business/investments
| Date | Microsoft • Capital expenditures in Q3 were $31.9 billion, a sequential decrease attributed to normal variability from cloud infrastructure build-outs and finance |
|---|---|
| 4/29/2026 | lease timing. • Approximately two-thirds of Q3 CapEx was for short-lived assets, primarily GPUs and CPUs, with the rest for long-lived assets supporting monetization over 15 years. • Capital expenditures are expected to increase to over $40 billion in Q4, the sequential increase in Q4 CapEx includes approximately $5 billion from higher component pricing, impacting short-lived assets. • 2026 CapEx projected at approximately $190 billion, including $25 billion from higher component pricing. • Despite significant investments and efforts to bring GPU, CPU, and storage capacity online faster, Microsoft expects to remain constrained at least through 2026. • The AI business surpassed $37 billion in annualized revenue run rate, growing 123% year-over-year. • Management noted that AI business margins have been better than those seen during the cloud transition, attributing this to business models reflecting application value and usage-based pricing. The company's Maia 200 AI accelerator offers over 30% improved tokens per dollar compared to the latest silicon in its fleet. • Management expressed confidence in the return on AI investments, citing strong demand signals, increasing product usage, and the expansive TAM. |
| 1/28/2026 | mainly for large data centers. Customer demand continues to exceed supply. • Investors expressed concerns that capex is growing faster than Azure growth. Management noted that CapEx spending is diversified, supporting first-party AI applications like M365 Copilot and GitHub Copilot, as well as R&D, not solely Azure. • Servers are capitalized over six years, but the average duration of RPO is only 2.5 years. Investors are concerned how the company is able to capture sufficient revenue over the six-year use life of the hardware. The company noted the average duration is 2.5 years, Azure contracts are relatively longer, and those GPUs are already contracted for most of their useful life, therefore the risk is low. • Management identified tokens per watt per dollar as a new key infrastructure optimization metric in the AI era, citing a "50% increase in throughput" on OpenAI inferencing due to infrastructure advances. • MSFT added nearly one gigawatt of total capacity in Q2. • MSFT brought online their Maya 200 accelerator. Maya 200 delivers 10+ flops at FP4 precision with over 30% improved TCO compared to the latest generation hardware in its fleet. • Microsoft Cloud revenue surpassed $50 billion, up 26% year-over-year, reflecting strong platform strength and accelerating AI demand. • Cloud gross margin percentage is expected to be roughly 65%, down year-over-year due to continued AI investments. • Management believe AI diffusion is expected to have a broad GDP impact, substantially growing the total addressable market across the tech stack. |
| 10/29/2025 | • Capital expenditures were $34.9B in Q1, with roughly half spent on short-lived assets (mainly GPUs/CPUs) and half on long-lived datacenter assets. Capital expenditure growth in FY26 is expected to exceed FY25's growth rate. • Microsoft is seeing strong demand for AI capabilities, with Microsoft Cloud revenue surpassed $49 billion, up 26% year-over-year and commercial RPO increased over 50% to nearly $400 billion with a weighted average duration of only two years. Microsoft is increasing spend on GPUs and CPUs. Total spend will increase sequentially, the company expects the FY26 growth rate to be higher than FY25. • The company is rapidly expanding AI infrastructure capacity, planning to increase AI capacity by over 80% this year and double data center footprint over next two years • Microsoft improved AI model efficiency, increasing token throughput for GPT models by over 30% per GPU • The company is experiencing capacity constraints for AI infrastructure that are expected to continue through the fiscal year |
| 7/30/2025 | • Q1 capital expenditures are expected to exceed $30 billion due to strong demand • Azure revenue growth is expected to be approximately 37% in constant currency for Q1, with capacity constraints likely through first half of fiscal year • Microsoft Cloud gross margin was 68%, down 2 points year-over-year, impacted by AI infrastructure scaling but partially offset by efficiency gains in Azure and M365 Commercial cloud • Every Azure region is now AI first, all of MSFT's regions can now support liquid cooling, increasing the fungibility and the flexibility of its fleet, and MSFT are driving and riding a set of compounding S-curves across silicon systems and models to continuously improve efficiency and performance for customers. • Strong customer migrations to Azure continued, with notable examples like Nestle's large-scale migration • Over half of capex spend was on long-term assets for 15+ year monetization, with remaining spend primarily on servers including CPUs and GPUs • Microsoft announced the first operational Level 2 quantum computer deployment with Atom Computing • the server to cloud transition was an expansion of essentially usage of servers. That is essentially what happened with the cloud. The market was a certain size, whereas with the cloud, customers could buy it with flexibility, they could burst, and they could spin up and spin down. The expertise required came down. So it was just orders of magnitude. That's what's happening. So if you even subscribe to this point of view that intelligence is basically log of compute, that means compute is going to grow, and you've got to use it as efficiently as possible to just keep creating intelligence. • Azure revenue growth is expected to be 34-35% in constant currency for Q4, with some AI capacity constraints expected beyond June |
| 4/30/2025 | • Capital expenditures are expected to increase sequentially in Q4, though H2 total CapEx guidance remains unchanged from January • Microsoft Cloud's AI services drove significant growth, with AI contributing 16 points to Azure's 33% revenue growth • The company is seeing rapid improvements in AI model capabilities and efficiency, with model performance doubling every six months and cost per token being cut in half • The company introduced new AI capabilities including deep reasoning agents and custom agents, with over 1 million custom agents created this quarter • Microsoft is experiencing capacity constraints in AI services due to strong demand • Cloud migrations showed accelerating demand, with companies like Abercrombie & Fitch, Coca-Cola and ServiceNow expanding their Azure footprints • MSFT continue to expand data center capacity. This quarter alone, MSFT opened DCs in 10 countries across four continents. Model capabilities are doubling in performance every six months, thanks to multiple compounding scaling laws. • MSFT continue to optimize and drive efficiencies across every layer from DC design to hardware in silicon to system software to model optimization, all towards lowering costs and increasing performance. • MSFT have reduced dock-to-lead times for new GPUs by nearly 20%. Across its blended fleet, where MSFT have increased AI performance by |
| 1/30/2025 | • Microsoft Cloud gross margin was 70%, down 2 points year-over-year due to AI infrastructure scaling • Operating margins improved 2 points year-over-year to 45%, better than expected due to efficiencies while investing in AI • Microsoft's AI business surpassed $13 billion in annual revenue run rate, growing 175% year-over-year • The company is seeing significant efficiency gains in AI training and inference, with typical improvements of 2x price performance per hardware generation and 10x per model generation through software optimizations • Microsoft expects to be roughly in line with near-term AI demand by the end of FY '25 as capacity investments come online • The company has significantly expanded its data center capacity, more than doubling it over the past three years and adding more capacity in the last year than any other year in their history • Major enterprise customers continue to migrate workloads to Azure, with UBS notably migrating mainframe workloads involving nearly 400 billion records and 2 petabytes of data • Enterprises are beginning to move from proof of concepts to enterprise-wide deployments to unlock the full ROI of AI. • you don't want to buy too much of anything at one time, because the Moore's Law every year is going to give you 2x, your optimization is going to give you 10x. You want to continuously upgrade the fleet, modernize the fleet, age the fleet, and at the end of the day, have the right ratio of monetization and demand-driven monetization to what you think of as the training expense. So I feel very good about the investment we are making, |
Source: Company data, Nomura research
Fig. 82: Alphabet's relevant comments on AI business/investments
| Date | Alphabet |
|---|---|
| 4/30/2026 | • Full year 2026 CapEx guidance updated to $180-190 billion, increased from $175-185 billion. CapEx for 2027 is expected to significantly increase compared to 2026, driven by AI compute demand. • Management noted tremendous demand for AI infrastructure, including significant interest in TPU offerings • TPU 8t provides high-performance model training with three times the processing power of Ironwood and two times the performance. TPU 8i delivers cost-effective, low-latency inference with 80% better performance per dollar than the prior generation. • Cloud revenue accelerated 63% YoY to $20bn, with backlog of $462 billion. Cloud margins are expanding, despite a market thesis that AI revenues generally have lower margins. • Enterprise AI solutions have become the primary growth driver for cloud for the first time. Gemini Enterprise paid monthly active users grew 40% QoQ. • The company uses ROIC framework to allocate resources and evaluate large AI deals in a constrained environment. • Google is winning new customers faster, with new customer acquisition doubling compared to the same period last year. • AI is driving increased Search usage and query volume, including commercial queries, which expands monetization opportunities. • AI improves ad relevance and the ability to deliver ads on longer, more complex searches, which were previously difficult to monetize. • Subscriptions saw their strongest quarter ever for consumer AI plans, driven by Gemini app adoption, with paid subscriptions reaching 350 million. |
| 2/5/2026 | • First-party models now process more than 16 billion tokens per minute. • Gemini App has over 750 million monthly active users. The company is seeing significantly higher engagement per user, especially since the launch of Gemini 3. Gemini, now process over 10 billion tokens per minute, up from 7 billion last quarter. • 2025 CapEx was $91.4 billion, Q4 CapEx was $27.9 billion, primarily invested in technical infrastructure, with approximately 60% in servers and 40% in data centers and networking equipment. • 2026 CapEx investments to be in the range of $175 billion to $185 billion (representing a 97% increase yoy), ramping over the year. These CapEx investments will support AI compute capacity for Google DeepMind, user experience improvements and advertiser ROI in Google Services, Cloud customer demand, and strategic investments in Other Bets. • For 2026, over half of the company's ML compute investment is expected to be allocated to the Cloud business. • Cloud significantly accelerated with revenues growing 48%, now on an annual run rate of over $70 billion. Backlog grew by 55% quarter over quarter to $240 billion, representing a wide breadth of customers, driven by demand for AI products. • Google is winning customers faster. The number of deals in 2025 over $1 billion surpassed the previous three years combined. • Management highlighted the diversified revenue streams of Google Cloud and its AI-driven portfolio. Revenue comes from infrastructure, platforms, and AI-powered products and services, with Fourteen product lines each generate over $1 billion in annual revenue. • 95% of the top 20, and over 80% of the top 100 SaaS companies use Gemini. Gemini is becoming the AI engine for the world's most successful software companies. • AI Overviews and AI Mode drive greater Search usage and growth in overall queries, including commercial ones. • Management acknowledged being supply-constrained despite ramping up capacity, with 2026 CapEx focused on future needs and |
| 10/29/2025 | centers/networking) • CapEx guidance for 2025 was raised to $91-93 billion from previous $85 billion. Management expects a significant increase in CapEx for 2026 • The significant increase in investments in technical infrastructure will continue to put pressure on the P&L in the form of higher depreciation expenses and related data center operations costs such as energy. Given the overall increase in CapEx investments, Google expect the growth rate in depreciation to accelerate slightly in Q4. • Google Cloud delivered strong Q3 results with revenue growing 34% to $15.2B, driven primarily by GCP which grew faster than the overall cloud segment • New GCP customer acquisition increased by 34% year-over-year, with over 70% of existing customers using AI products • Cloud backlog grew significantly, up 46% quarter-over-quarter to $155B, driven primarily by enterprise AI demand • Enterprise AI products are generating billions in quarterly revenue, with strong growth in both AI infrastructure and solutions • Signed more billion-dollar cloud deals in the first 9 months of 2025 than in the previous two years combined • The company expects to remain in a tight demand-supply environment for cloud through Q4 and 2026 • The Gemini app now has over 650 million monthly active users, and queries increased by 3x from Q2. • Google now shipping the new A4X Max instances powered by NVIDIAGB300 to Cloud customers. Seventh-generation TPU, Ironwood, will be generally available soon. The company is investing in TPU capacity to meet the tremendous demand. Anthropic recently shared plans to access up to 1 million TPUs. • Processing over 1.3 quadrillion monthly tokens, more than 20x growth in a year, compared to 980 trillion in July . • AI is driving significant query growth in Search, with AI overviews and AI mode contributing to increased commercial queries • AI return is not just early signs because the company sees obvious return in the cloud business. |
| 7/24/2025 | - Additional server investments - Accelerated data center construction - Cloud customer demand • Further CapEx increase expected in 2026, with more details to come in future earnings calls • Google Cloud's operating margin expanded significantly from 11.3% to 20.7%, driven by strong revenue and continued efficiencies, though partially offset by higher infrastructure costs • Q2 was characterized by robust AI-driven growth across Alphabet, with AI positively impacting every part of the business • Usage metrics show strong AI adoption: - Processing over 980 trillion monthly tokens (doubled from 480 trillion announced in May) - Gemini app has 450M+ monthly active users - 50M+ people used AI meeting notes in Google Meet in June - AI infrastructure includes AI-optimized data centers and TPUs/GPUs - Research includes Gemini 2.5 family of models - Products/platforms include Workspace, Chrome, etc. • In Search, AI features are driving increased engagement: - AI Overviews drive 10%+ more queries globally - AI Mode has 100M+ monthly active users in US and India - Visual search through Google Lens grew 70% year-over-year • Cloud is seeing strong AI-driven demand: - 85,000+ enterprises using Gemini - 35x growth in Gemini usage year-over-year - Strong customer adoption of AI infrastructure and tools • The company is experiencing high demand but tight supply constraints, leading to increased CapEx investment of $85B (up from $75B) for 2025 Cloud has reached an annual revenue run rate of over $50B, with significant demand for AI products Nearly all GenAI unicorns use Google Cloud, with over 85,000 enterprises now building with Gemini Google Cloud see a tight demand-supply environment, and given that revenues are correlated with the timing of deployment of new capacity, |
| 4/25/2025 | • • • the company sees variability in cloud revenue growth rates depending on capacity deployment each quarter. Google expect relatively higher capacity deployment towards the end of 2025. • Google Cloud's operating margin expanded significantly from 9.4% to 17.8%, with the company focusing on productivity and efficiency improvements to offset rising expenses • Alphabet's differentiated full-stack AI approach continues to be central to their growth, with Gemini 2.5 achieving breakthrough performance • The company made significant infrastructure investments to support AI, including: - Over 2M miles of fiber network - New Ironwood TPUs with 10x compute improvement - Partnership with NVIDIA for latest GPUs • AI adoption metrics showed strong growth: - AI Studio and Gemini API users grew 200%+ since year start - All 15 Google products with 500M+ users now use Gemini - AI Overviews reached 1.5B monthly users • AI is driving significant improvements in advertising performance, with businesses using Demand Gen seeing 26% YoY increase in conversions per dollar spent • Internal use of AI at Google is growing, with over 30% of code checked in involving AI-suggested solutions • The company is experiencing tight demand-supply conditions in cloud, with revenue growth tied to capacity deployment timing |
| 2/4/2025 | • Google Cloud's operating margin improved substantially from 9.4% to 17.5% • Alphabet reported strong AI momentum across infrastructure, models, and product deployment • Developer adoption of Gemini models has doubled in six months • AI is being integrated across Google's major products and platforms • Google Cloud saw strong AI-driven growth • The company is investing heavily in AI infrastructure. Primarily for servers followed by data centers and networking. • 2.0 Flash thinking models are some of the most efficient models out there, including comparing to DeepSeek's V3 and R1. • The proportion of the spend towards inference compared to training has been increasing, which is good because obviously, inference is to support businesses with good ROIC. • Customer demand for AI infrastructure exceeded available capacity in Q4 2024 • Cloud customers consume more than eight times the compute capacity for training and inferencing compared to 18 months ago. • Vertex AI, Google's AI developer platform, saw substantial growth • The company is expanding its cloud infrastructure globally • The company is increasing capex investments to expand AI efforts, primarily for servers and data centers • The company is focused on organizational efficiency, including bringing AI research teams together and using AI tools to improve operations • Google Cloud's TPU infrastructure provides cost advantages that are passed on to customers through attractive pricing of Flash models, which |
Fig. 83: Amazon's relevant comments on AI business/investments
| Date | Amazon • Total company cash capital expenditures were $43.2 billion in Q1, primarily forAWS and generative AI to support strong customer demand. Amazon |
|---|---|
| 4/29/2026 | will continue to make significant investments, especially in AI, as management believe it to be a massive opportunity with the potential to drive long- term revenue and free cash flow. • Much of 2026 Capex will be installed in future years, management have high confidence this will be monetized well, as the company already has customer commitments for a substantial portion of it, and that it will yield compelling operating margins and ROIC. • AWS has to lay out cash for land, power, buildings, chips, servers, and networking gear in advance of when they can monetize it, typically 6 to 24 months before the company starts billing customers. However, these CapEx investments fund assets with many year useful lives, 30+ years for data centers, five to six years for chips, servers, and networking gear. The free cash flow and ROIC for these investments are cumulatively attractive after being in service. • However, in times of very high growth like now, where the CapEx growth meaningfully outpaces the revenue growth, the early years free cash flow is challenged until these initial tranches of capacity are being monetized and revenue growth outpaces CapEx growth. The company has been through this cycle with the first big AWS growth wave and likes the results. The company expects to feel similarly about this next wave with much larger potential downstream revenue and free cash flow. • The company sees a strong correlation between AI spend and coreAWS growth, as customers accelerating their AI transition to the cloud also increase their consumption of additional non-AI core services, with this trend expected to strengthen as more AI workloads move into production. • Amazon now have over $225 billion in revenue commitments for Trainium. Trainium2 chip has about 30% better price performance than comparable GPUs and is largely sold out. Trainium3, which just started shipping in 2026 and is 30% to 40% more price performant than Trainium2, is nearly fully subscribed, and much of Trainium4, which is still about 18 months from broad availability, has already been reserved. • Management noted AI is commonly seen as a GPU story, but the rise of agentic workloads, real-time reasoning, code generation, reinforcement learning, and multi-step task orchestration is driving massive CPU demand as well. • Amazon anticipates Trainium will save tens of billions in CapEx annually and provide several hundred basis points of operating margin advantage compared to relying on other chips for inference. • In 2025, the comppany delivered 4x improvements in Trainium 2's token throughput. Bedrock processed more tokens in Q1 than all prior years combined. • Three years afterAWS launched, it had a $58 million revenue run rate. In the first three years of this AI wave, AWS's AI revenue run rate is over $15 billion, nearly 260x larger. |
| 2/5/2026 | • Amazon expects to invest approximately $200 billion in 2026, primarily in AWS, driven by high demand for both core and AI workloads, with capacity being monetized as quickly as it can be installed. The company is confident these investments will yield strong returns on invested capital, leveraging its experience in forecasting demand and ensuring efficient capacity utilization in AWS. • The company is aggressively expanding AI capacity, added 1.2 gigawatts of power in Q4 and 3.9 gigawatts of power in the last 12 months, doubling 2022 levels, and expects to double it again by the end of 2027, with a current AWS backlog of $244 billion, up 40% year-over-year. • Trainium and Graviton now have a combined annual revenue run rate of over $10 billion and growing at a triple digit percentage year-over-year. • Trainium2 is fully subscribed with 1.4 million chips landed, and powers the majority of inference on Bedrock • Trainium3 is now delivering production workloads and seeing strong demand, with nearly all Trainium3 supply of chips expected to be committed by mid-2026. • Trainium4 is expected to start delivering in 2027, with 6 times the FP4 compute performance, 4 times more memory bandwidth, and 2 times more high memory bandwidth capacity than Trainium3. • Introduced Graviton5, AWS's most powerful and advanced CPU for a broad set of cloud workloads. Graviton is up to 40% more price-performant than leading x86 processors, and enables applications to run faster, reduce costs, and meet sustainability goals. •AWS revenue accelerated to 24% year-over-year, reaching a $142 billion annualized run rate, driven by core and AI services as customers modernize infrastructure and migrate workloads to the cloud. •AWS operating margin was 35% in Q4, up 40 basis points year-over-year, though management expects it to fluctuate due to investment levels in AI and depreciation. • Amazon Leo has over 20 launches planned in 2026 and more than 30 in 2027. |
| 10/31/2025 | • Q3 cash CapEx was $34.2B, with $89.9B spent year-to-date, primarily for AWS infrastructure and tech infrastructure for retail segments • Amazon expects full year cash CapEx to be approximately $125 billion in 2025, with increases expected in 2026. • Amazon views AI as a massive opportunity with potential for strong returns • AWS is seeing strong momentum in AI services including inference, training, Bedrock, and SageMaker • Amazon saw continued strong adoption of Trainium2, its custom AI chip, which is fully subscribed and a multi-billion-dollar business that grew 150% quarter over quarter. • Announced new Amazon EC2 P6e-GB200 UltraServers using NVIDIA Grace Blackwell Superchips, designed for training • Amazon's Trainium2 AI chips are showing strong performance metrics - it's a multi-billion dollar business growing 150% quarter-over-quarter, with price performance 30-40% better than alternatives • Project Rainier, a massive AI compute cluster, was launched with nearly 500,000 Trainium2 chips being used by Anthropic to build their Claude AI model • AWS is rapidly expanding capacity, adding 3.8 gigawatts of power in the past year with plans to double overall capacity by 2027 • The company believes AI and agentic commerce will transform online shopping, • Over 1.3 million sellers are using Amazon's generative AI capabilities to create better listings |
| 8/1/2025 | expense timing • Management expects AWS operating margins to fluctuate over time based on investment levels • AWS has built a large, fast-growing AI business with triple-digit year-over-year growth and more demand than current supply • Key AI hardware developments include Trainium2 chip deployment (used by Anthropic and Bedrock) and launch of new NVIDIA GPU-accelerated instances • Amazon is rolling out Alexa+, their next-generation AI-powered assistant, with positive early feedback from millions of US customers • Management believes AI will be the biggest technology transformation of our lifetime and will significantly change how work is done across all business functions • The company is monitoring potential cost impacts from tariffs but has not yet seen meaningful cost increases, though this could change as pre- bought inventory is depleted • AWS is experiencing more demand than available supply, particularly constrained by power infrastructure and chip availability • In cloud computing, 85-90% of global IT spending is still on-premises rather than in the cloud, representing a large untapped market opportunity • AWS is the primary driver of capex spending, with investments focused on: - AI services demand - Custom silicon like Trainium - Tech infrastructure for North America and International segments • For AWS, there are supply constraints in multiple areas, with power being the biggest constraint, followed by chips and server components |
| 5/2/2025 | • AWS margins hit almost 40% in Q1, with performance driven by strong growth combined with efficiency improvements in areas like server capacity optimization, networking, and power usage • Amazon is investing heavily in AI infrastructure, including: - Their custom AI chip Trainium2 which offers 30-40% better price performance versus GPU-based instances - Adding new foundation models to Amazon Bedrock including Anthropic's Claude 3.7, Meta's Llama 4, DeepSeek R1 and Mistral AI's Pixtral Large - Released Amazon Nova Sonic for speech-to-speech applications and Nova Act for web browser actions • Amazon believes AWS could become even larger than previously expected due to AI adoption • The company is focused on making AI more cost-effective, particularly reducing inference costs • Over 85% of global IT spending is still on-premises, representing a massive growth opportunity for cloud services • Amazon have a lot of investment in infrastructure going on and planned for the second half of the year. And are happy with the performance of the team with generating cost savings. |
| 2/7/2025 | margin headwinds in the short term, though long-term margins are expected to be comparable to non-AI business • AWS has a multi-billion dollar annualized revenue run rate in AI that is growing triple digits year-over-year, though growth is somewhat constrained by supply chain and capacity issues • Amazon believes AI represents the biggest technology shift since the internet, with virtually every application being reinvented with AI • Amazon launched custom AI chips called Trainium2 that offer 30-40% better price performance than other GPU options, with companies like Adobe and Anthropic adopting them • Amazon is seeing significant productivity improvements from AI applications, including: - 500 basis points better customer satisfaction with AI-powered chatbots - 10% better inventory forecasting and 20% better regional predictions - Enhanced robotics control • Amazon launched its own family of frontier AI models called Nova, which offers lower latency and 75% lower prices than other models • Companies are increasingly moving workloads to the cloud to leverage generative AI capabilities • Supply chain constraints, particularly in chips and power availability, are currently limiting AWS's potential growth rate • In discussing AWS's AI capabilities, Amazon emphasized their deep partnership with NVIDIA while also highlighting their own competitive chip offerings that provide better price performance |
Source: Company data, Nomura research
Fig. 84: Meta's relevant comments on AI business/investments
| Date | Meta • In Q1 2026, capital expenditures, including principal payments on finance leases, were $19.8 billion, driven by investments in servers, |
|---|---|
| 4/30/2026 | data centers, and network infrastructure. • 2026 capital expenditures are expected to be $125-145 billion, an increase from the prior range of $115-135 billion, primarily due to higher component pricing and additional data center costs. • The 2027 CapEx outlook is dynamic; compute needs are consistently underestimated, driving continued infrastructure investment for future capacity. • Q1 family of apps ad revenue was $55.0 billion, up 33%. Total number of ad impressions served across services increased 19%. Average Price per Ad rose 12%. • Meta is signing multi-year cloud deals that are expected to come online over the course of 2026 and 2027, enabling quicker scaling. These multi- year cloud deals, along with infrastructure purchase agreements, led to a $107 billion increase in contractual commitments this quarter. • Meta is focusing on increasing the efficiency of investments, the company is rolling out more than 1GW of its own custom silicon that Meta is developing with Broadcom as well as a significant amount of AMD chips to complement the new NVIDIA systems. • Meta is seeing an increasing amount that it can improve engagement for people and value for advertisers, which encourages the company to continue investing heavily, management believe those investment will provide increasing value over the coming years. • Management tracks ROIC on AI investments through technical quality, product scaling, and monetization efficiency. • The core ads business continues to improve monetization efficiency by deploying AI more deeply across systems and tools, including advanced ranking models and GenAI creative tools. • Monetization opportunities for personal agents are anticipated over time, potentially through commission structures or premium offerings. |
| 1/28/2026 | • Capital expenditures for Q4 2025 were $22.1 billion, primarily for data centers, servers, and network infrastructure. Capital expenditures for full year 2026 are forecast to be $115 billion to $135 billion, with growth driven by investments in Meta Superintelligence Labs and the core business. • Meta is making significant infrastructure investments for AI, including Meta Compute and silicon development, but remains capacity-constrained, expecting more capacity in 2026 while mitigating constraints through efficiency and diversification. • Management expect 2026 to be a year of major AI acceleration, with new models and products shipping over the coming months, and a vision to build "personal superintelligence" that understands individual context. • Meta is seeing very strong results from the ad performance investments made throughout 2025, with year-over-year conversion growth accelerating through the fourth quarter. The company expects the set of investments in 2026 will drive further gains as Meta continue to integrate AI across all layers of the marketing and customer engagement funnel. • Management outlined long-term revenue and ROIC opportunities from AI, including improving core products, new business models like subscriptions and advertising, and commerce, also citing the Manus acquisition. • Scaling compute for larger foundational ads models, such as GEM, is expected to drive further performance gains in the monetization side. • Q3 Capital expenditures - Capital expenditures, including principal payments on finance leases, were $19.37 billion, focused on servers, data |
| 10/29/2025 | centers, and network infrastructure. • 2025 capital expenditures guidance was raised to $70-72 billion from previous $66-72 billion • 2026 CapEx dollar growth to be notably larger than 2025 - Total expenses to grow at a significantly faster percentage rate than 2025 - Growth primarily driven by infrastructure costs and employee compensation • 2026 CapEx relative to 2025 comes from growth in MSL, CoreAI, as well as non-AI spend. but the MSL AI needs are growing the most. • Meta is seeing the returns in the core business. • Strong y-y growth of value-weighted conversion rates. • The annual run rate for AI-powered ad tools has surpassed $60 billion • Mark Zuckerberg indicated it's too early to understand margins for new AI products, stating his goal is to maximize value and profitability rather than focusing specifically on margins • Meta AI has reached significant scale with over 1 billion monthly active users • Meta is developing business AI solutions that are showing promising early results. Meta AI's business solutions are being gradually expanded across markets, with initial testing in the Philippines and Mexico before broader rollout • Meta announced a joint venture with Blue Owl to co-develop data centers, with Meta maintaining a 20% ownership stake • The company released new AI glasses including Ray-Ban Meta glasses, Oakley Meta Vanguard's, and Meta Ray-Ban Display glasses with high- resolution display and Meta Neural Band interface • Meta is pursuing superintelligence (AI that surpasses human intelligence in every way) and has established Meta Superintelligence Labs to develop next-generation AI models |
| 7/31/2025 | • The company's Prometheus cluster is coming online next year, it's going to be the world's first gigawatt-plus cluster. They are also building out Hyperion, which we'll be able to scale up to 5 gigawatts over several years. And they have multiple more Titan clusters in development as well. • AI has driven significant improvements in ad performance and content recommendations • The company is seeing early success with autonomous AI agents improving Facebook's algorithms • Meta is focused on making its AI recommendations more adaptive and personalized • Meta expects increased spending on cloud services in 2026 to meet capacity needs • the core AI side, we continue to see strong ROI, our ability to measure that is quite good, and we feel sort of very good about the rigorous measurement and returns that we see there. • On the Gen AI side, we are clearly much, much earlier on the return curve, and we don't expect that the Gen AI work is going to be a meaningful driver of revenue this year or next year, but we remain generally very optimistic about the optimization • Meta identified five key business opportunities for AI: 1. Improved advertising 2. More engaging experiences 3. Business messaging 4. Meta AI 5. AI devices |
| 5/1/2025 | • Meta is heavily investing in and focusing resources on AI across 5 major opportunities: improved advertising, engaging experiences, business messaging, Meta AI, and AI devices • AI recommendation improvements have significantly increased engagement across platforms: 7% on Facebook, 6% on Instagram, and 35% on Threads • Meta AI has reached nearly 1 billion monthly active users, with top use cases being information gathering and social interactions • Meta expects AI coding agents to reach mid-level engineer capabilities by mid-to-late 2025 • The increased capex outlook reflects additional data center investments for AI efforts and higher infrastructure hardware costs • The company is facing higher infrastructure hardware costs due to supplier uncertainty around global trade discussions, and is working on supply chain optimizations to mitigate this |
| 1/30/2025 | • Capital expenditures for 2025 are guided to $60-65B, driven by increased investment to support both generative AI efforts and core business. • Meta AI has become widely used, with over 700 million monthly active users, and the company is focused on making it more personalized by remembering prior queries and considering users' Facebook/Instagram engagement • Meta expects to develop an AI engineering agent in 2025 that can match a mid-level engineer's capabilities • The company expect to bring online almost a 1-gigawatt of capacity this year. And is making massive infrastructure investments in AI, including plans for a 2-gigawatt AI data center • Meta maintains important partnerships with third-party silicon providers while also developing their own custom silicon • Meta are planning to significantly ramp up deployment of GPUs in 2025, and we'll continue to engage with our vendors and invest in its own silicon to meet those needs. • Meta's product development strategy typically focuses on scaling products to 1 billion users before emphasizing monetization • the thing that is going to be meaningful this year is the kind of getting of the AI products to scale. Last year was sort of the introduction and starting to get it to be used. |
Source: Company data, Nomura research
Fig. 85: Oracle's relevant comments on AI business/investments
| Date | Oracle • |
|---|---|
| 6/11/2026 | FY2027 net cash outlay for capital expenditures is expected to be around $70 billion, with reported CapEx higher by $20 billion to $25 billion due to customer prepayments and timing impacts. • OCI is projected to have a 30% to 40% margin profile and become an extremely large and profitable business. • AI is a primary driver for Oracle's record Q4 performance, with cloud infrastructure revenue growing 93% due to strong AI workload demand. • Oracle's cloud applications generated $4.1 billion in revenue, increasing 10% in Q4, with SaaS deferred revenue up 16% for the quarter. • The remaining performance obligations (RPO) reached $638 billion, up 363%, providing exceptional visibility into future revenue growth, supported by long-term contractual customer commitments. • Oracle's strategy is to have all AI winners as customers, diversifying across large clients, with four customers contracting over $8 billion this quarter. • Management acknowledges many vendors are entering the AI data center market, including "neoclouds" and SpaceX, but notes demand still massively exceeds supply. • The company signed $67 billion in AI infrastructure contracts this quarter, bringing the total for bring-your-own-hardware or prepaid AI contracts to $75 billion, with no margin degradation. • The AI infrastructure market is estimated to be trillions of dollars annually, with AI delivering value through agentic coding, driving enormous demand. • Oracle is innovating in AI with new database functionalities like AI Agent Memory and Deep Data Security, and is simplifying pricing with token bundles and outcome-based models. |
| 3/11/2026 | • While there may be additional CapEx, it will not require out-of-pocket cash from Oracle. Oracle is committed to maintaining its investment-grade rating and staying within the $50 billion financing envelope for calendar year 2026. • Oracle's AI Infrastructure revenue grew 243% year-over-year, with demand for both GPU and CPU capacity continuing to exceed supply, reflected in a $553 billion RPO. • The profitability of AI data centers is strong, with gross margins on accelerators in the 30-40% range, enhanced by adjacent services (10-20% of total spend) and higher-margin database services (60-80%). • While the hyper-growth phase involves expenses for under-construction capacity, which acts as a temporary drag on profitability, delivered capacity is already contracted at very profitable rates. • There is an acceleration in moving important private data to a cloud environment to take advantage of the latest AI capabilities. • Oracle is leveraging AI internally for coding tools to accelerate its SaaS business and deliver solutions, enabling smaller engineering teams to create more complete offerings quickly. |
| 12/11/2025 | • Oracle utilizes various models for delivering AI capacity, including customers bringing their own chips and vendors renting capacity, which reduces upfront capital expenditures and overall borrowing needs. • The company is committed to maintaining its investment-grade debt rating while funding its growth. • Management expects $4 billion of additional revenue in FY27 due to the Q2 RPO bookings, which can be monetized quickly due to near-term capacity availability. • FY26 CapEx is now expected to be about $15 billion higher than forecasted after Q1. • The majority of CapEx is for revenue-generating equipment in data centers, not land or buildings, with equipment purchased late in the production cycle to rapidly convert spending into revenue. • In Q2 FY2026, cloud infrastructure revenue grew 66%, with GPU-related revenue up 177%, contributing to a 33% increase in total cloud revenue. |
| 9/10/2025 | • Oracle has signed significant cloud contracts with OpenAI, xAI, Meta, NVIDIA, AMD, and many others. RPO at the end of Q1 was $455 billion. Up 359% YoY, up $317 billion from the end of Q4. Cloud RPO grew nearly 500% on top of 83% growth last year. • The Oracle Database is booming with 34 MultiCloud datacenters now live inside of Azure, GCP, and AWS, and we will deliver another 37 datacenters for a total of 71. • Oracle Cloud Infrastructure revenue projections for the next five years: - FY26: $18 billion (77% growth) - FY27: $32 billion - FY28: $73 billion - FY29: $114 billion - FY30: $144 billion • 2026 capital expenditure expected to be around $35 billion • Demand continues to dramatically outstrip supply for cloud infrastructure services |
| 6/12/2025 | • Capital expenditure (CapEx) is expected to exceed $25 billion in FY2026 • Only cloud-based versions of Oracle's applications can utilize the advanced AI capabilities, which is driving customer migration from on-premise solutions • The company's cloud infrastructure services are seeing extremely high demand that exceeds their current supply capacity • Oracle's cloud technology differentiates itself through faster performance and specialized capabilities for handling large amounts of data • The capex is primarily for equipment and computers rather than buildings, with Oracle buying components to build their computers to meet customer demand • FY25 capital expenditure expected to be around $16 billion, roughly double the previous year |
| 3/11/2025 | • Infrastructure cloud revenue expected to grow faster than 50% in FY25 and even faster in FY26 • Oracle's approach of starting data centers smaller and growing based on demand helps with utilization and margins • Oracle is building a massive 64,000 GPU liquid-cooled NVIDIA GB200 cluster for AI training, and signed a multi-billion dollar contract with AMD for 30,000 MI355X GPUs • Oracle's GPU consumption revenue grew significantly, now nearly 3.5x larger than last year • Oracle sees AI inferencing as potentially a larger opportunity than AI training, given their massive database installed base • There is significant competition between AWS, Google Cloud, and Azure to deploy Oracle database services quickly to capture workloads before their competitors • Oracle spends less on capex per dollar of IaaS/PaaS revenue than larger cloud providers, partly because they start data centers smaller and grow based on demand |
| 12/10/2024 | • Component delays that slowed cloud capacity expansion are expected to ease in Q1 FY '26 • Both cloud applications and cloud infrastructure gross margins have been improving with scale • Infrastructure cloud services now have an annualized revenue of $9.7 billion. OCI consumption revenue was up 58%, as demand continues to outstrip supply. Growth in the AI segment of infrastructure business was extraordinary. GPU consumption was up 336% in the quarter, and The company delivered the world's largest and fastest AI supercomputer, scaling up to 65,000 NVIDIA H200 GPUs. • Management views AI as a massive opportunity, with Oracle Cloud revenue expected to exceed $25 billion this fiscal year • Oracle differentiates itself in its data centers by investing heavily in building networks and switch software, all sorts of network software, and network hardware to move data more quickly. |
Source: Company data, Nomura research
Relative performance chart
2330 TT
EQUITY: FOUNDRY
Price
•115
-110
- 105
Taiwan Semiconductor Manufacturing Corp 2330.TW
2330 TT
EQUITY: FOUNDRY
Courna: | CEC Namiira
Earnings uptrend sustains; Buy with a higher TP
Turning aggressive on CoW plan (despite bottleneck in WoS); price hike scale and scope noteworthy
AI demand surge (unsurprisingly) changes TSMC's mindset about expansion
We keep the AI bellwether TSMC in our core AI semi holding. We expect TSMC to deliver strong revenue growth in 2026F/27F (+37%/+30%, in USD terms), monetizing full fab loadings and another round of price hikes (assume for wafer-outs starting in Jan-27). While we previously expected a severely constrained Asia AI semi and server supply chain throughout 2026F (report ), the scope of supply/demand mismatch has broadened (report ). We believe TSMC will be more aggressive than before in capacity builds, and we believe it targets 2,000kpcs CoWoS in 2027F (more precisely, 'CoW' capacity; vs. our previous estimate of up to 1,350kpcs) by hastening its tooling pace in AP7/AP8. The pace of advanced node (N5/N3) supply addition in 2026-27E, on the other hand, remains broadly steady with the planned N3 builds at Fab 18 and cross-node optimization at Fab 15/18, while the majority of greenfield formations will come online after 2027E (N3 in the US/Japan). Yet we only model in 1,800kpcs of 'CoWoS' output since turnkey volume could be constrained by key components in the WoS stage such as IC substrates, suggesting TSMC cannot be the only one 'working hard' to meet the demand . While keeping 2026F capex unchanged, we raise 2027F/28F capex to USD75bn/85bn (from USD70bn/70bn) but note possible upside (current capex intensity is in the low-30% vs. prior cyclical peak 45-50%) to counter competition (e.g. Intel's EMIB-T) and considering an optically high ROI in this AI-driven cycle. The increased capex in 2027-28F, in our view, is to expedite infrastructure and subsequent tool purchases. We expect 5-10% price hikes for N2/N3/N5 into 2027F, and we do not rule out further upside in scale and scope, i.e. even mature nodes could see price hikes into 2027F. Net, we raise 2026-28F GM to reflect stronger pricing power and a more favorable mix from hectic AI/HPC production and increase 2026-28F EPS by 4-12%. Our new TP of TWD3,425 is based on 25x 2027F EPS of TWD137.0 (previously 25x 2026-27F average EPS TWD112), near the high end of its historical trading band of 10-30x. TSMC trades at 17x 2027F EPS. After SOX's rally in April and May, TSMC local shares (P/E based on Bloomberg consensus EPS) are trading at a 16% discount to SOX's one-year forward P/E (25x; based on consensus). We reiterate Buy as we believe TSMC should trade at a premium to SOX due to its AI-enabler position and strengthened growth outlook.
2Q26F results/3Q26 guidance preview
We model TSMC's 2Q26F revenue growth/GM both at the high end of guidance (+12% q-q in USD terms; GM of 67.4%) and expect another +12% q-q growth in 3Q26F revenue with a 68% GM.
| Year-end 31 Dec | FY25 | FY26F | FY27F New | FY28F New | |||
|---|---|---|---|---|---|---|---|
| Currency (TWD) | Actual | Old | New | Old | Old | ||
| Revenue (mn) | 3,809,054 | 5,218,444 | 5,313,126 | 6,501,6956,922,023 | 7,875,757 | 8,543,664 | |
| Reported net profit (mn) | 1,717,883 | 2,605,572 | 2,705,708 | 3,245,4043,551,314 | 3,900,744 | 4,376,166 | |
| Normalised net profit (mn) | 1,717,883 | 2,605,572 | 2,705,708 | 3,245,4043,551,314 | 3,900,744 | 4,376,166 | |
| FD normalised EPS | 66.26 | 100.49 | 104.35 | 125.17 | 136.96 | 150.44 | 168.77 |
| FD norm. EPS growth (%) | 46.4 | 51.7 | 57.5 | 24.6 | 31.3 | 20.2 | 23.2 |
| FD normalised P/E (x) | 35.3 | - | 22.4 | - | 17.1 | - | 13.9 |
| EV/EBITDA (x) | 22.4 | - | 14.6 | - | 10.9 | - | 8.4 |
| Price/book (x) | 11.2 | - | 8.1 | - | 5.9 | - | 4.3 |
| Dividend yield (%) | 0.9 | - | 1.2 | - | 1.2 | - | 1.2 |
| ROE (%) | 35.4 | 40.5 | 42.0 | 37.0 | 39.9 | 33.3 | 36.1 |
| Net debt/equity (%) | net cash | net cash | net cash | net cash | net cash | net cash | net cash |
Source: Company data, Nomura estimates
May
(TWD)
2500-
2250-
20001
17501
15001
12501
10001
Global Markets Research 30 June 2026
| Rating Remains | Buy |
|---|---|
| Target price Increased from TWD 2,820.00 | TWD 3,425.00 |
| Closing price 26 June 2026 | TWD 2,340.00 |
| Implied upside | +46.4% |
| Market Cap (USD mn) | 1,902,905.3 |
| ADT (USD mn) | 2,704.4 |
Relative performance chart
Source: LSEG, Nomura
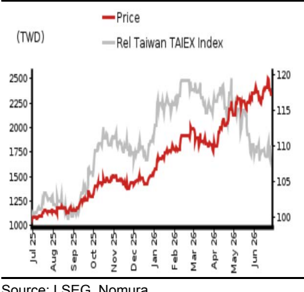
Research Analysts
Semiconductor
Aaron Jeng, CFA - NITB aaron.jeng@nomura.com +886(2) 21769962
Eric Chen, CFA - NITB
eric.chen@nomura.com +886(2) 21769965
Vivian Yang - NITB
vivian.yang@nomura.com +886(2) 21769970
Key data on Taiwan Semiconductor Manufacturing Corp
Cashflow statement (TWDmn)
| Year-end 31 Dec | FY24 | FY25 | FY26F 5,201,525 | FY27F | FY28F | FY28F |
|---|---|---|---|---|---|---|
| EBITDA Change in | 1,984,850 -90,016 | 2,624,188 3,970,308 30,788 | 1,775 | -190,125 | 6,504,122 -256,703 | 6,504,122 -256,703 |
| working capital Other operating cashflow | -68,657 | -380,000 | -654,209 | -602,250 | -717,298 | -717,298 |
| Cashflow from operations | 1,826,177 | 2,274,976 | 3,317,874 | 4,409,150 | 5,530,121 | 5,530,121 |
| Capital expenditure | -955,112 | -1,271,613-1,769,512-2,370,000-2,686,000 | ||||
| Free cashflow | 871,065 | 1,003,362 | 1,548,363 | 2,039,150 | 2,844,121 | 2,844,121 |
| Reduction in investments | -57,882 | -37,079 | -30,130 | 0 | 0 | 0 |
| Net acquisitions | 0 | 0 | 0 | 0 | 0 | 0 |
| Dec in other LT assets LT liabilities | 0 | 0 | 0 | 0 | 0 | 0 |
| Inc in other | 0 | 0 | 0 | 0 0 | 0 | 0 |
| Adjustments CF after investing acts | 148,151 961,334 | 164,299 | 22,226 | 2,039,150 | 0 | 0 |
| Cash dividends | 1,130,582 | 1,540,459 | 2,844,121 | 2,844,121 | ||
| -363,055 | -466,779 | -622,380 0 | -726,106 | -726,106 0 | -726,106 0 | |
| Equity issue Debt issue | 0 55,866 | 0 40,448 | 14,013 | 0 0 | 0 | 0 |
| Convertible | 0 | 0 | 0 | 0 | 0 | 0 |
| debt issue Others | 8,054 | -64,022 | 41,309 | 0 | 0 | 0 |
| financial | ||||||
| CF from acts | -299,135 | -490,353 | -567,059 | -726,106 | -726,106 | -726,106 |
| Net cashflow | 662,199 | 640,229 | 973,400 | 1,313,044 | 2,118,015 | 2,118,015 |
| Beginning cash | 1,465,428 | 2,127,627 | 2,767,856 | 3,741,257 | 5,054,301 | 5,054,301 |
| Ending cash | 2,127,627 | 2,767,856 | 3,741,257 | 5,054,301 | 7,172,316 | 7,172,316 |
| Ending net debt | ||||||
| -1,109,340-1,734,869-2,683,997-3,997,041-6,115,056 | ||||||
| Balance sheet (TWDmn) | FY24 | FY25 | FY26F | FY27F FY28F 7,172,316 | FY27F FY28F 7,172,316 | |
| As at 31 Dec Cash & equivalents | 2,127,627 2,767,856 357,531 | 360,441 282,059 | 3,741,257 417,358 | 417,358 | 5,054,301 417,358 | 5,054,301 417,358 |
| Marketable securities Accounts receivable | 272,088 | 477,135 | 600,833 | 761,113 | 761,113 | |
| Inventories | 287,869 | 288,109 | 386,340 | 484,115 | 626,042 | 626,042 |
| Other current assets | 43,237 | 136,373 | 136,373 | |||
| 118,664 3,817,131 | 136,373 5,158,464 | 136,373 6,692,980 | 9,113,202 | 9,113,202 | ||
| Total current assets LT investments | 3,088,352 149,040 | 172,370 | 171,362 | 178,544 | 185,874 | 185,874 |
| Fixed assets | 3,234,980 | 3,691,841 | 4,722,418 | 6,038,562 0 | 7,307,859 | 7,307,859 |
| Goodwill | 0 | 0 | 0 | 0 | 0 | 0 |
| Other intangible assets | 0 | 0 | 0 | 0 | 0 | |
| Other LT assets Total assets | 219,565 | 251,682 | 274,192 | 274,192 | 274,192 | 274,192 |
| 6,691,938 | 7,933,024 | 10,326,436 | 13,184,278 | 16,881,127 | 16,881,127 | |
| Short-term debt | 59,858 | 136,926 | 156,242 | 156,242 | 156,242 | 156,242 |
| Accounts payable | 74,227 | 84,330 | 123,866 | 155,214 | 200,717 | 200,717 |
| Other current | 1,130,441 | 1,236,763 | 1,510,019 | 1,510,019 | 1,510,019 | 1,510,019 |
| liabilities liabilities | 1,790,126 | 1,821,474 | ||||
| Total current Long-term debt | 1,264,525 958,429 | 1,458,019 896,062 | 901,018 | 901,018 | 1,866,978 901,018 | 1,866,978 901,018 |
| Convertible debt | 0 | 0 | 0 | 0 113,290 | 0 113,290 | 0 113,290 |
| Other LT liabilities | 145,408 | 118,147 | 113,290 | 2,835,781 | ||
| Total liabilities | 2,368,362 | 2,472,229 | 2,804,433 | 2,881,285 | 2,881,285 | |
| Minority interest | 35,031 | 41,199 | 42,393 | 43,680 | 44,966 | 44,966 |
| Preferred stock | 0 | 0 | 0 | 0 332,990 | 0 332,990 | 0 332,990 |
| Common stock | 332,588 | 332,771 | 332,990 7,109,137 | 9,934,345 | ||
| Retained earnings | 3,917,252 | 5,103,502 0 | 0 | 0 | 13,584,405 0 | 13,584,405 0 |
| Proposed dividends | 0 38,705 | -16,676 | 37,482 | 37,482 | 37,482 | 37,482 |
| Other equity and reserves Total shareholders' equity | 4,288,545 | 5,419,596 | 7,479,609 | 13,954,876 | 13,954,876 | |
| Total equity & liabilities | 6,691,938 | 10,304,817 | ||||
| 10,326,436 | ||||||
| 7,933,024 | 13,184,278 | 16,881,127 | 16,881,127 | |||
| Liquidity (x) | 2.44 - | 2.62 - net cash | 2.88 - | 3.67 - | 4.88 | 4.88 |
| Current ratio Interest cover Leverage Net debt/EBITDA (x) | net cash net cash | net cash | net cash net cash | net cash net cash | - net cash | - net cash |
| Net debt/equity (%) Per share | net | net | ||||
| Reported EPS (TWD) | 45.25 | 66.26 66.26 | 104.35 | 136.96 | cash | cash |
| Norm EPS (TWD) FD norm EPS (TWD) | 45.25 45.25 165.37 | 66.26 208.99 | 104.35 104.35 288.43 | 136.96 397.37 | 168.77 136.96 168.77 168.77 | 168.77 136.96 168.77 168.77 |
| BVPS (TWD) DPS (TWD) | 17.00 | 22.00 | 538.13 | 538.13 | ||
| Activity (days) | 28.00 | 28.00 | ||||
| 28.00 | 28.00 | |||||
| 29.9 | 26.1 | 28.4 | 29.2 | 29.2 | ||
| 26.6 | 71.3 | 72.0 | 73.7 | 73.7 | ||
| Days receivable Days inventory | 77.4 | 68.8 18.9 | 23.6 | 23.6 | ||
| Days payable | 18.9 | 22.0 | 23.1 | |||
| Cash cycle | 76.4 | 75.4 | ||||
| 88.4 | ||||||
| 77.3 | ||||||
| 79.2 | 79.2 |
Source: Company data, Nomura estimates
Performance
| (%) | 1M | 3M | 12M | ||
|---|---|---|---|---|---|
| Absolute (TWD) | 3.1 | 27.2 | 117.7 | M cap (USDmn) | 1,902,905.3 |
| Absolute (USD) | 1.7 | 27.3 | 98.1 | Free float (%) | 90.1 |
| Rel to Taiwan TAIEX Index | 0.7 | -6.5 | 19.5 | 3-mth ADT (USDmn) | 2,704.4 |
Income statement (TWDmn)
| Year-end 31 Dec | FY24 | FY25 | FY26F | FY27F | FY28F |
|---|---|---|---|---|---|
| Revenue | 2,894,308 | 3,809,054 | 5,313,126 | 6,922,023 | 8,543,664 |
| Cost of goods sold | -1,269,954 | -1,527,760 | -1,726,529 | -2,207,488 | -2,756,576 |
| Gross profit | 1,624,354 | 2,281,294 | 3,586,597 | 4,714,535 | 5,787,088 |
| SG&A | -302,301 | -345,202 | -434,563 | -566,867 | -699,668 |
| Employee share expense | 0 | 0 | 0 | 0 | 0 |
| Operating profit | 1,322,053 | 1,936,092 | 3,152,034 | 4,147,668 | 5,087,420 |
| EBITDA | 1,984,850 | 2,624,188 | 3,970,308 | 5,201,525 | 6,504,122 |
| Depreciation | -662,797 | -688,096 | -818,273 | -1,053,857 | -1,416,703 |
| Amortisation | 0 | 0 | 0 | 0 | 0 |
| EBIT | 1,322,053 | 1,936,092 | 3,152,034 | 4,147,668 | 5,087,420 |
| Net interest expense | 67,781 | 86,206 | 108,503 | 145,809 | 205,698 |
| Associates & JCEs | 4,879 | 5,497 | 6,481 | 7,182 | 7,330 |
| Other income | 11,125 | 13,868 | 6,665 | 4,000 | 4,000 |
| Earnings before tax | 1,405,839 | 2,041,663 | 3,273,683 | 4,304,659 | 5,304,448 |
| Income tax | -233,407 | -326,266 | -566,689 | -752,058 | -926,996 |
| Net profit after tax | 1,172,432 | 1,715,397 | 2,706,994 | 3,552,600 | 4,377,452 |
| Minority interests | 836 | 2,486 | -1,286 | -1,286 | -1,286 |
| Other items | 0 | 0 | 0 | 0 | 0 |
| Preferred dividends | 0 | 0 | 0 | 0 | 0 |
| Normalised NPAT | 1,173,268 | 1,717,883 | 2,705,708 | 3,551,314 | 4,376,166 |
| Extraordinary items | 0 | 0 | 0 | 0 | 0 |
| Reported NPAT | 1,173,268 | 1,717,883 | 2,705,708 | 3,551,314 | 4,376,166 |
| Dividends | -440,851 | -570,516 | -726,106 | -726,106 | -726,106 |
| Transfer to reserves | 732,417 | 1,147,366 | 1,979,602 | 2,825,208 | 3,650,060 |
| Valuations and ratios | |||||
| Reported P/E (x) | 51.7 | 35.3 | 22.4 | 17.1 | 13.9 |
| Normalised P/E (x) | 51.7 | 35.3 | 22.4 | 17.1 | 13.9 |
| FD normalised P/E (x) | 51.7 | 35.3 | 22.4 | 17.1 | 13.9 |
| Dividend yield (%) | 0.7 | 0.9 | 1.2 | 1.2 | 1.2 |
| Price/cashflow (x) | 33.2 | 26.7 | 18.3 | 13.8 | 11.0 |
| Price/book (x) | 14.1 | 11.2 | 8.1 | 5.9 | 4.3 |
| EV/EBITDA (x) | 30.0 | 22.4 | 14.6 | 10.9 | 8.4 |
| EV/EBIT (x) | 44.9 | 30.4 | 18.4 | 13.7 | 10.7 |
| Gross margin (%) | 56.1 | 59.9 | 67.5 | 68.1 | 67.7 |
| EBITDA margin (%) | 68.6 | 68.9 | 74.7 | 75.1 | 76.1 |
| EBIT margin (%) | 45.7 | 50.8 | 59.3 | 59.9 | 59.5 |
| Net margin (%) | 40.5 | 45.1 | 50.9 | 51.3 | 51.2 |
| Effective tax rate (%) | 16.6 | 16.0 | 17.3 | 17.5 | 17.5 |
| Dividend payout (%) | 37.6 | 33.2 | 26.8 | 20.4 | 16.6 |
| ROE (%) | 30.3 | 35.4 | 42.0 | 39.9 | 36.1 |
| ROA (pretax %) | 30.7 | 39.9 | 53.8 | 56.5 | 57.1 |
| Growth (%) | |||||
| Revenue | 33.9 | 31.6 | 39.5 | 30.3 | 23.4 |
| EBITDA | 36.5 | 32.2 | 51.3 | 31.0 | 25.0 |
| Normalised EPS | 39.9 | 46.4 | 57.5 | 31.3 | 23.2 |
| Normalised FDEPS | 39.9 | 46.4 | 57.5 | 31.3 | 23.2 |
Source: Company data, Nomura estimates
Company profile
Founded in 1987, Taiwan Semiconductor Manufacturing Corp. is a leading foundry player with the most advanced process technology.
Valuation Methodology
Our TP of TWD3,425 is based on 25x 2027F EPS. Our target P/E is at the higher end of historical range. The benchmark index for the stock is Taiwan TAIEX and SOX.
Risks that may impede the achievement of the target price
Major downside risks are: 1) top-down macro issues because of US-China trade tensions; 2) weaker-than-expected sell-through compared with strong demand in the supply chain; 3) slower-than-expected technology migration; and 4) stronger-than-expected competition in advanced 5/3nm nodes.
ESG
TSMC officially sets 'Acting with Integrity', 'Strengthening Environmental Protection', and 'Caring for the Disadvantaged' as its primary ESG mission.
Financial analysis and forecasts
Fig. 86: TSMC - 2026-28F forecast revisions
| 2026F | 2026F | 2026F | 2027F | 2027F | 2027F | 2028F | 2028F | 2028F | |
|---|---|---|---|---|---|---|---|---|---|
| (TWD mn) | Revised | Previous | Change | Revised | Previous | Change | Revised | Previous | Change |
| Revenue | 5,313,126 | 5,218,444 | 1.8% | 6,922,023 | 6,501,695 | 6.5% | 8,543,664 | 7,875,757 | 8.5% |
| Gross profit | 3,586,597 | 3,453,530 | 3.9% | 4,714,535 | 4,303,722 | 9.5% | 5,787,088 | 5,148,541 | 12.4% |
| Operating profit | 3,152,034 | 3,023,429 | 4.3% | 4,147,668 | 3,766,035 | 10.1% | 5,087,420 | 4,497,220 | 13.1% |
| Pretax profit | 3,273,683 | 3,152,259 | 3.9% | 4,304,659 | 3,933,692 | 9.4% | 5,304,448 | 4,727,998 | 12.2% |
| Net profit | 2,705,708 | 2,605,572 | 3.8% | 3,551,314 | 3,245,404 | 9.4% | 4,376,166 | 3,900,744 | 12.2% |
| EPS (TWD) | 104.35 | 100.49 | 3.8% | 136.96 | 125.17 | 9.4% | 168.77 | 150.44 | 12.2% |
| Margin | Revised | Previous | Change | Revised | Previous | Change | Revised | Previous | Change |
| Gross margin | 67.5% | 66.2% | 133bps | 68.1% | 66.2% | 192bps | 67.7% | 65.4% | 236bps |
| Operating margin | 59.3% | 57.9% | 139bps | 59.9% | 57.9% | 200bps | 59.5% | 57.1% | 244bps |
| Pretax margin | 61.6% | 60.4% | 121bps | 62.2% | 60.5% | 169bps | 62.1% | 60.0% | 205bps |
| Net margin | 50.9% | 49.9% | 99bps | 51.3% | 49.9% | 139bps | 51.2% | 49.5% | 169bps |
Source: Nomura estimates
Fig. 87: TSMC's P&L
| (TWD mn) | 1Q25 | 2Q25 | 3Q25 | 4Q25 | 1Q26 | 2Q26F | 3Q26F | 4Q26F | 1Q27F | 2Q27F | 3Q27F | 4Q27F | 2025 | 2026F | 2027F | 2028F |
|---|---|---|---|---|---|---|---|---|---|---|---|---|---|---|---|---|
| Revenue | 839,254 | 933,792 | 989,918 | 1,046,090 | 1,134,103 | 1,270,361 | 1,424,880 | 1,483,782 | 1,527,375 | 1,703,620 | 1,822,575 | 1,868,454 | 3,809,054 | 5,313,126 | 6,922,023 | 8,543,664 |
| Revenue (USD mn) | 25,526 | 30,070 | 33,097 | 33,731 | 35,898 | 40,201 | 45,091 | 46,955 | 48,335 | 53,912 | 57,676 | 59,128 | 122,424 | 168,146 | 219,051 | 270,369 |
| Gross profit | 493,395 | 547,369 | 588,543 | 651,987 | 751,295 | 856,843 | 969,528 | 1,008,930 | 1,038,877 | 1,157,972 | 1,244,259 | 1,273,427 | 2,281,294 | 3,586,597 | 4,714,535 | 5,787,088 |
| - Opex | (85,186) | (84,508) | (87,764) | (88,191) | (94,006) | (104,034) | (116,688) | (121,512) | (125,082) | (139,515) | (149,257) | (153,014) | (345,650) | (436,239) | (566,867) | (699,668) |
| Operating profit | 407,081 | 463,424 | 500,685 | 564,902 | 658,966 | 752,809 | 852,840 | 887,418 | 913,795 | 1,018,457 | 1,095,003 | 1,120,413 | 1,936,092 | 3,152,034 | 4,147,668 | 5,087,420 |
| Pretax profit | 430,895 | 493,035 | 525,369 | 592,363 | 687,800 | 781,775 | 883,604 | 920,505 | 949,143 | 1,056,024 | 1,135,171 | 1,164,321 | 2,041,663 | 3,273,683 | 4,304,659 | 5,304,448 |
| Net profit | 361,564 | 398,273 | 452,301 | 505,744 | 572,480 | 644,925 | 728,947 | 759,357 | 782,981 | 871,192 | 936,523 | 960,618 | 1,717,883 | 2,705,708 | 3,551,314 | 4,376,166 |
| EPS (TWD) | 13.95 | 15.36 | 17.44 | 19.51 4Q25 | 22.08 1Q26 | 24.87 2Q26F | 28.11 3Q26F | 29.29 4Q26F | 30.20 | 33.60 | 36.12 3Q27F | 37.05 4Q27F | 66.26 2025 | 104.35 2026F | 136.96 2027F | 168.77 2028F |
| Profitability Gross margin | 1Q25 58.8% | 2Q25 58.6% | 3Q25 59.5% | 62.3% | 66.2% | 67.4% | 68.0% | 68.0% | 1Q27F 68.0% | 2Q27F 68.0% | 68.3% | 68.2% | 59.9% | 67.5% | 68.1% | 67.7% |
| - Opex ratio | -10.2% | -9.1% | -8.9% | -8.4% | -8.3% | -8.2% | -8.2% | -8.2% | -8.2% | -8.2% | -8.2% | -8.2% | -9.1% | -8.2% | -8.2% | -8.2% |
| Operating margin | 48.5% | 49.6% | 50.6% | 54.0% | 58.1% | 59.3% | 59.9% | 59.8% | 59.8% | 59.8% | 60.1% | 60.0% | 50.8% | 59.3% | 59.9% | 59.5% |
| Pretax margin | 51.3% | 52.8% | 53.1% | 56.6% | 60.6% | 61.5% | 62.0% | 62.0% | 62.1% | 62.0% | 62.3% | 62.3% | 53.6% | 61.6% | 62.2% | 62.1% |
| Net margin | 43.1% | 42.7% | 45.7% | 48.3% | 50.5% | 50.8% | 51.2% | 51.2% | 51.3% | 51.1% | 51.4% | 51.4% | 45.1% | 50.9% | 51.3% | 51.2% |
| Q-Q | 1Q25 | 2Q25 | 3Q25 | 4Q25 | 1Q26 | 2Q26F | 3Q26F | 4Q26F | 1Q27F | 2Q27F | 3Q27F | 4Q27F | ||||
| Revenue | -3.4% | 11.3% | 6.0% | 5.7% | 8.4% | 12.0% | 12.2% | 4.1% | 2.9% | 11.5% | 7.0% | 2.5% | ||||
| Revenue (in USD) | -5.1% | 17.8% | 10.1% | 1.9% | 6.4% | 12.0% | 12.2% | 4.1% | 2.9% | 11.5% | 7.0% | 2.5% | ||||
| Gross profit | -3.7% | 10.9% | 7.5% | 10.8% | 15.2% | 14.0% | 13.2% | 4.1% | 3.0% | 11.5% | 7.5% | 2.3% | ||||
| Operating profit | -4.4% | 13.8% | 8.0% | 12.8% | 16.7% | 14.2% | 13.3% | 4.1% | 3.0% | 11.5% | 7.5% | 2.3% | ||||
| Pretax profit | -4.0% | 14.4% | 6.6% | 12.8% | 16.1% | 13.7% | 13.0% | 4.2% | 3.1% | 11.3% | 7.5% | 2.6% | ||||
| Net profit | -3.5% | 10.2% | 13.6% | 11.8% | 13.2% | 12.7% | 13.0% | 4.2% | 3.1% | 11.3% | 7.5% | 2.6% | ||||
| Y-Y | 1Q25 | 2Q25 | 3Q25 | 4Q25 | 1Q26 | 2Q26F | 3Q26F | 4Q26F | 1Q27F | 2Q27F | 3Q27F | 4Q27F | 2025 | 2026F | 2027F | 2028F |
| Revenue | 41.6% | 38.6% | 30.3% | 20.5% | 35.1% | 36.0% | 43.9% | 41.8% | 34.7% | 34.1% | 27.9% | 25.9% | 31.6% | 39.5% | 30.3% | 23.4% |
| Revenue (in USD) | 35.3% | 44.4% | 40.8% | 25.5% | 40.6% | 33.7% | 36.2% | 39.2% | 34.6% | 34.1% | 27.9% | 25.9% | 35.9% | 37.3% | 30.3% | 23.4% |
| Gross profit | 56.9% | 52.8% | 34.0% | 27.2% | 52.3% | 56.5% | 64.7% | 54.7% | 38.3% | 35.1% | 28.3% | 26.2% | 40.4% | 57.2% | 31.4% | 22.7% |
| Operating profit | 63.5% | 61.7% | 38.8% | 32.7% | 61.9% | 62.4% | 70.3% | 57.1% | 38.7% | 35.3% | 28.4% | 26.3% | 46.4% | 62.8% | 31.6% | 22.7% |
| Pretax profit | 61.7% | 61.0% | 36.7% | 32.0% | 59.6% | 58.6% | 68.2% | 55.4% | 38.0% | 35.1% | 28.5% | 26.5% | 45.2% | 60.3% | 31.5% | 23.2% |
| Net profit | 60.3% | 60.7% | 39.1% | 35.0% | 58.3% | 61.9% | 61.2% | 50.1% | 36.8% | 35.1% | 28.5% | 26.5% | 46.4% | 57.5% | 31.3% | 23.2% |
Source: Company data, Nomura estimates
Fig. 88: Nomura forecasts vs Bloomberg consensus for 2026-28F
| 2026F | 2026F | 2026F | 2027F | 2027F | 2027F | 2028F | 2028F | 2028F | |
|---|---|---|---|---|---|---|---|---|---|
| (TWD mn) | NMR | BBG | Diff. | NMR | BBG | Diff. | NMR | BBG | Diff. |
| Revenue | 5,313,126 | 5,200,031 | 2.2% | 6,922,023 | 6,732,440 | 2.8% | 8,543,664 | 8,457,810 | 1.0% |
| Gross profit | 3,586,597 | 3,441,068 | 4.2% | 4,714,535 | 4,422,742 | 6.6% | 5,787,088 | 5,502,567 | 5.2% |
| Operating profit | 3,152,034 | 3,010,814 | 4.7% | 4,147,668 | 3,926,611 | 5.6% | 5,087,420 | 4,941,310 | 3.0% |
| Pretax profit | 3,273,683 | 3,122,453 | 4.8% | 4,304,659 | 4,137,297 | 4.0% | 5,304,448 | 5,157,136 | 2.9% |
| Net profit | 2,705,708 | 2,589,152 | 4.5% | 3,551,314 | 3,353,844 | 5.9% | 4,376,166 | 4,232,986 | 3.4% |
| EPS (TWD) | 104.35 | 100.36 | 4.0% | 136.96 | 130.57 | 4.9% | 168.77 | 165.89 | 1.7% |
| Margin | NMR | BBG | Diff. | NMR | BBG | Diff. | NMR | BBG | Diff. |
| Gross margin | 67.5% | 66.2% | 133bps | 68.1% | 65.7% | 242bps | 67.7% | 65.1% | 268bps |
| Operating margin | 59.3% | 57.9% | 143bps | 59.9% | 58.3% | 160bps | 59.5% | 58.4% | 112bps |
| Pretax margin | 61.6% | 60.0% | 157bps | 62.2% | 61.5% | 73bps | 62.1% | 61.0% | 111bps |
| Net margin | 50.9% | 49.8% | 113bps | 51.3% | 49.8% | 149bps | 51.2% | 50.0% | 117bps |
Source: Bloomberg Finance L.P. consensus, Nomura estimates
Fig. 89: TSMC's consensus P/E ratio
Fig. 91: TSMC — valuation vs. SOX Index
30
35
25
28
21
20
14
15
7
10
5
Чиід,
0
Jun-21
50%
40%
Fig. 90: TSMC's consensus P/B ratio
Fig. 92: TSMC — valuation vs. TSMC'S ADR
8.0
35
7.0
Valuation methodology and risks
We raise our TP to TWD3,425, which is based on 25x 2027F EPS of TWD137. Our target P/E multiple is at the higher end of TSMC's historical range of 10-30x. The stock is currently trading at 17x 2027F EPS. -20%
Major downside risks: 1) top-down macro issues owing to the ongoing US-China trade tensions; 2) weaker-than-expected sell-through compared with the strong demand in the supply chain; 3) slower-than-expected technology migration; and 4) stronger-thanexpected competition in advanced 5/3nm nodes. - BEst P/Bk Jun-23 +1SD: 6.0x Jun-24 Average: 4.9x - TSMC (2330 TT) BEst P/E (LHS)
-SOX Index BEst P/E (LHS)
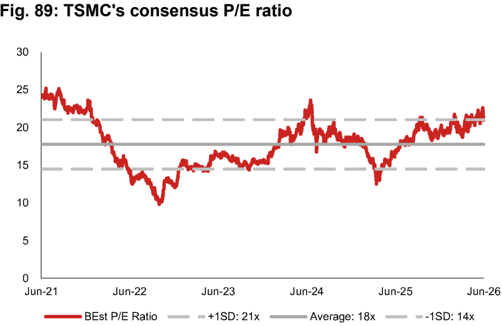
Source: Bloomberg Finance LP, Nomura research
Fig. 91: TSMC - valuation vs. SOX Index
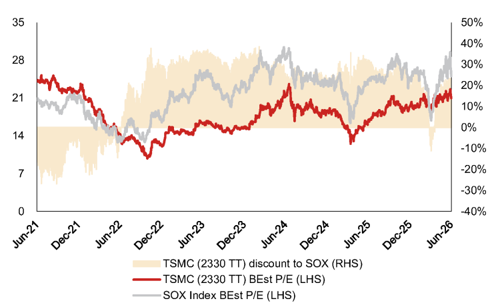
Source: Bloomberg Finance LP, Nomura research
TSMC (TSM US) BEst P/E (LHS)
25%
20%
15%
10%
5%
0%
-5%
Jun-25
Jun-26
-1SD: 3.8x
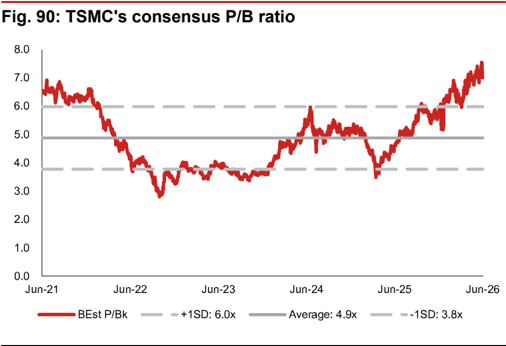
Source: Bloomberg Finance LP, Nomura research
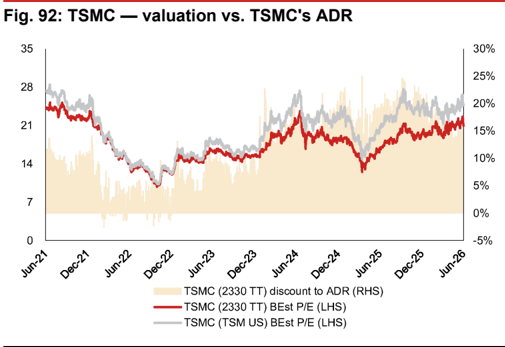
Source: Bloomberg Finance LP, Nomura research
2,400
2,100
1,800
1,500
1,200
900
600
300
0
Jun-21
180
Fig. 93: TSMC's share price vs Bloomberg consensus EPS revisions
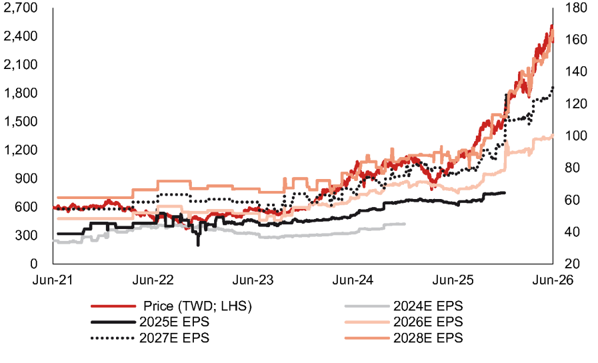
Source: Company data, Bloomberg Finance L.P. consensus estimates, Nomura research
Relative performance chart
EQUITY: OSAT
Price
(TWD)
700 1
600-
500
400-
3001
2001
-
200
-
175
-
150
-
125
ASE Technology Holding 3711.TW 3711 TT
EQUITY: OSAT
Courna: | CEC Namiiral
Ongoing earnings upside; Buy and raise TP
TSMC's turning aggressive on CoWoS plan, CPU-driven FOCoS business upside, and further price hikes possible; Buy
Raise TP to TWD730 and maintain Buy, implying 16% upside
Along with our in-depth analysis of ASIC/CPUs and revised CoWoS forecasts in our AI Semi and Server Anchor report, we update our model assumptions for ASE Technology. As we believe TSMC has outsourced most of its oS business to ASE group, ASE should be a direct beneficiary of the revised expansion plan of TSMC. We believe the oS business will still contribute more than half of ASE's LEAP (leading-edge advanced packaging) revenue in FY26F/27F, accounting for 59%/51% of LEAP in these two years. However, we see clear upside potential for its full process platform as well. Also, in our AI Semi and Server Anchor report we provided a detailed analysis on AMD's (AMD US, Not rated) Venice CPU architecture, which we expect to be a major product utilizing ASE's FOCoS-B technology. According to our estimates, full-process could contribute 10%/20% of ASE's LEAP revenue in 2026F/27F. To sum up, we provide a simple simulation for ASE's LEAP revenue in Fig. 94 , where we suggest overall LEAP revenue to contribute USD3.5bn/6.9bn, accounting for 33%/41% of ASE's total IC ATM revenue (in USD terms) in 2026F/27F. Coupled with 0-5% y-y revenue growth for non-LEAP IC ATM revenue and 5-10% y-y growth for the EMS segment, we model ASE's total revenue to grow by 26%/19% in 2026F/27F and tentatively assume 15% y-y revenue growth in 2028F. We also expect margin expansion to continue on optimization of product portfolio and operating leverage, collectively contributing 12% of our 2027F EPS estimate hike. Our new TP of TWD730 is based on 25x 2027-28F average EPS (from 2027F EPS and TWD575 TP) and unchanged target P/E of 25x (at the high-end of its historical range). The stock currently trades at 21.7x 2027-28F average EPS. We maintain Buy rating.
Can the share price uptrend sustain?
In Oct-2025, we upgraded ASE from Neutral to Buy (report ), citing reasons such as share price underperformance (at that time), ASE becoming a prime gainer from TSMC's oS outsourcing, improving product mix and negotiation power. We maintain our positive view, given ASE's revenue, margin and capex growth acceleration (report ), and we also see consensus earnings estimate hikes over the past one year (Fig. 103 ). ASE share price has outperformed major indices and peers since Oct-25 (up 155% vs. TAIEX up 58%, Fig. 100 ), but we expect the stock to extend the rally on potential upside from its full process platform. We believe ASE is also at the forefront to gain from the value of latest technologies such as panel level packaging and CPO, which we believe are currently understated and difficult to quantify, but have significant upside potential.
| Year-end 31 Dec Currency (TWD) | FY25 Actual | Old | FY26F New | Old | FY27F New | Old | FY28F New |
|---|---|---|---|---|---|---|---|
| Revenue (mn) | 645,388 | 807,643 | 810,252 | 911,129 | 962,066 | 01,104,144 | |
| Reported net profit (mn) | 40,658 | 76,796 | 77,181 | 100,489 | 112,329 | 0 | 142,358 |
| Normalised net profit (mn) | 40,658 | 76,796 | 77,181 | 100,489 | 112,329 | 0 | 142,358 |
| FD normalised EPS | 9.37 | 17.56 | 17.65 | 22.98 | 25.69 | 32.55 | |
| FD norm. EPS growth (%) | 24.5 | 87.5 | 88.4 | 30.9 | 45.5 | 26.7 | |
| FD normalised P/E (x) | 67.5 | - | 35.8 | - | 24.6 | - | 19.4 |
| EV/EBITDA (x) | 25.9 | - | 18.5 | - | 14.4 | - | 11.9 |
| Price/book (x) | 7.5 | - | 6.8 | - | 6.0 | - | 5.3 |
| Dividend yield (%) | 1.0 | - | 2.0 | - | 2.9 | - | 3.7 |
| ROE (%) | 11.3 | 19.6 | 19.7 | 23.2 | 25.6 | 28.6 | |
| Net debt/equity (%) | 43.5 | 63.4 | 63.2 | 73.6 | 69.8 | 62.8 |
Source: Company data, Nomura estimates
May
Global Markets Research 30 June 2026
| Rating Remains | Buy |
|---|---|
| Target price Increased from TWD 575.00 | TWD 730.00 |
| Closing price 26 June 2026 | TWD 632.00 |
| Implied upside | +15.5% |
| Market Cap (USD mn) | 88,408.1 |
| ADT (USD mn) | 430.7 |
Relative performance chart
Source: LSEG, Nomura
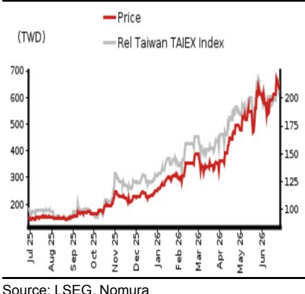
Research Analysts Semiconductor
Aaron Jeng, CFA - NITB aaron.jeng@nomura.com +886(2) 21769962
Donnie Teng - NIHK
donnie.teng@nomura.com +852 2252 1439
Vivian Yang - NITB vivian.yang@nomura.com
+886(2) 21769970
Eric Chen, CFA - NITB eric.chen@nomura.com
+886(2) 21769965
Key data on ASE Technology Holding
Cashflow statement (TWDmn)
| Year-end 31 Dec | FY24 | FY25 | FY26F | FY27F | FY28F |
|---|---|---|---|---|---|
| EBITDA | 95,162 | 114,363 | 165,146 | 217,245 | 263,255 |
| Change in working capital Other operating cashflow | 23,437 -27,811 | 3,377 24,510 | -4,537 -13,603 | -5,580 -27,214 | -4,924 -39,763 |
| Cashflow from operations | 90,788 | 142,249 | 147,005 | 184,451 | 218,569 |
| expenditure | -280,000 | -228,004 | |||
| Capital | -79,522 | -164,643 | -272,091 | ||
| Free cashflow | 11,266 | -22,393 | -125,086 | -95,549 | -9,435 |
| Reduction in investments | -12,870 | -3,133 | 6,490 | -1,045 | -1,066 |
| Net acquisitions | 0 | 0 | 0 | 0 | 0 |
| Dec in other LT assets | -23,788 | -5,957 | 62,624 | 88,000 | 88,004 |
| Inc in other LT liabilities Adjustments | 32,271 | 8,088 | 0 | 0 | 0 |
| CF after investing acts | 6,879 | -23,395 | -55,972 | -8,593 | 77,503 |
| Cash dividends | -22,459 | -23,034 | -29,438 | -55,882 | -81,331 |
| Equity issue | 0 | 0 61,214 | 0 | 0 82,899 | 0 |
| 67,132 | 74,286 | ||||
| Debt issue Convertible | 22,605 | 1,191 | -11,892 | ||
| debt issue Others | 2,183 | -1,610 | -1,744 | ||
| CF from financial | acts 2,329 | 39,371 | 25,801 | 25,407 | -8,788 |
| Net cashflow | 9,208 | 15,976 76,493 | -30,171 | 16,813 62,298 | 68,715 |
| Beginning cash | 67,285 | 92,469 | 79,112 | ||
| Ending cash | 76,493 | 92,469 | 62,298 | 79,112 | 147,826 |
| Ending net debt | |||||
| 331,304 | |||||
| 117,107 | |||||
| (TWDmn) | 162,346 | 259,648 | 325,733 | ||
| Balance sheet As at 31 Dec Cash & equivalents | FY24 | FY25 76,493 | FY26F 92,469 62,298 | FY27F 79,112 6,803 | FY28F 147,826 12,711 213,834 |
| Marketable securities Accounts receivable | 8,391 116,315 | 7,754 | 5,357 162,068 | 191,772 | |
| 127,542 | 116,326 | ||||
| Inventories | 61,181 | 69,383 | 88,166 | 104,325 25,031 | 27,911 |
| Other current assets | 12,905 | 16,648 | 21,154 | ||
| Total current assets | 275,285 | 313,795 | 339,043 | 407,042 | 518,609 |
| LT investments | 57,173 | 60,306 | 53,815 | 54,860 | 55,926 |
| Fixed assets | |||||
| Goodwill | |||||
| 728,979 | |||||
| 312,531 | 421,115 | 560,007 | |||
| 674,375 | |||||
| Other intangible assets Other LT assets Total assets | 95,708 740,698 53,872 | 889,333 40,734 | 94,118 | 94,118 1,230,394 128,349 | 72,322 140,500 |
| Short-term debt Accounts payable Other current | 78,221 | 88,754 | 110,939 145,955 | 172,706 | |
| liabilities Total current | 98,847 | 114,861 | 368,528 | 192,574 405,395 | |
| liabilities | 230,940 | ||||
| 139,728 | 244,349 214,081 | 314,689 | 406,809 | ||
| Long-term debt | 264,151 | 337,370 | |||
| Convertible debt liabilities | 24,243 394,911 | 57,536 | 57,536 | 57,536 763,435 | 57,536 |
| Other LT Total liabilities | 515,966 | 869,741 | |||
| 636,376 | 44,480 244,170 | ||||
| Minority interest Preferred stock Common stock | 177,687 345,787 | 44,153 123,947 140,171 188,717 | 44,480 44,480 187,818 410,607 | 466,959 1,230,394 | 44,480 305,101 178,310 527,890 |
| Retained earnings Proposed dividends Other equity and reserves | 740,698 | 1,397,631 | |||
| Total shareholders' equity Total equity & liabilities | 373,368 889,333 | 178,310 | 178,310 | ||
| 1,046,984 | |||||
| Liquidity (x) | 1.19 8.0 9.0 1.42 43.5 | 1.28 1.08 1.57 63.2 | 1.10 13.9 1.50 | 15.3 | |
| Current ratio Interest cover Leverage Net debt/EBITDA (x) Net debt/equity Per share | (%) 7.52 7.52 7.52 | 1.23 33.9 9.37 9.37 | 17.65 17.65 | 69.8 25.69 | 1.26 62.8 |
| Norm EPS (TWD) FD norm EPS BVPS (TWD) | 78.32 | 83.94 | 17.65 | 25.69 | 32.55 32.55 |
| (TWD) | 92.31 | 25.69 | 32.55 | ||
| DPS (TWD) | 104.98 | 118.68 | |||
| 6.62 | 12.56 | ||||
| Activity (days) | 5.18 | ||||
| 18.28 | 23.17 | ||||
| 70.9 | 69.0 | 65.2 | 67.1 | 67.2 | |
| Days receivable Days inventory | 45.6 | 44.9 | 45.0 | 47.8 | 48.8 |
| Days payable | 54.4 | 57.4 | 57.0 | ||
| 59.4 | 59.5 | ||||
| Cash cycle | 62.1 | 56.4 | |||
| 53.2 | |||||
| 55.5 | |||||
| 56.6 | |||||
| Reported EPS | (TWD) | 9.37 | 1.28 | ||
| 13.0 | |||||
| 94,118 | |||||
| 57,795 | 1,397,631 | ||||
| 94,118 1,046,984 | 67,474 |
Source: Company data, Nomura estimates
Performance
| (%) | 1M | 3M | 12M | ||
|---|---|---|---|---|---|
| Absolute (TWD) | 3.4 | 76 | 314.4 | M cap (USDmn) | 88,408.1 |
| Absolute (USD) | 2.1 | 76.2 | 277.1 | Free float (%) | 89.4 |
| Rel to Taiwan TAIEX Index | 1 | 42.3 | 216.3 | 3-mth ADT (USDmn) | 430.7 |
Income statement (TWDmn)
| Year-end 31 Dec | FY24 | FY25 | FY26F | FY27F | FY28F |
|---|---|---|---|---|---|
| Revenue | 595,410 | 645,388 | 810,252 | 962,066 | 1,104,144 |
| Cost of goods sold | -498,478 | -531,195 | -639,465 | -735,642 | -827,043 |
| Gross profit | 96,932 | 114,193 | 170,787 | 226,424 | 277,101 |
| SG&A | -57,765 | -63,437 | -76,217 | -86,811 | -99,241 |
| Employee share expense | |||||
| Operating profit | 39,166 | 50,756 | 94,571 | 139,612 | 177,859 |
| EBITDA | 95,162 | 114,363 | 165,146 | 217,245 | 263,255 |
| Depreciation | -55,995 | -63,607 | -70,575 | -77,633 | -85,396 |
| Amortisation | |||||
| EBIT | 39,166 | 50,756 | 94,571 | 139,612 | 177,859 |
| Net interest expense | -4,881 | -5,624 | -7,266 | -10,044 | -11,636 |
| Associates & JCEs | 1,716 | 933 | 1,042 | 1,045 | 1,066 |
| Other income | 5,682 | 5,236 | 7,140 | 7,106 | 7,115 |
| Earnings before tax | 41,683 | 51,301 | 95,486 | 137,719 | 174,405 |
| Income tax | -7,758 | -9,460 | -16,916 | -23,875 | -30,400 |
| Net profit after tax | 33,926 | 41,841 | 78,570 | 113,844 | 144,005 |
| Minority interests | -1,443 | -1,182 | -1,389 | -1,514 | -1,648 |
| Other items | |||||
| Preferred dividends | |||||
| Normalised NPAT | 32,482 | 40,658 | 77,181 | 112,329 | 142,358 |
| Extraordinary items | |||||
| Reported NPAT | 32,482 | 40,658 | 77,181 | 112,329 | 142,358 |
| Dividends | -23,034 | -29,438 | -55,882 | -81,331 | -103,072 |
| Transfer to reserves | 9,448 | 11,220 | 21,299 | 30,999 | 39,286 |
| Valuations and ratios | |||||
| Reported P/E (x) | 84.0 | 67.5 | 35.8 | 24.6 | 19.4 |
| Normalised P/E (x) | 84.0 | 67.5 | 35.8 | 24.6 | 19.4 |
| FD normalised P/E (x) | 84.0 | 67.5 | 35.8 | 24.6 | 19.4 |
| Dividend yield (%) | 0.8 | 1.0 | 2.0 | 2.9 | 3.7 |
| Price/cashflow (x) | 30.1 | 19.3 | 18.8 | 15.0 | 12.6 |
| Price/book (x) | 8.1 | 7.5 | 6.8 | 6.0 | 5.3 |
| EV/EBITDA (x) | 30.3 | 25.9 | 18.5 | 14.4 | 11.9 |
| EV/EBIT (x) | 71.8 | 57.7 | 32.2 | 22.4 | 17.6 |
| Gross margin (%) | 16.3 | 17.7 | 21.1 | 23.5 | 25.1 |
| EBITDA margin (%) | 16.0 | 17.7 | 20.4 | 22.6 | 23.8 |
| EBIT margin (%) | 6.6 | 7.9 | 11.7 | 14.5 | 16.1 |
| Net margin (%) | 5.5 | 6.3 | 9.5 | 11.7 | 12.9 |
| Effective tax rate (%) | 18.6 | 18.4 | 17.7 | 17.3 | 17.4 |
| Dividend payout (%) | 70.9 | 72.4 | 72.4 | 72.4 | 72.4 |
| ROE (%) | 9.8 | 11.3 | 19.7 | 25.6 | 28.6 |
| ROA (pretax %) | 6.5 | 7.1 | 10.7 | 13.2 | 14.9 |
| Growth (%) | |||||
| Revenue | 2.3 | 8.4 | 25.5 | 18.7 | 14.8 |
| EBITDA | 0.7 | 20.2 | 44.4 | 31.5 | 21.2 |
| Normalised EPS | 1.8 | 24.5 | 88.4 | 45.5 | 26.7 |
| Normalised FDEPS | 1.8 | 24.5 | 88.4 | 45.5 | 26.7 |
Source: Company data, Nomura estimates
Company profile
ASEH is one of the world's largest OSAT players. Established in 1984, ASE Group specialises in providing semiconductor packaging and testing services. In 2016, ASE Group and SPIL announced a merger and founded ASEH. Currently, ASEH's members include ASE Group, SPIL and USI.
Valuation Methodology
Our TP of TWD730.00 is based on 25x average 2027-28F EPS. Our target P/E of 25x is at the high-end of its historical range. The benchmark index for the stock is TWSE index.
Risks that may impede the achievement of the target price
Downside risks: 1) AI hardware chip demand sustainability; 2) ASE's execution on if they can deliver good-enough yield for CoW process.
ESG
ASEH manages its corporate social responsibility by focusing on six dimensions: stakeholder engagement, sustainability governance, green transformation, inclusive workspace, responsible procurement and corporate citizenship. The company sets water- saving milestones and establishes low-carbon plants in practice.
LEAP to drive revenue upside into 2027F along with a better margin profile
We provide a simple simulation of ASE's LEAP business: we assume the oS business to continue growing along with TSMC's CoWoS expansion plan, accounting for more than half of ASE's LEAP revenue in 2026-27F. Full process revenue will likely record strong growth momentum in conjunction with AMD's Venice CPU ramp-up. On the testing side, ASE is one of the key beneficiaries of TSMC's testing outsourcing activities, mainly on the CP part. We also believe ASE is providing FT services for some key ASICs.
We estimate LEAP revenue to grow from USD3.5 bn in 2026F to USD6.9 in 2027F. Given the LEAP business is margin-accretive, we expect continued margin expansion.
Fig. 94: ASE's LEAP revenue breakdown and forecasts
| LEAP revenue | 2023F | 2024F | 2025F | 2026F | 2027F |
|---|---|---|---|---|---|
| Packaging (USDmn)* | 230 | 550 | 1,300 | 2,625 | |
| Packaging as %of LEAP | 92% | 92% | 81% | 75% | 74% |
| oS (outsourcing business) - we do not assume any CoW outsourcing from TSMC | oS (outsourcing business) - we do not assume any CoW outsourcing from TSMC | oS (outsourcing business) - we do not assume any CoW outsourcing from TSMC | oS (outsourcing business) - we do not assume any CoW outsourcing from TSMC | oS (outsourcing business) - we do not assume any CoW outsourcing from TSMC | oS (outsourcing business) - we do not assume any CoW outsourcing from TSMC |
| Total oS as %of LEAP packaging | 13% | 64% | 76% | 79% | 69% |
| Total oS as %of LEAP | 12% | 58% | 61% | 59% | 51% |
| Total TSMC CoWoS output, NMRe | 120 | 321 | 624 | 1,092 | 1,845 |
| y-y | 169% | 94% | 75% | 69% | |
| Revenue contribution (USDmn) | 30 | 350 | 983 | 2,075 | 3,507 |
| y-y | 1067% | 181% | 111% | 69% | |
| FOWLP | |||||
| %of LEAP packaging | 87% | 36% | 15% | 8% | 4% |
| %of LEAP | 80% | 33% | 13% | 6% | 3% |
| Revenue contribution (USDmn) | 200 | 200 | 200 | 200 | 200 |
| Full process | |||||
| %of LEAP packaging | 0% | 0% | 9% | 13% | 27% |
| %of LEAP | 0% | 0% | 7% | 10% | 20% |
| Revenue contribution (USDmn) | - | - | 117 | 350 | 1,400 |
| y-y | 200% | 300% | |||
| Total LEAP packaging | 230 | 550 | 1,300 | 2,625 | 5,107 |
| y-y | 139% | 136% | 102% | 95% | |
| Testing (USDmn)* | 20 | 50 | 300 | 875 | |
| Testing as %of LEAP | 8% | 8% | 19% | 25% | 26% |
| CP as %of LEAP testing | 100% | 100% | 95% | 75% | 75% |
| CP as %of LEAP | 8% | 8% | 18% | 19% | 19% |
| Revenue contribution (USDmn) | 20 | 50 | 285 | 656 | 1,313 |
| y-y | 150% | 470% | 130% | 100% | |
| FT | |||||
| FT as %of LEAP testing | 0% | 0% | 5% | 25% | 25% |
| FT as %of LEAP | 0% | 0% | 1% | 6% | 6% |
| Revenue contribution (USDmn) | - | - | 15 | 219 | 438 |
| y-y | 1358% | 100% | |||
| Total LEAP testing | 20 | 50 | 300 | 875 | 1,750 |
| y-y | 150% | 500% | 192% | 100% | |
| Total LEAP revenue (USDmn) | 250 | 600 | 1,600 | 3,500 | 6,857 |
| y-y | 140% | 167% | 119% | 96% |
Note: *incorporates company guidelines
Source: Company data, Nomura estimates
8,000
7,000
6,000
5,000
4,000
3,000
2,000
1,000
-
Fig. 95: ASE's LEAP revenue
USDmn
MOS
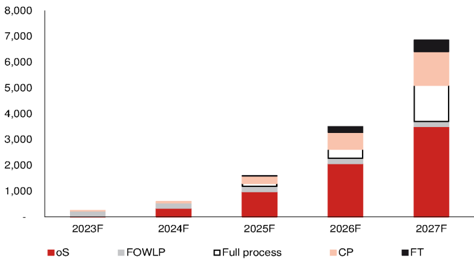
Source: Company data, Nomura estimates
Financial analysis and forecasts
Fig. 97: ASE's 2026-27F forecast revisions
| 2026F | 2026F | 2026F | 2027F | 2027F | 2027F | |
|---|---|---|---|---|---|---|
| (TWD mn) | Revised | Previous | Change | Revised | Previous | Change |
| Net sales | 810,252 | 807,643 | 0.3% | 962,066 | 911,129 | 5.6% |
| Gross profit | 170,787 | 170,042 | 0.4% | 226,424 | 207,818 | 9.0% |
| Operating profit | 94,571 | 94,104 | 0.5% | 139,612 | 125,259 | 11.5% |
| Net profit | 77,181 | 76,796 | 0.5% | 112,329 | 100,489 | 11.8% |
| EPS (TWD) | 17.65 | 17.56 | 0.5% | 25.69 | 22.98 | 11.8% |
| Margin | Revised | Previous | Change | Revised | Previous | Change |
| Gross margin (%) | 21.1 | 21.1 | 0.0 pp | 23.5 | 22.8 | 0.7 pp |
| Operating margin (%) | 11.7 | 11.7 | 0.0 pp | 14.5 | 13.7 | 0.8 pp |
| Net margin (%) | 9.5 | 9.5 | 0.0 pp | 11.7 | 11.0 | 0.6 pp |
Source: Company data, Nomura estimates
Fig. 98: ASEH's P&L
| (TWDmn) | 1Q25 | 2Q25 | 3Q25 | 4Q25 | 1Q26 | 2Q26F | 3Q26F | 4Q26F | 1Q27F | 2Q27F | 3Q27F | 4Q27F | 2025 | 2026F | 2027F | 2028F |
|---|---|---|---|---|---|---|---|---|---|---|---|---|---|---|---|---|
| Net sales | 148,153 | 150,750 | 168,569 | 177,915 | 173,662 | 188,873 | 221,638 | 226,079 | 209,857 | 224,273 | 260,422 | 267,514 | 645,388 | 810,252 | 962,066 | 1,104,144 |
| Gross profit | 24,893 | 25,688 | 28,877 | 34,736 | 34,850 | 38,979 | 47,321 | 49,638 | 49,149 | 52,328 | 60,507 | 64,440 | 114,193 | 170,787 | 226,424 | 277,101 |
| - OPEX | (15,221) | (15,494) | (15,676) | (17,045) | (17,318) | (18,225) | (20,210) | (20,463) | (19,396) | (20,697) | (22,928) | (23,791) | (63,437) | (76,217) | (86,811) | (99,241) |
| Operating profit | 9,671 | 10,193 | 13,201 | 17,690 | 17,532 | 20,753 | 27,111 | 29,175 | 29,753 | 31,630 | 37,579 | 40,649 | 50,756 | 94,571 | 139,612 | 177,859 |
| Net profit | 7,554 | 7,521 | 10,870 | 14,714 | 14,148 | 17,176 | 22,197 | 23,660 | 23,924 | 25,607 | 30,242 | 32,556 | 40,658 | 77,181 | 112,329 | 142,358 |
| EPS (TWD) | 1.75 | 1.74 | 2.50 | 3.39 | 3.24 | 3.93 | 5.08 | 5.41 | 5.47 | 5.86 | 6.92 | 7.44 | 9.37 | 17.65 | 25.69 | 32.55 |
| Profitability | 1Q25 | 2Q25 | 3Q25 | 4Q25 | 1Q26 | 2Q26F | 3Q26F | 4Q26F | 1Q27F | 2Q27F | 3Q27F | 4Q27F | 2025 | 2026F | 2027F | 2028F |
| Gross margin | 16.8% | 17.0% | 17.1% | 19.5% | 20.1% | 20.6% | 21.4% | 22.0% | 23.4% | 23.3% | 23.2% | 24.1% | 17.7% | 21.1% | 23.5% | 25.1% |
| - OPEX ratio | (10.3%) | (10.3%) | (9.3%) | (9.6%) | (10.0%) | (9.6%) | (9.1%) | (9.1%) | (9.2%) | (9.2%) | (8.8%) | (8.9%) | (9.8%) | (9.4%) | (9.0%) | (9.0%) |
| Operating margin | 6.5% | 6.8% | 7.8% | 9.9% | 10.1% | 11.0% | 12.2% | 12.9% | 14.2% | 14.1% | 14.4% | 15.2% | 7.9% | 11.7% | 14.5% | 16.1% |
| Net margin | 5.1% | 5.0% | 6.4% | 8.3% | 8.1% | 9.1% | 10.0% | 10.5% | 11.4% | 11.4% | 11.6% | 12.2% | 6.3% | 9.5% | 11.7% | 12.9% |
| Q-Q | 1Q25 | 2Q25 | 3Q25 | 4Q25 | 1Q26 | 2Q26F | 3Q26F | 4Q26F | 1Q27F | 2Q27F | 3Q27F | 4Q27F | 2025 | 2026F | 2027F | 2028F |
| Net sales | (8.7%) | 1.8% | 11.8% | 5.5% | (2.4%) | 8.8% | 17.3% | 2.0% | (7.2%) | 6.9% | 16.1% | 2.7% | ||||
| Gross profit | (6.5%) | 3.2% | 12.4% | 20.3% | 0.3% | 11.8% | 21.4% | 4.9% | (1.0%) | 6.5% | 15.6% | 6.5% | ||||
| Operating profit | (13.7%) | 5.4% | 29.5% | 34.0% | (0.9%) | 18.4% | 30.6% | 7.6% | 2.0% | 6.3% | 18.8% | 8.2% | ||||
| Net profit | (18.9%) | (0.4%) | 44.5% | 35.4% | (3.8%) | 21.4% | 29.2% | 6.6% | 1.1% | 7.0% | 18.1% | 7.7% | ||||
| Y-Y | 1Q25 | 2Q25 | 3Q25 | 4Q25 | 1Q26 | 2Q26F | 3Q26F | 4Q26F | 1Q27F | 2Q27F | 3Q27F | 4Q27F | 2025 | 2026F | 2027F | 2028F |
| Net sales | 11.6% | 7.5% | 5.3% | 9.6% | 17.2% | 25.3% | 31.5% | 27.1% | 20.8% | 18.7% | 17.5% | 18.3% | 8.4% | 25.5% | 18.7% | 14.8% |
| Gross profit | 19.6% | 11.4% | 9.3% | 30.4% | 40.0% | 51.7% | 63.9% | 42.9% | 41.0% | 34.2% | 27.9% | 29.8% | 17.8% | 49.6% | 32.6% | 22.4% |
| - OPEX | 4.8% | 10.5% | 13.8% | 17.6% | 28.9% | 20.1% | 12.0% | 13.6% | 13.4% | 16.3% | 9.8% | 20.1% | 13.9% | 14.3% | ||
| Operating profit | 29.3% | 13.2% | 15.1% | 57.8% | 81.3% | 103.6% | 105.4% | 64.9% | 69.7% | 52.4% | 38.6% | 39.3% | 29.6% | 86.3% | 47.6% | 27.4% |
| Net profit | 33.5% | (3.3%) | 11.7% | 58.0% | 87.3% | 128.4% | 104.2% | 60.8% | 69.1% | 49.1% | 36.2% | 37.6% | 25.2% | 89.8% | 45.5% | 26.7% |
Source: Company data, Nomura estimates
/0
mOS
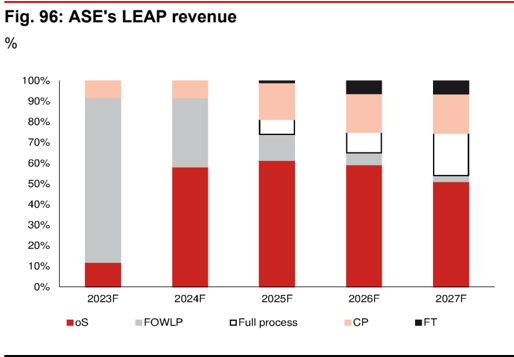
Source: Company data, Nomura estimates
MUL
200%
34
29
150%
24
100%
19
50%
14
0%
9
4
Jun-21
-50%
Oct-25
7.5
6.5
Fig. 99: Nomura forecasts vs Bloomberg consensus for 2026-2028F
4.5
| 2026F | 2026F | 2026F | 2027F | 2027F | 2027F | 2028F | 2028F | 2028F | |
|---|---|---|---|---|---|---|---|---|---|
| (TWD mn) | NMR | BBG | Diff (%) | NMR | BBG | Diff (%) | NMR | BBG | Diff (%) |
| Sales | 810,252 | 785,058 | 3.2 | 962,066 | 968,922 | (0.7) | 1,104,144 | 1,090,842 | 1.2 |
| Gross profit | 170,787 | 165,325 | 3.3 | 226,424 | 226,660 | (0.1) | 277,101 | 268,467 | 3.2 |
| Operating profit | 94,571 | 92,528 | 2.2 | 139,612 | 147,237 | (5.2) | 177,859 | 197,031 | (9.7) |
| Net profit | 77,181 | 74,125 | 4.1 | 112,329 | 116,821 | (3.8) | 142,358 | 141,942 | 0.3 |
| EPS (TWD) | 17.65 | 16.43 | 7.4 | 25.69 | 25.95 | (1.0) | 32.55 | 31.28 | 4.1 |
| Margin | NMR | BBG | Diff (pp) | NMR | BBG | Diff (pp) | NMR | BBG | Diff (pp) |
| Gross margin (%) | 21.1 | 21.1 | 0.0 | 23.5 | 23.4 | 0.1 | 25.1 | 24.6 | 0.5 |
| Operating margin (%) | 11.7 | 11.8 | (0.1) | 14.5 | 15.2 | (0.7) | 16.1 | 18.1 | (2.0) |
| Net margin (%) | 9.5 | 9.4 | 0.1 | 11.7 | 12.1 | (0.4) | 12.9 | 13.0 | (0.1) |
Source: Company data, Bloomberg consensus, Nomura estimates
Valuation methodology and risks
Our new TP of TWD730.00 is based on 25x average 2027-28F EPS. Our target P/E of 25x (unchanged) is at the high-end of its historical range.
Downside risks: 1) AI hardware chip demand sustainability; and 2) ASE's execution on if they can deliver good-enough yield for CoW process.
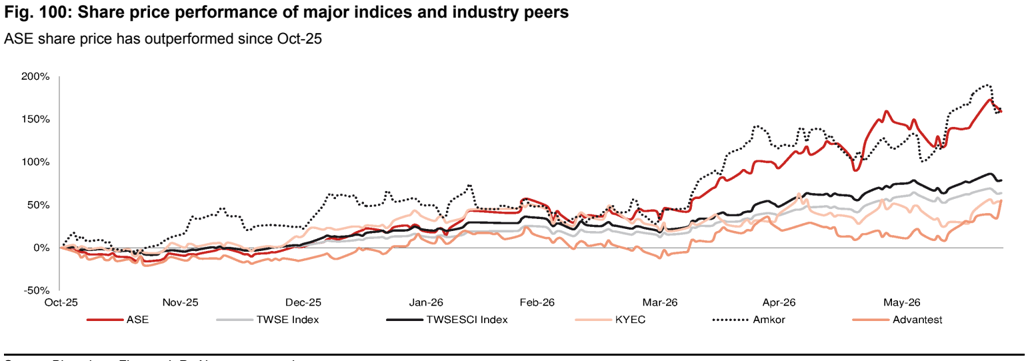
Source: Bloomberg Finance L.P., Nomura research
Fig. 101: ASEH's 5-year consensus P/E
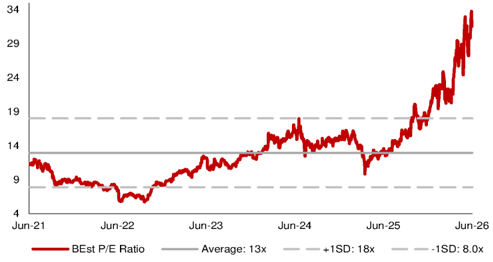
Source: Bloomberg Finance L.P. consensus, Nomura research
Fig. 102: ASEH's 5-year consensus P/B
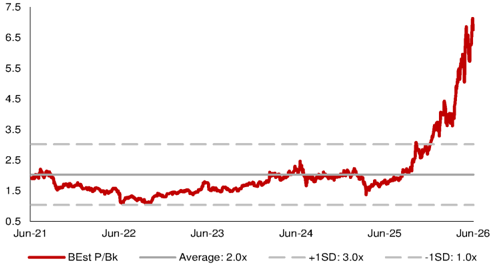
Source: Bloomberg Finance L.P. consensus, Nomura research
35
30
25
20
15
10
5
Jun-21
800
700
600
500
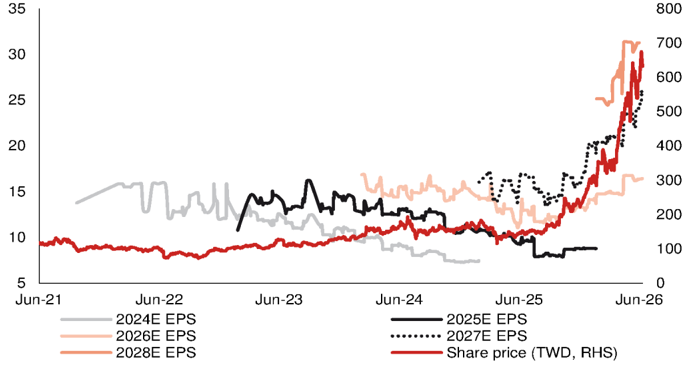
Source: Company data, Bloomberg Finance L.P., Nomura research
Fig. 103: ASEH's share price vs Bloomberg consensus EPS revisions
Relative performance chart
EQUITY: TECHNOLOGY
Price
(TWD)
20000 1
175001
15000-
12500-
10000-
7500-
5000 -
- 200
175
-150
-125
ASPEED Technology 5274.TWO 5274 TT
EQUITY: TECHNOLOGY
Churra. I CEC Namura
Customer demand continues to rise; raise TP
Despite overbooking risks, demand continues to rise; we expect further earnings upside
Order outlook momentum continues; reiterate Buy
We raised our 2026F BMC (baseboard management controller) shipment estimate for ASPEED from 22mn in Dec-25 to 25-30mn in Mar-26 owing to the strong demand for both general servers and AI servers, and also our expectation of overbooking. Over the past three months, we continue to see upward revision in customer orders, as reflected in ASPEED's book-to-bill ratio (>2). The advent of agentic AI is driving a significant rise in CPU server demand. Although substrate constraint could potentially cap 3Q26F revenue upside (conservative guidance of TWD4.1-4.3bn vs. Bloomberg consensus at TWD4.3bn, we expect TWD4.7bn), we expect 4Q26F to record significant revenue growth q-q on improved supply with more OSAT vendors joining. We estimate total BMC shipments in 2026F to reach ~33mn. The order momentum should sustain into 2027F, based on our industry checks and ASPEED's comment about a huge backlog. We estimate total BMC shipments to experience another signifiant surge and reach 37mn in 2027F. We maintain our view that the strong booking may carry some underlying risk (i.e. correction). We believe the substantial order momentum could still include stockpiling amid a tight supply/cost inflationary environment, while it doesn't necessarily indicate customers are willing to slow down procurement anytime soon. We tentatively assume BMC shipments to plateau with a soft pullback in 2028F (we model 35mn). We raise 2026F/7F EPS by 22%/40%. Based on 50x 2028F EPS, our new TP is TWD19,100 (up from TWD11,500, based on 50x 2027F EPS). The 50x target multiple is at the midend of ASPEED's historical trading range). We reiterate Buy. The stock trades at 40.9x 2028F EPS. Our current EPS projections are on a pre-dilution basis, as we have not factored in 10% stock dividend (9%+ EPS dilution).
Product portfolio further expands content value per server
ASPEED showcased its latest product roadmap (Fig. 108 ) during 2026 Computex and unveiled AST1840 (Fig. 110 -Fig. 111 ), a brand-new chip combining BIC/SMC functions with embedded FPGA (procured from Lattice [LSCC US, NR]). The multi-function chip reduces design footprint, providing an attractive choice for customers who want to downsize PCB. ASPEED continues to expand its product offshoots in the core server market despite iterating existing product families, all leading to higher value content within one server. Therefore, even if the server market becomes saturated, ASPEED could still enjoy content value increase from mix optimization as well as to expand into adjacencies. We estimate ASPEED's total content value per server could reach 7-8x (if not higher) in AST2800 gen, vs. AST2500 gen (Fig. 112 ).
| Year-end 31 Dec Currency (TWD) | FY25 Actual | Old | FY26F New | Old | FY27F New | Old | FY28F New |
|---|---|---|---|---|---|---|---|
| Revenue (mn) | 9,085 | 14,970 | 18,050 | 20,083 | 27,338 | 0 | 32,313 |
| Reported net profit (mn) | 3,928 | 6,476 | 7,885 | 8,729 | 12,218 | 0 | 14,433 |
| Normalised net profit (mn) | 3,928 | 6,476 | 7,885 | 8,729 | 12,218 | 0 | 14,433 |
| FD normalised EPS | 103.92 | 171.34 | 208.58 | 230.93 | 323.21 | 381.81 | |
| FD norm. EPS growth (%) | 52.7 | 72.6 | 100.7 | 34.8 | 55.0 | 18.1 | |
| FD normalised P/E (x) | 150.3 | - | 74.9 | - | 48.3 | - | 40.9 |
| EV/EBITDA (x) | 117.3 | - | 56.6 | - | 36.3 | - | 31.6 |
| Price/book (x) | 78.0 | - | 62.7 | - | 38.0 | - | 28.7 |
| Dividend yield (%) | 0.5 | - | 1.0 | - | 1.6 | - | 1.9 |
| ROE (%) | 59.5 | 71.0 | 92.9 | 69.1 | 97.9 | 79.9 | |
| Net debt/equity (%) | net cash | net cash | net cash | net cash | net cash | net cash |
Source: Company data, Nomura estimates
May
Global Markets Research 30 June 2026
| Rating Remains | Buy |
|---|---|
| Target price Increased from TWD 11,500.00 | TWD 19,100.00 |
| Closing price 26 June 2026 | TWD 15,615.00 |
| Implied upside | +22.3% |
| Market Cap (USD mn) | 18,510.9 |
| ADT (USD mn) | 148.2 |
Relative performance chart
Source: LSEG, Nomura
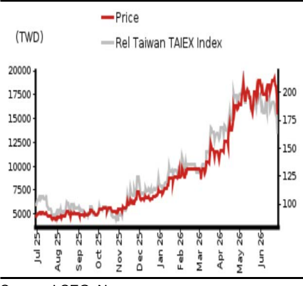
Research Analysts
Semiconductor
Aaron Jeng, CFA - NITB aaron.jeng@nomura.com +886(2) 21769962
Vivian Yang - NITB
vivian.yang@nomura.com +886(2) 21769970
Eric Chen, CFA - NITB
eric.chen@nomura.com +886(2) 21769965
Key data on ASPEED Technology
Performance
| (%) | 1M | 3M | 12M | ||
|---|---|---|---|---|---|
| Absolute (TWD) | -9.4 | 35.2 | 230.5 | M cap (USDmn) | 18,510.9 |
| Absolute (USD) | -10.6 | 35.3 | 200.7 | Free float (%) | 75.0 |
| Rel to Taiwan TAIEX Index | -11.8 | 1.5 | 132.3 | 3-mth ADT (USDmn) | 148.2 |
Income statement (TWDmn)
| Year-end 31 Dec | FY24 | FY25 | FY26F | FY27F | FY28F |
|---|---|---|---|---|---|
| Revenue | 6,460 | 9,085 | 18,050 | 27,338 | 32,313 |
| Cost of goods sold | -2,306 | -2,906 | -5,705 | -8,790 | -10,514 |
| Gross profit | 4,154 | 6,179 | 12,344 | 18,548 | 21,798 |
| SG&A | -1,235 | -1,518 | -2,614 | -3,332 | -3,813 |
| Employee share expense | |||||
| Operating profit | 2,918 | 4,660 | 9,731 | 15,217 | 17,986 |
| EBITDA | 3,174 | 4,984 | 10,303 | 16,026 | 18,470 |
| Depreciation | -121 | -167 | -331 | -501 | -323 |
| Amortisation | -136 | -157 | -241 | -309 | -162 |
| EBIT | 2,918 | 4,660 | 9,731 | 15,217 | 17,986 |
| Net interest expense | 69 | 143 | 111 | 111 | 111 |
| Associates & JCEs | 0 | 0 | 0 | 0 | 0 |
| Other income | 180 | 52 | 14 | -55 | -55 |
| Earnings before tax | 3,167 | 4,855 | 9,856 | 15,273 | 18,042 |
| Income tax | -596 | -928 | -1,971 | -3,055 | -3,609 |
| Net profit after tax | 2,571 | 3,928 | 7,885 | 12,218 | 14,433 |
| Minority interests | |||||
| Other items | |||||
| Preferred dividends | |||||
| Normalised NPAT | 2,571 | 3,928 | 7,885 | 12,218 | 14,433 |
| Extraordinary items | 0 | 0 | 0 | 0 | |
| Reported NPAT | 2,571 | 3,928 | 7,885 | 12,218 | 14,433 |
| Dividends | -1,967 | -3,024 | -6,071 | -9,408 | -11,113 |
| Transfer to reserves | 605 | 904 | 1,814 | 2,811 | 3,320 |
| Valuations and ratios | |||||
| Reported P/E (x) | 229.5 | 150.3 | 74.9 | 48.3 | 40.9 |
| Normalised P/E (x) | 229.5 | 150.3 | 74.9 | 48.3 | 40.9 |
| FD normalised P/E (x) | 229.5 | 150.3 | 74.9 | 48.3 | 40.9 |
| Dividend yield (%) | 0.3 | 0.5 | 1.0 | 1.6 | 1.9 |
| Price/cashflow (x) | 187.7 | 131.3 | 95.1 | 62.8 | 58.6 |
| Price/book (x) | 104.7 | 78.0 | 62.7 | 38.0 | 28.7 |
| EV/EBITDA (x) | 184.8 | 117.3 | 56.6 | 36.3 | 31.6 |
| EV/EBIT (x) | 201.0 | 125.4 | 59.9 | 38.2 | 32.4 |
| Gross margin (%) | 64.3 | 68.0 | 68.4 | 67.8 | 67.5 |
| EBITDA margin (%) | 49.1 | 54.9 | 57.1 | 58.6 | 57.2 |
| EBIT margin (%) | 45.2 | 51.3 | 53.9 | 55.7 | 55.7 |
| Net margin (%) | 39.8 | 43.2 | 43.7 | 44.7 | 44.7 |
| Effective tax rate (%) | 18.8 | 19.1 | 20.0 | 20.0 | 20.0 |
| Dividend payout (%) | 76.5 | 77.0 | 77.0 | 77.0 | 77.0 |
| ROE (%) | 54.3 | 59.5 | 92.9 | 97.9 | 79.9 |
| ROA (pretax %) | 83.4 | 108.2 | 144.0 | 125.5 | 92.2 |
| Growth (%) | |||||
| Revenue | 106.4 | 40.6 | 98.7 | 51.5 | 18.2 |
| EBITDA | 129.1 | 57.0 | 106.7 | 55.6 | 15.3 |
| Normalised EPS | 155.2 | 52.7 | 100.7 | 55.0 | 18.1 |
| Normalised FDEPS | 155.2 | 52.7 | 100.7 | 55.0 | 18.1 |
Source: Company data, Nomura estimates
Cashflow statement (TWDmn)
| Year-end 31 Dec | FY24 | FY25 | FY26F | FY27F | FY28F |
|---|---|---|---|---|---|
| EBITDA | 3,174 | 4,984 | 10,303 | 16,026 | 18,470 |
| Change in working capital | 666 | 427 | 696 | -3,621 | -4,844 |
| Other operating cashflow | -696 | -915 | -4,795 | -2,998 | -3,552 10,074 |
| Cashflow from operations expenditure | 3,145 | 4,496 | 6,204 | 9,407 | -2,374 |
| Capital | -25 | -274 | -1,326 | -2,008 | |
| Free cashflow | 3,120 | 4,222 | 4,878 | 7,398 | 7,700 |
| Reduction in investments | -321 | -257 | -60 | 0 | 0 |
| Net acquisitions | |||||
| Dec in other LT assets | |||||
| Inc in other LT liabilities Adjustments | 0 | 137 | 24 | 0 | 0 |
| CF after investing acts | 2,799 | 4,101 | 4,842 | 7,398 | 7,700 |
| Cash dividends | -756 | -1,967 | -3,024 | -6,071 | -9,408 |
| Equity issue | 0 | 0 | 0 | 0 | 0 |
| Debt issue | 0 | 0 | 0 | 0 | 0 |
| Convertible debt issue | |||||
| Others | -6 | 7 | 0 | 0 | |
| CF from financial acts | 5 -751 | -1,972 | -3,018 | -6,071 | -9,408 |
| Net cashflow | 2,048 | 2,129 | 1,824 | 1,327 | -1,707 |
| Beginning cash | 1,612 | 3,659 | 5,788 | 8,940 | |
| Ending cash | 3,659 | 5,788 | 7,613 | 7,613 8,940 | 7,233 |
| Ending net debt | -8,940 | -7,233 | |||
| -3,659 | -5,788 | -7,613 | |||
| Balance sheet (TWDmn) | |||||
| As at 31 Dec | FY24 | FY25 | FY26F | FY27F | FY28F |
| Cash & equivalents | 3,659 | 5,788 | 7,613 | 8,940 | 7,233 |
| Marketable securities | 352 | 510 | 559 | 559 | 559 |
| Accounts receivable | 1,437 | 1,606 | 4,785 | 9,184 | 14,676 |
| Inventories | 357 | 280 | 790 | 1,502 | 2,583 |
| Other current assets | 181 | 253 | 253 | 253 | |
| 224 | 25,303 | ||||
| Total current assets LT investments | 5,987 400 | 8,408 492 | 13,999 505 | 20,438 505 | 505 |
| Fixed assets | 355 | 606 | 1,554 | 3,062 | 5,113 |
| Goodwill | |||||
| Other intangible assets | |||||
| Other LT assets | 984 | 828 | 528 | 219 | 57 |
| Total assets | 7,726 | 10,334 | 16,587 | 24,224 | 30,979 |
| Short-term debt | 0 | 0 | 0 | 0 | 0 |
| Accounts payable | 426 | 616 | 1,554 | 3,044 | 4,772 |
| Other current liabilities | 1,457 | 1,828 | 5,304 | 5,304 | 5,304 |
| liabilities | 2,444 | ||||
| Total current | 1,883 | 6,858 0 | 8,348 0 | 10,076 | |
| Long-term debt Convertible debt | 0 | 0 | 322 | 322 | 0 322 |
| Other LT liabilities Total liabilities | 204 2,087 | 319 2,763 | 7,180 | 8,670 | 10,398 |
| Minority interest | |||||
| Preferred stock | |||||
| Common stock | 378 | 378 | 378 | 378 | 378 |
| Retained earnings | 2,854 | 4,558 | 5,747 | 10,673 | 14,255 |
| Proposed dividends | 2,407 | 2,635 | 3,282 | 4,504 | 5,947 |
| Other equity and reserves Total shareholders' equity Total equity & liabilities | 5,639 7,726 | 7,571 10,334 | 9,407 16,587 | 15,555 24,224 | 20,580 30,979 |
| Liquidity (x) | |||||
| 3.18 | 3.44 | 2.04 | 2.45 | 2.51 | |
| Interest cover | - | - | - | ||
| - | |||||
| Current ratio | net cash | - | |||
| Leverage | |||||
| Net debt/EBITDA (x) | net cash | net cash net cash | net cash net cash | net cash | |
| Net debt/equity (%) | net cash | net cash | net cash | ||
| Per share | |||||
| Reported EPS (TWD) | 68.04 | 103.92 | 208.58 | 323.21 | 381.81 |
| Norm EPS (TWD) | 68.04 | 103.92 | 208.58 | 323.21 | 381.81 |
| FD norm EPS (TWD) | 68.04 | 103.92 | 208.58 | 323.21 | 381.81 |
| BVPS (TWD) | 149.10 | 200.27 | 248.84 | 411.46 | 544.41 |
| DPS (TWD) | 52.04 | 80.01 | 160.59 | 248.86 | 293.97 |
| Activity (days) | |||||
| Days receivable | 60.8 | 61.1 | 64.6 | 93.2 | 135.1 |
| Days inventory | 52.5 | 40.0 | 34.2 69.4 | 47.6 | 71.1 |
| Days payable Cash cycle | 52.8 60.5 | 65.4 35.7 | 29.4 | 95.5 45.4 | 136.0 70.2 |
Source: Company data, Nomura estimates
Company profile
ASPEED is a leading IC design house specializing in computing SoC solution, and was founded in 2004. Its major product is baseboard management controller (BMC) for servers. Besides server management SoC, the company also provides PC/AV extension solutions and image processing SoC (Cupola360).
Valuation Methodology
Our TP of TWD19,100 is based on 50x 2028F EPS; 50x is at the mid-end of its historical trading range. The benchmark index is TAIEX.
Risks that may impede the achievement of the target price
Downside risks to our call include: 1) weaker server demand from macro uncertainties; 2) slower ramp on AI server and CoWoS order cut, and 3) slower-than-expected adoption of new products
ESG
ASPEED established Sustainability Committee centralizing ESG issues in 2021. The company continues to develop green energy-saving products. For example, its AST2600 BMC SoC reduces energy use by more than 61%.
AI BMC SAM to reach over 10m+ into 2027F
Under our definition, AI BMC are BMCs in AI servers along with accelerators (GPUs/ASICs); thus we do not include servers without accelerators but are used for AI workloads.
In our previous AI BMC simulation, we used GPU volume forecasts from a server module perspective. We now update the simulation using numbers from the supply side to capture the full potential volume upside and suggest end customers may try to secure components simultaneously, before entering the server assembly stage, either due to concerns over supply constraints or potential price hikes. Thus, gauging SAM from a server module angle may underestimate BMC orders, in our view.
Along with our TSMC (2330 TT, Buy) AI revenue model and CoWoS allocation updates ( report ), our new AI BMC simulation indicates 7m/11m BMC demand from accelerator servers in 2026F/27F. As mentioned above, our chip volume aligns with our revised TSMC AI revenue model, and the number forecast is from a production perspective. We assume the rack architecture for MTIA 400&450 and AMD MI400 series is similar to nVidia's (NVDA US, Not rated) Oberon rack but with a less BMC content.
Fig. 104: BMC SAM analysis for AI server systems in 2024-27F
| From nVidia servers | 2024F | 2025F | 2026F | 2027F | From AWS servers | 2024F | 2025F | 2026F | 2027F | From TPU servers | 2024F | 2025F | 2026F 2027F | |
|---|---|---|---|---|---|---|---|---|---|---|---|---|---|---|
| GPU chip volume (k) | Trainium chip volume (k) | TPU chip volume (k) | ||||||||||||
| Hopper | 4,900 | 480 | - | - | TRN2/2.5 chip volume (k) | 200 | 1,600 | 100 | - | TPU 8t (Mad Dog/A5921; Zebrafish) | - | - | 1,000 | 3,200 |
| L40S | 1,127 | 1,200 | 2,180 | 2,300 | TRN3 chip volume (k) | 1,500 | 1,800 | TPU 8i (Hell Cat; Sunfish) | - | - | 320 | 5,120 | ||
| Blackwell | 240 | 5,480 | - | - | - Liquid-cooling (4 chips per board) | - | - | 75 | 630 | Rack count (k) | 41 | 260 | ||
| Blackwell Ultra | - | - | 6,040 | - | - Air-cooling (2 chips per board) | - | - | 1,425 | 1,170 | BMC per rack (unit) | 16 | 16 | ||
| Rubin | - | - | 2,000 | 8,550 | Rack count (k) | Sum | - | - | 660 | 4,160 | ||||
| Server type mix %for non-L40S | TRN2/2.5 (32 chips per rack) | 6 | 50 | 3 | - | |||||||||
| HGX | 98% | 32% | 30% | 20% | TRN3 | 46 | 46 | From AMD servers | 2024F | 2025F | 2026F | 2027F | ||
| GB or VR (Oberon) | 2% | 68% | 70% | 80% | - Liquid-cooling (64 chips per rack) | - | - | 1 | 10 | GPU chip volume (k) | ||||
| AI server unit (k) | - Air-cooling (32 chips per track) | - | - | 45 | 37 | MI300/325 | 800 | 400 | 100 | - | ||||
| A100/H100/B200/R100… (HGX) | 632 | 239 | 301 | 214 | BMC per rack (unit) | 22 | 22 | 22 | 22 | MI350/355X | - | 400 | 600 | 150 |
| L40S | 282 | 300 | 545 | 575 | Sum | 138 | 1,100 | 1,074 | 1,021 | MI400 series | - | - | 185 | 880 |
| GB200 NVL 72 System (rack count) | - | 52 | - | - | AI server unit (k) | |||||||||
| GB300 NVL 72 System (rack count) | - | - | 59 | - | From MTIA servers | 2024F | 2025F | 2026F | 2027F | MI300/325 | 100 | 50 | 13 | - |
| Vera Rubin NVL144 System (rack count) | - | - | 19 | 95 | MTIA chip volume (k) | MI350/355X | - | 50 | 75 | 19 | ||||
| BF3 attachement rate assumption A100/H100/B200/R100… (HGX) | 30% | 15% | 15% | 15% | MTIA 300 MTIA 400 | - - | 20 - | 30 40 | - 200 | MI400 series # BMC SAM (k) | - | - | 3 | 12 |
| L40S | 30% | 15% | 15% | 15% | MTIA 450 | - | - | - | 40 | MI300/325 | 200 | 100 | 25 | - |
| GB200 NVL 72 System | 30% | 15% | 15% | 15% | Rack count (k) | MI350/355X | - | 100 | 150 | 38 | ||||
| GB300 NVL 72 System | 30% | 15% | 15% | 15% | - MTIA 300 (16 chips per rack) | - | 1 | 2 | - | MI400 series | - | - | 82 | 391 |
| Vera Rubin NVL144 System | 15% | 15% | - MITA 400 &450 (72 chips per rack) | - | - | 1 | 3 | Sum | 200 | 200 | 257 | 429 | ||
| HMC BMC attachement rate assumption | 30% | 15% | BMC content per rack | |||||||||||
| GB200 NVL 72 System | 100% | 100% | - | - | - MTIA 300 (16 chips per rack) | Summary | 2024F | 2025F | 2026F | 2027F | ||||
| GB300 NVL 72 System | - | - | 50% | 50% | BMC | 23 | 23 | 23 | 23 | BMC SAM (k) | ||||
| Vera Rubin NVL144 System | - | - | 50% | 50% | Mini BMC | 16 | 16 | 16 | 16 | nVidia | 1,819 | 3,775 | 4,926 | 5,557 |
| BMC SAM (k) | - MITA 400 &450 (72 chips per rack) | AMD | 200 | 200 | 257 | 429 | ||||||||
| A100/H100/B200/R100… (HGX) | 1,453 | 514 | 648 | 460 | Compute tray | 18 | 18 | 18 | 18 | AWS TRN | 138 | 1,100 | 1,074 | 1,021 |
| L40S | 366 | 345 | 627 | 661 | Others | 17 | 17 | 17 | 17 | Meta MTIA | - | 29 | 63 | 117 |
| GB200 NVL 72 System | - | 2,916 | - 2,743 | - | BMC SAM (k) | TPU | - | - | 660 | 4,160 | ||||
| GB300 NVL 72 System Vera Rubin NVL144 System | - - | - - | 908 | - 4,437 | - MTIA 300 (16 chips per rack) | Total BMC SAM (k) | 2,157 2,157 | 5,104 | 6,980 | 11,284 | ||||
| 3,775 | 4,926 | 5,557 | BMC | - | 29 | 43 | - | - AST2600 | 5,104 | 6,237 | 6,732 4,551 | |||
| Sum | 1,819 | Mini BMC - MITA 400 &450 (72 chips per rack) | - | 20 | 30 | - 117 | - AST2700 Total mini BMC SAM (k) | - | 742 30 | - | ||||
| Sum | - | - | 19 | 20 | ||||||||||
| BMC | - | 29 | 63 | 117 | ||||||||||
| Mini BMC | - | 20 | 30 | - |
Source: Nomura estimates
30
25
20
15
10
5
(5)
Unprecedented BMC demand from nonaccelerator servers Actual shipment: 13.8mn
We have seen strong demand from general server since 2H25, and the booming CPU demand would prompt customers to look for drivers. Server CPU covers plain CPU for non-AI general servers, head-node CPUs paired with accelerators, and CPUs used for AI workloads. We believe the second and third categories are driving substantial demand for server CPUs, especially the last one after the Agentic AI boom.
ASPEED's latest BMC TAM forecast in Mar-2026 suggests BMC TAM would reach 65.77mn in 2030E. The company also spilts AI-related general server for the first time as it sees strong demand for agentic AI workload and simple inference tasks (Fig. 107 ).
BMCs for servers with accelerators (along with headnode CPUs) are covered under our AI BMC section above, while we classify pure-CPU servers (for AI and non-AI workloads) as non-accelerator servers within general server without further breakdown.
In our updated inventory analysis for non-AI BMCs, we adopt new server forecasts from our team (report ) - general server units to grow 31%/26% in 2026F/27F. Based on our current end device assumptions and total BMC shipment assumption in earnings model, we believe the substantial order momentum could still include some stockpiling amid tight supply/cost inflationary environment, while it doesn't necessarily indicate customers are willing to slow down the procurement anytime soon.
Fig. 105: ASPEED's BMC shipment simulation
| (mn units for shipment) | 2017 | 2018 | 2019 | 2020 | 2021 | 2022 | 2023 | 2024 | 2025 | 2026F | 2027F |
|---|---|---|---|---|---|---|---|---|---|---|---|
| ASPEED market share assumption - A | 59% | 63% | 68% | 71% | 71% | 71% | 71% | 71% | 71% | 71% | |
| ASPEED BMC shipment forecast NMRe | 6.8 | 7.9 | 8.6 | 11.2 | 13.2 | 14.9 | 7.0 | 13.2 | 19.0 | 32.8 | 37.2 |
| - y-y growth | 16% | 8% | 30% | 18% | 13% | -53% | 89% | 43% | 73% | 13% | |
| - BMC for AI | 0.1 | 0.3 | 0.5 | 2.2 | 5.1 | 7.0 | 11.3 | ||||
| - y-y growth | 200% | 67% | 331% | 137% | 37% | 62% | |||||
| - BMC for non-AI - B | 6.8 | 7.9 | 8.6 | 11.2 | 13.1 | 14.6 | 6.5 | 11.1 | 13.8 | 25.8 | 25.9 |
| - y-y growth | 16% | 8% | 30% | 17% | 12% | -56% | 70% | 25% | 86% | 0% | |
| Total server shipment NMRe | 10.2 | 11.8 | 11.7 | 12.3 | 12.8 | 13.7 | 10.9 | 12.3 | 15.1 | 20.3 | 26.0 |
| - y-y growth | 15% | -1% | 6% | 4% | 7% | -21% | 13% | 22% | 35% | 28% | |
| General server shipment NMRe | 12.3 | 12.7 | 13.6 | 10.5 | 11.4 | 13.6 | 17.8 | 22.5 | |||
| - y-y growth - C | 3% | 7% | -23% | 9% | 19% | 31% | 26% | ||||
| AI server shipment NMRe | 0.1 | 0.2 | 0.4 | 0.9 | 1.5 | 2.5 | 3.5 | ||||
| - y-y growth | 15% | 155% | 130% | 68% | 67% | 43% | |||||
| Implied demand/shipment based on market share (A) and general server shipment y-y (C) - D | 11.2 | 12.0 | 12.9 | 10.0 | 10.9 | 12.9 | 16.9 | 21.3 | |||
| Overship/Undership - (B) - (D) | - | 1.1 | 1.8 | (3.5) | 0.2 | 0.9 | 8.9 | 4.6 | |||
| Cumulative overship/undership | 1.1 | 2.8 | (0.6) | (0.4) | 0.5 | 9.4 | 14.0 |
Source: IDC, company data, Nomura estimates
Fig. 106: BMC shipment analysis
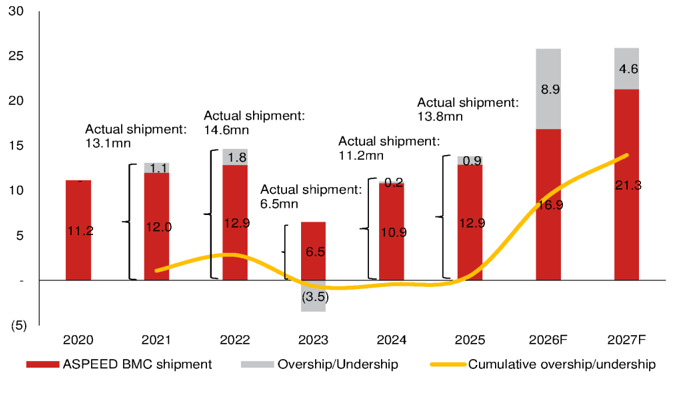
Source: Company data, Nomura estimates
nor eeu mamalls expanamy prouuct portiono
BMC
AST2700
Design-in Phase
SMC
AST2700
AST2700 Ramp-up
AST2755 Design-in Phase
Fig. 107: ASPEED's BMC TAM forecast
nor eEu mamtamls expanlumly prouucl portiono
AST2700
ASPEED recorded strong demand from AI-related general server
AST1840
g* Gen BMC SoC
World's first 12nm BMC Soc next-generation Al and server
BMC TAM is estimated to be 65.77 million units in 2030.
SMC + eFPGA
PROT
Million Units
70
1/0 Expander
60
AST1840
Production-ready
BMC TAM Forecast by ASPEED in March 2026
Ramp-up
Design-in Phas designed to efficiently manage
AST1060 AST1080 Production-ready AST1080 platforms, including PCle Gen4, LTPI, DDRS, USB 3.2, and UFS. AST1080
Kamb-un
- AST1700 esign-in Phase AST1700 Production-ready AST1700 Ramp-ur CB-
50
40
30
- 2024 2025 2026
Source: Company data, Nomura research
20
10
2027
2028
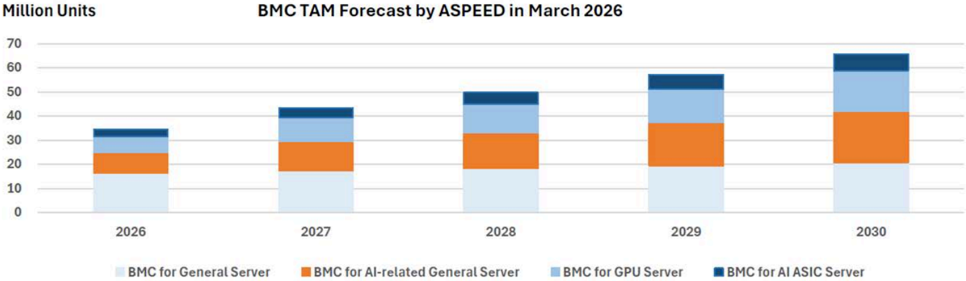
5) Assuming BMC for Al ASIC Servers grow at 45% in 2027 and 20% afterwards.
Source: Company data, Nomura research
Fig. 108: ASPEED's product roadmap
ASPEED maintains expanding product portfolio
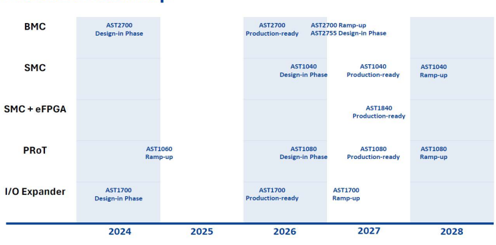
Source: Company data, Nomura research
Satellite Management
ASPIEDI
Controller + eFPGA
IMLATTICE
An innovative SoC solution deliver management control
integrating SMC and eFPGA to and programmable logic for
future server designs.
AST1040
Managemi
2n censamupaouesnenane
2 generation lsntil enabting scalabie m
Management Contvolk
Streamink Boot architecturt connectivity.
and OBMF over USe
AST1080
enl mahor
IN 1N TrUST SC
idy PKoT chip securing ns With BMC and
Fig. 109: ASPEED's product roadmap ASPEED maintains expanding product portfolio
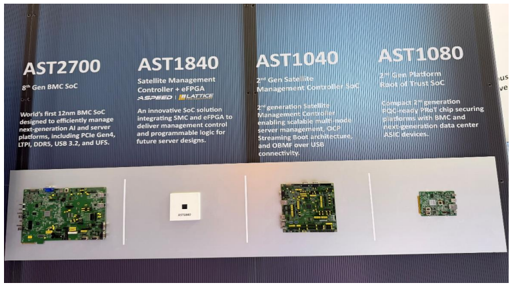
Source: Company data, Nomura research ve
nollotu buuld omipiily ueolg" withlouttron
Server HPM Board
Fig. 110: ASPEED unveils AST1840
AST1840 could simplify design without FPGA
Server HPM Board
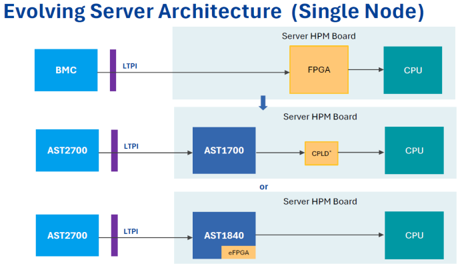
AST2700
AST2700
Source: Company data, Nomura research
CPU
noullotu wuulu omipmly weolg withlouttr
AST1840 eFPGA - Root of Trust Protected
AST1840 eFPGA - OCP Streaming Port
Fig. 111: ASPEED unveils AST1840
AST1840 could simplify design without FPGA
DCSCM
Server HPM B
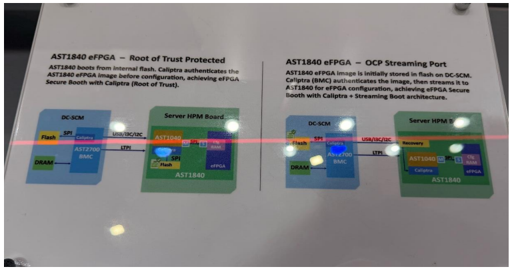
Source: Company data, Nomura research
Fias
DRAM
vve ooe oiymmiuam cumell oulge ull viuauel prouuul portiune
5
4
3
2
1
0
Financial analysis and forecasts
Fig. 112: ASPEED's content growth within Cloud and enterprise product portfolios
We see significant content surge on broader product portfolio
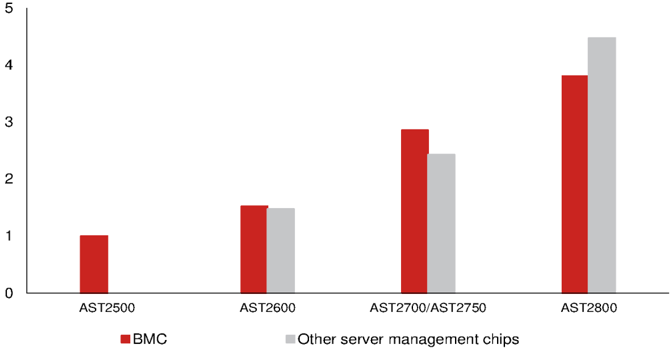
Source: Nomura estimates
Fig. 113: ASPEED - 2026-27F forecast revisions
| 2026F | 2026F | 2026F | 2027F | 2027F | 2027F | |
|---|---|---|---|---|---|---|
| (TWD mn) | Revised | Previous | Change | Revised | Previous | Change |
| Sales | 18,050 | 14,970 | 20.6% | 27,338 | 20,083 | 36.1% |
| Gross profit | 12,344 | 10,085 | 22.4% | 18,548 | 13,493 | 37.5% |
| Operating profit | 9,731 | 7,924 | 22.8% | 15,217 | 10,721 | 41.9% |
| Net profit | 7,885 | 6,476 | 21.7% | 12,218 | 8,729 | 40.0% |
| EPS (TWD) | 208.58 | 171.34 | 21.7% | 323.21 | 230.93 | 40.0% |
| Margin | Revised | Previous | Change | Revised | Previous | Change |
| Gross margin (%) | 68.4 | 67.4 | 1.0 pp | 67.8 | 67.2 | 0.7 pp |
| Operating margin (%) | 53.9 | 52.9 | 1.0 pp | 55.7 | 53.4 | 2.3 pp |
| Net margin (%) | 43.7 | 43.3 | 0.4 pp | 44.7 | 43.5 | 1.2 pp |
Source: Company data, Nomura estimates
Fig. 114: ASPEED's P&L
| (TWD mn) | 1Q25 | 2Q25 | 3Q25 | 4Q25 | 1Q26 | 2Q26F | 3Q26F | 4Q26F | 1Q27F | 2Q27F | 3Q27F | 4Q27F | 2025 | 2026F | 2027F | 2028F |
|---|---|---|---|---|---|---|---|---|---|---|---|---|---|---|---|---|
| Net sales | 2,065 | 2,247 | 2,330 | 2,443 | 3,147 | 3,895 | 4,660 | 6,348 | 5,103 | 5,484 | 6,787 | 9,963 | 9,085 | 18,050 | 27,338 | 32,313 |
| - Cost of Goods Sold | (697) | (722) | (716) | (771) | (970) | (1,208) | (1,498) | (2,029) | (1,651) | (1,772) | (2,183) | (3,183) | (2,906) | (5,705) | (8,790) | (10,514) |
| Gross profit | 1,368 | 1,525 | 1,614 | 1,672 | 2,177 | 2,686 | 3,163 | 4,319 | 3,452 | 3,712 | 4,605 | 6,780 | 6,179 | 12,344 | 18,548 | 21,798 |
| - OPEX | (341) | (341) | (382) | (455) | (518) | (576) | (643) | (876) | (653) | (702) | (801) | (1,176) | (1,518) | (2,614) | (3,332) | (3,813) |
| Operating profit | 1,027 | 1,184 | 1,231 | 1,218 | 1,659 | 2,110 | 2,519 | 3,443 | 2,798 | 3,010 | 3,804 | 5,604 | 4,660 | 9,731 | 15,217 | 17,986 |
| Net profit | 887 | 629 | 1,214 | 1,198 | 1,414 | 1,686 | 2,019 | 2,765 | 2,250 | 2,420 | 3,054 | 4,495 | 3,928 | 7,885 | 12,218 | 14,433 |
| EPS (TWD) | 23.46 | 16.65 | 32.12 | 31.69 | 37.41 | 44.59 | 53.42 | 73.15 | 59.51 | 64.00 | 80.80 | 118.90 | 103.92 | 208.58 | 323.21 | 381.81 |
| Profitability | 1Q25 | 2Q25 | 3Q25 | 4Q25 | 1Q26 | 2Q26F | 3Q26F | 4Q26F | 1Q27F | 2Q27F | 3Q27F | 4Q27F | 2025 | 2026F | 2027F | 2028F |
| Gross margin | 66.2% | 67.9% | 69.3% | 68.5% | 69.2% | 69.0% | 67.9% | 68.0% | 67.6% | 67.7% | 67.8% | 68.0% | 68.0% | 68.4% | 67.8% | 67.5% |
| Opex ratio | (16.5%) | (15.2%) | (16.4%) | (18.6%) | (16.5%) | (14.8%) | (13.8%) | (13.8%) | (12.8%) | (12.8%) | (11.8%) | (11.8%) | (16.7%) | (14.5%) | (12.2%) | (11.8%) |
| Operating margin | 49.7% | 52.7% | 52.9% | 49.8% | 52.7% | 54.2% | 54.1% | 54.2% | 54.8% | 54.9% | 56.0% | 56.2% | 51.3% | 53.9% | 55.7% | 55.7% |
| Net margin | 42.9% | 28.0% | 52.1% | 49.0% | 44.9% | 43.3% | 43.3% | 43.6% | 44.1% | 44.1% | 45.0% | 45.1% | 43.2% | 43.7% | 44.7% | 44.7% |
| Q-Q | 1Q25 | 2Q25 | 3Q25 | 4Q25 | 1Q26 | 2Q26F | 3Q26F | 4Q26F | 1Q27F | 2Q27F | 3Q27F | 4Q27F | 2025 | 2026F | 2027F | 2028F |
| Net sales | (1.8%) | 8.8% | 3.7% | 4.9% | 28.8% | 23.8% | 19.7% | 36.2% | (19.6%) | 7.5% | 23.8% | 46.8% | ||||
| Gross profit | (0.7%) | 11.5% | 5.8% | 3.6% | 30.2% | 23.4% | 17.7% | 36.6% | (20.1%) | 7.6% | 24.0% | 47.2% | ||||
| - OPEX | (9.5%) | 0.0% | 12.2% | 18.9% | 13.9% | 11.3% | 11.6% | 36.2% | (25.4%) | 7.5% | 14.1% | 46.8% | ||||
| Operating profit | 2.7% | 15.3% | 4.0% | (1.1%) | 36.2% | 27.2% | 19.4% | 36.6% | (18.7%) | 7.6% | 26.4% | 47.3% | ||||
| Net profit | (5.9%) | (29.1%) | 93.0% | (1.4%) | 18.1% | 19.2% | 19.8% | 37.0% | (18.6%) | 7.5% | 26.2% | 47.2% | ||||
| Y-Y | 1Q25 | 2Q25 | 3Q25 | 4Q25 | 0 1Q26 | 2Q26F | 3Q26F | 4Q26F | 0 1Q27F | 2Q27F | 3Q27F | 4Q27F | 2025 | 2026F | 2027F | 2028F |
| Net sales | 104% | 66% | 17% | 16% | 52% | 73% | 100% | 160% | 62% | 41% | 46% | 57% | 41% | 99% | 51% | 18% |
| Gross profit | 113% | 77% | 26% | 21% | 59% | 76% | 96% | 158% | 59% | 38% | 46% | 57% | 49% | 100% | 50% | 18% |
| - OPEX | 34% | 22% | 17% | 21% | 52% | 69% | 68% | 93% | 26% | 22% | 25% | 34% | 23% | 72% | 27% | 14% |
| Operating profit | 166% | 104% | 29% | 22% | 62% | 78% | 105% | 183% | 69% | 43% | 51% | 63% | 60% | 109% | 56% | 18% |
| Net profit | 127% | 24% | 66% | 27% | 59% | 168% | 66% | 131% | 59% | 44% | 51% | 63% | 53% | 103% | 55% | 18% |
| EPS (TWD) | 127% | 24% | 66% | 27% | 59% | 168% | 66% | 131% | 59% | 44% | 51% | 63% | 53% | 101% | 55% | 18% |
Source: Company data, Nomura estimates
Fig. 115: ASPEED's key financial numbers
| 2018 | 2019 | 2020 | 2021 | 2022 | 2023 | 2024 | 2025 | 2026F | 2027F | 2028F | 2018-22F CAGR | 2024-27F CAGR | |
|---|---|---|---|---|---|---|---|---|---|---|---|---|---|
| Key financial numbers (TWD mn) | Key financial numbers (TWD mn) | Key financial numbers (TWD mn) | Key financial numbers (TWD mn) | Key financial numbers (TWD mn) | Key financial numbers (TWD mn) | Key financial numbers (TWD mn) | Key financial numbers (TWD mn) | Key financial numbers (TWD mn) | Key financial numbers (TWD mn) | Key financial numbers (TWD mn) | Key financial numbers (TWD mn) | Key financial numbers (TWD mn) | Key financial numbers (TWD mn) |
| Net sales | 2,154 | 2,484 | 3,064 | 3,638 | 5,210 | 3,130 | 6,460 | 9,085 | 18,050 | 27,338 | 32,313 | 25% | 62% |
| y-y (%) | 14% | 15% | 23% | 19% | 43% | -40% | 106% | 41% | 99% | 51% | 18% | ||
| Gross profit | 1,290 | 1,571 | 1,936 | 2,376 | 3,391 | 2,008 | 4,154 | 6,179 | 12,344 | 18,548 | 21,798 | 27% | 65% |
| y-y (%) | 18% | 22% | 23% | 23% | 43% | -41% | 107% | 49% | 100% | 50% | 18% | ||
| Operating profit | 800 | 1,008 | 1,271 | 1,652 | 2,449 | 1,080 | 2,918 | 4,660 | 9,731 | 15,217 | 17,986 | 32% | 73% |
| y-y (%) | 24% | 26% | 26% | 30% | 48% | -56% | 170% | 60% | 109% | 56% | 18% | ||
| Net profit | 686 | 831 | 1,005 | 1,313 | 2,106 | 1,007 | 2,571 | 3,928 | 7,885 | 12,218 | 14,433 | 32% | 68% |
| y-y (%) | 29% | 32% | 21% | 31% | 62% | -54% | 165% | 53% | 103% | 55% | 18% | ||
| EPS (TWD) | 20.20 | 24.39 | 29.38 | 38.30 | 55.72 | 26.66 | 68.04 | 103.92 | 208.58 | 323.21 | 381.81 | 29% | 68% |
| y-y (%) | 38% | 21% | 21% | 31% | 60% | -52% | 155% | 53% | 101% | 55% | 18% |
Source: Company data, Nomura estimates
Fig. 116: Nomura forecasts vs Bloomberg consensus for 2026-28F
| 2026F | 2026F | 2026F | 2027F | 2027F | 2027F | 2028F | 2028F | 2028F | |
|---|---|---|---|---|---|---|---|---|---|
| (TWD mn) | NMR | BBG | Diff (%) | NMR | BBG | Diff (%) | NMR | BBG | Diff (%) |
| Sales | 18,050 | 16,473 | 9.6 | 27,338 | 25,765 | 6.1 | 32,313 | 38,508 | (16.1) |
| Gross profit | 12,344 | 11,267 | 9.6 | 18,548 | 16,565 | 12.0 | 21,798 | 26,249 | (17.0) |
| Operating profit | 9,731 | 8,983 | 8.3 | 15,217 | 14,685 | 3.6 | 17,986 | 21,542 | (16.5) |
| Net profit | 7,885 | 7,425 | 6.2 | 12,218 | 11,841 | 3.2 | 14,433 | 18,183 | (20.6) |
| EPS (TWD) | 208.58 | 192.33 | 8.4 | 323.21 | 312.74 | 3.3 | 381.81 | 481.02 | (20.6) |
| Margin | NMR | BBG | Diff (pp) | NMR | BBG | Diff (pp) | NMR | BBG | Diff (pp) |
| Gross margin (%) | 68.4 | 68.4 | (0.0) | 67.8 | 64.3 | 3.6 | 67.5 | 68.2 | (0.7) |
| OPEX ratio (%) | (14.5) | (13.9) | (0.6) | (12.2) | (7.3) | (4.9) | (11.8) | (12.2) | 0.4 |
| Operating margin (%) | 53.9 | 54.5 | (0.6) | 55.7 | 57.0 | (1.3) | 55.7 | 55.9 | (0.3) |
| Net margin (%) | 43.7 | 45.1 | (1.4) | 44.7 | 46.0 | (1.3) | 44.7 | 47.2 | (2.6) |
Source: Company data, Bloomberg consensus, Nomura estimates
520
470
420
370
320
50
270
40
220
30
170
20
120
10
Jun-21|
70
20
Jun-25
55
Valuation methodology and risks
Our TP of TWD19,100 is based on 50x 2028F EPS; 50x is at the mid-end of its historical trading range. 25
Downside risks to our call include: 1) weaker server demand from macro uncertainties; 2) slower ramp on AI server and CoWoS order cut, and 3) slower-than-expected adoption of new products Jun-23 Jun-24 Jun-25 Jun-26 Jun-21 Jun-22 Jun-23 portazoom
BEst P/E Ratio
• Average: 49.5x
- +1SD: 61.6x
Fig. 117: ASPEED's 5-year consensus P/E
- 2028E EPS
• -1SD: 37.5x
Jun-26
2026E EPS
Price (TWD, RHS)
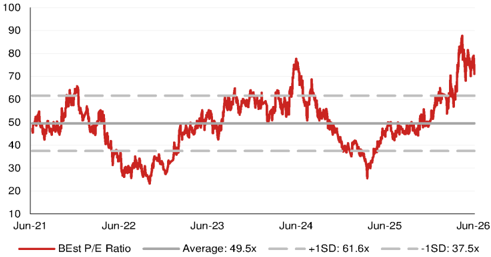
Source: Bloomberg Finance L.P., Nomura research
• BEst P/Bk
- Average: 24x
Jun-24
+1SD: 31x
Jun-26
-1SD: 17x
Fig. 118: ASPEED's 5-year consensus P/B
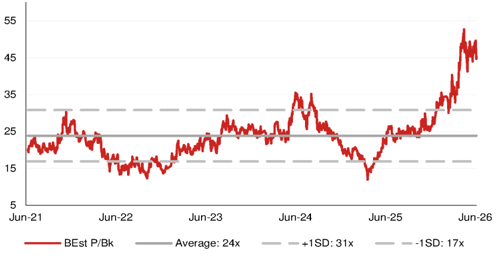
Source: Bloomberg consensus, Nomura research
Fig. 119: ASPEED's share price vs Bloomberg consensus EPS revisions
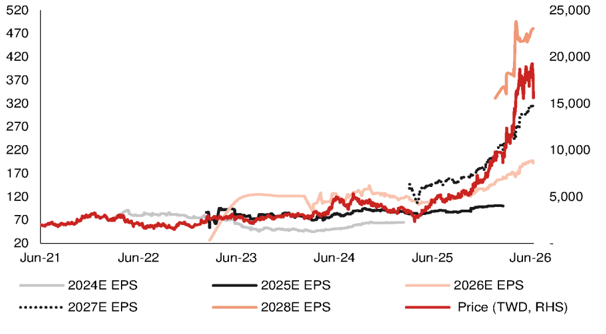
Source: Company data, Bloomberg consensus, Nomura research
25,000
Jun-25
Relative performance chart
EQUITY: FABLESS
Price
(TWD)
4500-
40001
35001
30001
25001
2000-
15001
1000-
175
-
150
-
125.
-100
MediaTek 2454.TW 2454 TT
t
EQUITY: FABLESS
May
Churra. I CEC Namura
The benefit of the doubt; Buy with a higher TP
Right ASIC customer, share gain (at TPU), content expansion (from v.8 to v.9) and price hikes (for non-AI)
Reiterate our Buy rating with a higher TP of TWD5,800
MediaTek's share price has entirely reversed its multi-year underperformance from April 2026 (see our 31 March upgrade report, After 2000 days... ), with the share price up nearly 3x (up 160% vs. TAIEX up 41%) over the past three months - mainly driven by the company's solid messaging about its TPU project (guiding up 2026 contribution to be above USD2bn from USD1bn, and pulling forward its ASIC market share target from 2028E to 2027E, during the company's April earnings call ) and TSMC's (2330 TT, Buy) growing capacity allocation, we think. We have received questions on whether this bright outlook is priced in following the record-level share price surge, but it looks to us that potential upside remains ample. We raise our 2026-28F earnings forecasts by 9-96% with a higher TP of TWD5,800 (vs TWD3,400 previously) based on an unchanged 25x target P/E applied to our 2027-28F average EPS. The stock now trades at 16.7x average 2027-28F EPS.
Upside in TPU, non-TPU ASICs and even non-AI business
From a top-down point of view, Google's (GOOGL US, NR) AI upside potential remains too large to ignore, given Gemini's proven performance and share gain (Fig. 120 - Fig. 121 ). Accordingly, we expect the chip/hardware supply chain to strongly support TPU into 2027F. As such, we expect MTK to tone up its 2026-27F ASIC sales guidance again during its July earnings call (thanks to TPU v.8t upside). For 2028, the year when its TPU v.9 project ramps (using Intel's EMIB-T packaging), no capacity or volume number has been confirmed (still 18 months away) and Intel's (INTC US, NR) execution on EMIB-T remains to be seen. However, given EMIB-T being the sole-source solution for this project (no CoWoS-version, in our view, despite MTK management claiming it had a dual path during its April call ), we continue to expect the Street to give this project the benefit of the doubt before its tape-out by end-2026. In the meantime, there are quite a few other ASIC projects with top US hyperscaler/AI companies in discussion. We now assume USD2.5bn/USD14bn/USD36bn in ASIC sales in 2026F/2027F/2028F (from USD2bn/USD10bn/USD18bn). Last but not least, MTK has announced that it would increase chip prices (though scale and timing have not yet been specified; we estimate 5-10% from Sep 2026F) across all of its major product lines. Price hike is common for tech supply chain in this cycle (to pass on rising costs). We note that QCOM, its major competitor, would follow suit and raise prices too - indicating unchanged market share but higher price for MediaTek's non-AI business.
| Year-end 31 Dec Currency (TWD) | FY25 Actual | FY26F New | Old | FY27F New | Old | FY28F New | |
|---|---|---|---|---|---|---|---|
| Old | |||||||
| Revenue (mn) | 595,966 | 648,114 | 660,019 | 961,8861,109,900 | 1,258,162 | 1,856,210 | |
| Reported net profit (mn) | 105,319 | 100,221 | 108,834 | 179,897 | 245,659 | 253,681 | 495,999 |
| Normalised net profit (mn) | 105,319 | 100,221 | 108,834 | 179,897 | 245,659 | 253,681 | 495,999 |
| FD normalised EPS | 66.16 | 62.97 | 68.38 | 113.00 | 154.31 | 159.35 | 311.57 |
| FD norm. EPS growth (%) | -1.1 | -4.8 | 3.4 | 79.4 | 125.6 | 41.0 | 101.9 |
| FD normalised P/E (x) | 58.6 | - | 56.7 | - | 25.1 | - | 12.5 |
| EV/EBITDA (x) | 45.4 | - | 44.6 | - | 20.7 | - | 10.3 |
| Price/book (x) | 15.5 | - | 14.3 | - | 10.5 | - | 7.0 |
| Dividend yield (%) | 1.4 | - | 1.4 | - | 3.2 | - | 6.4 |
| ROE (%) | 26.4 | 24.2 | 26.0 | 37.7 | 47.7 | 43.6 | 66.7 |
| Net debt/equity (%) | net cash | net cash | net cash | net cash | net cash | net cash | net cash |
Source: Company data, Nomura estimates
Global Markets Research 30 June 2026
| Rating Remains | Buy |
|---|---|
| Target price Increased from TWD 3,400.00 | TWD 5,800.00 |
| Closing price 26 June 2026 | TWD 3,880.00 |
| Implied upside | +49.5% |
| Market Cap (USD mn) | 195,149.2 |
| ADT (USD mn) | 1,406.2 |
Relative performance chart
Source: LSEG, Nomura
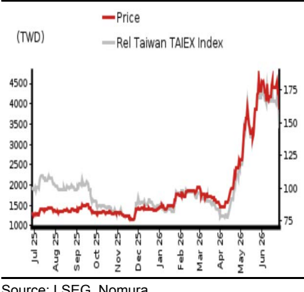
Research Analysts
Semiconductor
Aaron Jeng, CFA - NITB aaron.jeng@nomura.com +886(2) 21769962
Vivian Yang - NITB
vivian.yang@nomura.com +886(2) 21769970
Eric Chen, CFA - NITB
eric.chen@nomura.com +886(2) 21769965
Key data on MediaTek
Performance
| (%) | 1M | 3M | 12M | ||
|---|---|---|---|---|---|
| Absolute (TWD) | -9 | 144 | 200.8 | M cap (USDmn) | 195,149.2 |
| Absolute (USD) | -10.2 | 144.3 | 173.7 | Free float (%) | 68.8 |
| Rel to Taiwan TAIEX Index | -15.3 | 105.3 | 95.1 | 3-mth ADT (USDmn) | 1,406.2 |
Income statement (TWDmn)
| Year-end 31 Dec | FY24 | FY25 | FY26F | FY27F | FY28F |
|---|---|---|---|---|---|
| Revenue | 530,586 | 595,966 | 660,019 | 1,109,900 | 1,856,210 |
| Cost of goods sold | -267,200 | -312,886 | -358,471 | -618,144 | -1,044,373 |
| Gross profit | 263,386 | 283,080 | 301,548 | 491,756 | 811,837 |
| SG&A | -28,981 | -31,304 | -34,601 | -58,185 | -97,309 |
| Employee share expense | -131,993 | -148,306 | -160,529 | -176,093 | -183,101 |
| Operating profit | 102,412 | 103,470 | 106,419 | 257,478 | 531,427 |
| EBITDA | 123,348 | 126,444 | 128,681 | 275,612 | 546,196 |
| Depreciation | -12,560 | -13,336 | -12,423 | -10,119 | -8,242 |
| Amortisation | -8,376 | -9,639 | -9,840 | -8,015 | -6,528 |
| EBIT | 102,412 | 103,470 | 106,419 | 257,478 | 531,427 |
| Net interest expense | 10,696 | 10,167 | 9,814 | 10,213 | 14,187 |
| Associates & JCEs | 7,569 | 5,825 | 6,857 | 11,913 | 20,130 |
| Other income | -1,159 | 5,426 | 2,474 | 4,268 | 7,106 |
| Earnings before tax | 119,519 | 124,888 | 125,563 | 283,873 | 572,850 |
| Income tax | -12,378 | -18,770 | -15,817 | -36,699 | -74,324 |
| Net profit after tax | 107,141 | 106,118 | 109,746 | 247,174 | 498,525 |
| Minority interests | -754 | -798 | -912 | -1,515 | -2,526 |
| Other items | 0 | 0 | 0 | 0 | 0 |
| Preferred dividends | |||||
| Normalised NPAT | 106,387 | 105,319 | 108,834 | 245,659 | 495,999 |
| Extraordinary items | 0 | ||||
| Reported NPAT | 106,387 | 105,319 | 108,834 | 245,659 | 495,999 |
| Dividends | -86,070 | -85,583 | -87,068 | -196,527 | -396,799 |
| Transfer to reserves | 20,317 | 19,736 | 21,767 | 49,132 | 99,200 |
| Valuations and ratios | |||||
| Reported P/E (x) | 58.0 | 58.6 | 56.7 | 25.1 | 12.5 |
| Normalised P/E (x) | 58.0 | 58.6 | 56.7 | 25.1 | 12.5 |
| FD normalised P/E (x) | 58.0 | 58.6 | 56.7 | 25.1 | 12.5 |
| Dividend yield (%) | 1.4 | 1.4 | 1.4 | 3.2 | 6.4 |
| Price/cashflow (x) | 39.5 | 37.9 | 104.8 | 31.9 | 17.0 |
| Price/book (x) | 15.7 | 15.5 | 14.3 | 10.5 | 7.0 |
| EV/EBITDA (x) | 46.1 | 45.4 | 44.6 | 20.7 | 10.3 |
| EV/EBIT (x) | 54.8 | 54.9 | 53.4 | 22.1 | 10.5 |
| Gross margin (%) | 49.6 | 47.5 | 45.7 | 44.3 | 43.7 |
| EBITDA margin (%) | 23.2 | 21.2 | 19.5 | 24.8 | 29.4 |
| EBIT margin (%) | 19.3 | 17.4 | 16.1 | 23.2 | 28.6 |
| Net margin (%) | 20.1 | 17.7 | 16.5 | 22.1 | 26.7 |
| Effective tax rate (%) | 10.4 | 15.0 | 12.6 | 12.9 | 13.0 |
| Dividend payout (%) | 80.9 | 81.3 | 80.0 | 80.0 | 80.0 |
| ROE (%) | 27.8 | 26.4 | 26.0 | 47.7 | 66.7 |
| ROA (pretax %) | 22.8 | 21.8 | 20.6 | 42.1 | 69.1 |
| Growth (%) | |||||
| Revenue | 22.4 | 12.3 | 10.7 | 68.2 | 67.2 |
| EBITDA | 37.1 | 2.5 | 1.8 | 114.2 | 98.2 |
| Normalised EPS | 38.0 | -1.1 | 3.4 | 125.6 | 101.9 |
| Normalised FDEPS | 38.0 | -1.1 | 3.4 | 125.6 | 101.9 |
Source: Company data, Nomura estimates
Cashflow statement (TWDmn)
| Year-end 31 Dec | FY24 | FY25 | FY26F | FY27F | FY28F | FY28F |
|---|---|---|---|---|---|---|
| EBITDA | 123,348 | 126,444 | 128,681 -58,340 | 275,612 -61,141 | 546,196 -136,634 | 546,196 -136,634 |
| Change in working capital Other operating cashflow | 14,977 17,729 | 18,102 | -11,418 | -20,927 | -45,155 | -45,155 |
| Cashflow from operations | 156,055 | 18,247 | 58,923 | 193,544 | 364,406 | 364,406 |
| expenditure | 162,793 | -18,296 | -18,296 | -18,296 | ||
| Capital | -13,771 | -15,009 147,784 | -18,296 | 175,248 | 346,110 | 346,110 |
| Free cashflow | 142,284 | 40,627 | ||||
| Reduction in investments | 283 | -69 | -1,851 | 0 | 0 | 0 |
| Net acquisitions | -909 | -207 | 0 | 0 | 0 | |
| Dec in other LT assets Inc in other LT liabilities | 0 0 | 0 | 0 | 0 | 0 | 0 |
| Adjustments | -22,440 | -21,766 | 2,212 | 0 | 0 | 0 |
| CF after investing acts | 120,127 | 125,039 | 40,781 | 175,248 | 346,110 | 346,110 |
| Cash dividends | -87,551 | -86,070 | -85,583 | -87,068 | -196,527 | -196,527 |
| Equity issue | 0 | 0 | 0 | 0 | 0 | 0 |
| Debt issue | 0 | 0 | 0 | 0 | 0 | 0 |
| Convertible debt issue | 0 | 0 | 0 | 0 | 0 | 0 |
| Others | -7,375 | 17,259 | 0 | 0 | ||
| 5,724 | 0 | |||||
| CF from financial | acts -81,827 | -93,445 | -68,324 | -87,068 88,181 | -196,527 | -196,527 |
| Net cashflow | 38,300 | 31,594 | -27,543 | 207,747 | 149,583 295,928 | 149,583 295,928 |
| Beginning cash | 165,396 | 203,696 | 235,290 | |||
| Ending cash | 203,696 | 235,290 | 207,747 | 295,928 | 445,511 | 445,511 |
| Ending net debt | -422,766 | -422,766 | ||||
| Balance sheet | ||||||
| -200,074 | -227,555 | -185,003 | ||||
| (TWDmn) | -273,183 | FY28F | FY28F | |||
| As at 31 Dec Cash & equivalents | FY24 203,696 | FY25 235,290 15,928 12,419 | FY26F 207,747 10,265 | FY27F 295,928 10,265 | 10,265 230,663 | 10,265 230,663 |
| Marketable securities Accounts receivable | 44,713 | 62,121 | 91,259 | 136,156 | ||
| Inventories | 58,414 | 67,235 | 101,344 | 149,501 | 256,022 | 256,022 |
| 28,274 | 18,688 | 18,688 | 18,688 | 18,688 | ||
| Other current assets | 20,392 | 429,303 | 961,149 | 961,149 | ||
| Total current assets LT investments | 351,025 172,525 | 397,456 171,501 | 183,636 | 610,537 | ||
| Fixed assets | 56,917 | 60,427 | 68,067 | 192,743 76,244 | 202,471 86,299 | 202,471 86,299 |
| Goodwill | 0 | 0 | 0 | 0 | 0 | 0 |
| Other intangible assets | 82,257 | 80,262 | 80,392 | 72,378 | 65,850 | 65,850 |
| Other LT assets | 35,143 | 34,138 | 35,008 | 35,008 | 35,008 | 35,008 |
| Total assets | 697,868 | 796,407 | 986,911 | 1,350,777 | 1,350,777 | |
| Short-term debt | 940 | 743,785 940 | 16,440 | 16,440 | 16,440 | 16,440 |
| Accounts | 40,777 | 48,710 | 93,718 | |||
| payable Other current | 61,806 243,808 | 243,808 | 158,113 243,808 | 158,113 243,808 | ||
| liabilities Total current liabilities | 225,186 | 253,700 303,350 | 322,053 | 353,966 | ||
| 266,902 | 6,305 | 418,360 | 418,360 | |||
| Long-term debt | 2,681 | 6,795 | 6,305 | 6,305 | 6,305 | |
| Convertible debt | 0 | 0 | 0 | 0 24,217 | 0 24,217 | 0 24,217 |
| Other LT liabilities | 23,228 | 24,444 334,590 | 24,217 352,575 | 384,488 | 448,882 | 448,882 |
| Total liabilities | 292,812 | 8,167 | 8,167 | 8,167 | ||
| Minority interest | 8,428 | 8,594 | 8,167 0 | 0 | 0 | 0 |
| Preferred stock | 0 | 0 | 16,039 | 16,039 | 16,039 | 16,039 |
| Common stock | 16,017 | 16,039 | 877,689 | 877,689 | ||
| Retained | 380,610 | 419,626 | 578,217 | |||
| earnings Proposed dividends | ||||||
| 384,562 | ||||||
| 594,256 | ||||||
| Other equity and reserves Total shareholders' equity liabilities | 396,627 | 400,601 743,785 | 435,665 796,407 | 986,911 | 893,728 1,350,777 | 893,728 1,350,777 |
| Total equity & Liquidity (x) Current ratio | 697,868 | 1.32 1.31 - - net cash | 1.33 - | 1.72 - | 2.30 | - |
| Interest cover Leverage Net | net cash | cash | net | net cash net cash | net cash net cash | net cash net cash |
| debt/EBITDA (x) Net debt/equity (%) Per share | net cash | net cash | ||||
| (TWD) | net | cash | ||||
| Reported EPS | 66.92 66.92 66.92 | 66.16 66.16 | 68.38 | 154.31 154.31 | 311.57 | 311.57 |
| Norm EPS (TWD) FD norm EPS (TWD) | 247.63 | 66.16 249.76 | 68.38 68.38 | 370.50 | 557.22 | 557.22 |
| BVPS (TWD) DPS (TWD) | 53.66 | 53.36 | 154.31 | 311.57 | 311.57 | |
| 271.63 | ||||||
| Activity (days) | 54.28 | 122.53 | 247.39 | 247.39 | ||
| 37.4 | 36.2 | 36.2 | ||||
| 34.6 | 32.7 | 42.4 85.8 | 71.1 | 71.1 | ||
| Days receivable Days inventory | 69.4 | 73.3 52.2 | 56.3 | 74.1 | 44.1 | 44.1 |
| Days payable | 54.3 | 45.9 | ||||
| Cash cycle | 49.7 | 53.8 | ||||
| 72.0 | ||||||
| 65.5 | 63.1 |
Source: Company data, Nomura estimates
Company profile
MediaTek is the largest fabless semiconductor company in Taiwan. The company keeps developing leading-edge solutions for clients around the globe since it was established in 1997. Main product lines include smartphones, IoT, ASIC and connectivity/networking chips.
Valuation Methodology
Our TP of TWD5,800 is based on 25x our 2027-28F average EPS. Our target multiple of 25x is at its high end of historical range. The benchmark index for this stock is TAIEX.
Risks that may impede the achievement of the target price
Key downside risks include: 1) fierce price competition from Qualcomm and Spreadtrum; 2) the company's execution (i.e. a continuous rollout of good products in terms of specification, price and cost); 3) smartphone demand, especially in China and emerging markets, where MediaTek has higher revenue exposure; and 4) ASIC execution and competition.
ESG
MediaTek commenced its ESG engagement with six main aspects such as corporate governance and environmental management. The company also set a code of conduct to build its sustainable supply chain. About 80% of the company's suppliers will sign the code of conduct by 2021. Major aspects include labor/human rights and business ethics.
Mo UI MUI LULU
— Perplexity — Copilot
— Other
100%
90%
80%
70%
60%
50%
40%
30%
20%
10%
0%
May 2025
All Traffic | Worldwide
Fig. 120: Gen AI website traffic share
As of Apr 2026
vemul anlu vlauue contmueh lo grow
30%
25%
20%
15%
10%
5%
0%
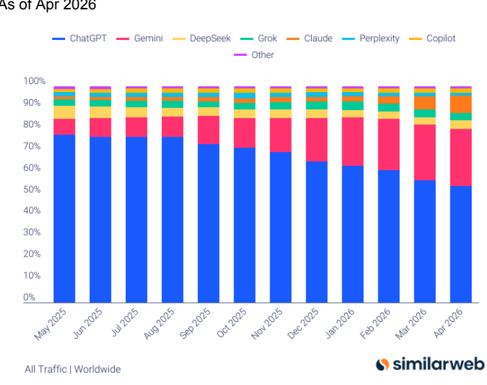
Source: Similarweb
Fig. 121: Gen AI website traffic share
Gemini and Claude continued to grow
......... Claude
Source: Similarweb, Nomura research
80%
70%
60%
50%
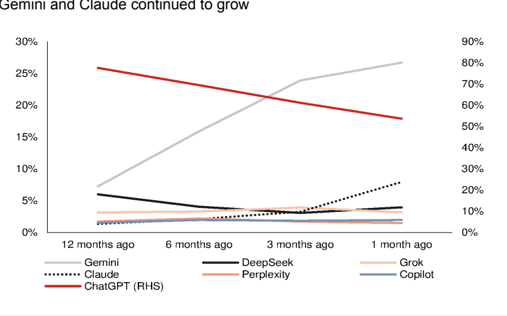
Source: Similarweb, Nomura research
Financial analysis and forecasts
Fig. 122: MediaTek - 2026-28F forecast revisions
| 2026F | 2026F | 2026F | 2027F | 2027F | 2027F | 2028F | 2028F | 2028F | |
|---|---|---|---|---|---|---|---|---|---|
| (TWD mn) | Revised | Previous | Diff | Revised | Previous | Change | Revised | Previous | Change |
| Net sales | 660,019 | 648,114 | 1.8% | 1,109,900 | 961,886 | 15.4% | 1,856,210 | 1,258,162 | 47.5% |
| Gross profit | 301,548 | 295,624 | 2.0% | 491,756 | 426,668 | 15.3% | 811,837 | 555,901 | 46.0% |
| OPEX | (195,130) | (196,589) | (0.7%) | (234,278) | (235,247) | (0.4%) | (280,410) | (282,570) | (0.8%) |
| Operating profit | 106,419 | 99,035 | 7.5% | 257,478 | 191,420 | 34.5% | 531,427 | 273,331 | 94.4% |
| Net profit | 108,834 | 100,221 | 8.6% | 245,659 | 179,897 | 36.6% | 495,999 | 253,681 | 95.5% |
| EPS (TWD) | 68.38 | 62.97 | 8.6% | 154.31 | 113.00 | 36.6% | 311.57 | 159.35 | 95.5% |
| Margin | Revised | Previous | Diff | Revised | Previous | Change | Revised | Previous | Change |
| Gross margin (%) | 45.7 | 45.6 | 0.1 pp | 44.3 | 44.4 | -0.1 pp | 43.7 | 44.2 | -0.4 pp |
| OPEX ratio (%) | (29.6) | (30.3) | 0.8 pp | (21.1) | (24.5) | 3.3 pp | (15.1) | (22.5) | 7.4 pp |
| Operating margin (%) | 16.1 | 15.3 | 0.8 pp | 23.2 | 19.9 | 3.3 pp | 28.6 | 21.7 | 6.9 pp |
| Net margin (%) | 16.5 | 15.5 | 1.0 pp | 22.1 | 18.7 | 3.4 pp | 26.7 | 20.2 | 6.6 pp |
Source: Company data, Nomura estimates
Fig. 123: MediaTek - P&L
| (TWD mn) | 1Q25 | 2Q25 | 3Q25 | 4Q25 | 1Q26 | 2Q26F | 3Q26F | 4Q26F | 1Q27F | 2Q27F | 3Q27F | 4Q27F | 2025 | 2026F | 2027F | 2028F |
|---|---|---|---|---|---|---|---|---|---|---|---|---|---|---|---|---|
| Net sales | 153,312 | 150,369 | 142,097 | 150,188 | 149,151 | 152,110 | 156,067 | 202,692 | 263,239 | 273,787 | 274,613 | 298,261 | 595,966 | 660,019 | 1,109,900 | 1,856,210 |
| Gross profit | 73,809 | 73,878 | 66,112 | 69,281 | 69,055 | 70,036 | 71,928 | 90,529 | 116,057 | 121,240 | 122,017 | 132,442 | 283,080 | 301,548 | 491,756 | 811,837 |
| - OPEX | (43,756) | (44,499) | (43,924) | (47,431) | (46,165) | (46,002) | (48,759) | (54,205) | (55,918) | (58,159) | (58,334) | (61,866) | (179,610) | (195,130) | (234,278) | (280,410) |
| Operating profit | 30,053 | 29,379 | 22,188 | 21,850 | 22,891 | 24,035 | 23,169 | 36,324 | 60,139 | 63,081 | 63,683 | 70,576 | 103,470 | 106,419 | 257,478 | 531,427 |
| Pretax profit | 34,553 | 33,228 | 29,960 | 27,147 | 27,019 | 28,219 | 28,302 | 42,022 | 66,296 | 69,099 | 70,541 | 77,936 | 124,888 | 125,563 | 283,873 | 572,850 |
| Net profit | 29,325 | 27,848 | 25,221 | 22,925 | 24,154 | 24,102 | 24,290 | 36,289 | 57,634 | 59,606 | 60,972 | 67,446 | 105,319 | 108,834 | 245,659 | 495,999 |
| EPS (TWD) | 18.43 | 17.50 | 15.84 | 14.40 | 15.17 | 15.13 | 15.25 | 22.78 | 36.19 | 37.42 | 38.28 | 42.35 | 66.16 | 68.38 | 154.31 | 311.57 |
| Profitability | 1Q25 | 2Q25 | 3Q25 | 4Q25 | 1Q26 | 2Q26F | 3Q26F | 4Q26F | 1Q27F | 2Q27F | 3Q27F | 4Q27F | 2025 | 2026F | 2027F | 2028F |
| Gross margin | 48.1% | 49.1% | 46.5% | 46.1% | 46.3% | 46.0% | 46.1% | 44.7% | 44.1% | 44.3% | 44.4% | 44.4% | 47.5% | 45.7% | 44.3% | 43.7% |
| - OPEX ratio | (28.5%) | (29.6%) | (30.9%) | (31.6%) | (31.0%) | (30.2%) | (31.2%) | (26.7%) | (21.2%) | (21.2%) | (21.2%) | (20.7%) | (30.1%) | (29.6%) | (21.1%) | (15.1%) |
| Operating margin | 19.6% | 19.5% | 15.6% | 14.5% | 15.3% | 15.8% | 14.8% | 17.9% | 22.8% | 23.0% | 23.2% | 23.7% | 17.4% | 16.1% | 23.2% | 28.6% |
| Pretax margin | 22.5% | 22.1% | 21.1% | 18.1% | 18.1% | 18.6% | 18.1% | 20.7% | 25.2% | 25.2% | 25.7% | 26.1% | 21.0% | 19.0% | 25.6% | 30.9% |
| Net margin | 19.1% | 18.5% | 17.7% | 15.3% | 16.2% | 15.8% | 15.6% | 17.9% | 21.9% | 21.8% | 22.2% | 22.6% | 17.7% | 16.5% | 22.1% | 26.7% |
| Q-Q | 1Q25 | 2Q25 | 3Q25 | 4Q25 | 1Q26 | 2Q26F | 3Q26F | 4Q26F | 1Q27F | 2Q27F | 3Q27F | 4Q27F | 2025 | 2026F | 2027F | 2028F |
| Net sales | 11.1% | (1.9%) | (5.5%) | 5.7% | (0.7%) | 2.0% | 2.6% | 29.9% | 29.9% | 4.0% | 0.3% | 8.6% | ||||
| Gross profit | 10.2% | 0.1% | (10.5%) | 4.8% | (0.3%) | 1.4% | 2.7% | 25.9% | 28.2% | 4.5% | 0.6% | 8.5% | ||||
| - OPEX | (4.0%) | 1.7% | (1.3%) | 8.0% | (2.7%) | (0.4%) | 6.0% | 11.2% | 3.2% | 4.0% | 0.3% | 6.1% | ||||
| Operating profit | 40.4% | (2.2%) | (24.5%) | (1.5%) | 4.8% | 5.0% | (3.6%) | 56.8% | 65.6% | 4.9% | 1.0% | 10.8% | ||||
| Net profit | 23.3% | (5.0%) | (9.4%) | (9.1%) | 5.4% | (0.2%) | 0.8% | 49.4% | 58.8% | 3.4% | 2.3% | 10.6% | ||||
| Y-Y | 1Q25 | 2Q25 | 3Q25 | 4Q25 | 1Q26 | 2Q26F | 3Q26F | 4Q26F | 1Q27F | 2Q27F | 3Q27F | 4Q27F | 2025 | 2026F | 2027F | 2028F |
| Net sales | 14.9% | 18.1% | 7.8% | 8.8% | (2.7%) | 1.2% | 9.8% | 35.0% | 76.5% | 80.0% | 76.0% | 47.1% | 12.3% | 10.7% | 68.2% | 67.2% |
| Gross profit | 5.6% | 18.9% | 2.7% | 3.4% | (6.4%) | (5.2%) | 8.8% | 30.7% | 68.1% | 73.1% | 69.6% | 46.3% | 7.5% | 6.5% | 63.1% | 65.1% |
| - OPEX | 16.0% | 19.7% | 8.5% | 4.0% | 5.5% | 3.4% | 11.0% | 14.3% | 21.1% | 26.4% | 19.6% | 14.1% | 11.6% | 8.6% | 20.1% | 19.7% |
| Operating profit | (6.6%) | 17.7% | (7.0%) | 2.0% | (23.8%) | (18.2%) | 4.4% | 66.2% | 162.7% | 162.5% | 174.9% | 94.3% | 1.0% | 2.9% | 141.9% | 106.4% |
| Net profit | (7.0%) | 8.3% | (0.5%) | (3.6%) | (17.6%) | (13.5%) | (3.7%) | 58.3% | 138.6% | 147.3% | 151.0% | 85.9% | (1.0%) | 3.3% | 125.7% | 101.9% |
Source: Company data, Nomura estimates
Fig. 124: Nomura forecasts vs Bloomberg consensus
| 2026F | 2026F | 2026F | 2027F | 2027F | 2027F | 2028F | 2028F | 2028F | |
|---|---|---|---|---|---|---|---|---|---|
| (TWD mn) | NMR | BBG | Diff (%) | NMR | BBG | Diff (%) | NMR | BBG | Diff (%) |
| Net sales | 660,019 | 651,105 | 1.4 | 1,109,900 | 1,065,989 | 4.1 | 1,856,210 | 1,798,408 | 3.2 |
| Gross profit | 301,548 | 298,271 | 1.1 | 491,756 | 472,265 | 4.1 | 811,837 | 764,306 | 6.2 |
| Operating profit | 106,419 | 104,319 | 2.0 | 257,478 | 221,830 | 16.1 | 531,427 | 429,605 | 23.7 |
| Net profit | 108,834 | 105,956 | 2.7 | 245,659 | 205,976 | 19.3 | 495,999 | 366,126 | 35.5 |
| EPS (TWD) | 68.38 | 66.70 | 2.5 | 154.31 | 132.62 | 16.4 | 311.57 | 229.70 | 35.6 |
| margin | NMR | BBG | Diff (pp) | NMR | BBG | Diff (pp) | NMR | BBG | Diff (pp) |
| Gross margin (%) | 45.7 | 45.8 | (0.1) | 44.3 | 44.3 | 0.0 | 43.7 | 42.5 | 1.2 |
| Operating margin (%) | 16.1 | 16.0 | 0.1 | 23.2 | 20.8 | 2.4 | 28.6 | 23.9 | 4.7 |
| Net margin (%) | 16.5 | 16.3 | 0.2 | 22.1 | 19.3 | 2.8 | 26.7 | 20.4 | 6.4 |
Source: Company data, Bloomberg Finance L.P., Nomura estimates
55
320
45
270
35
220
25
170
15
120
5
Jun-21
70
20
18
16
4,900
4,400
Valuation methodology and risks
Our TP of TWD5,800 is based on 25x our 2027-28F average EPS. Our target multiple of 25x is at the high end of its historical range. 6 2,400
Key downside risks include: 1) fierce price competition from Qualcomm (QCOM US, NR) and Spreadtrum (unlisted); 2) the company's execution (i.e., a continuous rollout of good products in terms of specification, price and cost); 3) smartphone demand, especially in China and emerging markets, where MediaTek has higher revenue exposure; and 4) ASIC execution and competition. Jun-25 Jun-26
2024E EPS
2025E EPS
2026E EPS
Fig. 125: MediaTek's 5-year consensus P/E
Price (TWD; RHS)
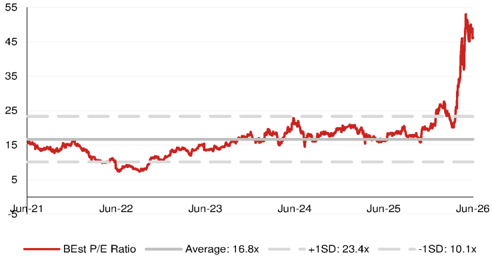
Source: Bloomberg Finance L.P., Nomura research
Jun-24
- +1SD: 6.35x
Jun-26
-1 SD: 2.23x
Fig. 126: MediaTek's 5-year consensus P/B
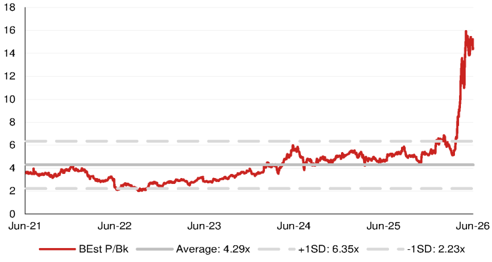
Source: Bloomberg Finance L.P., Nomura research
Fig. 127: MediaTek's share price vs Bloomberg consensus EPS revisions
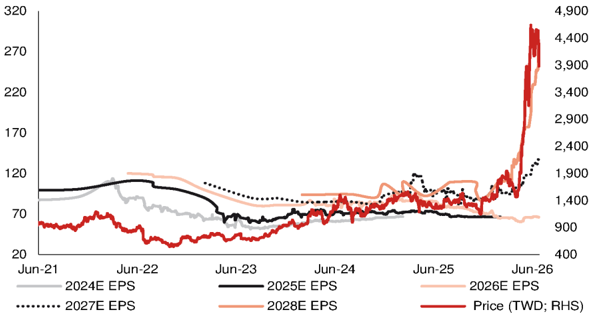
Source: Company data, Bloomberg Finance L.P., Nomura research
Jun-25
Relative performance chart
EQUITY: TECHNOLOGY
Price
(TWD)
10001
750-
5001
150
-125
-100
GlobalWafers 6488.TWO 6488 TT
EQUITY: TECHNOLOGY
Courna: | CEC Namiira
Refreshed semi wafer cycle and material
Continued improvement in semi wafer supply/demand dynamics; new SiC opportunity in sight
Action: maintain Buy and raise TP to TWD1,200, implying 28% upside
In our Anchor Report of May 2026, 'Greater China Semi - A guide to Semi renaissance in 2026-30F,' we highlighted a variety of emerging semiconductor technologies for 2027F, such as wafer-bonded NAND, backside power deliver (BPD), and photonics SOI demand, and noted that improving semiconductor wafer supply/demand dynamics had us believe that some related supply-chain names including Globalwafers (GWC) could be among the key beneficiaries of such technologies. We see potential upside for GWC's fundamentals in the near and long term, including: (1) continued improvement in the semiconductor wafer cycle and pricing environment; and (2) SiC possibly acting as an emerging new material in advanced packaging toward 2028F. We thus raise our TP for GWC to TWD1,200 (from TWD850), based on 4.8x 2028F BVPS of TWD252 (previously 3.2x 2028F BVPS). We raise our 2026-28F earnings by 11-41%. The stock is trading at 3.7x 2028F BVPS of TWD252.
Semi wafer supply/demand: rising demand with continuously improving spot price
In our previously published reports (link 1 , link 2 ), we had indicated some bottom-up checks, including: (1) a spot price recovery of around 5-10% h-h in 1H26F, and another 10% h-h recovery in 2H26F; and (2) the leading semi wafer companies potentially running at tight utilization rates for 12″ semi wafers. We now expect the magnitude of spot price hikes in 2H26F to surpass our previous estimates as now both memory companies and logic foundries are procuring increasingly more semi wafers (vs previously procurement was mainly driven by memory companies). With customers procuring higher volumes than previously committed, we expect companies such as GWC to hike prices. As the spot price was 20% lower than the LTA price during 2023-25, after the spot price hike in 2026F, we expect some semi wafers' spot prices to be on par with the LTA price by end-2026F.
SiC for advanced packaging may start with chip-level thermal plate in Feynman
We expect nVidia's (NVDA US, Not rated) next-gen GPU (Feynman) to target the GPU-onGPU SoIC stack which would lead to higher computational power even with limited growth interposer reticle size. Given rising heat dissipation requirements, Feynman could start adopting SiC thermal plates which function as an integrated silicon carrier (fill up the height gap in between GPU and HBM) and thermal interface material (TIM); Fig. 128 . We believe this will contribute around 5-10% to GWC's total revenue from 2028F at the earliest (Fig. 129 ).
| Year-end 31 Dec Currency (TWD) | FY25 | FY26F | FY27F New | Old | FY28F New | ||
|---|---|---|---|---|---|---|---|
| (mn) | Actual | Old | New | Old | |||
| Revenue | 60,598 | 61,159 | 61,726 | 71,372 | 73,535 | 83,460 | 88,666 |
| Reported net profit (mn) | 7,311 | 8,248 | 11,633 | 10,825 | 12,082 | 15,322 | 19,163 |
| Normalised net profit (mn) | 7,311 | 8,248 | 11,633 | 10,825 | 12,082 | 15,322 | 19,163 |
| FD normalised EPS | 15.36 | 17.25 | 24.33 | 22.64 | 25.27 | 32.05 | 40.08 |
| FD norm. EPS growth (%) | -29.8 | 12.3 | 58.4 | 31.3 | 3.9 | 41.5 | 58.6 |
| FD normalised P/E (x) | 60.9 | - | 38.5 | - | 37.0 | - | 23.4 |
| EV/EBITDA (x) | 32.7 | - | 34.6 | - | 24.3 | - | 16.0 |
| Price/book (x) | 4.8 | - | 4.5 | - | 4.2 | - | 3.7 |
| Dividend yield (%) | 0.7 | - | 1.2 | - | 1.2 | - | 1.6 |
| ROE (%) | 7.9 | 8.6 | 12.0 | 10.6 | 11.7 | 13.9 | 16.9 |
| Net debt/equity (%) | 7.1 | 3.8 | net cash | 0.3 | net cash | net cash | net cash |
Source: Company data, Nomura estimates
May
Global Markets Research 30 June 2026
| Rating Remains | Buy |
|---|---|
| Target price Increased from TWD 850.00 | TWD 1,200.00 |
| Closing price 26 June 2026 | TWD 936.00 |
| Implied upside | +28.2% |
| Market Cap (USD mn) | 14,033.5 |
| ADT (USD mn) | 161.7 |
Relative performance chart
Source: LSEG, Nomura
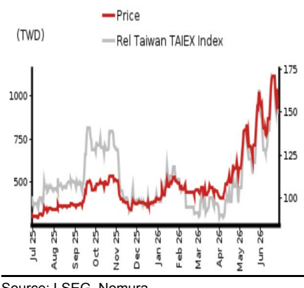
Research Analysts
Semiconductor
Donnie Teng - NIHK donnie.teng@nomura.com +852 2252 1439
Aaron Jeng, CFA - NITB
aaron.jeng@nomura.com +886(2) 21769962
Key data on GlobalWafers
Performance
| (%) | 1M | 3M | 12M | ||
|---|---|---|---|---|---|
| Absolute (TWD) | 8.1 | 105.9 | 194.3 | M cap (USDmn) | 14,033.5 |
| Absolute (USD) | 6.6 | 106.1 | 167.8 | Free float (%) | 27.5 |
| Rel to Taiwan TAIEX Index | 5.7 | 72.2 | 96.2 | 3-mth ADT (USDmn) | 161.7 |
Income statement (TWDmn)
| Year-end 31 Dec | FY24 | FY25 | FY26F | FY27F | FY28F |
|---|---|---|---|---|---|
| Revenue | 62,626 | 60,598 | 61,726 | 73,535 | 88,666 |
| Cost of goods sold | -42,823 | -45,974 | -48,565 | -54,686 | -60,324 |
| Gross profit | 19,804 | 14,624 | 13,162 | 18,850 | 28,342 |
| SG&A | -3,365 | -3,770 | -3,988 | -4,412 | -5,024 |
| Employee share expense | -2,320 | -2,218 | -2,109 | -2,427 | -2,834 |
| Operating profit | 14,119 | 8,636 | 7,065 | 12,011 | 20,485 |
| EBITDA | 18,987 | 13,797 | 12,587 | 17,870 | 26,559 |
| Depreciation | -4,829 | -5,120 | -5,478 | -5,812 | -6,026 |
| Amortisation | -39 | -41 | -44 | -47 | -48 |
| EBIT | 14,119 | 8,636 | 7,065 | 12,011 | 20,485 |
| Net interest expense | 2,489 | 1,124 | 3,386 | 3,479 | 4,083 |
| Associates & JCEs | 186 | 85 | 15 | 0 | 0 |
| Other income | -4,364 | -329 | 4,365 | 0 | 0 |
| Earnings before tax | 12,429 | 9,516 | 14,831 | 15,490 | 24,568 |
| Income tax | -2,590 | -2,205 | -3,197 | -3,408 | -5,405 |
| Net profit after tax | 9,840 | 7,311 | 11,633 | 12,082 | 19,163 |
| Minority interests | 7 | 0 | 0 | 0 | 0 |
| Other items | 0 | 0 | 0 | 0 | 0 |
| Preferred dividends | 0 | 0 | 0 | 0 | 0 |
| Normalised NPAT | 9,847 | 7,311 | 11,633 | 12,082 | 19,163 |
| Extraordinary items | 0 | 0 | 0 | 0 | 0 |
| Reported NPAT | 9,847 | 7,311 | 11,633 | 12,082 | 19,163 |
| Dividends | -5,259 | -3,290 | -5,235 | -5,437 | -7,068 |
| Transfer to reserves | 4,588 | 4,021 | 6,398 | 6,645 | 12,095 |
| Valuations and ratios | |||||
| Reported P/E (x) | 42.3 | 60.9 | 38.5 | 37.0 | 23.4 |
| Normalised P/E (x) | 42.3 | 60.9 | 38.5 | 37.0 | 23.4 |
| FD normalised P/E (x) | 42.7 | 60.9 | 38.5 | 37.0 | 23.4 |
| Dividend yield (%) | 1.2 | 0.7 | 1.2 | 1.2 | 1.6 |
| Price/cashflow (x) | 16.2 | - | 9.7 | 28.4 | 19.8 |
| Price/book (x) | 4.9 | 4.8 | 4.5 | 4.2 | 3.7 |
| EV/EBITDA (x) | 23.3 | 32.7 | 34.6 | 24.3 | 16.0 |
| EV/EBIT (x) | 31.2 | 52.1 | 61.7 | 36.1 | 20.8 |
| Gross margin (%) | 31.6 | 24.1 | 21.3 | 25.6 | 32.0 |
| EBITDA margin (%) | 30.3 | 22.8 | 20.4 | 24.3 | 30.0 |
| EBIT margin (%) | 22.5 | 14.3 | 11.4 | 16.3 | 23.1 |
| Net margin (%) | 15.7 | 12.1 | 18.8 | 16.4 | 21.6 |
| Effective tax rate (%) | 20.8 | 23.2 | 21.6 | 22.0 | 22.0 |
| Dividend payout (%) | 53.4 | 45.0 | 45.0 | 45.0 | 36.9 |
| ROE (%) | 12.5 | 7.9 | 12.0 | 11.7 | 16.9 |
| ROA (pretax %) | 8.2 | 4.5 | 3.7 | 6.3 | 10.5 |
| Growth (%) | |||||
| Revenue | -11.4 | -3.2 | 1.9 | 19.1 | 20.6 |
| EBITDA | -24.0 | -27.3 | -8.8 | 42.0 | 48.6 |
| Normalised EPS | -51.8 | -30.6 | 58.4 | 3.9 | 58.6 |
| Normalised FDEPS | -51.8 | -29.8 | 58.4 | 3.9 | 58.6 |
Source: Company data, Nomura estimates
Cashflow statement (TWDmn)
| Year-end 31 Dec | FY24 | FY25 | FY26F | FY27F | FY28F |
|---|---|---|---|---|---|
| EBITDA | 18,987 | 13,797 | 12,587 | 17,870 | 26,559 |
| Change in working capital Other operating cashflow | 11,289 -4,298 | -28,021 | 28,805 | -2,179 71 | -2,649 |
| Cashflow from operations | 25,978 | -1,297 | 4,570 | 15,762 | -1,322 22,589 |
| Capital expenditure | -48,319 | -15,520 | 45,962 | -20,956 | -17,398 |
| -33,130 | -25,033 | -5,193 | 5,190 | ||
| Free cashflow | -22,342 | -48,650 | 20,929 | ||
| Reduction in investments | -6,052 | 498 | -127 | 0 | 0 |
| Net acquisitions | 0 | 0 | 0 | 0 | 0 |
| Dec in other LT assets | 4,302 | 39,845 | 14,538 | 13,418 | 8,679 |
| Inc in other LT liabilities | 0 | 0 | 0 | 0 | |
| Adjustments | 0 | 0 | 0 | 0 | 0 |
| CF after investing acts | -24,092 | -8,307 | 35,339 | 8,224 | 13,869 |
| Cash dividends | -8,748 | -5,259 | -3,290 | -5,235 | -5,437 |
| Equity issue | 0 | 0 | 0 | 0 | 0 |
| 9,776 | -11,511 | -7,141 | 0 | 0 | |
| Debt issue Convertible | 0 | 0 | |||
| debt issue Others | 35,829 | 5,632 | 0 | 0 | 0 |
| CF from financial acts | 36,857 | -14,495 | 0 -5,235 | 0 -5,437 | |
| Net cashflow | 12,765 | -11,139 -19,445 | -24,927 10,413 | 2,989 | 8,432 |
| Beginning cash | 26,165 | 38,929 | 19,484 | 29,896 | 32,886 |
| Ending cash | 38,929 | 19,484 | 29,897 | 32,886 | 41,318 |
| Ending net debt | |||||
| Balance sheet | |||||
| -1,282 | 6,652 | -13,891 | -22,323 | ||
| (TWDmn) As at 31 Dec | FY24 | FY25 | -10,901 FY26F | FY27F | FY28F |
| Cash & equivalents Marketable securities | 38,929 29 | 19,484 1 10,113 | 29,896 0 9,586 | 32,886 0 11,497 | 41,318 0 13,889 |
| Accounts receivable Inventories | 10,265 | 10,148 | 11,090 | 12,114 | |
| 11,238 | 10,399 | 31,636 | |||
| Other current assets | 20,030 80,492 | 46,632 86,629 | 31,636 81,266 | 31,636 87,109 | 98,956 |
| Total current assets LT investments | 7,445 | 6,947 | 7,074 | 7,074 | 7,074 |
| Fixed assets | 119,074 | 107,241 | 111,560 | 113,239 | 115,885 |
| Goodwill | 0 | 0 | 0 | 0 0 | 0 |
| Other intangible assets | 0 | 0 | 0 | 0 | |
| Other LT assets | 17,570 | 17,525 | 18,179 | 18,179 | 18,179 |
| Total assets | 224,581 | 218,343 | 218,080 | 225,602 | 240,094 |
| Short-term debt | 27,117 | 18,571 | 14,252 | 14,252 | 14,252 |
| Accounts payable | 4,161 | 4,464 | 5,138 | ||
| Other current | 5,371 | 44,105 | 44,105 | 5,905 44,105 | |
| liabilities Total current liabilities | 32,577 | 31,377 | 62,821 | 63,495 | 64,262 |
| 65,065 | 54,109 | 4,743 | 4,743 | ||
| Long-term debt | 10,531 | 7,565 | 4,743 | 0 | 0 |
| Convertible debt Other LT liabilities | 0 57,958 | 0 63,374 | 0 50,690 | 50,690 | 50,690 |
| Total liabilities | 133,553 | 125,048 | 118,254 | 118,929 | 119,695 |
| Minority interest | -3 | -3 | -4 | -4 | -4 |
| Preferred stock | 0 | 0 | 0 | 0 | 0 |
| Common stock | 4,781 | 4,781 | 4,781 | 4,781 | 4,781 |
| Retained earnings | 31,640 | 47,769 | 59,864 | ||
| Proposed dividends | 37,451 3,290 | 41,124 | 5,437 | 7,068 | |
| Other equity and | 5,259 49,350 | 47,776 | 5,235 | 48,690 | 48,690 |
| reserves Total shareholders' equity | 91,030 | 93,298 | 48,690 99,830 | 106,677 | 120,403 |
| Total equity & liabilities | 224,580 | 225,602 | 240,094 | ||
| 218,342 | |||||
| 218,080 | |||||
| Liquidity (x) | 1.24 - net cash | 1.60 - 0.48 | 1.29 - | 1.37 - net cash net cash | 1.54 - net cash |
| Current ratio Interest cover Leverage | net cash | 7.1 | net cash cash | net cash | |
| Net debt/EBITDA (x) Net debt/equity (%) Per share | 22.14 22.14 | 15.36 | net 24.33 | 25.27 | 40.08 |
| Reported EPS (TWD) Norm EPS (TWD) FD norm EPS (TWD) | 21.90 190.39 | 15.36 15.36 195.14 | 24.33 24.33 208.80 | 25.27 223.12 | 40.08 40.08 251.83 |
| BVPS (TWD) DPS (TWD) | 11.00 | 6.88 | 25.27 | ||
| 10.95 | |||||
| Activity (days) | 11.37 | 14.78 | |||
| 59.4 | 61.4 | 58.2 | 52.3 | 52.4 70.4 | |
| Days receivable | 85.9 | 77.2 | 70.9 | ||
| Days inventory Days payable | 87.8 44.3 | 37.8 | 32.4 | 33.5 | |
| Cash cycle | 109.4 | 32.0 | |||
| 102.9 | 103.0 | 91.2 | |||
| 89.3 |
Source: Company data, Nomura estimates
Company profile
GlobalWafers is the world's third-largest and largest non-Japanese wafer manufacturer that specializing in 3' to 12' silicon wafer manufacturing, possessing a complete production line from ingot growth, slicing, etching, diffusion, polishing and epitaxy.
Valuation Methodology
Our TP of TWD1200 is based on 4.8x 2028F BVPS TWD252. The 4.8x P/B is based on the upper-half of 2-6x P/B range during the full Semi wafer cycle in 2017-2020. The benchmark index is TAIEX.
Risks that may impede the achievement of the target price
Downside risks include: · Faster-than-expected entry of China into the 12' semi wafer market. · Slower-than-expected of market consolidation. · Worse-than-expected end-demand for the semi industry. · Less favorable demand/supply dynamics in the semi wafer industry. · Less favorable FX volatility and rising material/utility costs.
ESG
In response to global climate change and latest development trends in corporate social responsibilities (CSR), GlobalWafers has taken the initiative to compile a CSR report. Based on long-term in-depth interactions with local communities and engagement with stakeholders, GlobalWafers discloses in the report relevant information on material issues regarding the four aspects of corporate governance, economy, environment, and society, as well as execution & improvement results, in addition to presenting the the future vision and goals in terms of sustainable development.
Ur u anu Trom anle motmet mohlaue matchlatrniwy
Note
Ulu tlelmal plate lo lunlutlol do alt mel g'aleu omuun valel a up tie helgm yap m wetweeh
I/0
HBM4E
HBM4E
ASP per 12" SiC substrate (USD)(5)
HBM4E
GWC market share (%)(7)
HBM4E
HBM4E
HBM4E
Dummy
1/0
VO
Fig. 128: The floor plan and cross-section chart of nVidia's Feynman GPU
SiC thermal plate to function as an intergrated silicon carrier (fill up the height gap in between GPU and HBM) and thermal interface material (TIM)
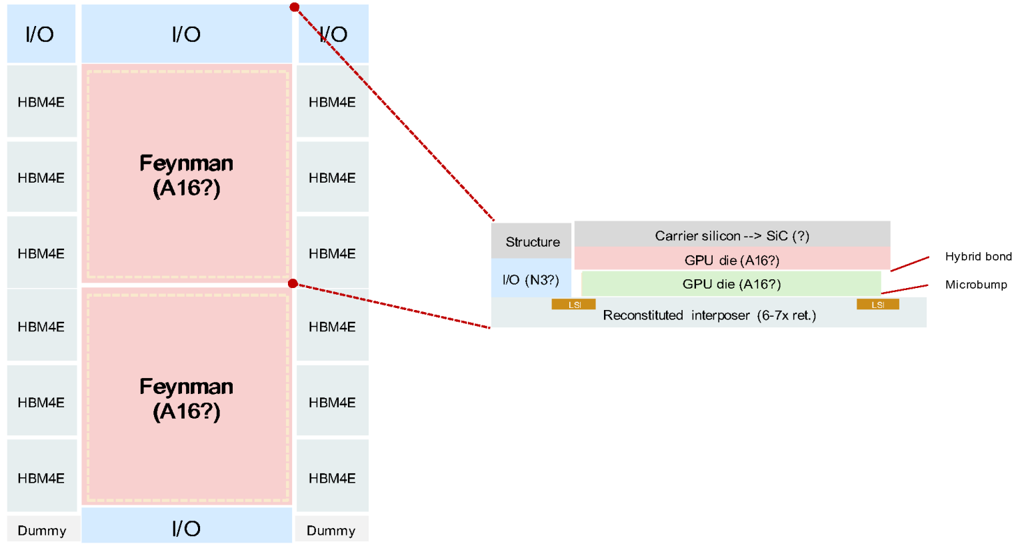
Source: Nomura estimates, Company data
Fig. 129: The revenue contribution assumption for SiC thermal plate for Feynman
Source: Nomura estimates
Net Sales
(TWD mn)
Previous
2026F
3Q25
1Q26
4Q25
14,493
Revised
Change (%; pp) Previous
14,502
13,985
Earnings forecast revisions
2Q26F
3Q26F 4Q26F
2027F
15,396
15,762
16,584
3,208
2025
60,598
Revised Change (%; pp) Previous
3,358
3.0
1,669
23,593
14,624
83,460
8,636
9,516
16,752
20.1
18.4
73,535
18,850
1,797
3,682
2,123
7.0
We revise up our 2026-28F earnings forecasts by 11-41%. We expect a moderate revenue recovery in 2026F, but believe revenues will accelerate from 2H26F onward, as well as a more favorable supply-demand environment in 2027-28F. YTD 2026, GWC has also recognized meaningful non-operating gains from its investment in Siltronic (WAF GR, Not rated) due to the sharp rise in Siltronic's share price. We have not yet factored any Siltronic stock price impact into our forecasts from 2H26F onward. 7,312 15.36
EPS
EPS
In the near term, we believe GWC's profitability is still under pressure due to rising depreciation costs from new capacity expansion, but as market demand continues to grow, we believe price hike potential is also likely to increase.
Op income
Fig. 130: GWC: earnings estimate revisions
Net Sales
Gross profit
Op income
Pretax income
Net income
-19.3%
-14.0%
174.7%
165.2%
7.7%
-54.9%
-54.9%
18.1%
7.6%
7.6%
| 3.4% | -8.7% -11.3% -10.3% | -8.7% -11.3% -10.3% | -8.7% -11.3% -10.3% | 8.8% 14.4% -3.2% | 8.8% 14.4% -3.2% | 8.8% 14.4% -3.2% | 19.1% 20.6% | 19.1% 20.6% | 19.1% 20.6% |
|---|---|---|---|---|---|---|---|---|---|
| -20.4% | 4.5% -16.7% | 44.2% | -24.2% -29.1% | -3.8% -22.2% | 26.1% | -1.2% -26.2% | 1.9% -10.0% | 43.2% | 50.4% |
| -34.7% | -27.6% | 61.6% -33.6% | 43.0% | -31.6% | 46.2% -10.8% | -38.8% | -18.2% | 70.0% | 70.6% |
| -35.2% | -38.3% 265.2% | 10.0% | 181.6% | 33.0% | 7.6% -23.4% | 55.8% | 4.4% | 58.6% | |
| -53.2% -58.8% | 41.6% | -33.3% 360.5% | 30.2% | 198.9% | 15.2% 10.7% | -25.7% | 59.1% | 3.9% | 58.6% |
Source: Nomura estimates
Fig. 131: GWC: P&L
Source: Company data, Nomura estimates
2026F
2027F
2028F
Revised Change (%; pp)|
61,726
73,535
13, 162
18,850
6.2
7,065
88,666
28,342
28,342
12,011
14,831
15,490
11,633
24,568
20,485
12,082
19,163
21.3%
25.6%
11.4%
40.1
16.3%
24.0%
21.1%
18.8%
32.0
24.33
16.4%
25.27
21.6
23.1
20.1
20,485
24,568
19,163
25.1
22.3
25.1
32.0%
25.1
- 1%
27.7%
21.6%
3.7
3.0
3.3
40.08
50
45
40
35
30
25
20
15
10
5
10/28/2014
Valuation methodology and risks
9
7
6
5
Our new TP of TWD1,200 is based on 4.8x 2028F BVPS of TWD252. The 4.8x target multiple is at the upper-half of the historical P/B range of 2-6x during the full semi wafer cycle in 2017-20. 1
Downside risks include:
- Faster-than-expected entry of China into the 12' semi wafer market.
- Slower-than-expected of market consolidation.
- Worse-than-expected end-demand for the semi industry.
- Less favorable demand/supply dynamics in the semi wafer industry.
- Less favorable FX volatility and rising material/utility costs.
Fig. 132: GWC: P/E
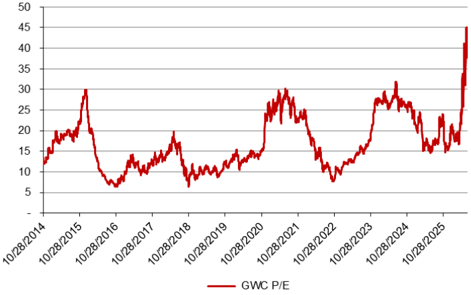
Source: Bloomberg, Nomura estimates
Fig. 133: GWC: P/B
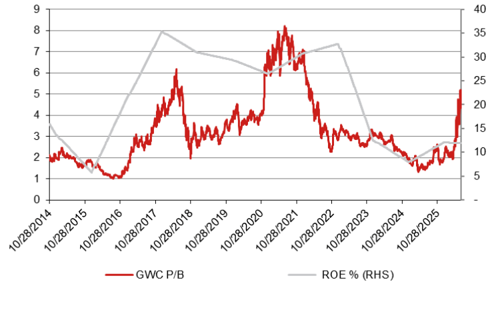
Source: Bloomberg, Nomura estimates
10/28/2018
10/28/2017
10/28/2019
GWC P/B
10/28/2020
10/28/2021
10/28/2022
10/28/2023
10/28/2024
10/28/2025
ROE % (RHS)
35
30
25
20
15
10
5
Relative performance chart
EQUITY: OSAT
Price
(TWD)
350 |
300-
2501
2001
1501
1001
-
175
-
150
-
125
King Yuan Electronics Corp 2449.TW 2449 TT
EQUITY: OSAT
Courna: | CEC Namiiral
Testing time still on the uptrend; Buy
2027 revenue growth scale might surpass 2026 on nextgen AI XPU, key ASICs, and CPU ramps
Reiterate Buy with higher TP of TWD390, implying 27% upside
In 2024, the reason behind our contrarian Neutral rating at that time was due to the potential reducing testing time and share price outperformance (report ). Testing time continues to be a widely-discussed topic across testing supply chain, and we maintain our view that once the testing processes for certain chips mature and move up the learning curve, the testing insertions could be streamlined. Simply put, some testing programs could be passed given high pass rates, to increase units per hour (UPH) and reduce costs (for fabless), especially amid space/equipment constrained environment. Although we once thought its largest AI XPU customer would try its best to reduce the testing time into next gen XPU (even before volume ramp), our recent survey suggests that testing time still needs to double from Blackwell (before being trimmed down after mass production stabilizes) - which is a positive read for the testing supply chain overall, in our view. We believe testing time would only be clear once the manufacturing process has commenced, and thus it is normal, in our view, to see pre-production trials come with a lot of variables. The new finding also partially mitigates our concerns on 2026F revenue growth (we model 41% vs 3540% previously ).
Big picture unchanged; KYEC continues to grow along with AI chips
Along with our updated TSMC (2330 TT, Buy) AI model, as well as CoWoS allocation updates, we also refresh earnings forecasts for KYEC (see AI Semi & Server report ). KYEC is well positioned to enjoy continuous upward revision of TSMC's capacity, and given its broad customer base across key AI XPUs and ASICs, the share dynamics within the AI chip industry will not severely impact its business, in our view. As long as AI demand sustains, and chip complexity increases, we expect to continue to see testing supply chain benefits. We revise up KYEC's 2026F/2027F EPS by 4%/7%, mainly on higher top-line assumptions. Based on our updated earnings forecast, we derive our new TP of TWD390 (from TWD360, based on unchanged 25x P/E and 2027F EPS). Note we have not factored in a stock dividend. For more near-term updates, see our takeaways from 2026 NIFA .
| Year-end 31 Dec Currency (TWD) | FY25 Actual | Old | FY26F New | Old | FY27F New | Old | FY28F New |
|---|---|---|---|---|---|---|---|
| Revenue (mn) | 34,934 | 47,329 | 49,184 | 67,221 | 71,867 | 0 | 93,970 |
| Reported net profit (mn) | 11,016 | 11,421 | 11,891 | 17,666 | 18,883 | 0 | 25,193 |
| Normalised net profit (mn) | 11,016 | 11,421 | 11,891 | 17,666 | 18,883 | 0 | 25,193 |
| FD normalised EPS | 9.01 | 9.34 | 9.72 | 14.45 | 15.44 | 20.60 | |
| FD norm. EPS growth (%) | 41.6 | 3.7 | 7.9 | 54.7 | 58.8 | 33.4 | |
| FD normalised P/E (x) | 34.2 | - | 31.7 | - | 19.9 | - | 14.9 |
| EV/EBITDA (x) | 23.6 | - | 15.6 | - | 10.8 | - | 8.8 |
| Price/book (x) | 7.5 | - | 6.0 | - | 4.7 | - | 3.6 |
| Dividend yield (%) | 0.3 | - | 0.3 | - | 0.5 | - | 0.7 |
| ROE (%) | 23.5 | 20.3 | 21.0 | 25.4 | 26.4 | 27.3 | |
| Net debt/equity (%) | 24.4 | 70.4 | 71.0 | 59.7 | 53.1 | 32.1 |
Source: Company data, Nomura estimates
May
Global Markets Research 30 June 2026
| Rating Remains | Buy |
|---|---|
| Target price Increased from TWD 360.00 | TWD 390.00 |
| Closing price 26 June 2026 | TWD 308.00 |
| Implied upside | +26.6% |
| Market Cap (USD mn) | 11,809.9 |
| ADT (USD mn) | 363.9 |
Relative performance chart
Source: LSEG, Nomura
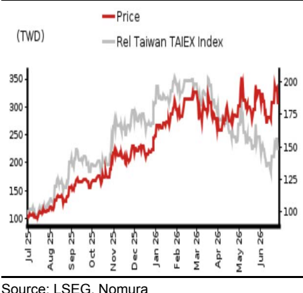
Research Analysts
Semiconductor
Vivian Yang - NITB vivian.yang@nomura.com +886(2) 21769970
Aaron Jeng, CFA - NITB
aaron.jeng@nomura.com +886(2) 21769962
Eric Chen, CFA - NITB
eric.chen@nomura.com +886(2) 21769965
Key data on King Yuan Electronics Corp
Cashflow statement (TWDmn)
| Year-end 31 Dec | FY24 | FY25 | FY26F | FY27F | FY28F |
|---|---|---|---|---|---|
| EBITDA | 13,474 | 16,505 | 26,967 | 38,797 | 46,339 |
| Change in working capital | -14,756 | 21,728 | -3,760 | -3,318 | -5,046 |
| Other operating cashflow | 19,757 | -25,081 | -3,763 | -4,499 | -5,956 |
| Cashflow from operations | 18,475 | 13,152 | 19,444 | 30,980 | 35,336 -24,000 |
| Capital expenditure | -14,857 | -32,355 | -50,000 | -28,000 | |
| Free cashflow | 3,619 | -19,204 | -30,556 | 2,980 | 11,336 |
| Reduction in investments | 0 | 18,704 | 0 | 0 | 0 |
| Net acquisitions | 0 | 0 | 0 | ||
| Dec in other LT assets liabilities | 0 | 0 0 | 0 | 0 | 0 |
| Inc in other LT | 0 502 | 574 | -422 | 0 | 0 |
| Adjustments | 2,980 | ||||
| CF after investing acts | 4,120 | 74 | -30,978 | 11,336 | |
| Cash dividends | -3,913 | -4,891 | -1,223 | -1,189 | -1,888 |
| Equity issue | 0 | 0 | 0 | 0 | 0 |
| Debt issue | 1,760 | 9,918 | 18,859 | 0 | 0 |
| Convertible debt issue | -3,901 | 2,534 | -56 | 0 | 0 |
| Others CF from financial acts | -6,053 | 7,560 | 17,581 | -1,189 | -1,888 |
| Net cashflow | -1,933 | 7,634 | -13,397 | 1,791 | 9,448 |
| Beginning cash | 12,263 | 4,567 | 6,357 | ||
| Ending cash | 10,329 | 17,964 | |||
| 10,329 | 17,964 | 4,567 | 6,357 | 15,805 | |
| Ending net debt | |||||
| Balance sheet As at 31 Dec | 44,568 | ||||
| (TWDmn) | 10,251 | 12,311 | 42,777 | 33,329 | |
| FY24 | FY25 | FY26F | FY27F | FY28F | |
| Marketable securities Accounts receivable | 90 6,032 | 173 7,203 | 173 10,828 | 173 14,048 | 173 18,936 |
| Inventories | 848 | 1,159 | 1,649 | 2,103 | 2,834 |
| Other current assets | 26,619 | 2,420 | 5,019 | 5,019 | 5,019 |
| Total current assets | 43,918 | 28,919 | 22,235 | 27,700 | 42,768 |
| LT investments | 8,416 | ||||
| Fixed assets | 6,469 | 8,416 | 8,416 | 8,416 121,516 | |
| 36,929 | 62,559 | 100,082 | 112,687 | 1 | |
| Goodwill Other intangible assets | 8 -613 | 9 1,274 | 4 10,086 | 1 10,086 | 10,086 |
| Other LT assets Total assets | 86,711 | 101,178 | 140,824 | 158,891 | 182,787 |
| Short-term debt | 0 | 0 | 0 | 0 | 0 |
| Accounts payable | 909 | 1,293 | 1,650 | 2,224 | |
| Other current | 942 | 17,578 | 17,578 | 17,578 | |
| liabilities | 15,964 | 15,010 | 19,802 | ||
| Total current liabilities | 16,907 | 15,919 | 18,872 | 19,228 | |
| Long-term debt | 20,581 | 30,275 | 49,134 | 49,134 | 49,134 |
| Convertible debt | 9,988 | 9,988 | 9,988 | ||
| Other LT liabilities Total liabilities | 4,512 41,999 | 4,546 50,740 | 77,994 | 78,350 | 78,924 |
| Minority | 8 | 29 | 47 | 64 | |
| interest | 1,415 | 0 | |||
| Preferred stock | 0 | 0 | 0 | 12,227 | 0 12,227 |
| Common stock | 12,227 | 12,227 | 12,227 | ||
| Retained earnings Proposed dividends | 18,181 | 24,305 | 34,974 | 52,667 | 75,972 |
| 12,888 | 13,896 50,429 | 15,600 | 15,600 80,495 | 15,600 103,799 | |
| Other equity and reserves Total shareholders' equity | 43,296 | 62,801 | |||
| Total equity & liabilities | 86,711 | 101,178 | 140,824 | 158,891 | |
| Liquidity (x) | 182,787 | ||||
| 2.60 17.0 | 1.82 - | 1.18 363.3 1.65 | 1.44 130.9 1.10 | 2.16 562.5 | |
| Current ratio Interest cover | 0.76 23.7 | 24.4 | 71.0 | 53.1 | 0.72 32.1 |
| Leverage Net debt/EBITDA (x) Net debt/equity (%) | 0.75 | ||||
| Per share Reported EPS | |||||
| (TWD) Norm EPS (TWD) | 6.36 6.36 | 9.01 9.01 | 9.72 9.72 | 15.44 15.44 | 20.60 20.60 |
| FD norm EPS (TWD) BVPS (TWD) | 6.36 35.41 | 9.01 41.24 | 9.72 51.36 | 15.44 65.83 | 20.60 84.89 |
| DPS (TWD) | 4.00 | 1.00 | 0.97 | ||
| 1.54 | 2.06 | ||||
| Activity (days) | 92.0 | 64.2 | |||
| Days receivable | 69.1 | 66.9 | 63.2 | 16.6 | |
| Days inventory | 20.1 | 16.3 | 17.4 | 16.4 | |
| Days payable | 22.0 | 15.1 | 13.7 | 13.0 | |
| 90.1 | 70.4 | 70.7 | 12.9 | 67.8 | |
| Cash cycle | 66.7 |
Source: Company data, Nomura estimates
Performance
| (%) | 1M | 3M | 12M | ||
|---|---|---|---|---|---|
| Absolute (TWD) | -9 | 6.9 | 200.5 | M cap (USDmn) | 11,809.9 |
| Absolute (USD) | -10.2 | 7 | 173.4 | Free float (%) | 88.6 |
| Rel to Taiwan TAIEX Index | -11.4 | -26.8 | 102.3 | 3-mth ADT (USDmn) | 363.9 |
Income statement (TWDmn)
| Year-end 31 Dec | FY24 | FY25 | FY26F | FY27F | FY28F |
|---|---|---|---|---|---|
| Revenue | 26,856 | 34,934 | 49,184 | 71,867 | 93,970 |
| Cost of goods sold | -17,512 | -22,411 | -29,443 | -41,683 | -54,503 |
| Gross profit | 9,344 | 12,522 | 19,741 | 30,184 | 39,467 |
| SG&A | -3,172 | -3,520 | -5,245 | -6,780 | -8,299 |
| Employee share expense | |||||
| Operating profit | 6,172 | 9,003 | 14,496 | 23,404 | 31,168 |
| EBITDA | 13,474 | 16,505 | 26,967 | 38,797 | 46,339 |
| Depreciation | -7,313 | -7,508 | -12,477 | -15,395 | -15,171 |
| Amortisation | 11 | 6 | 6 | 2 | 1 |
| EBIT | 6,172 | 9,003 | 14,496 | 23,404 | 31,168 |
| Net interest expense | -362 | 188 | -40 | -179 | -55 |
| Associates & JCEs | |||||
| Other income | 162 | 1,438 | 298 | 400 | 400 |
| Earnings before tax | 5,972 | 10,629 | 14,754 | 23,625 | 31,513 |
| Income tax | -1,211 | -2,624 | -2,843 | -4,725 | -6,303 |
| Net profit after tax | 4,761 | 8,005 | 11,912 | 18,900 | 25,210 |
| Minority interests | -316 | -42 | -21 | -18 | -17 |
| Other items | 3,334 | 3,053 | 0 | 0 | 0 |
| Preferred dividends | |||||
| Normalised NPAT | 7,779 | 11,016 | 11,891 | 18,883 | 25,193 |
| Extraordinary items | |||||
| Reported NPAT | 7,779 | 11,016 | 11,891 | 18,883 | 25,193 |
| Dividends | -4,891 | -1,223 | -1,189 | -1,888 | -2,519 |
| Transfer to reserves | 2,888 | 9,793 | 10,702 | 16,994 | 22,674 |
| Valuations and ratios | |||||
| Reported P/E (x) | 48.4 | 34.2 | 31.7 | 19.9 | 14.9 |
| Normalised P/E (x) | 48.4 | 34.2 | 31.7 | 19.9 | 14.9 |
| FD normalised P/E (x) | 48.4 | 34.2 | 31.7 | 19.9 | 14.9 |
| Dividend yield (%) | 1.3 | 0.3 | 0.3 | 0.5 | 0.7 |
| Price/cashflow (x) | 20.4 | 28.6 | 19.4 | 12.2 | 10.7 |
| Price/book (x) | 8.7 | 7.5 | 6.0 | 4.7 | 3.6 |
| EV/EBITDA (x) | 28.8 | 23.6 | 15.6 | 10.8 | 8.8 |
| EV/EBIT (x) | 62.9 | 43.2 | 29.1 | 17.9 | 13.2 |
| Gross margin (%) | 34.8 | 35.8 | 40.1 | 42.0 | 42.0 |
| EBITDA margin (%) | 50.2 | 47.2 | 54.8 | 54.0 | 49.3 |
| EBIT margin (%) | 23.0 | 25.8 | 29.5 | 32.6 | 33.2 |
| Net margin (%) | 29.0 | 31.5 | 24.2 | 26.3 | 26.8 |
| Effective tax rate (%) | 20.3 | 24.7 | 19.3 | 20.0 | 20.0 |
| Dividend payout (%) | 62.9 | 11.1 | 10.0 | 10.0 | 10.0 |
| ROE (%) | 18.9 | 23.5 | 21.0 | 26.4 | 27.3 |
| ROA (pretax %) | 8.9 | 11.3 | 13.2 | 16.2 | 19.5 |
| Growth (%) | |||||
| Revenue | -18.7 | 30.1 | 40.8 | 46.1 | 30.8 |
| EBITDA | -18.0 | 22.5 | 63.4 | 43.9 | 19.4 |
| Normalised EPS | 33.2 | 41.6 | 7.9 | 58.8 | 33.4 |
| Normalised FDEPS | 33.2 | 41.6 | 7.9 | 58.8 | 33.4 |
Source: Company data, Nomura estimates
Company profile
Established in 1987, KYEC is world's top 10 outsourced semiconductor assembly and test (OSAT) firm. Currently, major business operations include wafer grinding/dicing, test and packaging, burn-in test and turnkey service. KYEC was officially listed in TWSE since 2001.
Valuation Methodology
Our TP of TWD390 is based on 25x 2027F EPS. 25x is at its high end of historical range. The benchmark index for this stock is TAIEX.
Risks that may impede the achievement of the target price
Major downside risks to KYEC include 1) weaker AI/smartphone demand, 2) fierce competition in back-end testing, and 3) worse-than-expected AI monetization and sustainability
ESG
KYEC is committed to reducing Scope 2 carbon emissions by setting greenhouse gas reduction targets, promoting energy-saving projects, expanding the usage of renewable energy, and actively installing photovoltaic power generation systems at each plant.
Financial analysis and forecasts
Fig. 134: KYEC's 2026-27F forecast revisions
| 2026F | 2026F | 2026F | 2027F | 2027F | 2027F | |
|---|---|---|---|---|---|---|
| (TWD mn) | Revised | Previous | Diff | Revised | Previous | Change |
| Net sales | 49,184 | 47,329 | 3.9% | 71,867 | 67,221 | 6.9% |
| Gross profit | 19,741 | 18,984 | 4.0% | 30,184 | 28,233 | 6.9% |
| Operating profit | 14,496 | 13,908 | 4.2% | 23,404 | 21,894 | 6.9% |
| Net profit | 11,891 | 11,421 | 4.1% | 18,883 | 17,666 | 6.9% |
| EPS (TWD) | 9.72 | 9.34 | 4.1% | 15.44 | 14.45 | 6.9% |
| Margin | Revised | Previous | Diff | Revised | Previous | Change |
| Gross margin (%) | 40.1 | 40.1 | 0.0 pp | 42.0 | 42.0 | 0.0 pp |
| Operating margin (%) | 29.5 | 29.4 | 0.1 pp | 32.6 | 32.6 | 0.0 pp |
| Net margin (%) | 24.2 | 24.1 | 0.0 pp | 26.3 | 26.3 | 0.0 pp |
Source: Company data, Nomura estimates
Fig. 135: KYEC P&L
| (TWD mn) | 1Q25 | 2Q25 | 3Q25 | 4Q25 | 1Q26 | 2Q26F | 3Q26F | 4Q26F | 1Q27F | 2Q27F | 3Q27F | 4Q27F | 2025 | 2026F | 2027F | 2028F |
|---|---|---|---|---|---|---|---|---|---|---|---|---|---|---|---|---|
| Net sales | 7,315 | 8,362 | 9,291 | 9,966 | 10,192 | 11,258 | 12,754 | 14,980 | 16,461 | 17,520 | 18,451 | 19,435 | 34,934 | 49,184 | 71,867 | 93,970 |
| Gross profit | 2,450 | 2,972 | 3,347 | 3,753 | 4,051 | 4,447 | 5,101 | 6,142 | 6,914 | 7,358 | 7,749 | 8,163 | 12,522 | 19,741 | 30,184 | 39,467 |
| - OPEX | (928) | (795) | (855) | (942) | (1,279) | (1,326) | (1,314) | (1,326) | (1,616) | (1,632) | (1,720) | (1,812) | (3,520) | (5,245) | (6,780) | (8,299) |
| Operating profit | 1,523 | 2,176 | 2,492 | 2,812 | 2,772 | 3,121 | 3,787 | 4,816 | 5,298 | 5,727 | 6,029 | 6,350 | 9,003 | 14,496 | 23,404 | 31,168 |
| Net profit | 4,290 | 2,175 | 2,302 | 2,248 | 2,286 | 2,645 | 3,071 | 3,889 | 4,276 | 4,620 | 4,865 | 5,121 | 11,016 | 11,891 | 18,883 | 25,193 |
| EPS (TWD) | 3.51 | 1.78 | 1.88 | 1.84 | 1.87 | 2.16 | 2.51 | 3.18 | 3.50 | 3.78 | 3.98 | 4.19 | 9.01 | 9.72 | 15.44 | 20.60 |
| Profitability | 1Q25 | 2Q25 | 3Q25 | 4Q25 | 1Q26 | 2Q26F | 3Q26F | 4Q26F | 1Q27F | 2Q27F | 3Q27F | 4Q27F | 2025 | 2026F | 2027F | 2027F |
| Gross margin | 33.5% | 35.5% | 36.0% | 37.7% | 39.7% | 39.5% | 40.0% | 41.0% | 42.0% | 42.0% | 42.0% | 42.0% | 35.8% | 40.1% | 42.0% | 42.0% |
| - OPEX ratio | (12.7%) | (9.5%) | (9.2%) | (9.5%) | (12.5%) | (11.8%) | (10.3%) | (8.8%) | (9.8%) | (9.3%) | (9.3%) | (9.3%) | (10.1%) | (10.7%) | (9.4%) | (8.8%) |
| Operating margin | 20.8% | 26.0% | 26.8% | 28.2% | 27.2% | 27.7% | 29.7% | 32.2% | 32.2% | 32.7% | 32.7% | 32.7% | 25.8% | 29.5% | 32.6% | 33.2% |
| Net margin | 58.6% | 26.0% | 24.8% | 22.6% | 22.4% | 23.5% | 24.1% | 26.0% | 26.0% | 26.4% | 26.4% | 26.3% | 31.5% | 24.2% | 26.3% | 26.8% |
| Q-Q | 1Q25 | 2Q25 | 3Q25 | 4Q25 | 1Q26 | 2Q26F | 3Q26F | 4Q26F | 1Q27F | 2Q27F | 3Q27F | 4Q27F | 2025 | 2026F | 2027F | 2028F |
| Net sales | 0.3% | 14.3% | 11.1% | 7.3% | 2.3% | 10.5% | 13.3% | 17.5% | 9.9% | 6.4% | 5.3% | 5.3% | ||||
| Gross profit | (3.4%) | 21.3% | 12.6% | 12.2% | 7.9% | 9.8% | 14.7% | 20.4% | 12.6% | 6.4% | 5.3% | 5.3% | ||||
| - OPEX | (10.2%) | (14.3%) | 7.5% | 10.2% | 35.8% | 3.7% | (0.9%) | 0.9% | 21.9% | 1.0% | 5.4% | 5.4% | ||||
| Operating profit | 1.3% | 42.9% | 14.5% | 12.8% | (1.4%) | 12.6% | 21.4% | 27.2% | 10.0% | 8.1% | 5.3% | 5.3% | ||||
| Net profit | 111.3% | (49.3%) | 5.8% | (2.4%) | 1.7% | 15.7% | 16.1% | 26.6% | 10.0% | 8.0% | 5.3% | 5.3% | ||||
| Y-Y | 1Q25 | 2Q25 | 3Q25 | 4Q25 | 1Q26 | 2Q26F | 3Q26F | 4Q26F | 1Q27F | 2Q27F | 3Q27F | 4Q27F | 2025 | 2026F | 2027F | 2028F |
| Net sales | 22.4% | 27.8% | 32.0% | 36.6% | 39.3% | 34.6% | 37.3% | 50.3% | 61.5% | 55.6% | 44.7% | 29.7% | 30.1% | 40.8% | 46.1% | 30.8% |
| Gross profit | 24.2% | 28.8% | 32.4% | 48.0% | 65.3% | 49.7% | 52.4% | 63.6% | 70.7% | 65.5% | 51.9% | 32.9% | 34.0% | 57.6% | 52.9% | 30.8% |
| - OPEX | 38.7% | 11.9% | 12.6% | (8.8%) | 37.8% | 66.8% | 53.8% | 40.7% | 26.4% | 23.0% | 30.9% | 36.7% | 11.0% | 49.0% | 29.3% | 22.4% |
| Operating profit | 16.8% | 36.3% | 40.9% | 87.0% | 82.0% | 43.4% | 52.0% | 71.3% | 91.1% | 83.5% | 59.2% | 31.9% | 45.9% | 61.0% | 61.5% | 33.2% |
| Net profit | 213.5% | 14.3% | (7.1%) | 10.7% | (46.7%) | 21.6% | 33.4% | 73.0% | 87.0% | 74.7% | 58.4% | 31.7% | 41.6% | 7.9% | 58.8% | 33.4% |
Source: Company data, Nomura estimates
Fig. 136: Nomura forecasts vs Bloomberg consensus estimates for 2026-28F
| 2026F | 2026F | 2026F | 2027F | 2027F | 2027F | 2028F | 2028F | 2028F | |
|---|---|---|---|---|---|---|---|---|---|
| (TWD mn) | NMR | BBG | Diff (%) | NMR | BBG | Diff (%) | NMR | BBG | Diff (%) |
| Net sales | 49,184 | 49,094 | 0.2 | 71,867 | 68,305 | 5.2 | 93,970 | 89,936 | 4.5 |
| Gross profit | 19,741 | 19,535 | 1.1 | 30,184 | 28,167 | 7.2 | 39,467 | 37,980 | 3.9 |
| Operating profit | 14,496 | 14,569 | (0.5) | 23,404 | 21,962 | 6.6 | 31,168 | 29,630 | 5.2 |
| Net profit | 11,891 | 11,811 | 0.7 | 18,883 | 17,701 | 6.7 | 25,193 | 24,011 | 4.9 |
| EPS (TWD) | 9.72 | 9.55 | 1.8 | 15.44 | 14.35 | 7.6 | 20.60 | 19.61 | 5.1 |
| Margin | NMR | BBG | Diff (%) | NMR | BBG | Diff (%) | NMR | BBG | Diff (%) |
| Gross margin (%) | 40.1 | 39.8 | 0.3 | 42.0 | 41.2 | 0.8 | 42.0 | 42.2 | (0.2) |
| Operating margin (%) | 29.5 | 29.7 | (0.2) | 32.6 | 32.2 | 0.4 | 33.2 | 32.9 | 0.2 |
| Net margin (%) | 24.2 | 24.1 | 0.1 | 26.3 | 25.9 | 0.4 | 26.8 | 26.7 | 0.1 |
Source: Company data, Bloomberg Finance L.P., Nomura estimates
35
30
22
25
20
17
15
10
12
5
0
Jun-21|
7
2
Jun-24
35
30
Valuation methodology and risks
400
350
300
Our TP of TWD390 is based on 25x 2027F EPS. 25x is at its high end of its historical range. 200
Major downside risks to KYEC include 1) weaker AI/smartphone demand, 2) fierce competition in back-end testing, and 3) worse-than-expected AI monetization and sustainability. Jun-23 Jun-24 Jun-25 Jun-26 0 Jun-21 Jun-22
- BEst P/E Ratio
Average: 14x
- +1SD: 20x
Fig. 137: KYEC's consensus 1BF P/E
Jun-22
Jun-23
2024E EPS
Jun-25
• BEst P/E Ratio
Jun-23
Jun-24
Jun-25
• Average: 14x
- +1SD: 20x
50
Fig. 138: KYEC's consensus 1BF P/E
Jun-26
2026E EPS
Price (TWD; RHS)
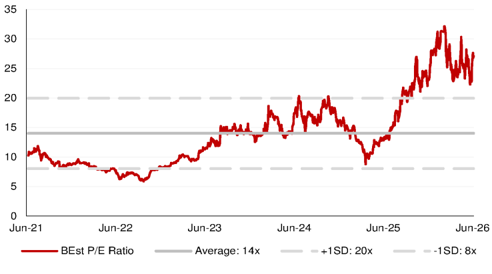
Source: Bloomberg Finance L.P., Nomura research
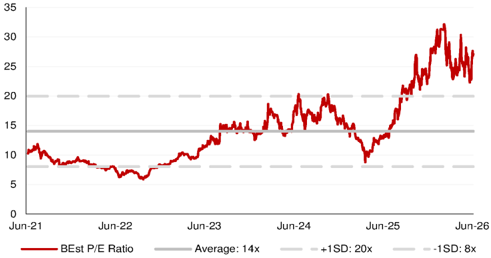
- 2025E EPS
Source: Bloomberg Finance L.P., Nomura research
Fig. 139: KYEC's share price vs Bloomberg consensus EPS estimate revisions
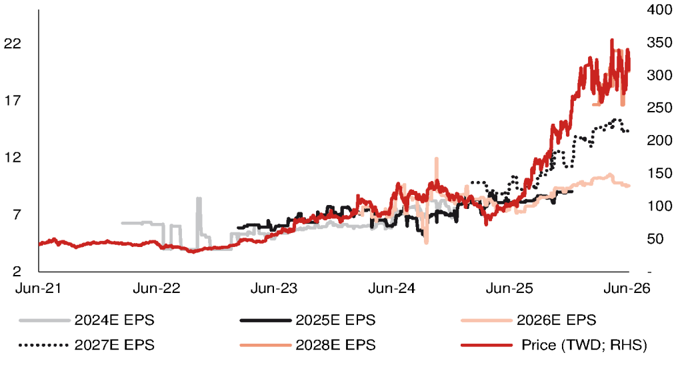
Source: Bloomberg Finance L.P., Nomura research
-1SD: 8x
Jun-26
- -1SD: 8x
Relative performance chart
EQUITY: TECHNOLOGY
Price
(TWD)
60001
50001
40001
30001
20001
1000 - 71
+300
-250
-200
-150
Elite Material 2383.TW 2383 TT
EQUITY: TECHNOLOGY
Churra. I CEC Namura
Earnings uptrend backed by pricing tailwinds
Google's AI demand in spotlight; industry pricing dynamics remain favorable
Action: Reiterate Buy; raise TP to TWD6,880, implying ~31% upside
Elite Material's (EMC) strong QTD revenue is a clear manifestation of strong AI demand (notably Google Ironwood and AWS Trainium 3), in our view, and more importantly, a smoother-thanexpected pricing uplift. We estimate 2Q26 revenue will grow +37% q-q with GM likely to further expand to 32.4%. While AI PCB/CCL industry supply is already tight loaded by existing projects, we note that most new AI platforms (e.g. Google TPU 8t/8i and nVidia VR) would only start to ramp up production in 3Q26 , spanning not only main boards but also large peripheral boards carrying content such as CPUs and switches (usually >20L; Fig. 140 ). This might further worsen the supply/demand imbalance into 2H26F, driving potentially another round of price actions by CCL makers as they strategically allocate more resources to more profitable AI PCB customers. We believe EMC is best positioned to benefit given its large capacity scale, and we observe that the company is mulling extra capacity expansion in China beyond 2027 (subject to the board approval; Fig. 141 ). Although we are aware of EMC's attempts to broaden its business scope by building high standard new capacity to prepare for ABF substrate CCL opportunities amid current industry shortages, we have not yet factored in the potential. We assume it is still focused on high-speed CCL production (the production line is fungible). Net, we raise 2026F/27F/28F EPS by 18%/22%/19% to factor in a stronger AI demand profile (particularly Google) and better profitability, and reiterate Buy with a higher TP of TWD6,880 (from TWD5,285), based on 32x 2027F EPS of TWD215 (from 30x 2027F EPS TWD176), which is at the higher end of EMC's historical band of 8-36x since 2017. We expect a continued rerating given EMC's dominant position in the AI upcycle and persisting CCL industry shortage. EMC currently trades at 24x 2027F P/E.
Robust Google demand more than offset lukewarm demand for AWS units
Along with our Asia AI Semi & Server Anchor Report, we refresh our unit assumptions of major AI platforms - we anticipate a rather flattish chip unit demand pattern for AWS Trainium but stronger Google TPU/CPU demand backed by more upstream resources secured. We estimate CCL content opportunities from Google's TPU/CPU boards and switches could almost triple in 2027F to make up 58% of EMC's AI revenue in 2027F (vs. 38% in 2026F).
| Year-end 31 Dec (TWD) | FY25 Actual | Old | FY26F New | Old | FY27F New | Old | FY28F New |
|---|---|---|---|---|---|---|---|
| Currency Revenue (mn) | 94,261 | 176,103 | 197,788 | 270,604 | 312,625 | 366,987 | 418,200 |
| Reported net profit (mn) | 14,649 | 34,879 | 41,087 | 63,114 | 77,024 | 88,678 | 105,384 |
| Normalised net profit (mn) | 14,649 | 34,879 | 41,087 | 63,114 | 77,024 | 88,678 | 105,384 |
| FD normalised EPS | 41.67 | 97.35 | 114.67 | 176.15 | 214.96 | 247.50 | 294.11 |
| FD norm. EPS growth (%) | 49.8 | 133.6 | 175.2 | 80.9 | 87.5 | 40.5 | 36.8 |
| FD normalised P/E (x) | 126.1 | - | 45.8 | - | 24.4 | - | 17.9 |
| EV/EBITDA (x) | 89.7 | - | 32.1 | - | 17.6 | - | 12.7 |
| Price/book (x) | 37.3 | - | 24.5 | - | 14.6 | - | 10.1 |
| Dividend yield (%) | 0.5 | - | 1.3 | - | 2.5 | - | 3.4 |
| ROE (%) | 34.3 | 57.7 | 64.6 | 69.0 | 75.0 | 64.5 | 66.7 |
| Net debt/equity (%) | net cash | net cash | net cash | net cash | net cash | net cash | net cash |
Source: Company data, Nomura estimates
Global Markets Research 30 June 2026
| Rating Remains | Buy |
|---|---|
| Target price Increased from TWD 5,285.00 | TWD 6,880.00 |
| Closing price 26 June 2026 | TWD 5,255.00 |
| Implied upside | +30.9% |
| Market Cap (USD mn) | 59,047.8 |
| ADT (USD mn) | 393.2 |
Relative performance chart
Source: LSEG, Nomura
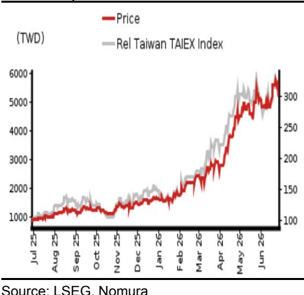
Research Analysts
Taiwan Technology
Eric Chen, CFA - NITB eric.chen@nomura.com +886(2) 21769965
Anne Lee, CFA - NITB
anne.lee@nomura.com +886(2) 21769966
Carol Hu - NITB
carol.r.hu@nomura.com +886(2) 21769963
Key data on Elite Material
Performance
| (%) | 1M | 3M | 12M | ||
|---|---|---|---|---|---|
| Absolute (TWD) | -0.7 | 78.4 | 514.6 | M cap (USDmn) | 59,047.8 |
| Absolute (USD) | -2 | 78.6 | 459.3 | Free float (%) | 86.1 |
| Rel to Taiwan TAIEX Index | -3.1 | 44.7 | 416.5 | 3-mth ADT (USDmn) | 393.2 |
Income statement (TWDmn)
| Year-end 31 Dec | FY24 | FY25 | FY26F | FY27F | FY28F |
|---|---|---|---|---|---|
| Revenue | 64,377 | 94,261 | 197,788 | 312,625 | 418,200 |
| Cost of goods sold | -46,407 | -66,141 | -131,625 | -199,186 | -265,794 |
| Gross profit | 17,970 | 28,120 | 66,163 | 113,438 | 152,406 |
| SG&A | -5,818 | -9,012 | -11,468 | -13,351 | -15,487 |
| Employee share expense | |||||
| Operating profit | 12,152 | 19,108 | 54,696 | 100,087 | 136,919 |
| EBITDA | 13,921 | 20,958 | 58,345 | 105,737 | 144,568 |
| Depreciation | -1,769 | -1,849 | -3,649 | -5,649 | -7,649 |
| Amortisation | |||||
| EBIT | 12,152 | 19,108 | 54,696 | 100,087 | 136,919 |
| Net interest expense | -315 | -216 | -261 | -261 | -261 |
| Associates & JCEs | 0 | 0 | 0 | 0 | 0 |
| Other income | 297 | -16 | -819 | 200 | 200 |
| Earnings before tax | 12,133 | 18,876 | 53,616 | 100,026 | 136,857 |
| Income tax | -2,564 | -4,231 | -12,532 | -23,006 | -31,477 |
| Net profit after tax | 9,569 | 14,645 | 41,083 | 77,020 | 105,380 |
| Minority interests | 9 | 4 | 4 | 4 | 4 |
| Other items | |||||
| Preferred dividends | |||||
| Normalised NPAT | 9,578 | 14,649 | 41,087 | 77,024 | 105,384 |
| Extraordinary items | 0 | 0 | 0 | 0 | 0 |
| Reported NPAT | 9,578 | 14,649 | 41,087 | 77,024 | 105,384 |
| Dividends | -5,894 | -8,958 | -25,063 | -46,985 | -64,284 |
| Transfer to reserves | 3,685 | 5,691 | 16,024 | 30,039 | 41,100 |
| Valuations and ratios | |||||
| Reported P/E (x) | 189.0 | 126.1 | 45.8 | 24.4 | 17.9 |
| Normalised P/E (x) | 189.0 | 126.1 | 45.8 | 24.4 | 17.9 |
| FD normalised P/E (x) | 189.0 | 126.1 | 45.8 | 24.4 | 17.9 |
| Dividend yield (%) | 0.3 | 0.5 | 1.3 | 2.5 | 3.4 |
| Price/cashflow (x) | 249.2 | 154.4 | 53.1 | 31.8 | 20.4 |
| Price/book (x) | 51.9 | 37.3 | 24.5 | 14.6 | 10.1 |
| EV/EBITDA (x) | 135.2 | 89.7 | 32.1 | 17.6 | 12.7 |
| EV/EBIT (x) | 154.9 | 98.4 | 34.2 | 18.6 | 13.4 |
| Gross margin (%) | 27.9 | 29.8 | 33.5 | 36.3 | 36.4 |
| EBITDA margin (%) | 21.6 | 22.2 | 29.5 | 33.8 | 34.6 |
| EBIT margin (%) | 18.9 | 20.3 | 27.7 | 32.0 | 32.7 |
| Net margin (%) | 14.9 | 15.5 | 20.8 | 24.6 | 25.2 |
| Effective tax rate (%) | 21.1 | 22.4 | 23.4 | 23.0 | 23.0 |
| Dividend payout (%) | 61.5 | 61.2 | 61.0 | 61.0 | 61.0 |
| ROE (%) | 30.9 | 34.3 | 64.6 | 75.0 | 66.7 |
| ROA (pretax %) | 23.1 | 25.6 | 51.9 | 65.3 | 64.7 |
| Growth (%) | |||||
| Revenue | 55.9 | 46.4 | 109.8 | 58.1 | 33.8 |
| EBITDA | 61.0 | 50.5 | 178.4 | 81.2 | 36.7 |
| Normalised EPS | 70.1 | 49.8 | 175.2 | 87.5 | 36.8 |
| Normalised FDEPS | 70.1 | 49.8 | 175.2 | 87.5 | 36.8 |
Source: Company data, Nomura estimates
Cashflow statement (TWDmn)
| Year-end 31 Dec | FY24 | FY25 | FY26F | FY27F | FY28F |
|---|---|---|---|---|---|
| EBITDA | 13,921 | 20,958 | 58,345 | 105,737 | 144,568 |
| Change in working capital Other operating cashflow | -5,974 -683 | -4,651 | -9,273 | -23,438 -23,063 | -20,739 -31,534 |
| Cashflow from operations | 7,263 | -4,339 11,968 | -13,609 35,463 | 59,235 | 92,294 |
| Capital expenditure | -5,865 | -18,000 | -20,000 | -20,000 | |
| -9,488 2,480 | 17,463 | 39,235 | 72,294 | ||
| Free cashflow | 1,398 | ||||
| Reduction in investments | 0 | 0 | 0 | 0 | 0 |
| Net acquisitions | 0 | 0 | 0 | 0 | 0 |
| Dec in other LT assets liabilities | 0 | 0 | 0 | 0 | 0 0 |
| Inc in other LT Adjustments | 0 -36 | 0 | 0 | 0 0 | |
| -400 | 0 | 0 | |||
| CF after investing acts | 1,363 | 2,080 | 17,463 | 39,235 | 72,294 |
| Cash dividends | -3,439 | -5,894 | -8,958 | -25,063 | -46,985 |
| Equity issue | 0 | 0 | 0 | 0 | 0 |
| Debt issue | 1,148 | 8,721 | 0 | 0 | 0 |
| Convertible debt issue | 0 | 0 | 0 | 0 | 0 |
| Others acts | 6,658 | 112 | 0 | 0 | 0 |
| CF from financial | 4,367 | 2,939 | -8,958 | -25,063 | -46,985 |
| Net cashflow | 5,729 | 5,020 | 8,505 | 14,172 | 25,310 |
| Beginning cash | 9,259 | 14,988 | 20,008 | 28,513 | 42,685 |
| Ending cash | 14,988 | 20,008 | 28,513 | 42,685 | 67,995 |
| Ending net debt | -50,496 | ||||
| -170 | -2,509 | -11,015 | -25,186 | ||
| Balance sheet (TWDmn) | |||||
| As at 31 Dec | FY24 | FY25 | FY26F | FY27F | FY28F |
| Cash & equivalents | 14,988 | 20,008 | 28,513 | 42,685 | 67,995 |
| Marketable securities | 1 | 0 | 0 | 0 | 0 |
| Accounts receivable | 25,897 | 36,115 | 61,314 | 96,914 | 129,642 |
| Inventories | 9,437 | 16,752 | 21,060 | 31,870 | 42,527 |
| Other current assets | 1,171 | 1,106 | 1,106 | 1,106 | 1,106 |
| Total current assets | 51,494 | 73,980 | 111,993 | 172,574 | 241,269 |
| LT investments | 0 | 0 | 0 | 0 | 0 |
| Fixed assets Goodwill | 21,387 0 | 30,864 | 45,215 | 59,565 0 | 71,916 0 |
| Other intangible assets | 0 | 0 | |||
| Other LT assets | 3,199 | 3,069 | -5,780 | -5,780 | -5,780 |
| Total assets | 76,080 | 107,913 | 151,427 | 226,359 | 307,405 |
| Short-term debt | 6,047 | 9,279 | 9,279 | 9,279 | 9,279 |
| Accounts payable | 15,963 | 44,752 | 67,723 | 90,370 | |
| 24,518 | 12,434 | 12,434 | |||
| Other current liabilities | 8,172 | 12,434 | 12,434 | ||
| Total current liabilities | 30,182 | 46,231 | 66,466 | 89,437 | 112,083 |
| Long-term debt | 8,772 | 8,219 | 8,219 | 8,219 | 8,219 |
| Other LT | 0 | ||||
| Convertible debt liabilities | 2,032 | 3,027 | 0 | 0 | |
| Total liabilities | 40,986 | 57,477 | 74,685 | 97,656 | 120,302 |
| Minority interest | |||||
| Preferred stock | |||||
| Common stock | 3,466 | 3,583 | 3,583 | 3,583 | 3,583 |
| Retained earnings Proposed dividends | 31,673 | 46,250 | 72,557 | 124,518 | 182,917 |
| Total shareholders' equity | 35,094 | 50,435 | 76,742 | 128,703 | 187,103 |
| Total equity & liabilities | 76,080 | 107,913 | 151,427 | 226,359 | 307,405 |
| Liquidity (x) | |||||
| Current ratio | 1.71 | 1.60 | 1.68 | 1.93 | 2.15 |
| Interest cover | 38.5 | 88.3 | 209.3 | 382.9 | 523.8 |
| Leverage | |||||
| Net debt/EBITDA (x) | net cash | net cash | net cash net cash | net cash | net cash |
| Net | |||||
| debt/equity (%) | net cash | net cash | net cash | net cash | |
| Per share | |||||
| Reported EPS (TWD) | 27.81 | 41.67 | 114.67 | 214.96 | 294.11 |
| Norm EPS (TWD) (TWD) | 27.81 | 41.67 | 114.67 | 214.96 | 294.11 |
| FD norm EPS | 27.81 | 41.67 | 114.67 | 214.96 | 294.11 |
| BVPS (TWD) | 101.24 | 140.75 | 214.17 | 359.18 | 522.16 |
| DPS (TWD) Activity (days) | 17.00 | 25.00 | 69.95 | 131.12 | 179.40 |
| Days receivable | 122.5 | 120.1 | 89.9 | 92.4 | 99.1 |
| Days inventory | 61.2 | 72.3 | 52.4 | 48.5 | 51.2 |
| Days payable Cash cycle | 104.0 79.7 | 111.7 80.6 | 96.0 46.3 | 103.1 37.8 | 108.8 41.5 |
Source: Company data, Nomura estimates
Company profile
Elite Material manufactures and sells CCLs and PP, and providing the Mass Lam service for the downstream PCB makers. Applications of its products include communication devices, networking infrastructure products and 5G communication products.
Valuation Methodology
Our TP of TWD6,880 is based on 32x 2027F EPS of TWD215. Our target multiple is at the high end of its historical P/E range of 8-36x since 2017. The benchmark of this stock is TAIEX.
Risks that may impede the achievement of the target price
Downside/upside risks: 1) smartphone demand is weaker/stronger than expected; 2) EMC's progress in high speed CCL/RCC is slower/faster than expected; 3) the adoption of HDI in vehicles is slower/faster than expected; and 4) unexpected share loss/gains in AI server/switch, 5) weaker/stronger-than-expected demand from AI server/switch.
ESG
EMC is committed to sustainability management and minimizing the impact of its operations to the environment. EMC adopts ESH (Environmental, Safety, and Health) philosophy and management system. The waste of the production process is classified, and the materials can be recycled and reused are properly stored and consumed again internally.
Fig. 140: A summary of AI PCB/CCL specs and supply chain
nVidia
| Generation | Content | Time | Structure | CCL Material | CCL Supplier(s) | PCB Supplier(s) | PCB Supplier(s) | PCB Supplier(s) |
|---|---|---|---|---|---|---|---|---|
| H100 | OAM UBB | 2H23-1Q25 24L PCB | 5+8+5 HDI (18L) | M7 M7 | EMC | Unimicron (major), VGT, others | EMC | WUS, ISU, TTM, |
| B200 | OAM | 2H24~ | 5+10+5 HDI (20L) 18L PCB | M8+M4 | Doosan | Unimicron, VGT, others | Unimicron, VGT, others | Unimicron, VGT, others |
| UBB | 2H25~ | 5+10+5 HDI (20L) | M7+M4 | Doosan | WUS, ISU, TTM, others | WUS, ISU, TTM, others | WUS, ISU, TTM, others | |
| B300 | OAM UBB | 2H24~ | 22L PCB | M8+M4 M8+M4 | Doosan | Unimicron, VGT, others WUS, ISU, TTM, others | Doosan | Unimicron, VGT, others WUS, ISU, TTM, others |
| GB200 | Bianca board Switch tray | 5+12+5 HDI (22L) 6+12+6 HDI (24L) | M8 (HVLP3) +M4 M7 (HVLP2)+M2 | Doosan EMC | VGT (major), Unimicron, others WUS (major), VGT, Unimicron, | VGT (major), Unimicron, others WUS (major), VGT, Unimicron, | VGT (major), Unimicron, others WUS (major), VGT, Unimicron, | |
| (Bianca) | 2H24~ | 22L PCB | M8/8.5 (HVLP2) hybrid | EMC, SYTECH | VGT (major), Unimicron, others others | VGT (major), Unimicron, others others | VGT (major), Unimicron, others others | |
| GB300 (Bianca) | Bianca board Switch tray | 2Q25~ | 5+12+5 HDI (22L) 22L PCB | M8 (HVLP3) +M4 | Doosan EMC, SYTECH, | WUS (major), VGT, Unimicron, | WUS (major), VGT, Unimicron, | WUS (major), VGT, Unimicron, |
| VR200 (Bianca) | Bianca board Mid-plane boards in trays | 2Q25~ 2Q26~ | 6+14+6 HDI (26L) | M8/8.5 (HVLP2) hybrid M8 (HVLP4) +M4 M8.5 (k2, HVLP4) | Doosan Doosan | others VGT (major), Unimicron, others? | others VGT (major), Unimicron, others? | others VGT (major), Unimicron, others? |
| ? Rubin Ultra | (New) Switch tray Backplane? (New) 2027? Compute board 2027? 2027? | 2Q26~ 2Q26~ 26Lx3=78L?, ? ? | 44L PCB 32L PCB 104L? | M9K2 M9Q? PTFE+M8? | EMC, others? EMC, others? SYTECH? | VGT, WUS, Kinwong, Unimicron? WUS, VGT, others? | EMC, | WUS. Unimicron, |
| CoWoP board? Content OAM UBB | Time 2H24~4Q25 | HDI/mSAP? Structure HDI+3 | M8? M9Q? | EMC or new CCL Supplier(s) | ZDT, Unimicron? Others? | ZDT, Unimicron? Others? | ZDT, Unimicron? Others? | |
| AWS Generation | Switch board | TBD? | ||||||
| Trainium 2 | 26L PCB (2 ASICs per board, air cool) HDI+4 (22L) | CCL Material M6? (HVLP2, RTF) M8 (HVLP2) | PCB Supplier(s) | Panasonic | Shengyi | |||
| Trainium 2.5 & 3 | UBB Trn2.5: Trn3: | 1Q26~ 2Q26~ 26L PCB (2 or 4 ASICs | ASICs - - liquid-cooled) | M6?M7? (HVLP2, RTF) | materials? (starting | from June 2025) | from June 2025) | GCE, Shengyi, FHE Shengyi, ZDT |
| OAM Time TPU UBB 2H25~ 4Q25~ | 22L/26L HLC Structure 34L PCB 16-18L | PCB (16+18, N+M) Structure ? HDI | air-cooled, M8 (HVLP4) | EMC, TUC, others? EMC Supplier(s) EMC | GCE, Shengyi, FHE | CCL Panasonic, | GCE, Shengyi, FHE | |
| Google Generation TPU 7x | PDS switch (New) More other boards? | 2Q26~ | 46-48L HDI+HLC PCB, | M8+M4 M8.5? M9Q? | EMC? | WUS, Shengyi, ZDT, GCE? | Panasonic? | WUS, Shengyi, ZDT, GCE? |
| Content | Time 2H26~ | wide | CCL Material M7, HVLP2 | PCB Supplier(s) | PCB Supplier(s) | PCB Supplier(s) | ||
| CPU board (New) - x86 CPU TPU UBB CPU board (New) - Axion 8i all-to-all switch (New) | mid-26~ 2Q26~ mid-26~ | 36~40L+ PCB 22L PCB 22L PCB | M8+M6, HVLP3 M6 M8? | Panasonic Panasonic, EMC EMC, Panasonic | WUS, ISU, TTM, VGT WUS, TTM, GCE? | WUS, ISU, TTM, VGT WUS, TTM, GCE? | WUS, ISU, TTM, VGT WUS, TTM, GCE? | |
| TPU 8t, 8i | TPU UBB? | 2028? | 24~26L? HDI? | M6 | EMC | WUS, ISU, TTM, LCS, VGT? VGT, WUS, ISU, TTM, GCE, VGT, ZDT, others? | WUS, ISU, TTM, LCS, VGT? VGT, WUS, ISU, TTM, GCE, VGT, ZDT, others? | WUS, ISU, TTM, LCS, VGT? VGT, WUS, ISU, TTM, GCE, VGT, ZDT, others? |
| TPU next? | Content OAM, UBB | Time | Structure 36L+? 40L+? | CCL Material M8+M4 M8+M4 | EMC EMC | WUS, ISU, Unimicron, others? | WUS, ISU, Unimicron, others? | PCB Supplier(s) |
| Meta | 2Q26? | CCL Material | CCL Supplier(s) | others? | others? | others? | ||
| Generation Athena | Content OAM, UBB | CCL Supplier(s) | PCB Supplier(s) | PCB Supplier(s) | PCB Supplier(s) | |||
| Iris | M8? | EMC? | ||||||
| AMD | OAM, UBB | WUS, ISU, TTM WUS, ISU, TTM | WUS, ISU, TTM WUS, ISU, TTM | WUS, ISU, TTM WUS, ISU, TTM | ||||
| 2H26~ | ||||||||
| Generation | ||||||||
| MI450 | ||||||||
| UBB | size | Unimicron, others? | Unimicron, others? | Unimicron, others? | ||||
| 2H26~ | M8 hybrid | EMC, Doosan | SCC, Others? | SCC, Others? | SCC, Others? |
Source: Company data, Nomura estimates
Fig. 141: CCL capacity expansion: EMC vs TUC
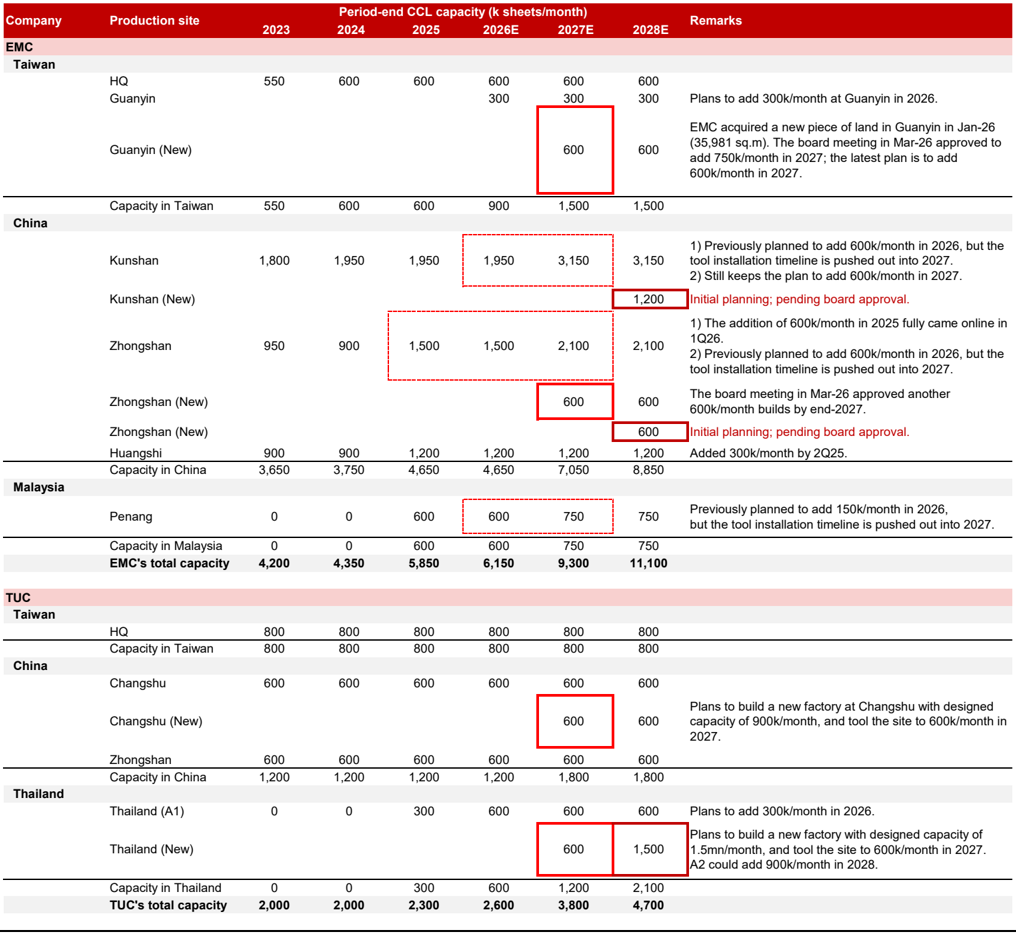
| Company | Production site | 2023 | 2024 Period-end | 2025 CCL capacity | 2026E (k sheets/month) | 2027E | 2028E | Remarks |
|---|---|---|---|---|---|---|---|---|
| EMC | ||||||||
| Taiwan | HQ | 550 | 600 | 600 | 600 | 600 | 600 | |
| Guanyin | 300 | 300 | 300 | Plans to add 300k/month at Guanyin in 2026. | ||||
| Guanyin (New) | 600 | 600 | EMC acquired a new piece of land in Guanyin in Jan-26 (35,981 sq.m). The board meeting in Mar-26 approved to add 750k/month in 2027; the latest plan is to add 600k/month in 2027. | |||||
| Capacity in Taiwan | 550 | 600 | 600 | 900 | 1,500 | 1,500 | ||
| China | ||||||||
| Kunshan | 1,800 | 1,950 | 1,950 | 1,950 | 3,150 | 3,150 | 1) Previously planned to add 600k/month in 2026, but the tool installation timeline is pushed out into 2027. 2) Still keeps the plan to add 600k/month in 2027. | |
| Kunshan (New) | 1,200 | Initial planning; pending board approval. | ||||||
| Zhongshan | 950 | 900 | 1,500 | 1,500 | 2,100 | 2,100 | 1Q26. 2) Previously planned to add 600k/month in 2026, but the tool installation timeline is pushed out into 2027. | |
| Zhongshan (New) | 600 | 600 | The board meeting in Mar-26 approved another 600k/month builds by end-2027. | |||||
| Zhongshan (New) | 600 | Initial planning; pending board approval. | ||||||
| Huangshi | 900 | 900 | 1,200 | 1,200 | 1,200 | 1,200 | Added 300k/month by 2Q25. | |
| Capacity in China | 3,650 | 3,750 | 4,650 | 4,650 | 7,050 | 8,850 | ||
| Malaysia | ||||||||
| Penang | 0 | 0 | 600 | 600 | 750 | 750 | Previously planned to add 150k/month in 2026, but the tool installation timeline is pushed out into 2027. | |
| Capacity in Malaysia | 0 | 0 | 600 | 600 | 750 | 750 | ||
| EMC's total capacity | 4,200 | 4,350 | 5,850 | 6,150 | 9,300 | 11,100 | ||
| TUC | ||||||||
| Taiwan | HQ | 800 | 800 | 800 | 800 | 800 | 800 | |
| Capacity in Taiwan | 800 | 800 | 800 | 800 | 800 | 800 | ||
| China | Changshu | 600 | 600 | 600 | 600 | 600 | 600 | |
| Changshu (New) | 600 | 600 | Plans to build a new factory at Changshu with designed capacity of 900k/month, and tool the site to 600k/month in 2027. | |||||
| Zhongshan | 600 | 600 | 600 | 600 | 600 | 600 | ||
| Capacity in China | 1,200 | 1,200 | 1,200 | 1,200 | 1,800 | 1,800 | ||
| Thailand | Thailand (New) | 600 | 1,500 | Plans to add 300k/month in 2026. Plans to build a new factory with designed capacity of 1.5mn/month, and tool the site to 600k/month in 2027. | ||||
| Thailand (A1) | 0 | 0 | 300 | 600 | 600 | 600 | ||
| Capacity in Thailand | 0 | 0 | 300 | 600 | 1,200 | 2,100 | ||
| TUC's total capacity | 2,000 | 2,000 | 2,300 | 2,600 | 3,800 | 4,700 |
Source: Company data, Nomura estimates
Fig. 142: EMC: Earnings estimate revisions
| New forecasts | New forecasts | New forecasts | Previous forecasts | Previous forecasts | Previous forecasts | Change (%) | Change (%) | Change (%) | |
|---|---|---|---|---|---|---|---|---|---|
| TWD mn | 2026F | 2027F | 2028F | 2026F | 2027F | 2028F | 2026F | 2027F | 2028F |
| Revenue | 197,788 | 312,625 | 418,200 | 176,103 | 270,604 | 366,987 | 12.3 | 15.5 | 14.0 |
| Gross profit | 66,163 | 113,438 | 152,406 | 58,069 | 95,329 | 130,674 | 13.9 | 19.0 | 16.6 |
| Operating profit | 54,696 | 100,087 | 136,919 | 46,633 | 82,022 | 115,221 | 17.3 | 22.0 | 18.8 |
| Pretax profit | 53,616 | 100,026 | 136,857 | 45,553 | 81,962 | 115,161 | 17.7 | 22.0 | 18.8 |
| Net profit | 41,087 | 77,024 | 105,384 | 34,879 | 63,114 | 88,678 | 17.8 | 22.0 | 18.8 |
| EPS (TWD) | 114.7 | 215.0 | 294.1 | 97.3 | 176.1 | 247.5 | 17.8 | 22.0 | 18.8 |
| Margins (%) | |||||||||
| Gross margin | 33.5 | 36.3 | 36.4 | 33.0 | 35.2 | 35.6 | 0.5 | 1.1 | 0.8 |
| Operating margin | 27.7 | 32.0 | 32.7 | 26.5 | 30.3 | 31.4 | 1.2 | 1.7 | 1.3 |
| Pretax margin | 27.1 | 32.0 | 32.7 | 25.9 | 30.3 | 31.4 | 1.2 | 1.7 | 1.3 |
| Net margin | 20.8 | 24.6 | 25.2 | 19.8 | 23.3 | 24.2 | 1.0 | 1.3 | 1.0 |
Source: Nomura estimates
(TWD)
6,000
5,000
4,000
3,000
2,000
1,000
0
40x 30x
Fig. 143: EMC: Quarterly financial report
(TWD)
6,000
5,000
| (TWD mn) | 1Q25 | 2Q25 | 3Q25 | 4Q25 | 2025 | 1Q26 | 2Q26F | 3Q26F | 4Q26F | 2026F | 1Q27F | 2Q27F | 3Q27F | 4Q27F | 2027F | 2028F |
|---|---|---|---|---|---|---|---|---|---|---|---|---|---|---|---|---|
| Net revenue | 21,680 | 22,508 | 25,146 | 24,927 | 94,261 | 33,067 | 45,143 | 55,394 | 64,184 | 197,788 | 67,056 | 74,981 | 83,471 | 87,117 | 312,625 | 418,200 |
| COGS | 15,090 | 15,678 | 17,570 | 17,803 | 66,141 | 23,338 | 30,500 | 36,411 | 41,375 | 131,625 | 43,019 | 47,714 | 53,043 | 55,411 | 199,186 | 265,794 |
| Gross profit | 6,590 | 6,829 | 7,576 | 7,125 | 28,120 | 9,729 | 14,642 | 18,983 | 22,809 | 66,163 | 24,037 | 27,267 | 30,428 | 31,706 | 113,438 | 152,406 |
| Op expenses | 2,051 | 2,186 | 2,586 | 2,190 | 9,012 | 2,601 | 2,826 | 3,010 | 3,031 | 11,468 | 3,086 | 3,269 | 3,485 | 3,511 | 13,351 | 15,487 |
| Op profit | 4,540 | 4,644 | 4,990 | 4,935 | 19,108 | 7,128 | 11,817 | 15,972 | 19,779 | 54,696 | 20,952 | 23,998 | 26,942 | 28,195 | 100,087 | 136,919 |
| Non-op income | 128 | (177) | 131 | (314) | (232) | 66 | (565) | (565) | (15) | (1,080) | (15) | (15) | (15) | (15) | (61) | (61) |
| Pretax profit | 4,667 | 4,467 | 5,121 | 4,620 | 18,876 | 7,194 | 11,251 | 15,407 | 19,763 | 53,616 | 20,936 | 23,983 | 26,927 | 28,180 | 100,026 | 136,857 |
| Net profit | 3,469 | 3,478 | 3,965 | 3,737 | 14,649 | 5,340 | 8,665 | 11,864 | 15,219 | 41,087 | 16,122 | 18,468 | 20,735 | 21,700 | 77,024 | 105,384 |
| EPS (TWD) | 10.01 | 10.02 | 11.19 | 10.63 | 41.67 | 14.90 | 24.18 | 33.11 | 42.47 | 114.67 | 44.99 | 51.54 | 57.87 | 60.56 | 214.96 | 294.11 |
| Operating ratios (%) | ||||||||||||||||
| Gross margin | 30.4% | 30.3% | 30.1% | 28.6% | 29.8% | 29.4% | 32.4% | 34.3% | 35.5% | 33.5% | 35.8% | 36.4% | 36.5% | 36.4% | 36.3% | 36.4% |
| Operating margin | 20.9% | 20.6% | 19.8% | 19.8% | 20.3% | 21.6% | 26.2% | 28.8% | 30.8% | 27.7% | 31.2% | 32.0% | 32.3% | 32.4% | 32.0% | 32.7% |
| Pretax profit margin | 21.5% | 19.8% | 20.4% | 18.5% | 20.0% | 21.8% | 24.9% | 27.8% | 30.8% | 27.1% | 31.2% | 32.0% | 32.3% | 32.3% | 32.0% | 32.7% |
| Net profit margin | 16.0% | 15.5% | 15.8% | 15.0% | 15.5% | 16.1% | 19.2% | 21.4% | 23.7% | 20.8% | 24.0% | 24.6% | 24.8% | 24.9% | 24.6% | 25.2% |
| Year-to-year (%) | ||||||||||||||||
| Net revenue | 68% | 46% | 44% | 34% | 46% | 53% | 101% | 120% | 157% | 110% | 103% | 66% | 51% | 36% | 58% | 34% |
| Gross profit | 76% | 61% | 61% | 35% | 56% | 48% | 114% | 151% | 220% | 135% | 147% | 86% | 60% | 39% | 71% | 34% |
| Operating profit | 79% | 59% | 58% | 40% | 57% | 57% | 154% | 220% | 301% | 186% | 194% | 103% | 69% | 43% | 83% | 37% |
| Pre-tax profit | 79% | 50% | 61% | 37% | 56% | 54% | 152% | 201% | 328% | 184% | 191% | 113% | 75% | 43% | 87% | 37% |
| Net profit | 75% | 43% | 58% | 41% | 53% | 54% | 149% | 199% | 307% | 180% | 202% | 113% | 75% | 43% | 87% | 37% |
| Qtr-to-Qtr (%) | ||||||||||||||||
| Net revenue | 17% | 4% | 12% | -1% | 33% | 37% | 23% | 16% | 4% | 12% | 11% | 4% | ||||
| Gross profit | 25% | 4% | 11% | -6% | 37% | 51% | 30% | 20% | 5% | 13% | 12% | 4% | ||||
| Operating profit | 29% | 2% | 7% | -1% | 44% | 66% | 35% | 24% | 6% | 15% | 12% | 5% | ||||
| Pre-tax profit | 38% | -4% | 15% | -10% | 56% | 56% | 37% | 28% | 6% | 15% | 12% | 5% | ||||
| Net profit | 31% | 0% | 14% | -6% | 43% | 62% | 37% | 28% | 6% | 15% | 12% | 5% |
Source: Company data, Nomura estimates
Fig. 144: EMC: forward P/E band
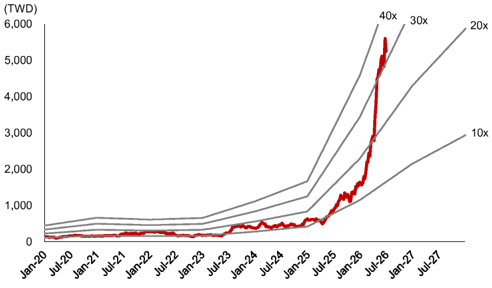
Source: TEJ, Nomura estimates
, 20x
Fig. 145: EMC: forward P/B band
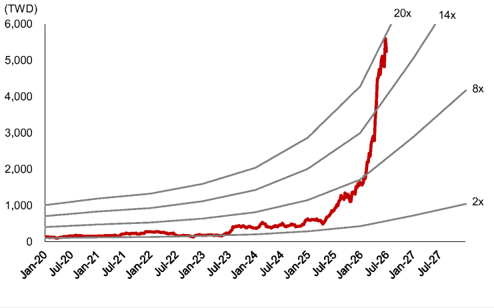
Source: TEJ, Nomura estimates
20x
Relative performance chart
EQUITY: TECHNOLOGY
Price
(TWD)
1750-
15001
1250-
10001
7501
5001
2501
-
350
-
300
-
250
-200
-150
TUC 6274.TWO 6274 TT
EQUITY: TECHNOLOGY
May
Churra. I CEC Namura
Riding on price hike benefits
AI-driven demand strength and pricing uplift continue to flow through; maintain Buy and raise TP
Action: Maintain Buy and raise TP to TWD2,115, implying ~34% upside
We raise 2026F/27F/28F EPS for TUC by 20%/24%/23% to factor in continued AI/server strength (ASIC, networking, and power supply), improved operating scale, and more importantly, price hikes. TUC's strong QTD revenue is a reflection of a smoother-thanexpected input cost pass-on and more favorable pricing schemes, in our view, and we expect 43% q-q growth in 2Q26F revenue and another 19% q-q in 3Q26F, mainly supported by price hikes and a richer production mix crowding out lower-tier materials. In our view, the AI ASIC project will continue to ramp up from 2Q26F, and would account for 5-6% of TUC's 2026F revenue. Although our observations in the upstream supply chain suggest an AI ASIC customer of TUC might undergo rather lukewarm chip unit growth into 2027F because of resource constraints (report), we believe TUC could still grow 2027F topline, leveraging the increased demand from 400G/800G networking switches and thick-copper power boards, given its healthy market share in those areas - we tentatively assume another c.40% unit growth for 400G+800G in 2027F after c.50% in 2026F. In addition, the AI PCB/CCL industry supply is already tight and a further worsening supply/demand imbalance into 2H26F could drive another round of price actions by CCL makers. Given TUC's smaller operating scale than other AI CCL makers, we think the company's earnings growth is very elastic to pricing tailwinds. We reiterate our Buy rating and raise TP to TWD2,115 (from TWD1,710), based on 30x (unchanged) 2027F EPS of TWD70.5. The target multiple is at the high end of TUC's historical band 10-33x, as we believe the worsening CCL industry shortage should support a broad-based sector rerating, notably for qualified players, such as TUC, with exposure to AI. TUC currently trades at 24x 2027F EPS.
Capacity expansion manifests TUC's conviction in demand
TUC is building new factories in both Changshu and Thailand, for 600k sheets/month addition each. The factories, scheduled to come onstream in 2H27E, have a total capex budget of c.TWD11bn. We also note that TUC has the optionality to launch an extra 900k sheets/month in Thailand in 2028 - if all comes through, we estimate TUC could broadly double its installed capacity over 2025-28F. Compared to its reserved plan prior to 2025 and considering TUC's scale, we think the company's decision to build greenfield capacity underpins the conviction in AI.
| Year-end 31 Dec Currency (TWD) | FY25 Actual | Old | FY26F New | Old | FY27F New | Old | FY28F New |
|---|---|---|---|---|---|---|---|
| Revenue (mn) | 30,340 | 52,904 | 60,589 | 84,885 | 101,441 | 130,373 | 157,382 |
| Reported net profit (mn) | 3,409 | 8,713 | 10,410 | 16,482 | 20,350 | 27,516 | 33,819 |
| Normalised net profit (mn) | 3,409 | 8,713 | 10,410 | 16,482 | 20,350 | 27,516 | 33,819 |
| FD normalised EPS | 11.57 | 29.19 | 34.43 | 55.22 | 67.30 | 92.18 | 111.84 |
| FD norm. EPS growth (%) | 22.0 | 152.2 | 197.5 | 89.2 | 95.5 | 66.9 | 66.2 |
| FD normalised P/E (x) | 136.5 | - | 45.9 | - | 23.5 | - | 14.1 |
| EV/EBITDA (x) | 95.7 | - | 32.2 | - | 16.7 | - | 10.1 |
| Price/book (x) | 24.5 | - | 16.8 | - | 11.0 | - | 7.3 |
| Dividend yield (%) | 0.5 | - | 1.4 | - | 2.7 | - | 4.4 |
| ROE (%) | 20.7 | 39.5 | 45.4 | 52.9 | 59.4 | 60.4 | 64.9 |
| Net debt/equity (%) | 17.6 | 29.2 | 37.5 | 35.0 | 41.0 | 22.0 | 23.9 |
Source: Company data, Nomura estimates
Global Markets Research 30 June 2026
| Rating Remains | Buy |
|---|---|
| Target price Increased from TWD 1,710.00 | TWD 2,115.00 |
| Closing price 26 June 2026 | TWD 1,580.00 |
| Implied upside | +33.9% |
| Market Cap (USD mn) | 14,307.9 |
| ADT (USD mn) | 261.2 |
Relative performance chart
Source: LSEG, Nomura
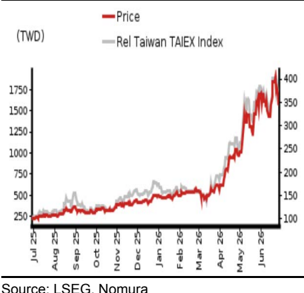
Research Analysts
Taiwan Technology
Eric Chen, CFA - NITB eric.chen@nomura.com +886(2) 21769965
Anne Lee, CFA - NITB
anne.lee@nomura.com +886(2) 21769966
Carol Hu - NITB
carol.r.hu@nomura.com +886(2) 21769963
Key data on TUC
Performance
| (%) | 1M | 3M | 12M | ||
|---|---|---|---|---|---|
| Absolute (TWD) | 0 | 160.7 | 610.1 | M cap (USDmn) | 14,307.9 |
| Absolute (USD) | -1.3 | 161 | 546.2 | Free float (%) | 86.7 |
| Rel to Taiwan TAIEX Index | -2.4 | 127 | 511.9 | 3-mth ADT (USDmn) | 261.2 |
Income statement (TWDmn)
| Year-end 31 Dec | FY24 | FY25 | FY26F | FY27F | FY28F |
|---|---|---|---|---|---|
| Revenue | 23,070 | 30,340 | 60,589 | 101,441 | 157,382 |
| Cost of goods sold | -17,729 | -23,442 | -43,807 | -70,771 | -108,171 |
| Gross profit | 5,342 | 6,898 | 16,781 | 30,670 | 49,212 |
| SG&A | -2,010 | -2,554 | -2,974 | -3,480 | -4,076 |
| Employee share expense | 0 | 0 | 0 | 0 | 0 |
| Operating profit | 3,332 | 4,344 | 13,808 | 27,190 | 45,135 |
| EBITDA | 3,784 | 4,803 | 14,473 | 28,347 | 46,652 |
| Depreciation | -452 | -459 | -666 | -1,157 | -1,517 |
| Amortisation | 0 | 0 | 0 | 0 | 0 |
| EBIT | 3,332 | 4,344 | 13,808 | 27,190 | 45,135 |
| Net interest expense | 91 | 42 | -103 | -237 | -342 |
| Associates & JCEs | 0 | 0 | 0 | 0 | 0 |
| Other income | -45 | 133 | 53 | 0 | 0 |
| Earnings before tax | 3,378 | 4,519 | 13,757 | 26,953 | 44,793 |
| Income tax | -773 | -1,109 | -3,347 | -6,604 | -10,974 |
| Net profit after tax | 2,604 | 3,409 | 10,410 | 20,350 | 33,819 |
| Minority interests | 0 | 0 | 0 | 0 | 0 |
| Other items | 0 | 0 | 0 | 0 | 0 |
| Preferred dividends | 0 | 0 | 0 | 0 | 0 |
| Normalised NPAT | 2,604 | 3,409 | 10,410 | 20,350 | 33,819 |
| Extraordinary items | 0 | 0 | 0 | 0 | 0 |
| Reported NPAT | 2,604 | 3,409 | 10,410 | 20,350 | 33,819 |
| Dividends | -1,797 | -2,168 | -6,246 | -12,210 | -20,291 |
| Transfer to reserves | 807 | 1,241 | 4,164 | 8,140 | 13,527 |
| Valuations and ratios | |||||
| Reported P/E (x) | 165.2 | 130.2 | 43.8 | 22.4 | 13.5 |
| Normalised P/E (x) | 165.2 | 130.2 | 43.8 | 22.4 | 13.5 |
| FD normalised P/E (x) | 166.6 | 136.5 | 45.9 | 23.5 | 14.1 |
| Dividend yield (%) | 0.4 | 0.5 | 1.4 | 2.7 | 4.4 |
| Price/cashflow (x) | 640.3 | 781.2 | - | 78.2 | 30.5 |
| Price/book (x) | 30.4 | 24.5 | 16.8 | 11.0 | 7.3 |
| EV/EBITDA (x) | 120.1 | 95.7 | 32.2 | 16.7 | 10.1 |
| EV/EBIT (x) | 136.4 | 105.8 | 33.8 | 17.4 | 10.4 |
| Gross margin (%) | 23.2 | 22.7 | 27.7 | 30.2 | 31.3 |
| EBITDA margin (%) | 16.4 | 15.8 | 23.9 | 27.9 | 29.6 |
| EBIT margin (%) | 14.4 | 14.3 | 22.8 | 26.8 | 28.7 |
| Net margin (%) | 11.3 | 11.2 | 17.2 | 20.1 | 21.5 |
| Effective tax rate (%) | 22.9 | 24.6 | 24.3 | 24.5 | 24.5 |
| Dividend payout (%) | 69.0 | 63.6 | 60.0 | 60.0 | 60.0 |
| ROE (%) | 20.1 | 20.7 | 45.4 | 59.4 | 64.9 |
| ROA (pretax %) | 19.6 | 16.0 | 28.9 | 35.1 | 40.5 |
| Growth (%) | |||||
| Revenue | 44.2 | 31.5 | 99.7 | 67.4 | 55.1 |
| EBITDA | 100.8 | 26.9 | 201.4 | 95.9 | 64.6 |
| Normalised EPS | 213.6 | 26.9 | 197.1 | 95.5 | 66.2 |
| Normalised FDEPS | 213.7 | 22.0 | 197.5 | 95.5 | 66.2 |
Source: Company data, Nomura estimates
Cashflow statement (TWDmn)
| Year-end 31 Dec | FY24 | FY25 | FY26F | FY27F | FY28F |
|---|---|---|---|---|---|
| EBITDA Change in | 3,784 | 4,803 | 14,473 | 28,347 | 46,652 |
| working capital | -2,426 | -2,953 | -12,703 | -15,398 | -19,682 |
| Other operating cashflow Cashflow from operations | -681 677 | -1,254 | -3,293 | -6,841 6,108 | -11,316 15,654 |
| expenditure | 596 | -1,523 | -1,574 | ||
| Capital | -1,194 | -1,948 | -5,242 | -6,594 | |
| Free cashflow | -517 | -1,352 | -6,764 | -485 | 14,080 |
| Reduction in investments | -69 | -4,706 | 1,686 | 0 | 0 |
| Net acquisitions | 0 | 0 | 0 | 0 | 0 |
| Dec in other LT assets | 0 | 0 | 0 | 0 | 0 |
| Inc in other LT liabilities | 0 | 0 | 0 | 0 | 0 0 |
| Adjustments | 133 | 152 | 1 | 0 | |
| CF after investing acts | -453 | -5,906 | -5,077 | -485 | 14,080 |
| Cash dividends | -1,090 | -1,797 | -2,168 | -6,246 | -12,210 |
| Equity issue | 0 | 0 | 0 | 0 | 0 |
| Debt issue | 2,353 | 6,655 | 4,062 | 6,000 | 1,000 |
| Convertible debt issue | 0 | 0 | 0 | 0 | 0 |
| Others | 511 | -67 | 339 | 0 | 0 |
| financial acts | 1,775 | 2,233 | -246 | -11,210 | |
| CF from Net cashflow | 1,322 | 4,791 -1,115 | -2,844 | -731 | 2,870 |
| Beginning cash | 4,958 | 6,280 | 5,165 | 2,321 | 1,590 |
| Ending cash | 6,280 | 5,165 | 2,321 | 1,590 | 4,460 |
| Ending net debt | -1,869 | 3,280 | 10,205 | 16,936 | 15,066 |
| Balance sheet (TWDmn) | |||||
| As at 31 Dec | FY24 | FY25 | FY26F | FY27F | FY28F |
| Cash & equivalents | 6,280 | 5,165 | 2,321 | 1,590 | 4,460 |
| Marketable securities | 757 | 5,437 | 3,744 | 3,744 | 3,744 |
| Accounts receivable | 9,786 | 13,987 | 29,075 | 47,260 | 70,488 |
| Inventories | 3,189 | 7,405 | 15,776 | 25,077 | 36,912 |
| Other current assets | 252 | 357 | 345 | 345 | 345 |
| Total current assets | 20,264 | 32,351 | 51,261 | 78,015 | 115,948 |
| LT investments | 0 | 4 | 17 | 17 | 17 |
| Fixed assets | 4,339 | 5,565 | 9,771 | 15,208 | 15,264 |
| Goodwill | 0 | 0 | 0 | 0 | 0 |
| Other intangible assets | 0 | 0 | 0 | ||
| Other LT assets | 0 1,275 | 1,820 | 2,227 | 0 2,227 | 2,227 |
| Total assets | 25,878 | 39,741 | 63,275 | 95,466 | 133,456 |
| Short-term debt | 962 | 2,141 | 2,470 | 2,470 | 2,470 |
| Accounts payable | 5,499 | 10,320 | 20,503 | 32,591 | 47,972 |
| Other current liabilities | 1,412 | 2,160 | 2,720 | 2,720 | 2,720 |
| Total current liabilities | 14,621 | 25,693 | 37,780 | 53,162 | |
| Long-term debt | 7,873 3,449 | 6,304 | 10,057 | 16,057 | 17,057 |
| Convertible debt | 0 | 0 | 0 | 0 | 0 |
| Other LT liabilities | 219 | 203 | 314 | 314 | 314 |
| Total liabilities | 11,541 | 21,127 | 36,063 | 54,151 | 70,532 |
| Minority interest | 0 | 0 | 0 | 0 | 0 |
| Preferred stock | 0 | 0 | 0 | 0 | 0 |
| Common stock | 5,690 | 8,396 | 8,416 | 8,416 | 8,416 |
| Retained earnings | 8,467 | 10,070 | 18,312 | 32,416 | 54,025 |
| Proposed dividends | 0 | 0 | 0 | 0 | 0 |
| Other equity and reserves | 180 | 148 | 484 | 484 | 484 |
| Total shareholders' equity | 14,337 | 18,614 | 27,212 63,275 | 41,315 | 62,924 |
| Total equity & liabilities | 25,878 | 39,741 | 95,466 | 133,456 | |
| Liquidity (x) | |||||
| Current ratio | 2.57 | 2.21 | 2.00 | 2.06 | 2.18 |
| Interest cover | - | - | 133.6 | 114.7 | 131.9 |
| Leverage | net cash | 0.68 | 0.71 | 0.60 | 0.32 |
| Net debt/EBITDA (x) Net debt/equity (%) | net cash | 17.6 | 37.5 | 41.0 | 23.9 |
| Per share | |||||
| Reported EPS (TWD) | 9.56 | 12.13 | 36.05 | 70.47 | 117.11 |
| Norm EPS (TWD) | 9.56 | 12.13 | 36.05 | 70.47 | 117.11 |
| FD norm EPS (TWD) | 9.49 | 11.57 | 34.43 | 67.30 | 111.84 |
| BVPS (TWD) | 51.95 | 64.47 | 94.22 | 143.05 | 217.87 |
| DPS (TWD) | 6.51 | 7.51 | 21.63 | 42.28 | 70.26 |
| Activity | |||||
| (days) Days receivable | 154.8 | 143.0 | 129.7 | 137.3 | 136.9 |
| Days inventory | 65.7 | 82.5 | 96.6 | 105.3 | 104.9 |
| Days payable Cash cycle | 113.2 107.3 | 123.1 102.3 | 128.4 97.9 | 136.9 105.8 | 136.3 105.5 |
Source: Company data, Nomura estimates
Company profile
Taiwan Union Technology Corporation (TUC) manufactures copper clad laminate (CCL) products and provides mass lamination services to its PCB customers. The company also produces prepreg (PP) products.
Valuation Methodology
Our TP of TWD2,115.0 is based on 30x 2027F EPS of TWD70.5. Our target multiple of 30x is at the high end of its historical range of 10-33x since 2017 as we think the stock will be re-rated given substantial upgrades of CCL specs and surging AI demand. The benchmark of this stock is TAIEX.
Risks that may impede the achievement of the target price
Downside risks: 1) demand for 400G/800G switches and AI server for use in datacentres is weaker than expected; 2) slower-than-expected progress in AI server/ 800G switch, 3) weaker-than-expected automotive demand, 4) macro headwinds such as economy slowdown, raw material price hikes, unfavorable FX, etc.
ESG
TUC is committed to increasing the utilization efficiency of various resources, promoting water and power saving, as well as use of recycled and renewable paper, and recycling to decrease waste of resources. In order to safeguard social rights and interests, TUC establishes relevant management procedures and rules in accordance with related laws and regulations as well as international human rights conventions.
(TWD)
2,000
1,600
1,200
800
400
0
Jan-20
40x
30x
Fig. 146: TUC: earnings estimate revisions
20x
10x
(TWD)
2,000
1,600
1,200
| New forecasts | New forecasts | New forecasts | Previous forecasts | Previous forecasts | Previous forecasts | Change (%) | Change (%) | Change (%) | |
|---|---|---|---|---|---|---|---|---|---|
| (TWD mn) | 2026F | 2027F | 2028F | 2026F | 2027F | 2028F | 2026F | 2027F | 2028F |
| Revenue | 60,589 | 101,441 | 157,382 | 52,904 | 84,885 | 130,373 | 14.5 | 19.5 | 20.7 |
| Gross profit | 16,781 | 30,670 | 49,212 | 14,559 | 25,504 | 40,804 | 15.3 | 20.3 | 20.6 |
| Operating profit | 13,808 | 27,190 | 45,135 | 11,586 | 22,024 | 36,728 | 19.2 | 23.5 | 22.9 |
| Pretax profit | 13,757 | 26,953 | 44,793 | 11,553 | 21,830 | 36,444 | 19.1 | 23.5 | 22.9 |
| Net profit | 10,410 | 20,350 | 33,819 | 8,713 | 16,482 | 27,516 | 19.5 | 23.5 | 22.9 |
| EPS (TWD) | 36.05 | 70.47 | 117.11 | 30.15 | 57.03 | 95.21 | 19.6 | 23.6 | 23.0 |
| Margins (%) | |||||||||
| Gross margin | 27.7 | 30.2 | 31.3 | 27.5 | 30.0 | 31.3 | 0.2 | 0.2 | (0.0) |
| Operating margin | 22.8 | 26.8 | 28.7 | 21.9 | 25.9 | 28.2 | 0.9 | 0.9 | 0.5 |
| Pretax margin | 22.7 | 26.6 | 28.5 | 21.8 | 25.7 | 28.0 | 0.9 | 0.9 | 0.5 |
| Net margin | 17.2 | 20.1 | 21.5 | 16.5 | 19.4 | 21.1 | 0.7 | 0.6 | 0.4 |
Source: Nomura estimates
Fig. 147: TUC: quarterly financial forecasts
| (TWD mn) | 1Q25 | 2Q25 | 3Q25 | 4Q25 | 2025 | 1Q26 | 2Q26F | 3Q26F | 4Q26F | 2026F | 1Q27F | 2Q27F | 3Q27F | 4Q27F | 2027F | 2028F |
|---|---|---|---|---|---|---|---|---|---|---|---|---|---|---|---|---|
| Revenue | 6,372 | 6,780 | 8,063 | 9,125 | 30,340 | 10,054 | 14,397 | 17,187 | 18,951 | 60,589 | 20,299 | 23,480 | 26,859 | 30,803 | 101,441 | 157,382 |
| COGS | 4,839 | 5,345 | 6,148 | 7,110 | 23,442 | 7,525 | 10,511 | 12,317 | 13,454 | 43,807 | 14,278 | 16,403 | 18,703 | 21,386 | 70,771 | 108,171 |
| Gross profit | 1,533 | 1,435 | 1,915 | 2,015 | 6,898 | 2,529 | 3,886 | 4,870 | 5,497 | 16,781 | 6,021 | 7,077 | 8,155 | 9,417 | 30,670 | 49,212 |
| Op expenses | (598) | (583) | (649) | (725) | (2,554) | (701) | (729) | (761) | (783) | (2,974) | (815) | (842) | (898) | (925) | (3,480) | (4,076) |
| Operating profit | 935 | 853 | 1,266 | 1,290 | 4,344 | 1,828 | 3,157 | 4,110 | 4,713 | 13,808 | 5,206 | 6,235 | 7,257 | 8,492 | 27,190 | 45,135 |
| Non-op income | (1) | (13) | 52 | 136 | 175 | 46 | (15) | (37) | (44) | (51) | (45) | (41) | (73) | (78) | (237) | (342) |
| Pretax profit | 935 | 840 | 1,318 | 1,427 | 4,519 | 1,874 | 3,142 | 4,072 | 4,669 | 13,757 | 5,161 | 6,194 | 7,184 | 8,414 | 26,953 | 44,793 |
| Net profit | 672 | 652 | 1,003 | 1,083 | 3,409 | 1,260 | 2,419 | 3,136 | 3,595 | 10,410 | 3,897 | 4,676 | 5,424 | 6,353 | 20,350 | 33,819 |
| Basic EPS (TWD) | 2.43 | 2.36 | 3.58 | 3.85 | 12.13 | 4.36 | 8.38 | 10.86 | 12.45 | 36.05 | 13.49 | 16.19 | 18.78 | 22.00 | 70.47 | 117.11 |
| Operating ratios | ||||||||||||||||
| Gross margin | 24.1% | 21.2% | 23.7% | 22.1% | 22.7% | 25.1% | 27.0% | 28.3% | 29.0% | 27.7% | 29.7% | 30.1% | 30.4% | 30.6% | 30.2% | 31.3% |
| Opex ratio | -9.4% | -8.6% | -8.1% | -7.9% | -8.4% | -7.0% | -5.1% | -4.4% | -4.1% | -4.9% | -4.0% | -3.6% | -3.3% | -3.0% | -3.4% | -2.6% |
| Operating margin | 14.7% | 12.6% | 15.7% | 14.1% | 14.3% | 18.2% | 21.9% | 23.9% | 24.9% | 22.8% | 25.6% | 26.6% | 27.0% | 27.6% | 26.8% | 28.7% |
| Pretax margin | 14.7% | 12.4% | 16.3% | 15.6% | 14.9% | 18.6% | 21.8% | 23.7% | 24.6% | 22.7% | 25.4% | 26.4% | 26.7% | 27.3% | 26.6% | 28.5% |
| Net margin | 10.5% | 9.6% | 12.4% | 11.9% | 11.2% | 12.5% | 16.8% | 18.2% | 19.0% | 17.2% | 19.2% | 19.9% | 20.2% | 20.6% | 20.1% | 21.5% |
| Year-to-year | ||||||||||||||||
| Revenue | 43.7% | 18.9% | 21.8% | 44.6% | 31.5% | 57.8% | 112.3% | 113.2% | 107.7% | 99.7% | 101.9% | 63.1% | 56.3% | 62.5% | 67.4% | 55.1% |
| Gross profit | 51.5% | 5.3% | 27.4% | 37.7% | 29.1% | 64.9% | 170.7% | 154.3% | 172.8% | 143.3% | 138.1% | 82.1% | 67.5% | 71.3% | 82.8% | 60.5% |
| Operating profit | 65.7% | -1.6% | 30.6% | 38.4% | 30.4% | 95.4% | 270.3% | 224.7% | 265.3% | 217.9% | 184.9% | 97.5% | 76.6% | 80.2% | 96.9% | 66.0% |
| Pretax profit | 56.4% | -4.4% | 37.0% | 51.7% | 33.8% | 100.4% | 274.2% | 209.1% | 227.3% | 204.5% | 175.4% | 97.2% | 76.4% | 80.2% | 95.9% | 66.2% |
| Net profit | 48.7% | -6.0% | 33.0% | 53.6% | 30.9% | 87.5% | 271.2% | 212.8% | 232.0% | 205.4% | 209.3% | 93.3% | 73.0% | 76.7% | 95.5% | 66.2% |
| Qtr-to-Qtr | ||||||||||||||||
| Revenue | 1.0% | 6.4% | 18.9% | 13.2% | 10.2% | 43.2% | 19.4% | 10.3% | 7.1% | 15.7% | 14.4% | 14.7% | ||||
| Gross profit | 4.7% | -6.4% | 33.4% | 5.2% | 25.5% | 53.7% | 25.3% | 12.9% | 9.5% | 17.5% | 15.2% | 15.5% | ||||
| Operating profit | 0.4% | -8.9% | 48.4% | 1.9% | 41.7% | 72.8% | 30.2% | 14.7% | 10.5% | 19.8% | 16.4% | 17.0% | ||||
| Pretax profit | -0.6% | -10.2% | 56.9% | 8.3% | 31.4% | 67.7% | 29.6% | 14.7% | 10.5% | 20.0% | 16.0% | 17.1% | ||||
| Net profit | -4.7% | -3.0% | 53.8% | 8.0% | 16.4% | 92.0% | 29.6% | 14.7% | 8.4% | 20.0% | 16.0% | 17.1% |
Source: Company data, Nomura estimates
Fig. 148: TUC: forward P/E band
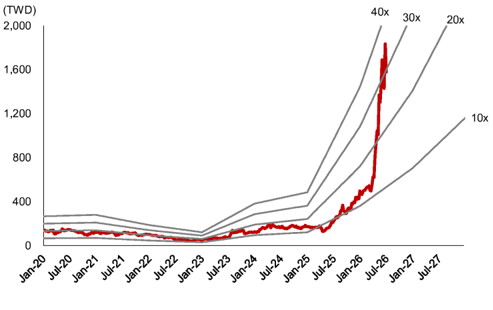
Source: TEJ, Nomura estimates
Fig. 149: TUC: forward P/B band
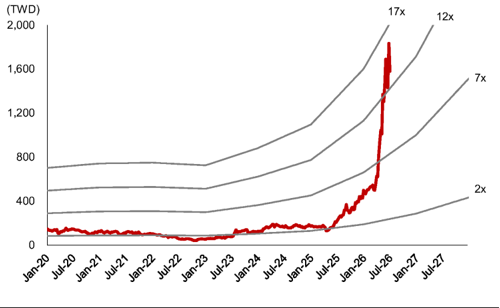
Source: TEJ, Nomura estimates
17x
12x
7x
Relative performance chart
EQUITY: TECHNOLOGY
Price
(TWD)
600-
500
4001
3001
2001
100
-
300|
-
250
-
200
-
150
Zhen Ding Technology Holding 4958.TW 4958 TT
EQUITY: TECHNOLOGY
Courna: | CEC Namiira
Stronger growth from AI PCB and substrates
Tighter supply of AI substrates, optical modules, and AI PCB/HDI; maintain Buy
Action: Maintain Buy; TP raised to TWD720, implying ~24% upside
We raise 2026/27/28F earnings for Zhen Ding (ZDT) by 5.3%/10.2%/15.9% as we expect tight industry supply of AI substrates, PCB and HDI, and believe this should help boost ZDT's order outlook and profitability. The company targets to grow IC substrate sales by 70%+ in 2026E, and aims to double server/optical comm sales in 2026E/2027F. The targets appear achievable to us, as we observe severely tight supply in the industry. The company raised its capex guidance in May to TWD80bn+ for 2026E, from its previous estimate of TWD50bn+ in March, and plans to file an IPO of its substrate subsidiary, Leading ( 禮鼎), on the HKEX (link ). We raise our 2027/28F sales forecasts by 4-5% on stronger AI-related substrate and HDI/PCB demand, and lift our 2027/28F GM by 0.4/1.2pp to 24.5%/26.6% to reflect ZDT's enhanced bargaining power and strategic shift toward high-margin projects. We maintain Buy and raise our TP to TWD720, based on 28x 2028F EPS of TWD25.71 (previously TWD510 based on 23x 2028F EPS of TWD22.19). We raise our target P/E from 23x to 28x, to reflect the re-rating of PCB/CCL and substrate companies amid the current surge in AI demand. The stock currently trades at 30x 2027F P/E.
AI-related sales growing faster along with gross margin upside
ABF substrate: ZDT's penetration into MediaTek's (2454 TT, Buy) AI ASIC for Google (GOOGL US, Not rated) (see our March report ) and nVidia (NVDA US, Not rated) (see our May report ) are on track. We note that with a tight substrate industry, customers are signing more LTAs with substrate makers to cover demand beyond 2028F and even up to 2030F, and we believe these conditions will enable ZDT to strengthen both the visibility and profitability of its IC substrate business in the long run. AI PCB/HDI: we believe ZDT is working on Google, AWS (AMZN US, Not rated), and nVidia's AI server boards, with more contributions coming from 2H26F with new model launches. We note that ZDT has already started to produce VR200 Bianca HDI boards, and will increasingly ramp up Google's switch boards by late 3Q26F. We think the rising adoption of HDI in AI compute boards by 2028F will be a positive trend for ZDT to gain market share. For optical module boards, we believe it is not difficult for ZDT to achieve its earlier target of growing 10x in 2026E and 2x in 2027E. We believe ZDT enjoys good yield rates in mSAP given its long experience in iPhone mSAP production and investments in highly automated manufacturing lines. As such, we raise our GM assumptions for ZDT's substrate, mSAP, and HDI businesses. With all AI-related products having above-corporate average GMs, we forecast ZDT's GM to expand from 23.3% in 2026F to 24.5% in 2027F and 26.6% in 2028F.
| Year-end 31 Dec Currency (TWD) | FY25 Actual | Old | FY26F New | Old | FY27F New | Old | FY28F New |
|---|---|---|---|---|---|---|---|
| Revenue (mn) | 182,522 | 220,204 | 224,018 | 255,610 | 267,273 | 286,797 | 300,409 |
| Reported net profit (mn) | 6,791 | 14,012 | 14,751 | 18,699 | 20,603 | 23,754 | 27,530 |
| Normalised net profit (mn) | 6,791 | 14,012 | 14,751 | 18,699 | 20,603 | 23,754 | 27,530 |
| FD normalised EPS | 6.91 | 13.09 | 13.78 | 17.47 | 19.24 | 22.19 | 25.71 |
| FD norm. EPS growth (%) | -28.6 | 89.5 | 99.4 | 33.5 | 39.7 | 27.0 | 33.6 |
| FD normalised P/E (x) | 84.0 | - | 42.1 | - | 30.1 | - | 22.6 |
| EV/EBITDA (x) | 20.1 | - | 14.2 | - | 11.3 | - | 9.1 |
| Price/book (x) | 5.0 | - | 4.5 | - | 4.1 | - | 3.7 |
| Dividend yield (%) | 0.6 | - | 1.2 | - | 1.6 | - | 2.2 |
| ROE (%) | 5.8 | 10.7 | 11.3 | 13.1 | 14.3 | 15.2 | 17.2 |
| Net debt/equity (%) | net cash | 29.2 | 22.5 | 22.1 | 14.6 | 23.3 | 12.6 |
Source: Company data, Nomura estimates
May
Global Markets Research 30 June 2026
| Rating Remains | Buy |
|---|---|
| Target price Increased from TWD 510.00 | TWD 720.00 |
| Closing price 26 June 2026 | TWD 580.00 |
| Implied upside | +24.1% |
| Market Cap (USD mn) | 19,632.6 |
| ADT (USD mn) | 555.3 |
Relative performance chart
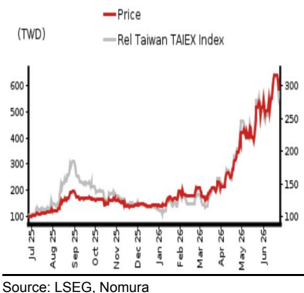
Research Analysts
Taiwan Technology/Hardware
Anne Lee, CFA - NITB anne.lee@nomura.com +886(2) 21769966
Eric Chen, CFA - NITB
eric.chen@nomura.com +886(2) 21769965
Carol Hu - NITB
carol.r.hu@nomura.com +886(2) 21769963
Key data on Zhen Ding Technology Holding
Cashflow statement (TWDmn)
| Year-end 31 Dec | FY24 | FY25 | FY26F | FY27F | FY28F |
|---|---|---|---|---|---|
| EBITDA | 29,334 | 32,484 | 49,582 | 65,928 | 81,831 |
| Change in working capital | 386 | -2,326 | -5,401 | -6,453 | -2,863 |
| Other operating cashflow | 664 | -2,542 | -9,365 | -13,189 | -17,999 60,969 |
| Cashflow from operations expenditure | 30,385 | 27,617 | 34,816 | 46,285 -80,000 | -50,000 |
| Capital | -16,009 | -32,673 -5,057 | -83,000 -48,184 | -33,715 | 10,969 |
| Free cashflow | 14,376 | ||||
| Reduction in investments | 4,151 | -559 | 0 | 0 | 0 |
| Net acquisitions | 0 | 0 | 0 | 0 | 0 |
| Dec in other LT assets | 0 | 0 | 0 | 0 | 0 |
| Inc in other LT liabilities | 0 | 0 | 0 | 0 | 0 |
| Adjustments | 3,711 | 1,273 | 0 | 0 | 0 |
| CF after investing acts | 22,238 | -4,343 | -48,184 | -33,715 | 10,969 |
| Cash dividends | -4,595 | -7,221 | -3,693 | -7,302 | -10,198 |
| Equity issue | 92 | 730 | 0 | 0 | 0 |
| Debt issue | -9,979 | -3,572 | 0 | 0 | 0 |
| Convertible debt | 0 | 0 | 0 | 0 | 0 |
| issue Others | 10,326 | 6,022 | 0 | 50,000 | 0 |
| CF from financial acts | -4,157 | -4,042 | -3,693 | 42,698 | -10,198 |
| Net cashflow | 18,081 | -8,386 | -51,877 | 8,984 | 771 |
| 28,222 | |||||
| Beginning cash | 61,421 | 79,502 | 71,116 | 19,239 | |
| Ending cash | 79,502 | 71,116 | 19,239 | 28,222 | 28,993 |
| Ending net debt | -23,784 | -20,848 | 31,030 | 22,046 | 21,275 |
| Balance sheet (TWDmn) | |||||
| As at 31 Dec | FY24 | FY25 | FY26F | FY27F | FY28F |
| Cash & equivalents | 79,502 | 71,116 | 19,239 36 | 28,222 36 | 28,993 |
| Marketable securities receivable | 328 | 36 | 38,083 | 45,436 | 36 |
| Accounts | 30,183 | 31,412 | 51,069 | ||
| Inventories | 17,990 | 19,616 | 20,619 | 24,219 | 24,268 5,460 |
| Other current assets | 4,506 | 5,460 | 5,460 | 5,460 | |
| Total current assets | 132,509 | 127,641 | 83,437 | 103,373 | 109,827 |
| LT investments | 5,080 | 7,515 | 7,518 | 7,518 | 7,518 |
| Fixed assets | 110,173 | 123,737 | 181,268 | 229,132 | 242,829 |
| Goodwill | 2,097 | 2,710 | 2,710 | 2,710 | 2,710 |
| Other intangible assets | 0 | 0 18,441 | 0 | 0 10,965 | 0 10,965 |
| Other LT assets | 16,135 | 10,965 | |||
| Total assets | 265,993 | 280,043 | 285,897 | 353,697 | 373,849 |
| Short-term debt | 21,706 | 23,839 | 23,839 | 23,839 | 23,839 |
| Accounts payable | 21,716 | 23,501 | 25,773 25,481 | 30,273 25,481 | 33,093 25,481 |
| Other current liabilities | 25,781 | 25,481 | |||
| Total current liabilities | 69,204 | 72,821 | 75,093 | 79,593 | 82,413 |
| Long-term debt | 34,012 | 26,430 | 26,430 | 26,430 0 | 26,430 |
| Convertible debt | 0 | 0 | 0 | 0 | |
| Other LT liabilities | 10,754 | 10,079 109,330 | 0 101,523 | 0 106,023 | 0 108,843 |
| Total liabilities | 113,970 | ||||
| Minority interest | 43,205 | 46,731 | 46,731 | 96,731 | 96,731 |
| Preferred stock Common stock | 9,567 | 10,706 115,879 | 10,706 126,937 | 10,706 140,238 | 10,706 157,569 |
| Retained earnings Proposed dividends | 100,094 | -2,603 | 0 | ||
| Other equity and reserves | -842 | 123,982 | 137,642 | 0 150,943 | 0 |
| Total shareholders' equity Total equity & liabilities | 108,818 | 285,897 | 168,275 | ||
| 265,993 | 280,043 | 353,697 | 373,849 | ||
| Liquidity (x) | |||||
| Current ratio | 1.91 | 1.75 | 1.11 | 1.30 | 1.33 |
| Interest cover | - | - | - | - | - |
| Leverage | net cash | net cash | 0.63 | 0.33 | 0.26 |
| Net debt/EBITDA (x) Net debt/equity (%) | net cash | net cash | 22.5 | 14.6 | 12.6 |
| Per share | |||||
| Reported EPS (TWD) | 9.67 | 6.91 | 13.78 | 19.24 | 25.71 |
| Norm EPS (TWD) | 9.67 | 6.91 | 13.78 | 19.24 | 25.71 |
| FD norm EPS (TWD) | 9.67 | 6.91 | 13.78 | 19.24 | 25.71 |
| BVPS (TWD) | 113.75 | 115.81 | 128.57 | 140.99 | 157.18 |
| DPS (TWD) | 7.55 | 3.45 | 6.82 | 9.53 | 12.73 |
| Activity (days) | |||||
| Days receivable | 63.2 | 61.6 | 56.6 | 57.0 | 58.8 |
| Days inventory | 43.9 | 46.9 | 42.7 | 40.5 | 40.2 |
| Days payable Cash cycle | 54.1 53.0 | 56.4 52.1 | 52.3 47.0 | 50.7 46.9 | 52.6 46.4 |
Source: Company data, Nomura estimates
Performance
| (%) | 1M | 3M | 12M | ||
|---|---|---|---|---|---|
| Absolute (TWD) | 7.4 | 165.4 | 487.6 | M cap (USDmn) | 19,632.6 |
| Absolute (USD) | 6 | 165.7 | 434.7 | Free float (%) | 69.1 |
| Rel to Taiwan TAIEX Index | 1.1 | 126.7 | 382 | 3-mth ADT (USDmn) | 555.3 |
Income statement (TWDmn)
| Year-end 31 Dec | FY24 | FY25 | FY26F | FY27F | FY28F |
|---|---|---|---|---|---|
| Revenue | 171,664 | 182,522 | 224,018 | 267,273 | 300,409 |
| Cost of goods sold | -139,203 | -146,385 | -171,822 | -201,821 | -220,621 |
| Gross profit | 32,461 | 36,136 | 52,196 | 65,451 | 79,787 |
| SG&A | -20,875 | -22,205 | -28,083 | -31,660 | -34,259 |
| Employee share expense | |||||
| Operating profit | 11,586 | 13,932 | 24,113 | 33,792 | 45,528 |
| EBITDA | 29,334 | 32,484 | 49,582 | 65,928 | 81,831 |
| Depreciation | -17,749 | -18,552 | -25,469 | -32,136 | -36,302 |
| Amortisation | |||||
| EBIT | 11,586 | 13,932 | 24,113 | 33,792 | 45,528 |
| Net interest expense | 565 | 337 | 256 | 256 | 256 |
| Associates & JCEs | 3 | -17 | 3 | 0 | 0 |
| Other income | 2,891 | -190 | 430 | 800 | 800 |
| Earnings before tax | 15,045 | 14,063 | 24,802 | 34,848 | 46,584 |
| Income tax | -1,948 | -3,458 | -4,161 | -5,924 | -7,919 |
| Net profit after tax | 13,096 | 10,605 | 20,641 | 28,924 | 38,665 |
| Minority interests | -3,917 | -3,815 | -5,890 | -8,321 | -11,135 |
| Other items | |||||
| Preferred dividends | |||||
| Normalised NPAT | 9,180 | 6,791 | 14,751 | 20,603 | 27,530 |
| Extraordinary items | 0 | 0 | 0 | 0 | 0 |
| Reported NPAT | 9,180 | 6,791 | 14,751 | 20,603 | 27,530 |
| Dividends | -7,221 | -3,693 | -7,302 | -10,198 | -13,627 |
| Transfer to reserves | 1,958 | 3,097 | 7,449 | 10,404 | 13,902 |
| Valuations and ratios | |||||
| Reported P/E (x) | 60.0 | 84.0 | 42.1 | 30.1 | 22.6 |
| Normalised P/E (x) | 60.0 | 84.0 | 42.1 | 30.1 | 22.6 |
| FD normalised P/E (x) | 60.0 | 84.0 | 42.1 | 30.1 | 22.6 |
| Dividend yield (%) | 1.3 | 0.6 | 1.2 | 1.6 | 2.2 |
| Price/cashflow (x) | 18.1 | 20.6 | 17.8 | 13.4 | 10.2 |
| Price/book (x) | 5.1 | 5.0 | 4.5 | 4.1 | 3.7 |
| EV/EBITDA (x) | 22.0 | 20.1 | 14.2 | 11.3 | 9.1 |
| EV/EBIT (x) | 55.7 | 46.9 | 29.2 | 22.0 | 16.3 |
| Gross margin (%) | 18.9 | 19.8 | 23.3 | 24.5 | 26.6 |
| EBITDA margin (%) | 17.1 | 17.8 | 22.1 | 24.7 | 27.2 |
| EBIT margin (%) | 6.7 | 7.6 | 10.8 | 12.6 | 15.2 |
| Net margin (%) | 5.3 | 3.7 | 6.6 | 7.7 | 9.2 |
| Effective tax rate (%) | 13.0 | 24.6 | 16.8 | 17.0 | 17.0 |
| Dividend payout (%) | 78.7 | 54.4 | 49.5 | 49.5 | 49.5 |
| ROE (%) | 9.0 | 5.8 | 11.3 | 14.3 | 17.2 |
| ROA (pretax %) | 6.3 | 7.0 | 10.1 | 11.4 | 13.6 |
| Growth (%) | |||||
| Revenue | 13.4 | 6.3 | 22.7 | 19.3 | 12.4 |
| EBITDA | 15.1 | 10.7 | 52.6 | 33.0 | 24.1 |
| Normalised EPS | 47.6 | -28.6 | 99.4 | 39.7 | 33.6 |
| Normalised FDEPS | 47.6 | -28.6 | 99.4 | 39.7 | 33.6 |
Source: Company data, Nomura estimates
Company profile
ZDT is global No.1 FPCB maker, and is developing SLP, communication/auto PCB, and IC substrates in recent years.
Valuation Methodology
Our TP of TWD720 is based on 28x 2028F EPS of TWD25.71. Our 28x target P/E multiple is at the higher end of its historical trading range of 8-29x to reflect its improved visibility for AI-related project wins. The benchmark index for this stock is Taiwan TAIEX Index.
Risks that may impede the achievement of the target price
Key downside risks include: (1) worse-than-expected end-demand for Apple's iPhones and iPads; (2) lower-than-expected contribution from content growth driven by 5G smartphone migration; 3) slower-than-expected improvement in manufacturing efficiency; 4) worse-than-expected ASP pressure.
ESG
ZDT was listed on the 2020 FTSE4GOOD TIP Taiwan ESG Index for the first time and on the TWSE Corporate Governance 100 Index for the second consecutive year. The company was also recognized as a supplier goes above and beyond for its green initiatives in Apple's Supplier Report.
nVidia
H100
B200
B300
GB200
(Bianca)
GB300
(Bianca)
VR200
(Bianca)
Rubin Ultra
?
AWS
Generation
Trainium 2
Trainium 2.5 & 3
Generation
TPU 7x
TPU 8t, 8i
TPU next?
Meta
Generation
Athena
Iris
AMD
Generation
MI450
OAM
UBB
OAM
UBB
Structure
5+8+5 HDI (18L)
24L PCB
5+10+5 HDI (20L)
18L PCB
CCL Material
M7
M7
M8+M4
M7+M4
Fig. 150: A summary of AI PCB/CCL specs and supply chain
Bianca board
Switch tray
PCB Supplier(s)
Unimicron (major), VGT, others
WUS, ISU, TTM, others
Unimicron, VGT, others
WUS, ISU, TTM, others
Unimicron, VGT, others
WUS, ISU, TTM, others
VGT (major), Unimicron, others
WUS (major), VGT, Unimicron, others
6+12+6 HDI (24L)
5+12+5 HDI (22L)
22L PCB
22L/26L HLC PCB
WUS, Shengy, ZDT GCE?
WUS, ISU, Unimicron, others?
24-26L? HDI?
M8 (HVLP3) +M4
M7 (HVLP2)+M2
M8/8.5 (HVLP2) hybrid
2H24~
2H24~
EMC
CCL Supplier(s)
EMC
Doosan
Doosan
Doosan
Doosan
Doosan
EMC
EMC, SYTECH
| Bianca board Switch tray | 2025- 2Q25- | 5+12+5 HDI (22L) 22L PCB | M8 (HVLP3) +M4 M8/8.5 (HVLP2) hybrid Doosan | EMC, SYTECH, Doosan | VGT (major), Unimicron, others WUS (major), VGT, Unimicron, others | |
|---|---|---|---|---|---|---|
| Bianca board | Mid-plane boards in trays 2Q26- | 6+14+6 HDI (26L) | M8 (HVLP4) +M4 Doosan | VGT (major), Unimicron, others? | ||
| (New) | 2Q26- | 44L PCB | M9K2 | EMC, others? | VGT, WUS, Kinwong, Unimicron? | |
| Switch tray | 2Q26- | 32L PCB | M8.5 (k2, HVLP4) EMC, others? | WUS, VGT, others? | ||
| Backplane? (New) 2027? | 26Lx3=78L2, 104L? | M9Q? PTFE+M8? EMC, SYTECH? | WUS. Unimicron, VGT, Kinwong. others? | |||
| Compute board Switch board | 2027? | ? | ||||
| 2027? | ? | |||||
| CoWoP board? | TBD? | HDI/mSAP? | M8? M9Q? | EMC or new materials? | ZDT, Unimicron? Others? | |
| Content OAM | ||||||
| Content OAM | Time | Structure | CCL Material | CCL Suppliers) | PCB Supplier(s) | |
| Content OAM | 2H24~4Q25 | HDI+3 | M6? (HVLP2, RTF) Panasonic | Shengyi | ||
| UBB OAM | air cool) | 26L PCB (2 ASICs per board, M8 (HVLP2) | EMC, TUC (starting from June 2025) | GCE, Shengyi, FHE | ||
| UBB OAM | HDI+4 (22L) 26L PCB (2 ASICs - air- | M6?M7? (HVLP2, RTF) Panasonic | Shengy | |||
| UBB | Trn2.5: 1Q26~ | cooled, or 4 ASICs - liquid- | M8 (HVLP4) | EMC, TUC, others? | GCE, Shengyi, FHE | |
| Trn3: 2Q26- | cooled) |
PDS switch (New)
M8+M4
EMC
2Q26-
| Content | Time | Structure | CCL Material | CCL Supplier(s) | PCB Supplier(s) | |
|---|---|---|---|---|---|---|
| TPU UBB | 2H25~ | 34L PCB (16+18, N+M) | M7, HVLP2 M6 | Panasonic, EMC | WUS, ISU, TTM, VGT | |
| CPU board (New) - x86 CPU 4Q25- | 16-18L | Panasonic | WUS, TTM, GCE? | |||
| TPU UBB | mid-26- CPU board (New) - Axion 2Q26- | 36-40L+ PCB 22L PCB | M8+M6, HVLP3 M6 M8? | Panasonic, EMC EMC, Panasonic | WUS, ISU, TTM, LCS, VGT? VGT, WUS, ISU, TTM, others? | |
| 8i all-to-all switch (New) | mid-26- | 22L PCB | EMC | GCE, VGT ZDT, others? |
TPU UBB?
More other boards?
M8.5? M9Q?
2028?
Panasonic? EMC?
| Content | Time | Structure | CCL Material | CCL Supplier(s) | PCB Supplier(s) | |
|---|---|---|---|---|---|---|
| OAM, UBB | 2Q26? 36L+? | 2Q26? 36L+? | M8+M4 | EMC | WUS, ISU, TTM | |
| OAM, UBB | 2H26- | 40L+? | M8+M4 | EMC | WUS, ISU, TTM | |
| Content | Time | Structure | CCL Material | CCL Supplier(s) | PCB Supplier(s) | |
| OAM, UBB UBB | 2H26- 2H26~ | 2 HDI | 46-48L HDI+HLC PCB, wide M8? M8 hybrid | EMC? | EMC, Doosan | Unimicron, others? SCC, Others? |
size
Source: Company data, Nomura estimates
Fig. 151: ZDT: earnings forecast revisions
| New forecasts | New forecasts | New forecasts | Previous forecasts | Previous forecasts | Previous forecasts | Change (%) | Change (%) | Change (%) | |
|---|---|---|---|---|---|---|---|---|---|
| TWD mn | 2026F | 2027F | 2028F | 2026F | 2027F | 2028F | 2026F | 2027F | 2028F |
| Revenue | 224,018 | 267,273 | 300,409 | 220,204 | 255,610 | 286,797 | 1.7 | 4.6 | 4.7 |
| Gross profit | 52,196 | 65,451 | 79,787 | 50,334 | 61,525 | 72,640 | 3.7 | 6.4 | 9.8 |
| Operating profit | 24,113 | 33,792 | 45,528 | 22,866 | 30,571 | 39,143 | 5.5 | 10.5 | 16.3 |
| Pretax profit | 24,802 | 34,848 | 46,584 | 23,554 | 31,627 | 40,199 | 5.3 | 10.2 | 15.9 |
| Net profit | 14,751 | 20,603 | 27,530 | 14,012 | 18,699 | 23,754 | 5.3 | 10.2 | 15.9 |
| Fully diluted EPS (TWD) | 13.78 | 19.24 | 25.71 | 13.09 | 17.47 | 22.19 | |||
| Margins (%) | |||||||||
| Gross margin | 23.3 | 24.5 | 26.6 | 22.9 | 24.1 | 25.3 | 0.4 | 0.4 | 1.2 |
| Operating margin | 10.8 | 12.6 | 15.2 | 10.4 | 12.0 | 13.6 | 0.4 | 0.7 | 1.5 |
| Pretax margin | 11.1 | 13.0 | 15.5 | 10.7 | 12.4 | 14.0 | 0.4 | 0.7 | 1.5 |
| Net margin | 6.6 | 7.7 | 9.2 | 6.4 | 7.3 | 8.3 | 0.2 | 0.4 | 0.9 |
Source: Company data, Nomura estimates
2H23-1Q25
2H24~
(TWD)
1,200
1,000
800
600
400
200
Fig. 152: ZDT: quarterly financial forecasts
(TWD)
1,200
1,000
| (TWD mn) | 1Q25 | 2Q25 | 3Q25 | 4Q25 | 2025 | 1Q26 | 2Q26F | 3Q26F | 4Q26F | 2026F | 1Q27F | 2Q27F | 3Q27F | 4Q27F | 2027F | 2028F |
|---|---|---|---|---|---|---|---|---|---|---|---|---|---|---|---|---|
| Net revenue | 40,082 | 38,203 | 47,366 | 56,870 | 182,522 | 40,728 | 46,380 | 56,710 | 80,199 | 224,018 | 57,302 | 61,144 | 66,841 | 81,986 | 267,273 | 300,409 |
| COGS | 34,197 | 31,193 | 36,956 | 44,040 | 146,385 | 31,917 | 36,126 | 43,232 | 60,548 | 171,822 | 44,137 | 46,660 | 49,935 | 61,088 | 201,821 | 220,621 |
| Gross profit | 5,885 | 7,011 | 10,410 | 12,830 | 36,136 | 8,812 | 10,254 | 13,478 | 19,652 | 52,196 | 13,164 | 14,483 | 16,906 | 20,897 | 65,451 | 79,787 |
| Op expenses | 4,829 | 4,586 | 5,880 | 6,909 | 22,205 | 6,308 | 6,781 | 7,119 | 7,874 | 28,083 | 7,224 | 7,766 | 8,147 | 8,524 | 31,660 | 34,259 |
| Op profit | 1,056 | 2,425 | 4,530 | 5,921 | 13,932 | 2,503 | 3,474 | 6,359 | 11,777 | 24,113 | 5,940 | 6,718 | 8,760 | 12,374 | 33,792 | 45,528 |
| Non-op income | 401 | (153) | 131 | (248) | 131 | (103) | 264 | 264 | 264 | 689 | 164 | 564 | 164 | 164 | 1,056 | 1,056 |
| Pretax profit | 1,457 | 2,272 | 4,661 | 5,673 | 14,063 | 2,400 | 3,738 | 6,623 | 12,041 | 24,802 | 6,104 | 7,282 | 8,924 | 12,538 | 34,848 | 46,584 |
| Net profit | 632 | 605 | 2,392 | 3,161 | 6,791 | 1,426 | 2,172 | 3,958 | 7,196 | 14,751 | 3,547 | 4,231 | 5,333 | 7,493 | 20,603 | 27,530 |
| EPS (TWD) | 0.66 | 0.63 | 2.46 | 3.22 | 6.91 | 1.33 | 2.03 | 3.70 | 6.72 | 13.78 | 3.31 | 3.95 | 4.98 | 7.00 | 19.24 | 25.71 |
| Operating ratios (%) | ||||||||||||||||
| Gross margin | 14.7% | 18.4% | 22.0% | 22.6% | 19.8% | 21.6% | 22.1% | 23.8% | 24.5% | 23.3% | 23.0% | 23.7% | 25.3% | 25.5% | 24.5% | 26.6% |
| Operating margin | 2.6% | 6.3% | 9.6% | 10.4% | 7.6% | 6.1% | 7.5% | 11.2% | 14.7% | 10.8% | 10.4% | 11.0% | 13.1% | 15.1% | 12.6% | 15.2% |
| Pretax profit margin | 3.6% | 5.9% | 9.8% | 10.0% | 7.7% | 5.9% | 8.1% | 11.7% | 15.0% | 11.1% | 10.7% | 11.9% | 13.4% | 15.3% | 13.0% | 15.5% |
| Net profit margin | 1.6% | 1.6% | 5.0% | 5.6% | 3.7% | 3.5% | 4.7% | 7.0% | 9.0% | 6.6% | 6.2% | 6.9% | 8.0% | 9.1% | 7.7% | 9.2% |
| Year-to-year (%) | ||||||||||||||||
| Net revenue | 23% | 18% | -6% | 1% | 6% | 2% | 21% | 20% | 41% | 23% | 41% | 32% | 18% | 2% | 19% | 12% |
| Gross profit | 10% | 65% | -9% | 12% | 11% | 50% | 46% | 29% | 53% | 44% | 49% | 41% | 25% | 6% | 25% | 22% |
| Operating profit | 42% | N.M. | -24% | 7% | 20% | 137% | 43% | 40% | 99% | 73% | 137% | 93% | 38% | 5% | 40% | 35% |
| Pretax profit | -3% | 346% | -12% | -27% | -7% | 65% | 65% | 42% | 112% | 76% | 154% | 95% | 35% | 4% | 41% | 34% |
| Net profit | -35% | 25% | -29% | -28% | -26% | 125% | 259% | 65% | 128% | 117% | 149% | 95% | 35% | 4% | 40% | 34% |
| Qtr-to-Qtr (%) | ||||||||||||||||
| Net revenue | -29% | -5% | 24% | 20% | -28% | 14% | 22% | 41% | -29% | 7% | 9% | 23% | ||||
| Gross profit | -49% | 19% | 48% | 23% | -31% | 16% | 31% | 46% | -33% | 10% | 17% | 24% | ||||
| Operating profit | -81% | 130% | 87% | 31% | -58% | 39% | 83% | 85% | -50% | 13% | 30% | 41% | ||||
| Pretax profit | -81% | 56% | 105% | 22% | -58% | 56% | 77% | 82% | -49% | 19% | 23% | 40% | ||||
| Net profit | -86% | -4% | 295% | 32% | -55% | 52% | 82% | 82% | -51% | 19% | 26% | 40% |
Source: Company data, Nomura estimates
Fig. 153: ZDT: forward P/E band
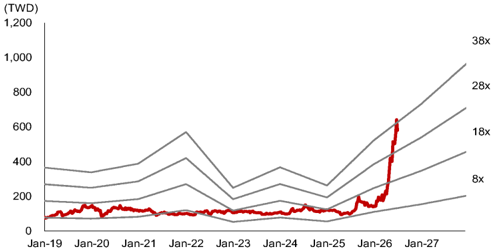
Source: TEJ, Nomura estimates
38x
28x
Fig. 154: ZDT: forward P/B band
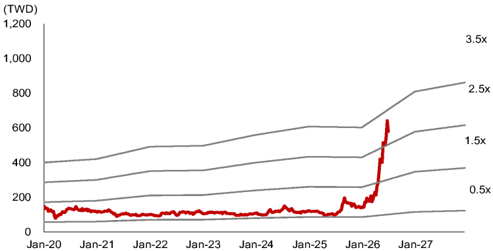
Source: TEJ, Nomura estimates
3.5x
Appendix A-1
This report has been produced by Nomura International (Hong Kong) Ltd., Taipei Branch (NITB), Taiwan.
See Disclaimers for Nomura Group entity details.