PDF 原檔:報告_GS_資料中心冷卻電力_20260713_original.pdf
圖片清單(已驗證 2026-07-15)
ingest 時建立的「眼見為憑」圖片索引,是 lib/ 嵌圖的唯一真相來源;嵌入時只從這裡挑分類為「真資料圖」的。<40KB(
_008、_009、_010、_018)未 Read,預設 logo/裝飾,免列。
| 檔名 | size | 分類 | 親眼所見內容 |
|---|---|---|---|
報告_GS_資料中心冷卻電力_20260713_001.png |
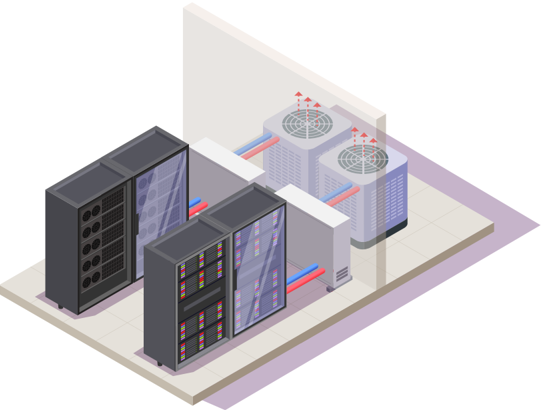
103KB | 真資料圖 | 資料中心機房等角示意圖:機櫃+氣冷空調外機,藍/紅管路示意冷/熱流向 |
報告_GS_資料中心冷卻電力_20260713_002.png |
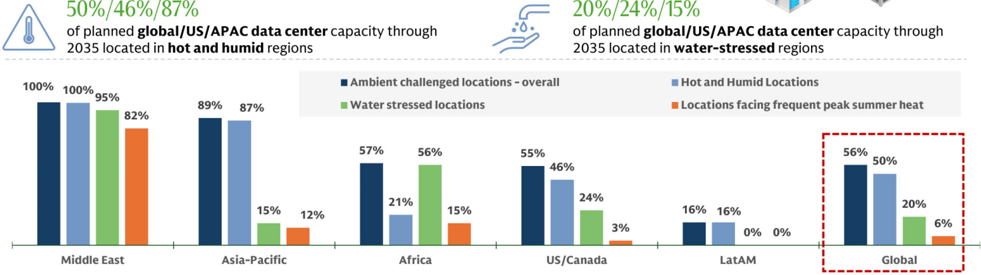
113KB | 真資料圖 | 長條圖:Middle East/Asia-Pacific/Africa/US-Canada/LatAm/Global 六區域「Ambient challenged locations / Hot and Humid / Water stressed / Peak summer heat」四指標百分比 |
報告_GS_資料中心冷卻電力_20260713_003.png |
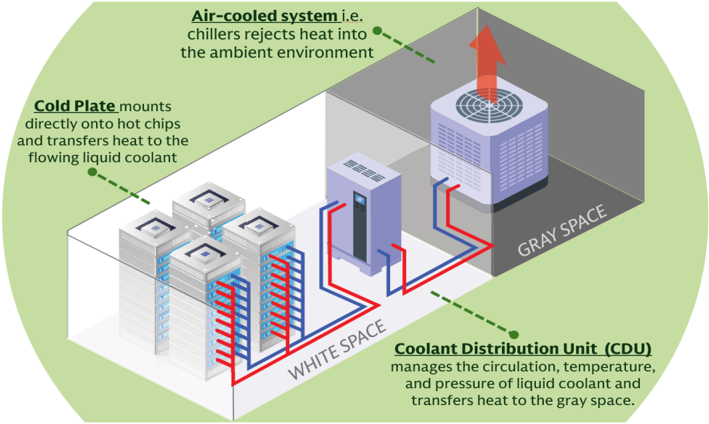
192KB | 真資料圖 | Exhibit 1:White space(Cold Plate+CDU)+Gray space(Air-cooled chiller)冷卻架構示意圖 |
報告_GS_資料中心冷卻電力_20260713_004.png |
336KB | 真資料圖 | Exhibit 2:Rack density/Heat and Humidity/Power vs Water 三層決策流程圖,導向 Air-cooled chillers 或 Evaporative system 或 Dry coolers |
報告_GS_資料中心冷卻電力_20260713_005.png |
206KB | 真資料圖 | Exhibit 3:五大受惠 vertical 分類圖(Ambient solutions/Advanced liquid cooling/Water efficiency/Thermal equipment/Power generation) |
報告_GS_資料中心冷卻電力_20260713_006.png |
93KB | 真資料圖 | Exhibit 5:PUE(x 軸)vs WUE(y 軸)散點圖,比較 CRAC/CRAH、RDHx/Sidecar、Direct to Chip 在 evaporative vs air-cooled 配置下的位置,並標示 immersion 為近零 WUE |
報告_GS_資料中心冷卻電力_20260713_007.png |
43KB | 真資料圖 | Exhibit 6:白空間冷卻技術 capex 倍數長條圖:CRAC/CRAH 1x → RDHx 2-3x → Direct to Chip 5-8x → 單相浸沒 10-15x → 兩相浸沍 15-20x |
報告_GS_資料中心冷卻電力_20260713_011.png |
183KB | 真資料圖 | Exhibit 10:四種電力來源(煤/天然氣/核能/美國電網平均)下,CRAC+Evaporative、RDHx+Evaporative、Direct to Chip+Evaporative/Air-cooled、單相/兩相浸沒+氣冷之直接與間接耗水強度(L/kWh)長條圖 |
報告_GS_資料中心冷卻電力_20260713_012.png |
112KB | 真資料圖 | Exhibit 11:中國十大資料中心樞紐地圖(Horinger、Zhangjiakou、Ningxia、Gansu、Chengdu-Chongqing 等 cluster) |
報告_GS_資料中心冷卻電力_20260713_013.png |
195KB | 真資料圖 | Exhibit 13:Microsoft 全球資料中心依氣候採用之冷卻方式世界地圖(Mechanical/High-efficiency mechanical/Adiabatic/Free air cooling 四類) |
報告_GS_資料中心冷卻電力_20260713_014.png |
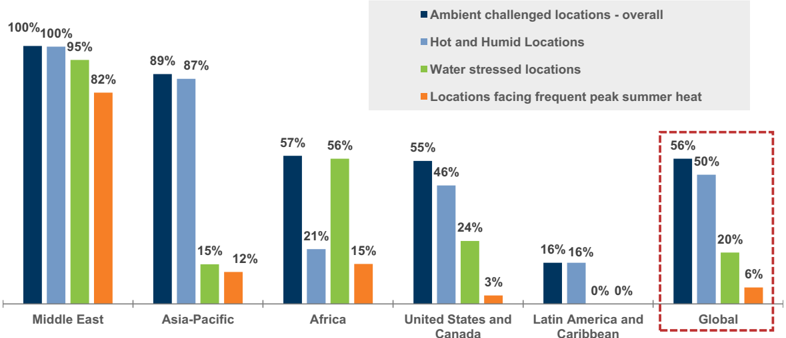
56KB | 真資料圖 | Exhibit 14:與 002 同款六區域長條圖(Global 56%/50%/20%/6%),文中對應段落引用版本 |
報告_GS_資料中心冷卻電力_20260713_015.png |
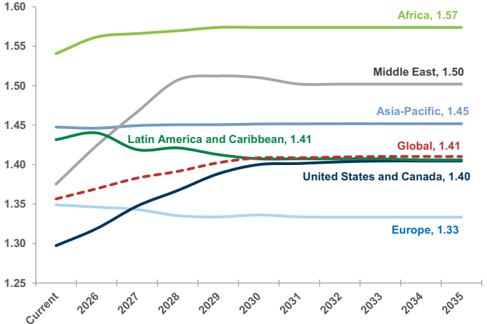
48KB | 真資料圖 | Exhibit 15:2026-2035 各區域資料中心 PUE 趨勢線圖(Africa 1.57 最高、Europe 1.33 最低、Global 1.41) |
報告_GS_資料中心冷卻電力_20260713_016.png |
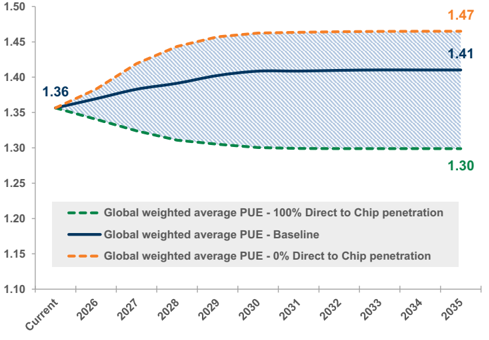
52KB | 真資料圖 | Exhibit 16:全球加權平均 PUE 對白空間液冷滲透率敏感度區間圖(100% DtC 滲透 1.30 ~ 0% 滲透 1.47,Baseline 1.41) |
報告_GS_資料中心冷卻電力_20260713_017.png |
288KB | 真資料圖 | Exhibit 17:14 檔 Buy 評等智慧冷卻/耐候冷卻股清單表(含 RIC、市值、CROCI、Sales growth、Upside to TP、Thermal Cooling Equipment/Cooling Controls/Thermal Management Integrator 分類與 Thematic Relevance),含 Vertiv、nVent、Delta Electronics、Hitachi、Jabil、Celestica 等 |
報告_GS_資料中心冷卻電力_20260713_019.png |
59KB | 真資料圖 | Exhibit 19:260TWh 高品質廢熱潛力示意圖,等同澳洲全年用電量/>30 座核反應爐年發電量/2030E 全球資料中心用電量 20% |
原始內容
How heat, humidity and water use minimization could drive data center cooling, power demand and stocks
The choice of technologies to cool data centers, as well as cooling technology innovation, is likely to center around growing compute density and increasing necessity to minimize water and power consumption in pursuit of both operator e ffi ciency and support from policymakers and/or local communities. We see elevated attention on data centers in areas with local resource constraints and/or high ambient temperatures -which our analysis indicates could represent ~56%/55% of expected global/US capacity adds through 2035. In these areas, heat rejection cooling technologies that virtually eliminate or minimize ongoing water intake can come with a tradeo ff of ~25%-45% greater power consumption, even as industry is focused on innovations that can minimize both water and power intensity.
In this report, we consider how ambient temperatures/humidity levels along with the water/power tradeo ff could drive the choice for white space and gray space cooling technology selection and implications to both data center power demand and stocks of the cooling supply chain. We highlight 4 1 global Buy-rated stocks in the data center cooling/power supply chain that we believe could see tailwinds, levered to:
- Ambient solutions, controls and components. ·
- Advanced liquid cooling solutions and components. ·
- Water e ffi ciency innovation and recycling/desalination. ·
- Thermal equipment, transmission and consulting for data center waste heat recovery. ·
- Power and power infrastructure supply chain. ·
Brian Singer, CFA +1(212)902-8259 brian.singer@gs.com Goldman Sachs & Co. LLC
Xavier Zhang +852-2978-6681 xavier.zhang@gs.com Goldman Sachs (Asia) L.L.C.
Brendan Corbett
+1(415)249-7440 brendan.corbett@gs.com Goldman Sachs & Co. LLC
Michael Ng, CFA +1(212)902-8618 michael.ng@gs.com Goldman Sachs & Co. LLC
Dan Duggan, Ph.D. +1(212)902-4726 dan.duggan@gs.com Goldman Sachs & Co. LLC
Goldman Sachs does and seeks to do business with companies covered in its research reports. As a result, investors should be aware that the fi rm may have a con fl ict of interest that could a ff ect the objectivity of this report. Investors should consider this report as only a single factor in making their investment decision. For Reg AC certi fi cation and other important disclosures, see the Disclosure Appendix, or go to www.gs.com/research/hedge.html. Analysts employed by nonUS a ffi liates are not registered/quali fi ed as research analysts with FINRA in the U.S.
ric Sheridan
Contributing Authors
Brian Singer, CFA oldman Sachs & Co. LLC
+1(212)902-8259 brian.singer@gs.com Goldman Sachs & Co. LLC.
Michael Ng, CFA
+1(212)902-8618 michael.ng@gs.com Goldman Sachs & Co. LLC
Verena Jeng +852-2978-1681 verena.jeng@gs.com Goldman Sachs (Asia) L.L.C.
aniela Costa
4(20)7774-8354 niela.costa@gs.com oldman Sachs International
ric Sheridan
(917)343-8683 ic.sheridan@gs.com oldman Sachs & Co. LLC
ark Delaney, CFA
(212)357-0535 ark.delaney@gs.com oldman Sachs & Co. LLC
unice Liu
52-2978-7472 nice.liu@gs.com oldman Sachs (Asia) L.L.C.
hruv Goyal
+1 332 245-7854 dhruv.goyal@gs.com Goldman Sachs India SPL
Will Bryant
+1(212)934-4705 will.bryant@gs.com Goldman Sachs & Co. LLC
Hao Chen
+86 21 2401-8812 hao.z.chen@goldmansachs.cn Goldman Sachs (China) Securities Company Limited
Gabriela Borges, CFA
+1(212)902-7839
gabriela.borges@gs.com
Xavier Zhang Goldman Sachs & Co. LLC
+852-2978-6681 xavier.zhang@gs.com Goldman Sachs (Asia) L.L.C.
Dan Duggan, Ph.D. +1(212)902-4726 dan.duggan@gs.com Goldman Sachs & Co. LLC
Timothy Zhao +852-2978-2673 timothy.zhao@gs.com Goldman Sachs (Asia) L.L.C.
Jacqueline Du +852-2978-1783 jacqueline.du@gs.com Goldman Sachs (Asia) L.L.C.
Gabriela Borges, CFA
+1(212)902-7839 gabriela.borges@gs.com Goldman Sachs & Co. LLC
Alberto Gandolfi
+39(02)8022-0157 alberto.gandolfi@gs.com Goldman Sachs Bank Europe SE Milan branch
Kelsey Santoso
+65-6889-2473 kelsey.santoso@gs.com Goldman Sachs (Singapore) Pte
Zorayda Montemayor
+1(212)357-6403 zorayda.montemayor@gs.com Goldman Sachs & Co. LLC
Beatriz Abreu, CFA
+1(212)357-0455 beatriz.abreu@gs.com Goldman Sachs & Co. LLC
Carly Davenport
+1(212)357-1914
carly.davenport@gs.com
Brendan Corbett Goldman Sachs & Co. LLC
+1(415)249-7440 brendan.corbett@gs.com Goldman Sachs & Co. LLC
Allen Chang
+852-2978-2930 allen.k.chang@gs.com Goldman Sachs (Asia) L.L.C.
Joe Ritchie
+1(212)357-8914 joseph.ritchie@gs.com Goldman Sachs & Co. LLC
James Schneider, Ph.D.
+1(212)357-2929 jim.schneider@gs.com Goldman Sachs & Co. LLC
Carly Davenport
+1(212)357-1914 carly.davenport@gs.com Goldman Sachs & Co. LLC
John Mackay
+1(212)357-5379 john.mackay@gs.com Goldman Sachs & Co. LLC
Evan Tylenda, CFA
+44(20)7774-1153 evan.tylenda@gs.com Goldman Sachs International
Jaya Patel
+1(212)357-9901 jaya.patel@gs.com Goldman Sachs & Co. LLC
Zhou Li
+86 21 2401-8648 zhou.li@goldmansachs.cn Goldman Sachs (China) Securities Company Limited
Why heat/humidity/drought where data centers are built impacts stock performance
Ambient conditions - heat, humidity and drought - where data centers are being built are increasingly a driver of both stock performance and innovation. Higher heat, humidity and drought risks limit cooling technology selection optionality for data centers and requires greater power demand in a ff ected regions where minimizing direct water demand is a priority.
- Our analysis suggests that 56%/55% of new global/US data centers are set to be n built in areas with elevated physical risk to heat, humidity and/or drought.
- Based on our analysis of data center location and type, we expect that 43% of new n data center capacity will deploy white space direct-to-chip or immersion cooling inside the data center. Separately, we expect 56% of new data center capacity will deploy gray space chillers, adiabatic systems or mechanical cooling back-up to transfer heat to the outside.
- This drives power usage e ff ectiveness (PUE) higher by 11 pp in the US which n represents a 0.3% annual impact to total US power demand growth through 2030.
We see four key investment/stock impacts:
- Cooling technology selection impacts select Industrials stocks based on their 1. exposure. We highlight Celestica, Jabil, nVent, Vertiv, Parker-Hanni fi n, Comfort Systems, Carel, Schneider Electric, Delta Electronics, AVC, Hitachi, Kstar, Auras and Envicool , among 23 exposed Buy-rated stocks.
- The need to minimize direct water consumption - particularly in the US 1. raises overall power consumption, bullish for stocks of the power supply chain. We highlight Xcel, Sempra, NRG, Vistra, Quanta Services, Prysmian and Fujikura .
- The prioritization of easing/minimizing consumption of water supplies used for 2. human/agricultural intake creates opportunities for advanced water solutions and potential new use cases for brackish water supply. We highlight Legence, Xylem, Veralto, WaterBridge Infrastructure and Organo.
- Increased focus on minimizing not only water use but power use as well 3. increases likelihood of innovations. We highlight NVDA for its Rubin gen servers.
We believe the P hysical environment is a 7 th P driving AI/data center power growth/constraints, complementing P ervasiveness, P roductivity, P rice, P olicy, P arts and P eople.
The growing challenges for new data center capacity: Heat, Humidity, Water ...
20%/24%/15%
of planned global/US/APAC data center capacity through
2035 located in water-stressed regions
of planned global/US/APAC data center capacity through 2035 located in hot and humid regions
100%
100% 95%
Middle East
· Ambient challenged locations - overall · Hot and Humid Locations
immersion liquid cooling white space design, enabling
higher rack densities, improved thermal efficiency, and partially decoupling power versus water trade-off
... And potentially lead to higher power consumption · We estimate ambient constraints could drive weighted-average data center PUE to ~ 1.4 both globally
and in the US, representing a +5 pp/+11 pp increase versus
today's levels
- White space cooling pathway selection remains a major swing factor, with global PUE ranging from ~ 1.3 to ~1.5 under higher or lower liquid cooling adoption scenarios · Cooling-driven PUE changes could add 60-70 TWh of data
- center power demand by 2035 in the US, adding 0.3 pp growth to US power demand CAGR (2026-2030). For data centers in APAC, every 1 GW of compute capacity
- would consume ~240 GWh more power than those located in the US in 2030. We caveat China's stringent PUE targets (≤1.25 for new
- data center) may temper the rise in APAC average PUE, while also potentially favoring water intensive cooling pathways.
require air-cooled chillers, adiabatic systems, or mechanical cooling back-up for gray space heat
rejection, to maintain performance under drought or
periods of thermal stress
Verticals and Stocks to Benefit Ambient solutions, controls and components
Vertiv (VRT.N), nVent (NVT.N), Carel(CRLI.MI), Jabil(JBL.N),
Comfort Systems (FIX.N), Schneider Electric* (SCHN.PA),
Parker-Hannifin (PH.N), Envicool (002837.SZ), Celestica
(CLS.TO), Delta Electronics (2308.TW), Hitachi (6501.T)
Water efficiency, recycling, desalination
Xylem* (XYL.N), Veralto (VLTO.N), Legence (LGN.OQ), WaterBridge Infrastructure (WBI.N), and Organo (6368.T) Advanced liquid cooling and components AVC (3017.TW), Kstar (002518.SZ), Auras (3324.TW)
Thermal equipment, transmission and consulting AECOM (ACM.N), Legence (LGN.OQ), Siemens Energy
(ENR1n.DE), Mitsubishi Electric (6503.T)
Power generation distribution and transmission
Xcel Energy (XEL.N), Vistra (VST.N), NRG (NRG.N),
Quanta Services (PWR.N), Prysmian (PRY.MI), Fujikura (5803.T)
Stocks highlighted above deliver above-peer corporate returns relative to sector peers
*denotes stock also exposed to liquid cooling solutions and/or components
Data center cooling is shifting from a standardized infrastructure design into a site -speci fi c optimization decision, increasingly dictated by the interaction of compute intensity, power and water constraints, ambient conditions, and heat recovery potential. As AI -driven demand scales, cooling is emerging as a key determinant of cost, e ffi ciency, and deployability, with infrastructure choices directly impacting both operating economics (power/water costs) and the ability to bring capacity online in constrained regions where community pushback could emerge or has emerged. We believe four questions are becoming increasingly important for data center operators and regulators, and driving investment tailwinds across verticals that could help address these emerging bottlenecks.
- How dense are the data center racks? This will help to drive choice of white space 1.
(inside the data center) cooling, with hyperscaler data centers almost entirely likely to deploy liquid cooling.
- What is the ambient temperature and humidity? High ambient temperatures and 2. humidity limit gray space (heat transfer outside the data center) cooling fl exibility to technologies that consume more power.
- What are local constraints to water or power? Data centers in areas without high 3. temperatures/humidity have fl exibility to choose technologies that tradeo ff between higher power/limited water consumption and lower power/higher water consumption.
- Are there local users that could consume data center waste heat? The availability 4. of thermal infrastructure and nearby heat demand (e.g., district heating networks, industrial users, agriculture) determines whether waste heat can be economically captured and reused.
Building on white space data center liquid cooling analysis by our TMT team, this report focuses on Questions 2 and 3, applying our framework of physical risk to extreme temperatures, water stress and heat stress to forecast gray space data center cooling technology deployment and implications to power consumption. From our analysis we have four takeaways:
- 56%/55% of global/US data center capacity we expect to come online in 2026-35 1. are in areas with elevated risk of extreme temperatures, water stress and heat stress - likely driving mechanic/air-cooled gray space solution deployment that comes with higher power use.
- Our analysis implies that the ambient impact on data center cooling technology 2. selection could drive a +5 pp./+11 pp. global/US increase in power needs (higher power usage e ff ectiveness, or PUE) by 2035 before taking into account potential e ffi ciency innovations. An +11 pp. impact to US PUE could add 60-70 TWh of data center power demand by 2035, adding 0.3 pp growth to US power demand CAGR in 2026-2030. Globally, all else equal, this would increase PUE of data centers from ~1.36 today toward ~1.41 by 2035 in our baseline case, with sensitivity ranging from ~1.30 (under high white space liquid cooling adoption) to ~1.47 (under low adoption).
- We see tailwinds for cooling technology deployment that prioritizes minimizing 3. water use - liquid cooling inside the data center and dry cooling/air chillers outside the data center. We expect ~43% of new data center capacity through 2035 will deploy direct-to-chip or immersion liquid cooling in the white space, disproportionately via direct-to-chip because of lower cost. Our analysis suggests ~56% of planned capacity is located in ambient -challenged regions, increasing reliance on air -cooled chillers and other mechanical cooling solutions in the gray space where water use minimization is a priority, to support performance during drought or periods of thermal stress.
- We highlight 41 Buy-rated stocks among a broader data center cooling ecosystem. 4.
White space cooling system the ambient environment
captures IT equipment heat and transfers out of the server room
system transfers heat into
Gray space cooling ambient environment, and
regulates non-IT
Exhibit 1: Example of data center cooling infrastructure: Direct to Chip (white space) + Air-cooled system (gray space)
directly onto hot chips and transfers heat to the
flowing liquid coolant
RACK DENSITY
How concentrated the power & heat are in data center?
<20 kW per rack
CRAC/CRAH (Air Cooling)
i.e. Enterprise Data Center
20-50 kW per rack i.e. Cloud Data Center
>50 kW per rack i.e. Al Data Center
>100 kW per rack i.e. Next-Gen Data Center
Most cost-effective and operationally simple standard for cooling lower-density workloads
RDHx/Sidecar (Air-Liquid)
Air alone lacks sufficient heat capacity to remove high-density thermal loads efficiently
Direct to Chip (Liquid Cooling)
Liquid cooling becomes necessary to remove heat from high density systems
Immersion (Liquid Cooling)
Immersion becomes preferred as it cools the entire server directly without complex
plumbing
Source: Goldman Sachs Global Investment Research
Exhibit 2: We see rack density, local resource constraint and ambient conditions to drive di ff erentiations of data center cooling infrasctructure
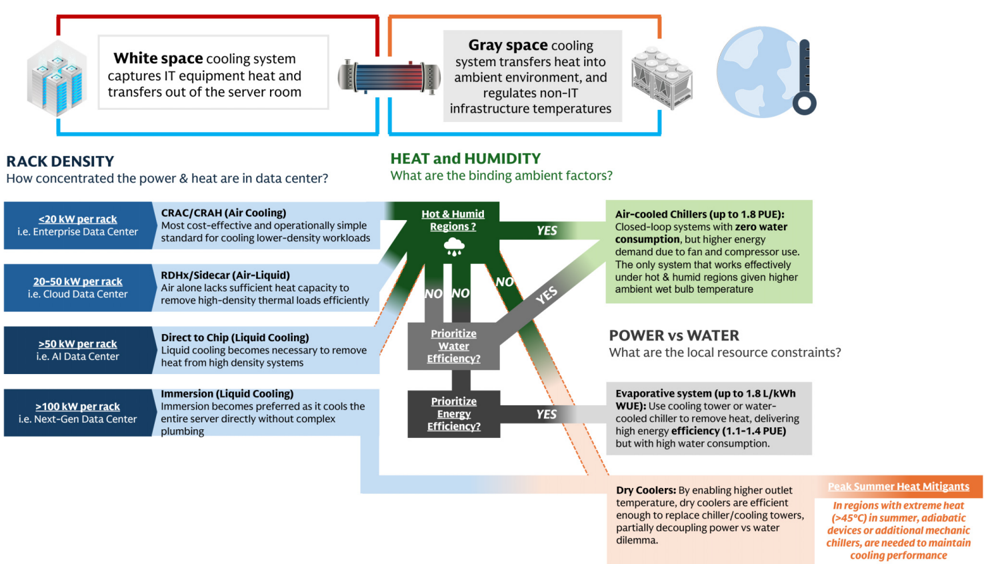
We caveat that the cooling con fi gurations shown in this exhibit represent likely pathways based under each conditions and should not be interpreted as the only feasible solutions.
Source: Goldman Sachs Global Investment Research
devices or additional mechanic chillers, are needed to maintain
Ambient
Ambient solutions, controls and components high-ambient/efficiency chiller models, adiabatic
Stock implications from data center ambient conditions
=======
Advanced liquid cooling and components
Stocks that could see tailwinds from ambient conditions-driven cooling technology selection. We highlight 41 Buy-rated stocks levered to the cooling technology selection and water use minimization priority in regions facing extreme temperatures, water stress and heat stress.
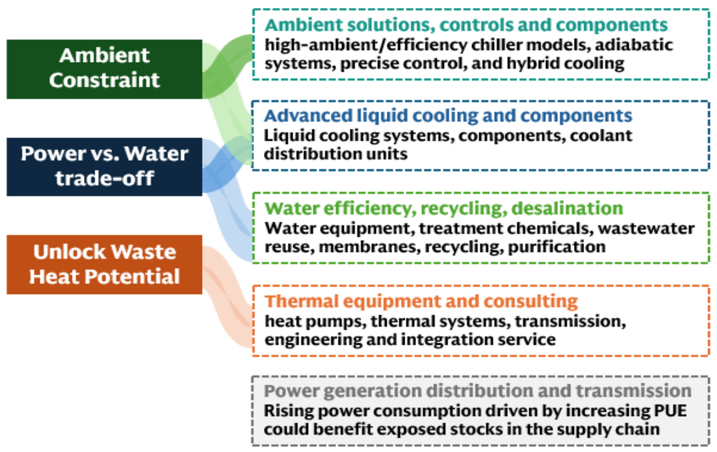
Exhibit 3: We see fi ve verticals that could see tailwinds from cooling pathway di ff erentiation to mitigate ambient constraints, power vs. water trade-o ff , and power demand/waste heat debate
Source: Goldman Sachs Global Investment Research
Ambient solutions, controls and components
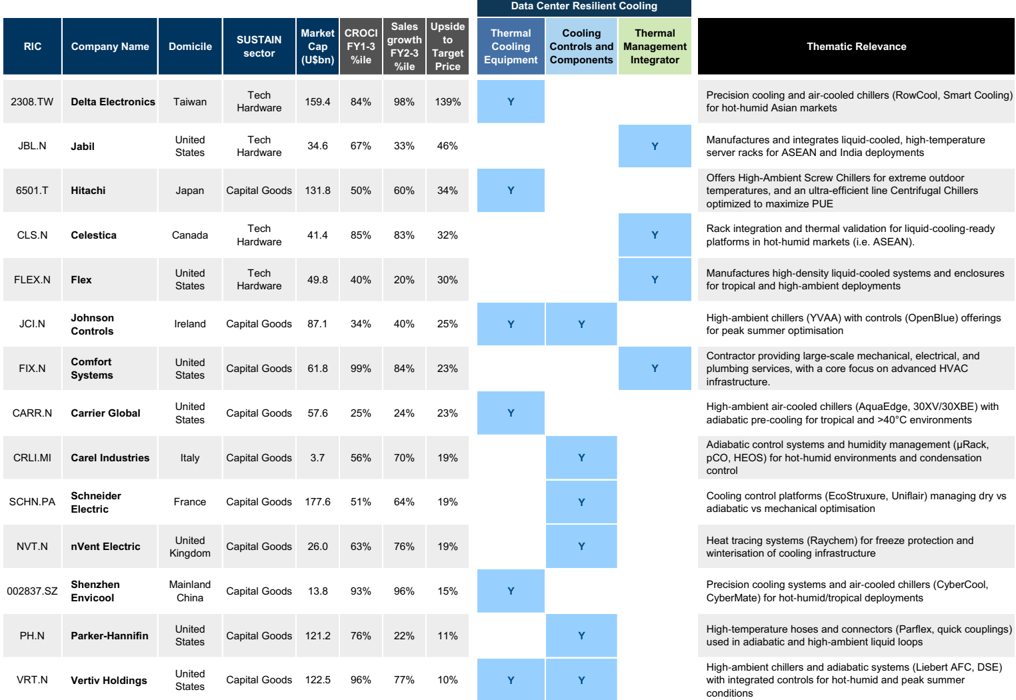
We highlight 14 Buy -rated stocks globally , with Vertiv (VRT.N), nVent Electric (NVT.N), Parker-Hanni fi n (PH.N), Comfort Systems (FIX), Schneider Electric (SCHN.PA), Envicool (002837.SZ), Carel (CRLI.MI), Jabil (JBL.N), Celestica (CLS.TO), Hitachi (6501.T) and Delta Electronics (2308.TW) delivering above -sector-peer corporate returns. Among the others, we also highlight Carrier (CARR.N) and Johnson Controls (JCI.N).
Advanced liquid cooling solutions and components
We highlight 17 Buy -rated stocks globally , Celestica (CLS.TO), Xylem (XYL.N), Jabil (JBL.N), nVent Electric (NVT.N), Schneider Electric (SCHN.PA), Vertiv (VRT.N), Carel (CRLI.MI), Hitachi (6501.T), Delta Electronics (2308.TW), AVC (3017.TW), Shenzhen Kstar (002518.SZ), Auras (3324.TW) and Envicool (002837.SZ) delivering above -sector-peer corporate returns.
Water e ffi ciency innovation and supply diversi fi cation We highlight 10 Buy -rated stocks globally , with Xylem (XYL.N), Veralto (VLTO.N), Legence (LGN.OQ), WaterBridge Infrastructure (WBI.N) and Organo (6368.T) delivering above -sector-peer corporate returns.
Power vs. Water trade-off
Unlock Waste
Heat Potential
sanlnilt wenansleri Duylatcustucls slaly acl ss tlic Mala celltct coutla Ceosyotelli
Addressing the Power vs Water Trade-off
Thermal equipment, transmission and consulting
We highlight 7 Buy -rated stocks globally , with AECOM (ACM.N), Legence (LGN.OQ), Siemens Energy (ENR1n.DE), Schneider Electric (SCHN.PA) and Mitsubishi Electric (6503.T) delivering above -sector-peer corporate returns.
5801.T
3017.TW
Furukawa Electric
AVC
VLTO.N
Veralto
6254.T
Nomura Micro Science
Power generation, distribution and transmission supply chain
With data center site selection and ambient conditions likely to result in higher power demand (0.3% annual growth in US power demand), this continues to be a tailwind for the power generation, distribution, transmission and E&C/industrial-related supply chain. We highlight 7 Buy-rated stocks levered to power demand growth in the US , where we expect the priority of water minimization and resulting greater power demand to be most robust. Among these, Xcel Energy (XEL.N), Vistra (VST.N), NRG (NRG.N), Quanta Services (PWR.N) and Fujikura (5803.T) have above-sector-peer corporate returns.
US
Americas and Europe
CLS.TO
Celestica Inc
XYL.N
JBL.N
JCI.N
NVT.N
SCHN.PA
FLEX.OQ
VRT.N
Xylem
Jabil
Johnson Controls nVent
Schneider Electric
Flex
Vertiv
CRLI.MI
Carel Industries
Ambient Challenge
Adiabatic Solutions, Controls and Components
US
US
Europe and APAC
Exhibit 4: We highlight 41 Buy -rated stocks globally across the data center cooling ecosystem
PH.N
CARR.N
VRT.N
Parker-Hannifin
FLEX.N
Carrier Global JBL.N
Vertiv Holdings
Flex
LGN.OQ
Legence Corp
Jabil DOV.N Dover Corp
FIX
NVT.N
nVent Electric
Europe and APAC
2308.TW Delta Electronics
002837.SZ Shenzhen Envicool
SCHN.PA Schneider Electric
CRLI.MI
6501.T
Comfort Systems
Cooling OEM/ODM and engineering contractor
exposed to ambient
Power Supply Chain
| stressed markets XEL.N | |
|---|---|
| VST.N | |
| NRG.N | |
| Carel Industries | |
| Hitachi |
Bolded font denotes stock with >50%ile CROCI versus global GICS2 peers
Source: Goldman Sachs Global Investment Research
SCHN.PA Schneider Electric
ROCKb.CO
Rockwool A/S
6503.T
Mitsubishi Electric
US power generation
distribution, transmission
| Xcel SRE.N | Xcel SRE.N | Sempra |
|---|---|---|
| Vistra | PWR.N | Quanta Services |
| NRG | 5803.T | Fujikura |
| PRY.MI | Prysmian |
Four key questions that govern data center cooling technology selection
(1) How dense are the data center racks?
Compute and Rack density remains the primary driver of white space cooling infrastructure, dictating the transition path from conventional air cooling systems (CRAC/CRAH) to hybrid solutions (RDHx/Sidecar) and ultimately to liquid cooling.
At lower densities (<20 kW/rack), air cooling remains su ffi cient and cost e ff ective, but as workloads move into the 20-50 kW range, Rear Door Heat Exchanger (RDHx) becomes necessary to handle incremental thermal loads. Beyond ~50 kW/rack - typical for hyperscale AI clusters - air systems reach their physical limits, making liquid cooling (direct to chip or immersion) essential. This is consistent with our global TMT team's view that AI-driven demand structurally accelerates adoption of advanced liquid cooling solutions, raising the technical and capital intensity of new builds. The team modeled 40% penetration rate of Direct to Chip (D2C) liquid cooling for AI training servers shipment by 2027.
(2) What is the ambient temperature and humidity?
Ambient Conditions are emerging as a binding constraint that further limits cooling pathways and drives regional divergence. We note 56% of new data center capacity (2026-2035) is being built in ambient -challenged regions, where peak summer temperatures (>40°C) compress heat rejection e ffi ciency and tropical humidity (~75%-90% relative humidity) reduces the e ff ectiveness of evaporation-based cooling. In our view, this creates a structural split: hot/humid regions (i.e. ASEAN, parts of India) skew toward high -ambient air -cooled chillers, while hot/arid regions (Middle East, U.S. Southwest) would require adiabatic or additional mechanic assist during summer peak. Before taking into account future innovations, ambient-driven cooling technology selection could increase global/US data center power usage e ff ectiveness (PUE) by +5 pp./+11 pp. through 2035 based on our analysis. We see supportive tailwinds for high-ambient/e ffi ciency chiller models, adiabatic systems, precise temperature/humidity control, and hybrid cooling architectures, as well as cooling OEM/ODM and engineering contractors with market leading exposures in ambient-challenged regions.
(3) What are local constraints to water or power?
Power vs. Water trade -o ff and community constraints/priorities is becoming key for data centers that have fl exibility in gray space cooling design, with clear implications for power and water usage e ff ectiveness (PUE/WUE) and capex. Conventional data center setups highlight a structural dilemma:
- Gray space: Evaporative systems deliver lower PUE (~1.3-1.5) but high water n intensity (~1.5-2.5 L/kWh WUE), while air -cooled systems o ff er near -zero WUE but at higher PUE (~1.6-1.8), e ff ectively shifting water usage upstream to the power system, in our view.
-
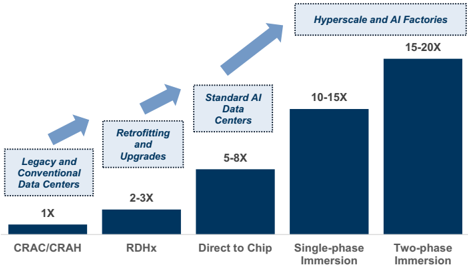
White space : More advanced solutions such as rear door heat exchanger (RDHx) n and liquid cooling compress both metrics (~1.2-1.4 PUE and near -zero WUE), albeit at 2x-3x (RDHx) and 5x-20x (liquid) the capex relative to a 1x CRAC/CRAH baseline.
-
Because white space liquid cooling enables higher outlet temperatures n (~45°C-60°C), passive dry cooling becomes increasingly viable in areas that are not at risk of high ambient temperatures/humidity; this comes without a material energy penalty, partially decoupling the trade -o ff .
We therefore see supportive tailwinds for liquid cooling, as it directly addresses the core constraint by decoupling the power/water tradeo ff and enabling more e ffi cient scaling of high density data centers. In cases where liquid cooling is not deployed, we see a parallel investment cycle in water technologies , focused on improving water usage e ff ectiveness in evaporation systems (e.g., higher cycles of concentration, treatment chemicals) and diversifying supply (e.g., wastewater reuse, desalination), as operators seek to manage tightening water constraints without compromising capacity build out.
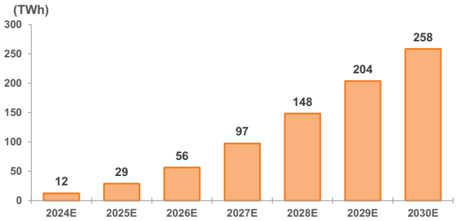
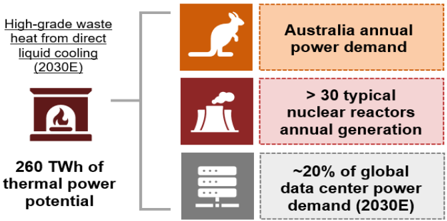
(4) Are there local users that could consume data center waste heat? Waste heat is emerging as an underappreciated asset, with potential to be increasingly unlocked by the quality and scalability of thermal output from liquid cooling adoption. Liquid cooling materially improves waste heat quality by enabling higher outlet temperatures, unlocking a meaningful pool of reusable thermal energy. We estimate ~260 TWh of high -grade waste heat could be mobilized globally by 2030 equivalent to Australia's annual power demand or the output of >30 nuclear reactors. We see early cases of waste heat reuse emerging across Europe (district heating networks) and the US (industrial and agricultural co -location), though scaling deployment will likely require building local demand - ranging from residential, commercial, and industrial use cases. Beyond circularity, heat capture could potentially also address rising community concerns around local heat build -up and environmental impact by reducing ambient thermal discharge. We see heat pumps, thermal systems, and engineering/integration services as key enablers to unlock the waste heat potential.
Data Center Cooling: The power versus water trade-o ff
We believe liquid cooling solutions will increasingly be the base case for white space cooling inside hyperscaler data centers, which our TMT team estimates 40% penetration rate of Direct to Chip (D2C) liquid cooling for AI training servers shipment by 2027. We expect data center operators - hyperscalers in particular - will prioritize water minimization, driving: (a) dry cooling solutions for ambient heat rejection where climate conditions warrant to improve water usage e ff ectiveness; or (b) sourcing alternative water supply for existing data centers that deploy evaporative heat rejection. However, we do not expect the priority of water-over-power to be ubiquitous. For example, China is prioritizing energy e ffi ciency by mandating maximum allowed PUE (1.25) for new-build data centers, which in some areas could potentially lead to greater water consumption for cooling. Together these priorities support investment opportunities levered to: (a) advanced liquid cooling; (b) water e ffi ciency innovation; and (c) water recycling/desalination. We highlight 26 Buy-rated stocks.
Detailing the power-water tradeo ff
The global data center buildout is accelerating rapidly alongside surging demand for AI and cloud infrastructure, but the key constraint is shifting: while power availability remains critical, water usage is emerging as an even more critical community priority. For data centers, water plays a critical role to e ffi ciently dissipate heat from increasingly dense, power-intensive servers, particularly as traditional cooling systems rely on evaporation or heat exchange to maintain performance. Unlike power supply, which can often be expanded through grid investment over time, water is locally constrained, highly visible to communities, and already under stress in many regions.
In Phoenix, analysis by Ceres in 2025 projected water demand from data center cooling alone to grow ~870% (from ~385 mn to >3.7 bn gallons annually - year not provided) as planned capacity comes online. This increase is occurring in a region where major reservoirs remain <40% full, highlighting an escalating con fl ict, where large data centers - consuming up to ~5 mn gallons per day - are increasingly competing with municipalities, agriculture, and other existing users for scarce water resources. We note that 385 mn / 3.7 bn gallons of annual water consumption would be equivalent to 2% / 17% of water consumption from Phoenix golf courses in 2024 based on data from the Arizona Department of Water Resources.
As water increasingly becomes a binding constraint, cooling technology is emerging as a critical investment variable. At the core is the interaction between:
- 'White space' infrastructure - the cooling loop inside the data hall, that moves heat n out of servers, including server racks, air cooling systems (CRAC/CRAH) or direct liquid cooling systems (direct-to-chip, immersion); and
- 'Gray space' infrastructure - the primary loop that rejects heat externally via n cooling towers, chillers, dry coolers and associated water and thermal systems.
This interface directly sets the water-versus-power dilemma: Evaporative gray space solutions minimize electricity usage but are water -intensive and increasingly exposed to permitting and community risks, while air -cooled systems reduce water dependency at the cost of higher electricity demand to power massive fans and compressors. As rack
CRAC: Computer Room Air Conditioner
CRAH: Computer Room Air Handler
densities climb, next generation white space cooling (e.g., direct-to-chip and immersion) becomes a key enabler, in our view, as they would allow operators to run at higher temperatures with greater cooling e ffi ciencies. In Exhibit 5, we highlight the ranges of PUE (Power Usage E ff ectiveness) and WUE (Water Usage E ff ectiveness) among di ff erent white space and gray space cooling infrastructures. Notable takeaways include:
- Legacy CRAC/CRAH = Lowest cost, but structurally ine ffi cient. Conventional n white space air cooling systems (CRAC/CRAH) sit at the lowest end of the e ffi ciency frontier, as they force a clear tradeo ff between power and water: when paired with gray space evaporative system, they achieve lower PUE (~1.4) but at high water intensity (~1.8 L/kWh), whereas air -cooled con fi gurations reduce water usage to near zero but raise PUE to 1.8. In practice, operators are not reducing system -wide water usage, but shifting it from on -site consumption to electricity use, which in turn drives water demand o ffsite through power generation (Exhibit 10). That being said, we note that air cooling systems remain dominant in smaller/legacy sites given less initial capex required and operational simplicity, compared to liquid cooling.
- Rear door heat exchangers (RDHx) = the 'upgrade sweet spot' for e ffi ciency and n densi fi cation. By removing heat directly at the rack level, RDHx improves white space cooling e ffi ciency by reducing air fl ow requirements and avoiding room -level overcooling, while supporting higher rack densities without full liquid conversion. Crucially, this higher thermal e ffi ciency reduces the overall cooling load, which in turn narrows the power/water tradeo ff - allowing operators to achieve similar performance with lower incremental reliance on either power (air -cooled systems) or water (evaporative cooling) for heat rejection. This positions RDHx as the preferred retro fi t pathway, o ff ering a more balanced outcome across power, water, and performance, with a 2x-3x capex uplift versus CRAC/CRAH.
- Advanced liquid cooling = shifts the frontier for AI infrastructures. White space n liquid cooling technologies like direct-to-chip and immersion solutions materially compress both power and water intensity (PUE ~1.2-1.4, near zero WUE without evaporation) by enabling high temperature heat rejection (~50°C-60°C), su ffi cient for passive dry coolers to replace chillers for heat rejection in ideal ambient environments. This could e ff ectively mitigate the trade o ff between water and power. However, capex ramps sharply versus CRAC/CRAH (5x-8x for direct-to-chip and 10x-20x for immersion), con fi ning adoption to hyperscale and AI deployments where density, power constraints, and permitting risks justify the economics. Given the increased growth coming from hyperscaler/AI data centers likely to use liquid cooling, there is signi fi cant industry attention on innovating to reduce the need for chillers - with NVIDIA recently detailing that its Rubin generation infrastructure can be supported by dry coolers in favorable climates.
Exhibit 5: Gray space cooling options to reject heat from the data center into the ambient environment come with a power versus water trade-o ff
Power usage e ff ectiveness (PUE) and water usage e ff ectiveness (WUE) of di ff erent white/gray space cooling solution combinations
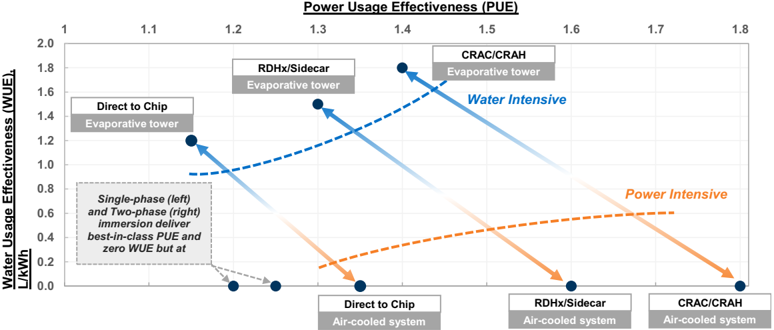
*Immersion cooling enables higher outlet temperatures (~50°C-60°C or above), allowing dry coolers to reject heat directly to ambient air without the need for chillers or evaporative towers
Source: University of Texas Energy Institute, Goldman Sachs Global Investment Research
Exhibit 6: More advanced white space liquid cooling technologies come with higher initial capex to suit the compute needs for hyperscale data centers
Capex of various white space cooling technologies as multiplier of conventional air cooling systems (CRAC/CRAH) baseline
Source: University of Texas Energy Institute, Goldman Sachs Global Investment Research
Exhibit 7: Trading lower WUE for higher PUE could potentially shift data center water consumption from onsite cooling to upstream power generation facilities indirectly
US power sector water consumption intensity by generation source and weighted average water intensity (L/kWh)
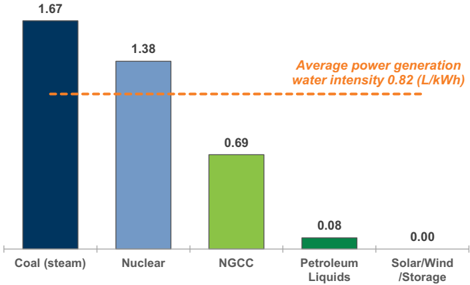
Renewables - i.e. solar, wind and battery storage - consume nearly zero water
Source: EIA, Goldman Sachs Global Investment Research
Exhibit 8: Scale of water, power, physical footprint and noise impact of various gray space cooling design
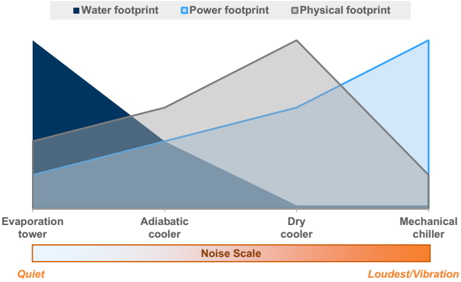
Source: SPX Cooling, Goldman Sachs Global Investment Research
Exhibit 9: Hyperscalers' reported data center PUE and WUE vary, as did the yoy trend in 2024 versus 2023 Average water usage e ff ectiveness (y-axis, L/kWh) and power usage e ff ectiveness (x-axis, total facility power to IT equipment power) of hyperscalers' data centers
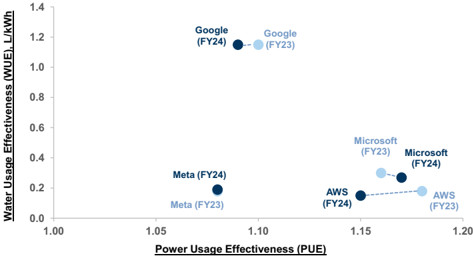
Source: Company data, Goldman Sachs Global Investment Research
Hyperscalers water stewardship, commitment and progress While the U.S. industry average data center WUE stands at ~1.8 L/kWh, hyperscaler disclosures in Exhibit 9 point to a structurally more e ffi cient operating model, with WUE typically in the ~0.1-0.5 L/kWh ranges for Meta, AWS and Microsoft. We see the gap underscores both technology advantage (more advanced cooling architectures) and site/operational optimization, reinforcing that scale players are already at advantaged levels of water intensity. We continue to expect further improvement on water e ffi ciency, as hyperscalers continue to adopt advanced cooling design and scale replenishment initiatives:
- Google (GOOGL, Buy): Google's freshwater consumption increased 34% YoY to 11 n billion gallons in 2025. The company notes that water use is mainly for direct operational input for data center cooling systems, while there are also indirect water impacts embedded in electricity generation and supply chains. Google disclosed that it has already replenished >7 bn gallons of water in 2025 and is scaling toward ~20 bn by 2030, while selectively deploying air cooled systems in water-stressed regions.
- Meta (META, Buy): Meta's water positive strategy is targeting 100% replenishment n rate in medium stress watersheds and 200% in high stress regions by 2030. The company disclosed that its nationwide water restoration projects returned ~1.6 bn gallons of water in 2024.
- Amazon (AMZN, Buy): AWS also targets to be water positive by 2030 (53% n achieved as of 2024). The company expects to return ~5 bn gallons annually through replenishment initiatives, while driving operational e ffi ciency via leak detection, recycled water use, and real -time monitoring.
- Microsoft (MSFT, Buy): Microsoft highlighted innovation and digitalization as core n to its water initiatives, with monitoring platform launched with Ecolab. The company also focuses on supply diversi fi cation via non-potable water solutions (e.g.,
2.3
1.8
CRAC/CRAH +
Evaporative system
1.0
1.8
CRAC/CRAH +
Evaporative system cooled system
- 1.2 L/kWh
1.9
1.8
2.5
CRAC/CRAH +
Evaporative system
1.1
1.8
CRAC/CRAH +
Evaporative system
•Direct water consumption for cooling (L/kWh)
1.1 L/kWh
2.2
1.5
system
0.9
1.5
system
1.8
1.5
system
1.1
1.5
system
- 1.0 L/kWh
2.7
- 0.8 L/kWh reclaimed and rainwater), including zero freshwater cooling in select geographies.
2.3
2.1
2.0
Indirect water consumption from power generation facilities Indirect water consumption from power generation can be greater than direct cooling water use, particularly where data centers are powered by water intensive sources such as coal or nuclear. Under the U.S. grid average, indirect water consumption intensity for cooling ranges from ~1.4-3.4 L/kWh, pending on the adoption of white/gray space infrastructure, with indirect portion accounting for roughly half of the total footprint when evaporative solutions are paired. Shifting from gray space evaporative to air -cooled systems while deploying white space direct-to-chip liquid cooling reduces total water consumption intensity by ~1.0 L/kWh when assuming power sourcing is consistent with the US average, but the ultimate magnitude of the bene fi t is highly dependent on the underlying electricity source on the margin. The reduction is largest when paired with relatively water -e ffi cient generation such as natural gas combined cycle (~1.1/kWh reduction) , versus ~0.9 L/kWh for nuclear and ~0.8 L/kWh for coal. There is minimal water consumption from renewable (solar + wind) power paired with battery storage, translating to a more signi fi cant potential cumulative impact if round-the-clock renewable power-focused solutions are deployed. cooled system cooled system 1.1 1.0 1.0
Direct to Chip +
Direct to Chip + Air-
Single-phase
Two-phase
Exhibit 10: Direct and indirect water consumption intensity (L/kWh) of each white space + gray space cooling technologies and power source Immersion + AirImmersion + Air-
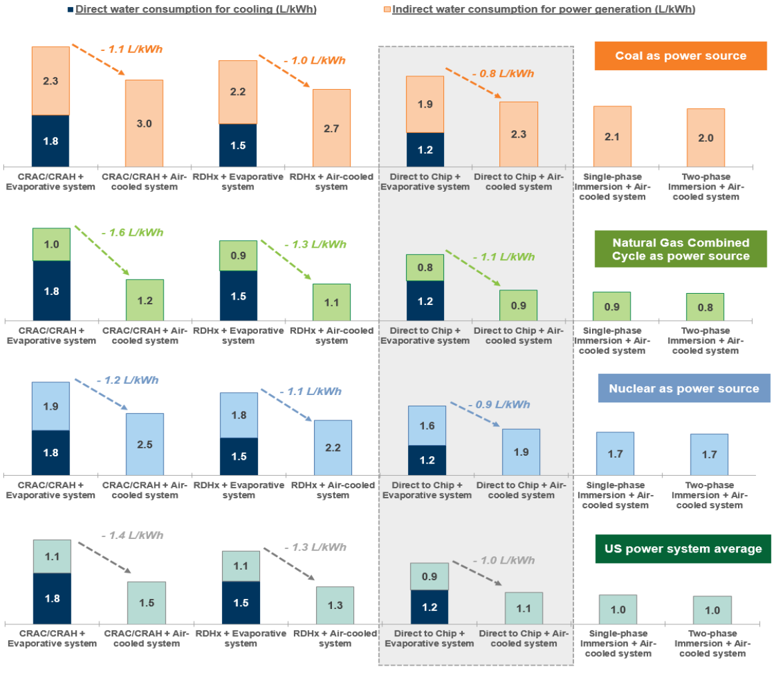
Source: EIA, University of Texas Energy Institute, Goldman Sachs Global Investment Research
3.0
cooled system
- 1.6 L/kWh
1.2
cooled system
- 1.4 L/kWh
1.5
cooled system
• Indirect water consumption for power generation (L/kWh)
Coal as power source
crusters zhongwei cluster
Horinger cluster
Inner
China Data Centers: National PUE targets mandating energy e ffi ciency
China is mandating below 1.25 PUE for new-build data centers. Under the 15th Five -Year Plan (20262030), data centers are a strategic priority for China, with a dual emphasis on energy e ffi ciency and renewable integration. Targets introduced since 2024 require nationwide data center utilization rates above 60% and average PUE below 1.5 by 2025, while new built hyperscale facilities must achieve a PUE of 1.25 or lower , with projects in national computing hubs (Exhibit 11) subject to an even stricter 1.20 PUE threshold . In our view, achieving these e ffi ciency levels will likely require or even necessitate broader adoption of advanced liquid cooling in the white space. Gul'an cluster
The regulatory focus on PUE also has implications for gray space cooling design that prioritize power over water. To meet increasingly stringent e ffi ciency requirements, we expect data center operators in China are likely to favor dry coolers and introduce free cooling where ambient conditions allow, supplemented by adiabatic assist during peak temperature periods. Unlike in the US where water is causing increasing scrutiny, evaporative cooling towers and water -cooled chillers are likely to be preferred over air -cooled chillers given their superior energy e ffi ciency. As a result, PUE targets in China may increasingly shift the optimization towards energy e ffi ciency over water, where operators would accept higher water consumption to achieve lower energy intensity. We note that according to China's green data center standard, ~0.7 L/kWh WUE is generally considered as best -in -class, while ~1.5 L/kWh WUE often serves as an upper threshold.
Together, this could increase debates over risks of water depletion where data center growth coincides with regional water stress, intensifying competition with industrial, agricultural, and residential demand. China Water Risk estimates that four of China's eight national computing hubs Jing -Jin -Ji, the Yangtze River Delta, Ningxia, and Gansu - are already exposed to high or extremely high water stress. In our view, this could further support the investment case for water e ffi ciency solutions, water recycling and, in coastal areas, desalination.
Exhibit 11: Map of China's key data center hubs and 10 clusters
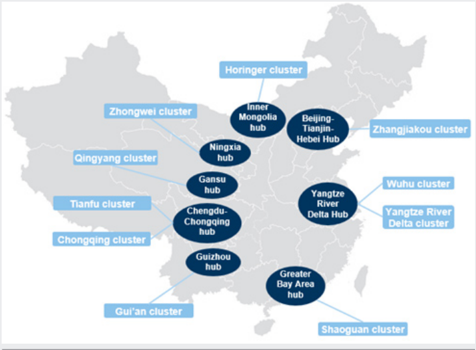
Source: Data compiled by Goldman Sachs Global Investment Research
Investment and stock implications
We see the power versus water trade-o ff of cooling emerging as a new potential bottleneck in data center scaling, supporting two of the fi ve verticals we highlighted in Exhibit 3, where solutions either reduce water intensity or expand supply.
Advanced liquid cooling solutions and components
- Advanced cooling & materials: Companies exposed to liquid cooling n (direct -to -chip, immersion) and enabling components (cold plates, pumps, connectors, thermal management systems) are best positioned as rack density structurally rises and as demand for more e ffi cient solutions becomes critical for license to operate. In parallel, advanced materials (e.g., synthetic diamond, high -conductivity substrates, phase -change materials) o ff er incremental upside by improving heat transfer and reducing overall cooling load - e ff ectively lowering both PUE and WUE.
Water e ffi ciency innovation and supply diversi fi cation
- Water recycling & desalination: As water becomes a gating constraint on data n center cooling - particularly for existing evaporative systems - solutions that expand usable water supply (e.g., desalination, wastewater reuse, and industrial water infrastructure) become increasingly important. We expect greater adoption of these technologies, driven by increasing data center demand and rising community pushback over water usage, enabling operators to meet water targets while sustaining cooling e ffi ciency. As our Japan Chemicals team discussed in its June 2026 report, Toray Industries (3402.T): IR Day: Collaboration between tech and sales MTP growth strategy for fi bers, water treatment, AI/semiconductors, Toray's management highlighted data centers as a growing opportunity for its water treatment business, citing increasing adoption of wastewater reuse and alternative water sourcing among major hyperscale operators.
- Water e ffi ciency chemicals & process optimization: Incremental solutions such as n water treatment chemicals, scale inhibitors, and cycle -of -concentration management allow operators to reuse water more times before discharge, reducing total intake without major capex changes. While less visible than cooling hardware, these are often the fastest -adopted and highest -return solutions, particularly in legacy or retro fi t environments.
We highlight 26 Buy-rated stocks.
Exhibit 12: We highlight 26 Buy-rated stocks globally with exposures to advance liquid cooling solutions and components for data centers, and cooling water e ffi ciency and supply diversi fi cation solutions
Cooling Water Solutions
| RIC | Company Name | Domicile | SUSTAIN secto | Market Cap (U$bn) | CROCI FY1-3 %ile | Sales growth FY2-3 %ile | Upside to Target Price | Data Center Advanced Liquid Cooling | Water Efficiency Innovation | Water Supply Solutions | Thematic Relevance |
|---|---|---|---|---|---|---|---|---|---|---|---|
| 2308.TW | Delta Electronics | Taiwan | Tech Hardware | 159.4 | 84% | 98% | 139% | Y | - | - | Provides liquid cooling solutions, CDUs, and precision thermal systems for AI and HPC deployments. |
| 5801.T | Furukawa Electric | Japan | Capital Goods | 16.2 | 18% | 81% | 93% | Y | - | - | Designs micro-channel cold plates for direct-to-chip cooling, along with thermal solutions for photonics systems. |
| 002518.SZ | Shenzhen Kstar | Mainland China | Capital Goods | 3.5 | 86% | 88% | 63% | Y | - | - | Manufactures modular containerised data centres, integrating air/liquid cooling systems and UPS infrastructure. |
| LGN.OQ | Legence | United States | Engineering & Construction | 8 | 97% | 63% | 51% | - | Y | - | Provides engineering, design, and implementation services for thermal systems and water-efficient infrastructure in data centres. |
| 3017.TW | AVC | Taiwan | Tech Hardware | 29.6 | 94% | 59% | 50% | Y | - | - | Produces server cooling components, including fans, vapor chambers, server enclosures, racks, cold plates, and CDUs. |
| JBL.N | Jabil | United States | Tech Hardware | 34.6 | 67% | 33% | 46% | Y | - | - | Manufactures and integrates liquid - cooled, high - power server racks and cooling subsystems. |
| 3324.TWO | Auras Technology | Taiwan | Tech Hardware | 2.7 | 83% | 76% | 39% | Y | - | - | Produces fans, heat sinks, and vapor chambers, supporting thermal management for servers and elevated operating temperatures. |
| 6407.T | CKD Corp | Japan | Capital Goods | 3 | 32% | 78% | 38% | Parts | - | - | Produces high-purity PTFE valves compatible with dielectric fluids and deionised water, used in immersion and liquid cooling systems. |
| 6501.T | Hitachi | Japan | Capital Goods | 131.8 | 50% | 60% | 34% | Y | - | - | Provides HVAC hardware i.e. centrifugal chillers and advanced liquid immersion/water-cooling technologies for AI and hyperscale facilities. |
| 3402.T | Toray Industries | Japan | Chemicals | 10.7 | 13% | 49% | 33% | - | - | Y | Supplies reverse osmosis and ultrafiltration membranes used in zero-liquid-discharge (ZLD) and water reuse systems. |
| CLS.TO | Celestica Inc | Canada | Tech Hardware | 41.4 | 85% | 83% | 32% | Y | - | - | Develops liquid-cooled server platforms, switches, and integrated CDUs used in AI compute deployments. |
| FLEX.OQ | Flex | United States | Tech Hardware | 49.8 | 40% | 20% | 30% | Y | - | - | Manufactures and integrates liquid - cooled servers, racks, and cooling assemblies for hyperscale AI platforms. |
| J.N | Jacobs | United States | Prodessional Services | 14.9 | 33% | 46% | 27% | - | Y | - | Provides engineering and design services for hyperscale data centers, specializing in water sourcing, industrial wastewater recycling, and advanced cooling infrastructure |
| XYL.N | Xylem | United States | Capital Goods | 28.8 | 75% | 16% | 26% | Parts | - | Y | Supplies pumps for chilled-water loops and heat exchangers for indoor CDUs, alongside water treatment and recycling systems. |
| JCI.N | Johnson Controls | Ireland | Capital Goods | 87.1 | 34% | 40% | 25% | Y | - | - | Offers coolant distribution units (CDUs) and direct-to-chip liquid cooling systems designed to support high-density AI workloads. |
| 6368.T | Organo | Japan | Capital Goods | 4.5 | 58% | 75% | 23% | - | - | Y | Supplies ultrapure water (UPW) treatment systems, used in high- purity cooling loops and semiconductor environments. |
| VLTO.N | Veralto | United States | Multi-industry Services | 22.8 | 77% | 39% | 22% | - | - | Y | Provides water treatment solutions for data centers, focusing on minimizing water usage for D2C and traditional cooling infrastructure. |
| 3407.T | Asahi Kasei | Japan | Chemicals | 15.7 | 32% | 23% | 21% | - | Y | - | Provides membrane technologies for water filtration and specialty polymers used in chemically resistant cooling system components. |
| CRLI.MI | Carel Industries | Italy | Capital Goods | 3.7 | 56% | 70% | 19% | Y | - | - | Provides controllers, sensors, and expansion valves for CRAC units and chillers and actively expands into liquid cooling solutions |
| SCHN.PA | Schneider Electric | France | Capital Goods | 177.6 | 51% | 64% | 19% | Y | - | - | Provides CDUs, liquid cooling infrastructure, and cooling management software for high - density AI racks. |
| NVT.N | nVent | United Kingdom | Capital Goods | 26 | 63% | 76% | 19% | Y | - | - | Provides liquid cooling enclosures, manifolds, and fluid management components for rack - level cooling. |
| 002837.SZ | Shenzhen Envicool | Mainland China | Capital Goods | 13.8 | 93% | 96% | 15% | Y | - | - | Supplies liquid cooling systems, cold plates, CDUs, and thermal management solutions for AI data centers. |
| 6254.T | Nomura Micro Science | Japan | Capital Goods | 1.1 | 23% | 98% | 15% | - | - | Y | Provides high-purity water systems required for contamination-free cooling and electronics applications. |
| VRT.N | Vertiv | United States | Capital Goods | 122.5 | 96% | 77% | 10% | Y | - | - | Supplies CDUs, liquid cooling systems, and integrated thermal management infrastructure for hyperscale data centers. |
| 6370.T | Kurita Water | Japan | Capital Goods | 6.6 | 33% | 37% | 10% | - | - | Y | Supplies water treatment chemicals, including inhibitors and biocides, used to manage scaling, corrosion, and fouling in cooling systems. |
| WBI.N | WaterBridge Infrastructure | United States | Utilities - Water | 4.2 | 69% | 94% | 7% | - | - | Y | Repurposing oilfield produced water to supply cooling infrastructure for AI data centers. |
Market data priced as of 07/10/2026 close
Source: Bloomberg, Re fi nitiv Eikon, Goldman Sachs Global Investment Research
Ambient conditions: Key factor for US and EM data center capex, power/water use fl exibility
We expect ~56%/55% of global/US new data center capacity through 2035 to be built in areas with higher physical risk of extreme temperatures, humidity and/or drought, which will likely continue to drive demand for chillers and adiabatic solutions, even as innovations to reduce chiller usage to minimize both water and power use will likely continue. We highlight 14 Buy-rated stocks exposed to smart cooling and ambient resilient cooling solutions.
Ambient conditions where data centers are being built and PUE/cooling impact
We believe ambient conditions will not only be critical to determining cooling design by setting heat rejection e ffi ciency, but also increasingly require incremental solutions like advanced materials or adiabatic assist to sustain performance. As temperatures rise or humidity increases, the thermal gradient between the data center and ambient air narrows, reducing the e ff ectiveness of both air and liquid based heat rejection. This forces greater reliance on mechanical cooling - in the sacri fi ce of energy e ffi ciency - and/or pushes operators toward higher performance thermal pathways in the white space (e.g., immersion liquid cooling, high conductivity materials) to sustain e ffi ciency.
In hot and arid regions (e.g., Middle East, U.S. Arizona), extreme peak temperature is the binding constraint. While low humidity initially supports evaporation-based cooling, water resource constraints would force data center operators under greater regulatory scrutiny. In addition, once ambient temperatures exceed ~45°C, the temperature di ff erential becomes insu ffi cient for e ffi cient heat rejection, limiting the e ff ectiveness of dry cooling, even with direct to chip cooling adopted in the white space. At this point, we see operators to embrace three pathways: (1) introduce adiabatic assist (water misting) to support dry coolers during peak conditions, (2) set up additional mechanic chillers, or (3) enable higher operating temperatures (>60°C) through higher -conductivity materials (e.g., synthetic diamond) or most advanced liquid cooling architectures such as multi -phase immersion. We note that adiabatic systems would mostly operate in dry mode for the majority of the year, switching to wet mode only during peak summer conditions (i.e. 60-90 days in wet mode for US south-west), with annualized WUE remaining relatively contained at ~0.3-0.4 L/kWh.
In tropical regions (e.g., Hong Kong, ASEAN, Miami area and parts of India), the constraint shifts to persistently high humidity, which fundamentally limits the e ff ectiveness of evaporative cooling. Once relative humidity rises into the ~75%-90% range, the air's capacity to absorb additional moisture declines sharply, reducing cooling tower performance and in some conditions rendering it ine ff ective. At the same time, high wet -bulb temperatures also impair dry cooling e ffi ciency, creating a 'double constraint' where neither approach performs optimally. As a result, operators often default to air -cooled chillers as the most reliable baseline, adopting high-ambient and e ffi ciency models at premiums, while increasingly integrating liquid cooling in the white space and hybridized gray space systems to o ff set e ffi ciency losses.
Mechanical cooling
200 ol
Exhibit 13: Microsoft data center cooling methods based on the climate of the region
High-efficiency mechanical cooling
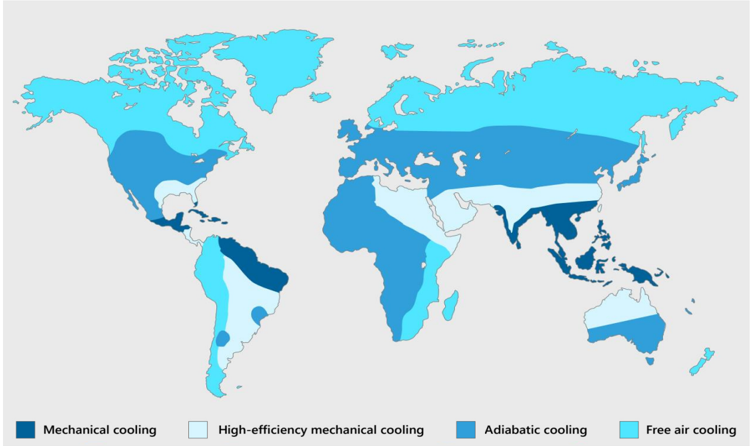
Used with permission from Microsoft.
Source: Microsoft
Ambient pro fi les of planned data centers globally
A meaningful share of upcoming data center capacity is being deployed in ambient challenged regions , with ~56% of global build out (2026-2035) exposed to a combination of water stress, humid heat stress, and frequent extreme summer peak, per our analysis (Exhibit 14). The exposure is particularly pronounced in the Middle East (100% of new capacity) and Asia Paci fi c (89% of new capacity), where heat/drought, and sustained peak summer temperatures overlap. We expect operators in those regions are more likely to deploy high -ambient air -cooled chillers, which could carry higher energy intensity, alongside incremental solutions such as gray space adiabatic assist to maintain performance.
We expect ambient factors could increasingly feed through into system-level power e ffi ciency, with regions facing greater ambient stress already operating at structurally higher PUE levels relative to more temperate markets. As a larger share of global capacity is deployed into these conditions, we see modest upward pressure on global weighted average PUE, driven by greater reliance on mechanical cooling and reduced e ff ectiveness of passive solutions. Our analysis suggests global PUE could rise from ~1.36 today to ~1.41 under the baseline scenario by 2035. Importantly, the sensitivity to white space cooling pathway choice remains signi fi cant: under higher liquid cooling adoption, global PUE could improve toward ~1.30, while under lower adoption it could deteriorate toward ~1.47, highlighting that white space liquid cooling penetration would act as a key swing factor in o ff setting the e ffi ciency drag from ambient constraints.
Exhibit 14: 49% of global data center new capacity is located in areas facing ambient challenges including drought, humid heat stress and frequent summer extreme temperatures
% of data center new-build capacity (2026-2035) facing ambient challenges
Canada
Caribbean
European data centers are less exposed to above physical risks; we measure physical risks under 2020 baseline scenario
Source: World Bank, 451 Research Datacenter KnowledgeBase, S&P Global Market Intelligence, Goldman Sachs Global Investment Research
Exhibit 15: As a result, we expect potential increase of data center PUE globally, as operators shifting towards gray space cooling solutions that could mitigate ambient challenges at higher power cost
Weighted average PUE of global data centers, baseline case
Source: 451 Research Datacenter KnowledgeBase, S&P Global Market Intelligence, Goldman Sachs Global Investment Research
Exhibit 16: Sensitivity of global weighted average data center PUE based on the level of white space liquid cooling adoption
Source: 451 Research Datacenter KnowledgeBase, S&P Global Market Intelligence, Goldman Sachs Global Investment Research
How white space cooling innovation could address gray space challenges
According to NVIDIA , its Rubin -generation AI infrastructure could achieve 100% liquid cooling across the entire system, operating with coolant temperatures up to ~45°C, which enables closed -loop operation with near zero water use and minimal reliance on chillers. In NVIDIA's view, this higher -temperature architecture allows heat to be rejected via dry coolers for most of the year, signi fi cantly reducing both cooling energy
(historically up to ~40% of data center load) and water consumption.
Notably, NVIDIA also highlights a key caveat - performance remains highly dependent on geography, with chillers still required during peak conditions. As we discussed earlier, we expect such constraint could become more pronounced in hotter or more humid environments. In our view, this reinforces the continued need for gray space support systems, including adiabatic assist and/or additional mechanic chillers, to manage peak thermal loads under challenging ambient conditions. Nevertheless, we still see continued white space innovation - enabling higher IT operating temperatures (e.g. advanced materials such as diamond cooling and immersion) - can further improve system level e ffi ciency and extend the viability of dry cooler pathways which could reduce the upward pressure on PUE in our base case.
Investment and stock implications
We see supportive tailwinds to both white/gray space cooling verticals as ambient conditions increasingly shift infrastructure design, forcing operators to move away from standardized architectures toward solutions that extend operating envelopes and optimize performance under heat and humidity constraints.
- Climate -resilient / high -ambient thermal equipment, controls and components: n Including high -ambient air -cooled chillers, adiabatic systems, humidity control, and optimization platforms that manage cooling performance under tropical, peak summer, and/or cold conditions.
- OEM (Original Equipment Manufacturer)/ODM (Original Design Manufacturer) n and engineering contractors with exposure to ambient-challenged markets: Manufacturing and integration players particularly exposed to ASEAN, India, and Middle East deployments, enabling the rollout of liquid -ready, high temperature quali fi ed platforms in climate constrained regions.
In Exhibit 17, we highlight 14 Buy-rated stocks exposed to smart cooling and ambient resilient cooling solutions.
Power generation, distribution and transmission supply chain
With data center site selection and ambient conditions likely to drive PUE higher by 11 pp in the US, which represents a 0.3% annual impact to total US power demand growth through 2030, this could continue to be a tailwind for the power generation, distribution, transmission and E&C/industrial-related supply chain.
- US Power Generation: Our US utilities team sees Buy-rated Sempra (SRE.N) and n Xcel Energy (XEL.N) among regulated utilities as key bene fi ciaries of the data center demand in fl ection with service territories largely in Texas, California, Colorado, and New Mexico. SRE's Texas subsidiary, Oncor has quanti fi ed ~127 GW of load in the 2026 ERCOT RTP with 289 GW in its broader pipeline. With extreme heat and drought conditions in the state, they are starting to see more focus on policy mandates for closed-loop cooling systems to protect water supply. For XEL, its 20 GW+ data center pipeline is also exposed to Texas but also has fast growing data center opportunities in Colorado and New Mexico where hyperscalers like Google in
its service territory have shifted towards air-cooled systems. On the IPPs side, our US utilities team sees Vistra (VST.N) and NRG (NRG.N) as highly exposed to the dynamics in Texas market where there's been pushback on water consumption given drought conditions in the state where they expect water e ffi ciency to grow in focus for the state.
- Distribution, Transmission and E&C: We also highlight Quanta Services (PWR.N) n for its E&C exposure to US power grid and AI infrastructure. In addition, we highlight Prysmian (PRY.MI) and Fujikura (5803.T) that provides power and fi bre -optic cables for US grid and data centers.
Exhibit 17: We highlight 14 Buy-rated stocks globally exposed to smart cooling and ambient resilient cooling solutions
| Data Center Resilient Cooling | Data Center Resilient Cooling | Data Center Resilient Cooling | |||||||||
|---|---|---|---|---|---|---|---|---|---|---|---|
| RIC | Company Name | Domicile | SUSTAIN sector | Market Cap (U$bn) | CROCI FY1-3 %ile | Sales growth FY2-3 %ile | Upside to Target Price | Thermal Cooling Equipment | Cooling Controls and Components | Thermal Management Integrator | Thematic Relevance |
| 2308.TW | Delta Electronics | Taiwan | Tech Hardware | 159.4 | 84% | 98% | 139% | Y | Precision cooling and air - cooled chillers (RowCool, Smart Cooling) for hot - humid Asian markets | ||
| JBL.N | Jabil | United States | Tech Hardware | 34.6 | 67% | 33% | 46% | Y | Manufactures and integrates liquid - cooled, high - temperature server racks for ASEAN and India deployments | ||
| 6501.T | Hitachi | Japan | Capital Goods | 131.8 | 50% | 60% | 34% | Y | Offers High-Ambient Screw Chillers for extreme outdoor temperatures, and an ultra-efficient line Centrifugal Chillers optimized to maximize PUE | ||
| CLS.N | Celestica | Canada | Tech Hardware | 41.4 | 85% | 83% | 32% | Y | Rack integration and thermal validation for liquid - cooling - ready platforms in hot - humid markets (i.e. ASEAN). | ||
| FLEX.N | Flex | United States | Tech Hardware | 49.8 | 40% | 20% | 30% | Y | Manufactures high - density liquid - cooled systems and enclosures for tropical and high - ambient deployments | ||
| JCI.N | Johnson Controls | Ireland | Capital Goods | 87.1 | 34% | 40% | 25% | Y | Y | High - ambient chillers (YVAA) with controls (OpenBlue) offerings for peak summer optimisation | |
| FIX.N | Comfort Systems | United States | Capital Goods | 61.8 | 99% | 84% | 23% | Y | Contractor providing large-scale mechanical, electrical, and plumbing services, with a core focus on advanced HVAC infrastructure. | ||
| CARR.N | Carrier Global | United States | Capital Goods | 57.6 | 25% | 24% | 23% | Y | High - ambient air - cooled chillers (AquaEdge, 30XV/30XBE) with adiabatic pre - cooling for tropical and >40°C environments | ||
| CRLI.MI | Carel Industries | Italy | Capital Goods | 3.7 | 56% | 70% | 19% | Y | Adiabatic control systems and humidity management (μRack, pCO, HEOS) for hot - humid environments and condensation control | ||
| SCHN.PA | Schneider Electric | France | Capital Goods | 177.6 | 51% | 64% | 19% | Y | Cooling control platforms (EcoStruxure, Uniflair) managing dry vs adiabatic vs mechanical optimisation | ||
| NVT.N | nVent Electric | United Kingdom | Capital Goods | 26.0 | 63% | 76% | 19% | Y | Heat tracing systems (Raychem) for freeze protection and winterisation of cooling infrastructure | ||
| 002837.SZ | Shenzhen Envicool | Mainland China | Capital Goods | 13.8 | 93% | 96% | 15% | Y | Precision cooling systems and air - cooled chillers (CyberCool, CyberMate) for hot - humid/tropical deployments | ||
| PH.N | Parker-Hannifin | United States | Capital Goods | 121.2 | 76% | 22% | 11% | Y | High - temperature hoses and connectors (Parflex, quick couplings) used in adiabatic and high - ambient liquid loops | ||
| VRT.N | Vertiv Holdings | United States | Capital Goods | 122.5 | 96% | 77% | 10% | Y | Y | High - ambient chillers and adiabatic systems (Liebert AFC, DSE) with integrated controls for hot - humid and peak summer conditions |
Market data priced as of 07/10/2026 close
Source: Bloomberg, Re fi nitiv Eikon, Goldman Sachs Global Investment Research
liquid cooling
(2030E)
Unlocking waste heat utilization potential
nuclear reactors annual generation
Monetizing value for waste heat from data centers is in a relatively early stage but is likely to receive greater attention both to balance community concerns and to provide increased revenue opportunities for larger data centers. We highlight 7 Buy-rated stocks that could see upside if we see greater deployment.
Capturing and monetizing waste heat potential future source of joint industry/community bene fi t
Data centers fundamentally act as large -scale energy transformers - converting electricity consumed into heat - which creates a structurally growing pool of thermal energy as compute demand scales. Every unit of power used by servers is ultimately dissipated as heat at the rack and chip level, making data centers one of the most concentrated and predictable sources of low -grade waste heat. Historically, this heat has been treated as a by -product and rejected via cooling infrastructure, but rising rack densities and energy costs are driving a shift toward viewing it as a potential resource. The challenge remains that much of this heat is produced at relatively low temperatures, limiting its direct reuse without additional processing, and constraining applications primarily to localized heating use cases.
The increasing penetration of liquid cooling is a key unlock for scalable heat reuse, as it materially raises the temperature and quality of waste heat. Compared to traditional air-cooled systems i.e. CRAC/CRAH, which typically deliver ~25°C-35°C outlet temperatures, liquid cooling (direct to chip and immersion) can achieve ~45°C-60°C or higher, bringing the heat into a usable range for district heating, industrial processes, or agricultural usage with limited to no need for upgrading. We expect direct liquid cooling could potentially unlock ~260 TWh of high grade waste heat potential by 2030 globally (Exhibit 18), equivalent to Australia's annual power demand or the annual generation of more than 30 typical nuclear reactors (Exhibit 19). As liquid cooling adoption accelerates alongside AI workloads, data centers are increasingly positioned not just as energy consumers but as integrated thermal energy hubs, with growing relevance in regions that can monetize or regulate waste heat recovery.
Exhibit 18: We expect ~260 TWh of high-grade waste heat that could be deployed towards local heating networks or industrial complex by 2030 from liquid cooling adoption… Data center waste heat potential from liquid cooling (TWh)
We deploy 85% energy reuse factor for liquid cooled facilities
Source: Goldman Sachs Global Investment Research
Exhibit 19: … Equivalent to Australia's annual power consumption or electricity generations from > 30 nuclear reactors
Source: IEA, Goldman Sachs Global Investment Research
260 TWh of thermal power
potential
Australia annual power demand
We also expect waste heat capture emerging as a practical lever to address rising community concerns around ambient heat build -up and urban heat island e ff ects.
Recent pushback to Utah's Stratos data center project highlights this dynamic, where opposition cited risks that large -scale data center developments could intensify local heat stress alongside water depletion. In this context, redirecting heat into productive use reduces thermal discharge to the environment and reframes data centers from heat sources into energy suppliers potentially - increasingly important as social license becomes a gating factor for new capacity.
What are the use cases of data center waste heat?
We see data center waste heat rapidly evolving from a by -product into a monetizable energy stream, with use cases expanding and supporting a structurally more circular infrastructure model. However, near term deployment is likely to remain highly location and infrastructure dependent, including: (1) nearby and stable residential/commercial heat demand, (2) established heat transmission infrastructure, and/or (3) co -located manufacturing facilities that can be direct consumer. Core applications of waste heat include district and building heating, industrial processes (e.g., preheating water for manufacturing), and domestic hot water supply, all of which could directly o ff set conventional energy demand. We also see higher -value use cases emerging, including absorption cooling (heat -to -cooling), agricultural applications (greenhouses), and wastewater treatment, with niche expansion into desalination and on -site industrial integration.
Europe provides an example of waste heat scalability for direct heating, where infrastructure and policy alignment accelerating deployment. Fortum (FORTUM.HE) has e ff ectively transformed an Ericsson (ERIC) data center into a heat production asset, using Mitsubishi Electric (6503.T) MEHITS heat pumps to capture server heat and upgrade it from low grade levels to ~70°C for direct injection into Kirkkonummi district heating network in Finland. The system delivered ~10-15 MWh of heat annually prior expansion, covering ~20% of the Kirkkonummi district heat network's annual heat demand, demonstrating how integrated cooling -heating infrastructure can scale with IT load and replace conventional heating sources. Fortum also recently started up waste heat capture from two Microsoft data centers in Finland to ultimately meet 40% of demand for 250,000 customers. Equinix (EQIX.N) has also demonstrated the scalability of data center waste heat reuse in Europe, using heat pumps to upgrade server heat and supply district heating networks in France and Finland.
In the US, emerging projects highlight how waste heat reuse could evolve beyond district heating into integrated, multi -output infrastructure models, particularly in regions without established heat networks. One example is the Monarch Cloud Campus in West Virginia, where up to 1 GW of hyperscale data centers will be co -located with low carbon hydrogen production and controlled environment agriculture (CEA), using waste heat and captured CO2 to supply adjacent greenhouses. The model e ff ectively creates a closed -loop energy system, where data center heat is directly monetized by lowering input costs for food production while improving overall energy e ffi ciency. More broadly, this re fl ects a shift toward co -location strategies in the US, where industrial, agricultural, or energy assets are paired with data centers to absorb waste heat locally - particularly in rural regions where district heating is less viable. The policy backdrop is also evolving, with states such as Virginia introducing legislation to promote heat reuse, signaling that regulatory support and infrastructure alignment
could accelerate adoption, similar to what has already been observed in Europe.
Investment and stock implications
We see supportive tailwinds to verticals including heat pumps and thermal recovery equipment, heat distribution and integration components, and engineering design & services, which collectively enable the scale up of data center waste heat recovery and monetization.
- Heat pumps & thermal recovery systems include water -sourced heat pumps n (WSHP), heat pump chillers, condenser heat recovery systems, and hydronic loops that capture and upgrade low grade heat to usable levels.
- Distribution & integration components include plate heat exchangers, thermal n storage tanks, piping networks, district heating interconnections, and absorption chillers, that allow operators to transport, store, and utilize heat across di ff erent applications.
- Engineering design & services that bridge cooling loads, heat demand, and n infrastructure constraints, providing engineering and consulting services to unlock waste heat recovery project economics.
In Exhibit 20, we highlight 7 Buy-rated stocks that could enable the waste heat recovery of data center projects. We do not view these as waste heat pure-plays but rather companies with technologies and competencies that could see upside if we see greater waste heat monetization.
Exhibit 20: We highlight 7 Buy-rated stocks globally that could enable the waste heat recovery potential of data centers
| Data Center Waste Heat Utilisation | Data Center Waste Heat Utilisation | Data Center Waste Heat Utilisation | |||||||||
|---|---|---|---|---|---|---|---|---|---|---|---|
| RIC | Company Name | Domicile | SUSTAIN sector | Market Cap (U$bn) | CROCI FY1-3 %ile | Sales growth FY2-3 %ile | Upside to Target Price | Heat Pumps, Exchangers Mechanical Hardwares | & Heat Transmission & Insulation | Engineering & Construction Integration | Thematic Relevance |
| ACM.N | AECOM | United States | Engineering & Construction | 8.8 | 81% | 23% | 64% | - | - | Y | Provides engineering, design, and master planning services for district energy systems, heat networks, and data center integration, including feasibility and system optimisation. |
| LGN.OQ | Legence Corp | United States | Engineering & Construction | 8.0 | 97% | 63% | 51% | - | - | Y | Provides engineering and system integration services to design high-efficiency thermal systems and heat recovery infrastructure, including cooling-heat reuse coupling. |
| ENR1n.DE | Siemens Energy | Germany | Capital Goods | 149.5 | 84% | 73% | 39% | Y | - | - | Supplies heat pumps, grid integration, and energy systems that support large-scale heat networks and integration of data center waste heat into energy systems. |
| 6503.T | Mitsubishi Electric Corp | Japan | Capital Goods | 76.3 | 50% | 46% | 27% | Y | - | - | Manufactures water-sourced heat pumps and cooling systems that capture low-grade data center heat and upgrade it (~30-35°C to ~60-70°C) for district heating or reuse. |
| SCHN.PA | Schneider Electric | France | Capital Goods | 177.6 | 51% | 64% | 19% | - | - | Y | Offers data center infrastructure, cooling control systems, and energy management software enabling real-time optimisation, heat recovery, and integration with district systems. |
| DOV.N | Dover Corp | United States | Capital Goods | 29.0 | 48% | 25% | 18% | Y | - | - | Supplies fluid management components, including pumps, connectors, and thermal management systems, used in liquid cooling loops and heat recovery infrastructure. |
| ROCKb.CO | Rockwool A/S | Denmark | Construction Materials | 6.7 | 23% | 31% | 17% | - | Y | - | Produces insulation materials used in data centres and district heating networks, reducing thermal losses and improving efficiency of heat transport and reuse. |
Market data priced as of 07/10/2026 close
Source: Bloomberg, Re fi nitiv Eikon, Goldman Sachs Global Investment Research
Appendix: More on our PUE analysis methodology
Power Usage E ff ectiveness (PUE) assumptions
Our PUE analysis (Exhibit 15, Exhibit 16) leverages the data center location and facility -level dataset from the S&P 451 Research Datacenter KnowledgeBase to map each new build to its likely cooling con fi guration across both white space and gray space. However, we caveat that 451 database captures less facilities for data centers in APAC, particularly Greater China. For white space , we assign cooling pathways based on disclosed design characteristics and facility type. In addition to data centers that explicitly indicate liquid cooling in their design, we assume hyperscale, neocloud, and AI -led facilities also adopt liquid cooling, re fl ecting their higher rack densities. On this basis, we estimate ~43% of upcoming global capacity will deploy liquid cooling, which we view as a conservative assumption relative to our TMT team's forward penetration estimates. For gray space , we layer in our physical risk framework using each facility's geographic location in partnership with GS Data Works. Data centers located in high risk regions (water stress, heat stress, or frequent extreme temperatures) are assumed to require more energy intensive cooling con fi gurations, including greater reliance on air -cooled chillers or additional mechanical chilling to reject heat under constrained ambient conditions, e ff ectively resulting in higher PUE. Based on these combined assumptions, we assign below PUE parameters - referenced to the study by University of Texas at Austin - at the individual data center level, re fl ecting both cooling architecture and local environmental constraints:
- White space (liquid cooling) + Gray Space (high ambient risk location): PUE = n 1.35
- White space (liquid cooling) + Gray Space (low ambient risk location): PUE = 1.15 n
- White space (air cooling) + Gray Space (high ambient risk location): PUE = 1.80 n
- White space (air cooling) + Gray Space (low ambient risk location): PUE = 1.40 n
To re fl ect China's regulatory requirement that new data centers operate at a PUE of no more than 1.25, we assign a PUE assumption of 1.25 to all newly built Chinese facilities. We note that achieving this PUE level will likely necessitate greater deployment of advanced liquid cooling in the white space, particularly for data centers located in regions facing ambient challenges. When combined with gray space cooling, this could result in relatively higher water intensity in order to keep PUE at or below country mandates.
GS Data Works leverages alternative data sources and advanced analysis techniques to create unique data-driven insights across Global Investment Research.
GS Data Works analysis provided by Dan Duggan, Ph.D. and Dhruv Goyal.
Data Center ambient constraint screening thresholds
Water stress: We focus on data center locations classi fi ed as High (75%-100% usage of available renewable resources) and Extremely High (>100% usage of available renewable resources) risk, where water demand already exceeds or materially stretches renewable supply. In these environments, evaporative cooling becomes structurally constrained, as additional withdrawal ampli fi es depletion risks and increases exposure to regulatory limits and community pushback.
Heat stress: We focus on data center locations with at least one day in the Red Zone (88.0°F-89.9°F WBGT, High Risk) or Black Zone ( ≥ 90.0°F WBGT, Extremely High Risk), where high temperature and humidity jointly reduce the e ff ectiveness of gray space heat rejection. Under these conditions, both evaporative and passive dry cooling e ffi ciency deteriorate materially, increasing reliance on mechanical chilling.
Frequency of extreme temperature: We include data center locations experiencing ≥ 20 consecutive days above 95°F (High Risk), including ≥ 60 days for Extremely High Risk, where peak heat exposure is sustained rather than episodic. In these environments, cooling systems operate under persistent thermal stress, reducing e ffi ciency and increasing baseline power demand.
The physical risk assumptions come from our January 2024 Adaptation framework. We fi nd risk trends to be directionally indicative of environmental stresses while noting that the RCP 8.5 scenario, a worst-case RCP parameter set, was in May 2026 deemed 'implausible, based on trends in the costs of renewables, the emergence of climate policy and recent emission trends' in a report by the World Climate Research Programme.