PDF 原檔:260824_AI供應鏈_ms_google-asic-design-services_original.pdf
已驗證圖片清單(Step 2.5)
共抽出 27 張,逐張 Read 驗證 12 張(其中 7 張標為可嵌入真資料圖);其餘為 Risk Reward/估值/租金/售價等附屬圖,未逐張驗證亦不建議嵌入。
| 檔案 | 對應 Exhibit | 內容(親眼所見) | 分類 |
|---|---|---|---|
260824_AI供應鏈_ms_google-asic-design-services_002.png |
Exhibit 9 | 2027 GPU/ASIC 晶片推算耗電圓餅,合計 38GW:NVIDIA 16、Google 9、AMD 7、AWS 2、Microsoft 1、Meta 1、Others 1(GW) | ✅ 真資料圖 |
..._003.png |
Exhibit 10 | 由 TSMC CoWoS 出貨推算之 GPU/ASIC 總耗電堆疊柱:2025 約 10GW(NVIDIA 6.3)、2026 約 19.4GW(NVIDIA 11.1/Google 4.0/AMD 1.9/AWS 2.0)、2027 約 38GW(NVIDIA 16.3/Google 9.2/AMD 7.5/AWS 2.4) | ✅ 真資料圖 |
..._004.png |
Exhibit 11 | 2027e CoWoS 分配與 HBM 需求全表截圖(各晶片 CoWoS 片數/每片顆數/推算出貨/HBM 世代與供應商),合計 CoWoS 2,664k 片、HBM 需求 48,618 mn Gb | ✅ 真資料圖(表格截圖,與正文表格同源) |
..._005.png |
Exhibit 14 | 全球 CoWoS 需求 2026e vs 2027e 分客戶長條(k wafers):NVIDIA 780→1,222、Broadcom 300→484、AMD 130→530、MediaTek 40→180、AWS/Annapurna 62→90、AWS/Alchip 26→36、Marvell 17→64、GUC 14→60 | ✅ 真資料圖 |
..._006.png |
Exhibit 16 | CoWoS 供給產能(各年底,kwpm)TSMC vs Non-TSMC(Amkor/UMC/ASE):2023 13+3、2024 32+6、2025 70+23、2026e 120+50、2027e 200+80 | ✅ 真資料圖 |
..._007.png |
Exhibit 17 | 全球 CoWoS 消耗量分客戶堆疊柱 2023-2027e(k wafers),2027e 約 2,690k | ✅ 真資料圖 |
..._010.png |
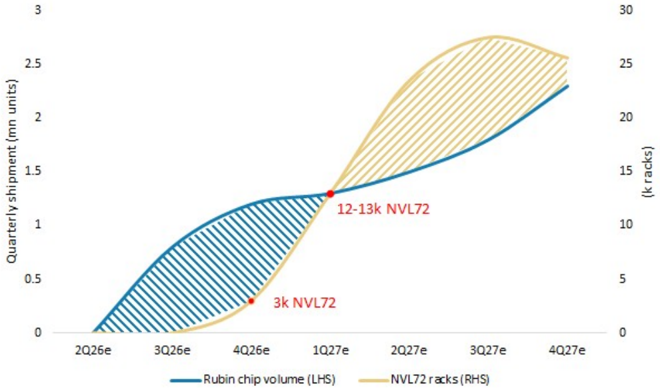
Exhibit 22 | Rubin 晶片季出貨(mn units,左軸)vs VR NVL72 機櫃(k racks,右軸),標註 4Q26e「3k NVL72」、1Q27e「12-13k NVL72」 | ✅ 真資料圖 |
..._013.png |
Exhibit 25 | TSMC AI 營收拆解 2021-2029e(US$bn),分 General-purpose AI/Custom AI chips (ASICs)/CoWoS+wafer test/AI server CPU,標註 2024-2029e CAGR 60%,2029e 逾 120bn | ✅ 真資料圖 |
..._025.png |
— | 世芯-KY 股價與目標價沿革(2023-2026),最新 PT 5088 | ⬜ 附屬(評等沿革) |
..._026.png |
— | 創意電子股價與目標價沿革(2023-2026),最新 PT 5688 | ⬜ 附屬(評等沿革) |
..._027.png |
— | 聯發科股價與目標價沿革(2023-2026),最新 PT 5588 | ⬜ 附屬(評等沿革) |
..._001.png |
Exhibit 1 | TPU v10 分工示意(Google KGD/記憶體 HBM/MediaTek Electrical I/O Die/Marvell 等 Memory I/O/GUC 等 3D IC-CPO) | ✅ 真資料圖(結構分工圖,已嵌 供應鏈_GoogleTPU) |
未逐張驗證:
..._008/009/011/012/014-024.png(Blackwell 機櫃對照、P/E 趨勢、GPU 租金、5090 售價、Risk Reward 版面等),內容已由正文涵蓋,不嵌入 lib。
原始內容
M August 24, 2026 02:35 PM GMT
Asia-Pacific Technology | Asia Pacific
AI Supply Chain: Google ASIC, who gets what for design services?
With the complexity of TPU v10, we see room for multiple design service providers to contribute 'blocks' for MediaTek to build v10 chips. We reiterate OW on MediaTek, and raise GUC and Alchip PTs on expected larger revenue size in 2027/2028.
What's new? Investors have recently been interested in several chip designers who stated they are associated with Google TPU-related projects. In Joe Moore's report Marvell: Thoughts on MRVL Google Opportunity (19 Aug 2026), there is some discussion that AMD may also be involved in TPUv10. On July 31, Taiwan's GUC stated its confidence in engaging with project design services for Google TPU, while on Aug 14, Taiwan's Alchip also indicated Google's COT (customer-owned tooling) business model would provide Alchip with an opportunity to win Google-related design services. So, is everyone winning?
We think MediaTek remains the major coordinator for TPU v10: According to Joe, Marvell is winning additional content around TPU rather than replacing core TPU itself. We would not yet assume it is displacing the existing TPU designers (Broadcom in the US [covered by Joe], and MediaTek in Taiwan). Our view from Asia is that we do see more 'blocks to build' for TPU v10 so more design service providers may be included in the same project. We see three key trends in Google TPU v10:
- KGD (known good die) for compute die, which means Google owns the compute die design and the tool (photomask), and has some flexibility to include other design services for that compute die backend-design service.
- Adoption of 3.5D packaging. It requires 3D IC stack the compute die on other attached dies, and that needs a 3D IC IP vendor for the design service.
- Larger reticle size. The chip reticle size may further expand to >12 reticles, vs. currently around 9 reticles.
We think TPU v10 continues to use Intel EMIB-T given the larger reticle size, while MediaTek's SerDes IP is also improving, creating some stickiness to MediaTek's design service. We suggest to accumulate MediaTek on its recent share price dip. The stock trades at 12x 2028 EPS.
Raising target prices for both GUC and Alchip - attractive on 2028 valuations
- Raising GUC PT to NT$6,288, given better TSMC 3nm allocation in 2027, and its Meta/Microsoft projects wins. The company also announced the issue of a CB to enlarge business scale. Stock trades at 25x 2028 EPS.
- Raising Alchip PT to NT5,888, based on US$8bn revenue contribution from Trainium4, implying 60% Y/Y of 2028 EPS. Stock trades at 10x 2028 EPS.
Idea
| Morgan Stanley Taiwan Limited+ | ||
|---|---|---|
| Charlie Chan Equity Analyst | ||
| Charlie.Chan@morganstanley.com | +886 2 2730-1725 | |
| Daniel Yen, CFA Equity Analyst | ||
| Daniel.Yen@morganstanley.com | +886 2 2730-2863 | |
| Morgan Stanley Asia Limited+ | ||
| Daisy Dai, CFA Equity Analyst | ||
| Daisy.Dai@morganstanley.com | +852 2848-7310 | |
| Morgan Stanley Taiwan Limited+ | ||
| Tiffany Yeh | ||
| Equity Analyst Tiffany.Yeh@morganstanley.com | +886 2 7712-3032 | |
| Lucas Wang | ||
| Research Associate | ||
| Lucas.Wang@morganstanley.com | +886 2 2730-2875 | |
| Morgan Stanley Asia Limited+ | ||
| Ethan Jia | ||
| Research Associate Ethan.Jia@morganstanley.com | +852 3963-2287 | |
| Henry Zhao | ||
| Research Associate | ||
| Henry.Zhao@morganstanley.com | +852 2239-7731 | |
| What's Changed | ||
| Global Unichip Corp | ||
| (3443.TW) | From | To |
| Price Target | NT$5,688.00 | NT$6,288.00 |
| Alchip Technologies Ltd | ||
| (3661.TW) | From | To |
| Price Target | NT$5,088.00 | NT$5,888.00 |
Morgan Stanley does and seeks to do business with companies covered in Morgan Stanley Research. As a result, investors should be aware that the firm may have a conflict of interest that could affect the objectivity of Morgan Stanley Research. Investors should consider Morgan Stanley Research as only a single factor in making their investment decision.
+= Analysts employed by non-U.S. affiliates are not registered with FINRA, may not be associated persons of the member and may not be subject to FINRA restrictions on communications with a subject company, public appearances and trading securities held by a research analyst account.
M
1. Google AI ASIC TPU provided by MediaTek in Asia
TPU v10 is the project that can involve many
We see three key trends in Google TPU v10: 1) KGD (known good die) for compute die, which means Google owns the compute die design and the tool (photomask), and has some flexibility to include other design services for that compute die backend-design service. 2) Adoption of 3.5D packaging. It requires 3D IC stack the compute die on other attached dies, and that needs a 3D IC IP vendor for that part of the design service. 3) Larger reticle size. The chip reticle size may further expand to >12 reticles, vs. currently around 9 reticles.
Investors have recently been interested in several chip designers who stated they are associated with Google TPU-related projects, including but not limited to:
- 1) Marvell (covered by Joe Moore) which disclosed an expanded partnership with Google (covered by Brian Nowak) across a range of custom silicon programs that attach to the TPU ecosystem, including inference accelerators, storage controllers, NICs, memory interface controllers, and near memory compute.
- 2) In Joe's report Marvell: Thoughts on MRVL Google Opportunity (19 Aug 2026), there is some discussion that AMD may also be involved in TPUv10.
- 3) On July 31, Taiwan's GUC stated its confidence in engaging with project design services for Google TPU.
- 4) On Aug 14, Taiwan's Alchip also indicated Google's COT (customer-owned tooling) business model would provide Alchip with an opportunity to win Googlerelated design services. So, is everyone winning?
Our view from Asia is that we do see more 'blocks to build' for TPU v10 so more design service providers may be included in the same project.
Idea
M
Exhibit 1: We believe MediaTek would still at least handle the packaging and I/O die for TPU v10, of which the revenue recognition could still be higher than TPU v9
| KGD(Known Good Die) /Compute die | |
|---|---|
| Memory Suppliers | HBMChip |
| MediaTek | Electrical I/O Die |
| Marvell or others | Memory I/O |
| GUCorothers | 3D IC/CPO |
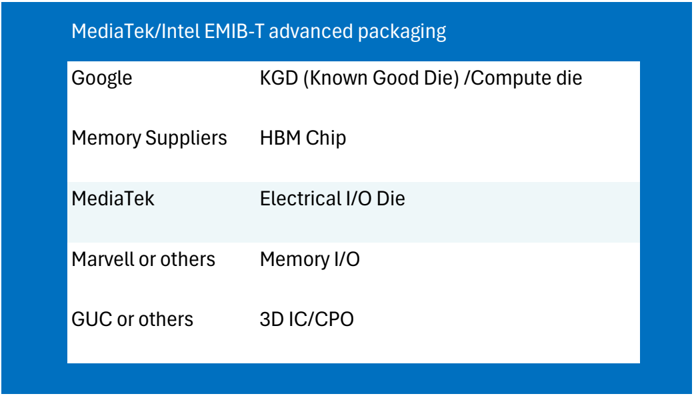
Source: Morgan Stanley Research estimates
MediaTek TPU revenue could reach US$70bn by 2029 even under a COT (customer-owned tooling) model
We believe MediaTek remains the major integrator of TPU v10 (IceFish) and its responsibility is very similar to what it does for TPU v9 (HumuFish), in that: 1) I/O die design with its own SerDes IP; 2) chip packaging integration compute die KGD, I/O die, and HBM chips. MediaTek's content per chip (ASP) can increase at TPU v10, given larger die size of the I/O dies vs. TPU v9.
Our assumption for MediaTek's 2027 and 2028 TPU revenue remains unchanged at US$1315bn and US$$43-45bn, respectively, by forecasting 3mn units of TPU v8t in 2027 and 1mn/3mn units of TPUv8t/v9 in 2028. For 2029, we expect the demand for TPU v9 will continue to increase while TPU v10 starts to ramp up. We currently project 4mn units of TPU v9 in 2029 and around 1mn units of TPU v10, leading to around US$70bn of TPU revenue.
MediaTek TPU v10 single chip ASP/revenue recognition could still be higher than TPU
v9: On TPU v10, we believe the project will be closer to a COT model where different parties might handle different functions or "blocks" within the projects. For example, Google will handle the design and production of compute die and provide the die to MediaTek as a KGD (known good die) and let MediaTek finish the final packaging at Intel EMIB-T. Google owns the compute die design and the tool (photomask), and has some flexibility to include other design services for that compute die backend-design service.
MediaTek's role in handling the I/O die could remain the same as what it has done for TPU v8t and TPUv9. Even without recognizing the KGD/compute die revenue, our industry checks suggest MediaTek could still book higher single chip ASP/revenue than TPU v9, where we now expect the ASP for MediaTek could be US$18k per TPU v10.
M
Exhibit 2: We expect MediaTek 2029 TPU revenue to reach US$70bn
| 2027e | 2028e | 2029e | ||
|---|---|---|---|---|
| TPU v8t (Zebrafish) | 3 | 1 | ||
| Volume (mn) | TPU v9 (Humufish) | 3 | 4 | |
| TPU v10 (Sunfish) | 1 | |||
| Chip ASP Recognized by MediaTek (US$k) | TPU v8t | 4.5 | 4.5 | |
| TPU v9 | 13 | 13 | ||
| TPU v10 | 18 | |||
| TPU v8t | 13.5 | 4.5 | ||
| TPU Revenue (US$bn) | TPU v9 | 39 | 52 | |
| TPU v10 | 18 | |||
| Total TPU Revenue | 13.5 | 43.5 | 70 | |
| Total MediaTek Revenue (US$bn) | 35 | 67 | NA | |
| %of TPU Revenue | 38% | 65% | NA |
Source: Morgan Stanley Research estimates
Exhibit 3: Morgan Stanley Asia Research forecast on TPU shipments
| k Units | 2023 | 2024 | 2025e | 2026e | 2027e | 2028e |
|---|---|---|---|---|---|---|
| v5 | 500 | 2,400 | 250 | |||
| v6 (Trillium) | 1,200 | |||||
| v7 (Ironwood, by Broadcom) | 300 | 2,300 | 200 | |||
| v8i (Sunfish; 3nm, by Broadcom) | 900 | 4,000 | 2,500 | |||
| v8t (Zebrafish; 3nm, by MediaTek) | 500 | 3,000 | 1,000 | |||
| v9 (Humufish; 2nm, by MediaTek) | 150 | 3,000 | ||||
| v10 (Icefish; 1.4nm, by MediaTek) v10a (Merope; 2nm, by US design service) | unknown unknown | |||||
| Total | 500 | 2,400 | 1,750 | 3,700 | 7,350 | >6500 |
Source: Morgan Stanley Research estimates
Google CPU should be the largest customer for GUC in 2026-2028: In 2026, Google CPU volume is falling a little short of our original forecast given the capacity constraints. We therefore now forecast only 1.2-1.3mn units of Google Axion2 CPU in 2026 vs. our initial forecast of 1.5mn-2mn. By assuming chip ASP at around US$700, we now see 2026 Google CPU contributing US$900-1000mn.
For 2027, we have been seeing strong upward demand revisions for Google CPU, including some push out of Axion2 from 2026 and the ramp of next generation Axion3. We now expect Google CPU revenue of close to US$2.8bn, including 3mn units of Axion2 and 500k units of Axion3. In addition, we also expect the chip ASP of Axion3 to double from Axion2 given the increase of 3nm compute die from one to two.
For 2028, we now forecast only 2.5mn units of Axion3, lower than Axion2's annual run rate of 3-4mn units, mostly also driven by the doubling of compute die.
CPU turnkey revenue carries a low gross margin for Google CPU - likely around 10% because this is a 'Turnkey 2 or 3' project, where GUC provides advanced packaging design support (e.g., silicon interposer and ABF substrates) but does not own the photomasks for the ASIC designs. We also expect Axion3 margin to be slightly lower than Axion2 given higher chip ASP or larger project size.
Note, these forecasts are from Asia Pacific research and incorporate supply chain and industry checks.
M
2. AWS AI ASIC Trainium provided by Alchip in Asia
Alchip might achieve US$8bn revenue for Trainium4 in 2028: During its latest earnings call, Alchip management mentioned that it believes its Trainium4 TAM could be similar to Google TPU. Our industry checks suggest the Trainium4 volume in 2028 could be at least 2.5mn units. By suggesting Trainium4 ASP of around US$10k without HBM and Alchip getting around 30% of the turnkey allocation (similar to Trainium3 of around one-third), we now see the revenue contribution of Trainium4 to be US$8bn in 2028, higher than our initial forecast of US$4bn. We therefore also raise our price target for Alchip to NT$5,888, implying >50% upside and a potential win of a second CSP customer.
Exhibit 4: Alchip 2028 Trainium revenue could reach US$8bn
| 2026e | 2027e | 2028e | ||
|---|---|---|---|---|
| Volume (k) | Trainium3 Trainium4 | 400 | 600 | 800 |
| Chip ASP Recognized by Alchip (US$k) | Trainium3 Trainium4 | 4.6 | 4.6 | 10 |
| TPU Revenue (US$bn) | Trainium3 Trainium4 | 1.8 | 2.8 | 8 |
| Total Trainium Revenue | 1.8 | 2.8 | 8 | |
| Total Alchip Revenue (US$bn) | 3.1 | 4.4 | 9.8 | |
| %of Trainium Revenue | 60% | 63% | 82% |
Source: Morgan Stanley Research (e) estimates
Exhibit 5: Morgan Stanley Asia Research forecasts for Trainium shipments
| k Units | 2023 | 2024 | 2025e | 2026e | 2027e | 2028e |
|---|---|---|---|---|---|---|
| Trainium1/Inferentia2 | 300 | 600 | 30 | |||
| Trainium2 | 300 | 1,200 | ||||
| Trainium3 | 85 | 1,700 | 2,380 | - | ||
| Trainium4 | unknown | 2,500 | ||||
| Total | 300 | 900 | 1,315 | 1,700 | 2,380 | 2,500 |
Source: Morgan Stanley Research (e) estimates
Alchip Trainium3 margin could be better: We believe our initial forecast of Trainium3 allocation to Alchip was a bit too aggressive and we therefore now revise down the revenue contribution slightly to US$1.8bn and US$2.8bn for 2026 and 2027, respectively. However, we do believe Alchip has very good support from TSMC given large Trainium ASIC volume, suggesting better than expected margins. We now expect the Trainium3 margin to be close to high-teens % rather than our original expectation of low-mid teens %.
Exhibit 6: Alchip: Major customer breakdown
| Revenue (US$ mn) | 2025e | 2026e | 2027e | 2028e | 2025 Y/Y | 2026 Y/Y | 2027 Y/Y | 2028 Y/Y |
|---|---|---|---|---|---|---|---|---|
| NRE | ||||||||
| Total NRE | 321 | 400 | 450 | 500 | -15% | 25% | 13% | 11% |
| Turnkey | ||||||||
| AWS | 100 | 1,800 | 2,800 | 8,000 | -86% | 1700% | 56% | 186% |
| Intel Habana | 300 | 0 | 0 | 0 | 50% | -100% | NA | NA |
| Amazon Lab126 | 40 | 50 | 50 | 50 | -33% | 25% | 0% | 0% |
| Sony | 20 | 0 | 0 | 0 | -60% | -100% | NA | NA |
| Chinese CPU | 10 | 200 | 300 | 300 | -75% | 1900% | 50% | 0% |
| Li Auto | 20 | 350 | 500 | 700 | NA | NA | NA | NA |
| Japan Consumer | 30 | 100 | 100 | 100 | NA | NA | NA | NA |
| Others | 143 | 150 | 180 | 150 | -25% | 5% | 20% | -17% |
| Total turnkey | 663 | 2,650 | 3,930 | 9,300 | -47% | 300% | 48% | 137% |
| Total revenue | 984 | 3,050 | 4,380 | 9,800 | -39% | 210% | 44% | 124% |
Source: Company data, Morgan Stanley Research (e) estimates
M
3. Microsoft and Meta AI ASIC provided by GUC in Asia
GUC's Microsoft demand should also more than double into 2027: GUC also helps with the Maia 200 and Cobalt 200 CPU for Microsoft. Our checks indicate the demand from Microsoft has also be enhanced over the past quarter, of which GUC management suggests the demand should more than double in 2027. We now forecast at least US $250mn of GUC revenue contribution from Microsoft in 2027.
Meta ASIC (MTIA 600): In our AI supply chain tracker, we noted that we believe GUC could win one of the Meta ASIC projects led by the Rivos team, and we now think it might be MTIA 600 based on supply chain checks. The AI ASIC targets tape-out in 1H27, with potential CoWoS out by 2027 year-end or 1H28.
Revise up GUC price target to NT$6,388 on more 2027 3nm wafer allocation: We also raise GUC PT to NT$6388, given more TSMC 3nm wafer allocation in 2027, and also GUC's potential 3D IC design service for Google TPU v10 in 2028. Larger 3nm wafer allocation also leads stronger Google CPU contribution in our forecasts.
Exhibit 7: We expect US CSP projects to contribute >50% of GUC's 2026 revenue
| Revenue (US$ mn) | 2025e | 2026e | 2027e | 2028e | 2025 Y/Y | 2026 Y/Y | 2027 Y/Y | 2028 Y/Y |
|---|---|---|---|---|---|---|---|---|
| NRE | ||||||||
| Normal NRE projects | 76 | 100 | 130 | 150 | -49% | 32% | 30% | 15% |
| Ship-outs | 185 | 200 | 220 | 250 | 68% | 8% | 10% | 14% |
| Total NRE | 261 | 300 | 350 | 400 | 0% | 15% | 17% | 14% |
| Turnkey | ||||||||
| US CSPs | 210 | 1,030 | 4,050 | 6,600 | 600% | 390% | 293% | 63% |
| Others | 621 | 670 | 1,350 | 1,400 | 31% | 8% | 101% | 4% |
| Total turnkey | 831 | 1,700 | 5,400 | 8,000 | 65% | 105% | 218% | 48% |
| Others | ||||||||
| IP | 8 | 17 | 17 | 17 | -43% | 113% | 0% | 0% |
| Total revenue | 1,100 | 2,017 | 5,767 | 8,417 | 41% | 83% | 186% | 46% |
Source: Company data, Morgan Stanley Research (e) estimates
Exhibit 8: GUC: Major customer breakdown
| Revenue (US$ mn) | 2025e | 2026e | 2027e | 2028e | 2025 Y/Y | 2026 Y/Y | 2027 Y/Y | 2028 Y/Y |
|---|---|---|---|---|---|---|---|---|
| NRE | ||||||||
| Normal NRE projects | 76 | 100 | 130 | 150 | -49% | 32% | 30% | 15% |
| Ship-outs | 185 | 200 | 220 | 250 | 68% | 8% | 10% | 14% |
| Total NRE | 261 | 300 | 350 | 400 | 0% | 15% | 17% | 14% |
| Turnkey | ||||||||
| Microsoft | 60 | 80 | 250 | 400 | 100% | 33% | 213% | 60% |
| 150 | 950 | 2,800 | 3,500 | NA | 533% | 195% | 25% | |
| Korean AI Start-up | 0 | 20 | 0 | 0 | NA | NA | -100% | NA |
| Tesla | 0 | 0 | 800 | 1,800 | NA | NA | NA | 125% |
| US CSPs | 0 | 0 | 200 | 900 | NA | NA | NA | NA |
| Amazon Lab 126 | 0 | 50 | 100 | 100 | NA | NA | 100% | 0% |
| SK Hynix | 50 | 10 | 10 | 10 | -38% | -80% | 0% | 0% |
| Sandisk | 0 | 20 | 250 | 250 | NA | NA | 1150% | 0% |
| Horizon | 0 | 20 | 500 | 500 | NA | NA | 2400% | 0% |
| Suzhou Centec | 54 | 27 | 14 | 7 | -50% | -50% | -50% | -50% |
| Macronix | 56 | 68 | 81 | 98 | 30% | 20% | 20% | 20% |
| DJI | 35 | 10 | 5 | 5 | -31% | -71% | -50% | 0% |
| Aspeed | 105 | 121 | 139 | 150 | 50% | 15% | 15% | 8% |
| Sony | 29 | 26 | 23 | 21 | -10% | -10% | -10% | -10% |
| Other turnkey | 292 | 298 | 228 | 260 | 221% | 2% | -24% | 14% |
| Total turnkey | 831 | 1,700 | 5,400 | 8,000 | 65% | 105% | 218% | 48% |
| Ex-US CSP turnkey | 621 | 670 | 1,550 | 2,300 | 31% | 8% | 131% | 48% |
| IP | ||||||||
| Google (GLink) | 2 | 5 | 5 | 5 | NA | 150% | 0% | 0% |
| Microsoft (HBM3E) | 4 | 5 | 5 | 5 | 0% | 25% | 0% | 0% |
| Others | 2 | 7 | 7 | 7 | -80% | 250% | 0% | 0% |
| Total revenue | 1,100 | 2,017 | 5,767 | 8,417 | 41.2% | 83.4% | 185.9% | 46.0% |
Source: Company data, Morgan Stanley Research (e) estimates
M
2027 Global GPU/ASIC Total Power Consumption
Implied chip volume vs. electricity consumption (GW) frequently discussed, suggesting power supply remains a global bottleneck
We recently published Asia-Pacific Technology: Connecting Dots: HK investors' feedback on Asian semis (9 Aug 2026) . During our recent Hong Kong marketing trip, investors questioned whether power infrastructure can support our projected 2027 CoWoS-implied chip volume of approximately 19mn units. Assuming an average TDP of 2kW per GPU/ ASIC, the installed base would require roughly 38GW of power capacity.
Conversely, when SpaceX (covered by Adam Jonas) indicated plans to expand its computing capacity from 2GW by the end of this year to nearly 10GW under an ambitious scenario (see SpaceX: Strong Beat/Outlook vs. Higher Capex ), investors also asked what this would imply for TSMC's CoWoS capacity consumption. Notably, Adam models only 3GW of incremental computing demand, reaching 5GW by end-2027. As a rough illustration, the additional 8GW implied by SpaceX's target would equate to approximately 4mn Rubin GPUs, or roughly 20% of the AI accelerators that TSMC could produce in 2027.
Exhibit 9: 2027 GPU/ASIC chip-implied power consumption - 38GW in total
2027 GPU/ASIC total power consumption (GW)
Source: Morgan Stanley Research estimates
M
Exhibit 10: GPU/ASIC total power consumption from TSMC CoWoS shipment
GPU/ASIC total power consumption (GW)
Source: Morgan Stanley Research estimates
M
Global CoWoS Capacity Allocation
Exhibit 11: AI HBM consumption: Up to 50bn Gb in 2027
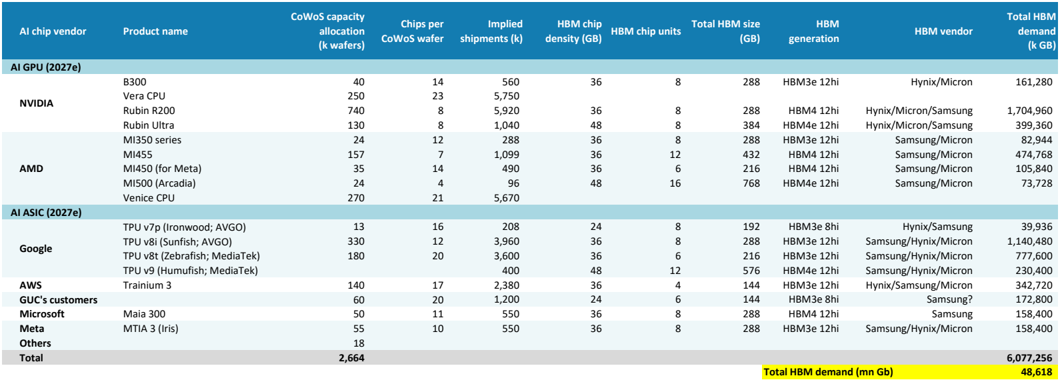
| AI chip vendor | Product name | CoWoS capacity allocation (k wafers) | Chips per CoWoS wafer | Implied shipments (k) | HBMchip density (GB) | HBMchip units | Total HBMsize (GB) | HBM generation | HBMvendor | TotalHBM demand (k GB) |
|---|---|---|---|---|---|---|---|---|---|---|
| AI GPU (2027e) | ||||||||||
| B300 | 40 | 14 | 560 | 36 | 8 | 288 | HBM3e 12hi | Hynix/Micron | 161,280 | |
| NVIDIA | Vera CPU Rubin R200 | 250 740 | 23 8 | 5,750 5,920 | 36 | 8 | 288 | HBM4 12hi | Hynix/Micron/Samsung | 1,704,960 |
| Rubin Ultra | 130 | 8 | 1,040 | 48 | 8 | 384 | HBM4e 12hi | Hynix/Micron/Samsung | 399,360 | |
| MI350 series | 24 | 12 | 288 | 36 | 8 | 288 | HBM3e 12hi | Samsung/Micron | 82,944 | |
| MI455 | 157 | 7 | 1,099 | 36 | 12 | 432 | HBM4 12hi | Samsung/Micron | 474,768 | |
| AMD | MI450 (for Meta) | 35 | 14 | 490 | 36 | 6 | 216 | HBM4 12hi | Samsung/Micron | 105,840 |
| MI500 (Arcadia) | 24 | 4 | 96 | 48 | 16 | 768 | HBM4e 12hi | Samsung/Micron | 73,728 | |
| Venice CPU | 270 | 21 | 5,670 | |||||||
| AI ASIC (2027e) | ||||||||||
| TPU v7p (Ironwood; AVGO) | 13 | 16 | 208 | 24 | 8 | 192 | HBM3e 8hi | Hynix/Samsung | 39,936 | |
| TPU v8i (Sunfish; AVGO) | 330 | 12 | 3,960 | 36 | 8 | 288 | HBM3e 12hi | Samsung/Hynix/Micron | 1,140,480 | |
| TPU v8t (Zebrafish; MediaTek) | 180 | 20 | 3,600 | 36 | 6 | 216 | HBM3e 12hi | Samsung/Hynix/Micron | 777,600 | |
| TPU v9 (Humufish; MediaTek) | 400 | 48 | 12 | 576 | HBM4e 12hi | Samsung/Hynix/Micron | 230,400 | |||
| AWS | Trainium 3 | 140 | 17 | 2,380 | 36 | 4 | 144 | HBM3e 12hi | Hynix/Samsung/Micron | 342,720 |
| GUC's customers | 60 | 20 | 1,200 | 24 | 6 | 144 | HBM3e 8hi | Samsung? | 172,800 | |
| Microsoft | Maia 300 | 50 | 11 | 550 | 36 | 8 | 288 | HBM4 12hi | Samsung | 158,400 |
| Meta | MTIA 3 (Iris) | 55 | 10 | 550 | 36 | 8 | 288 | HBM3e 12hi | Samsung/Hynix/Micron | 158,400 |
| Others | 18 | |||||||||
| Total | 2,664 | 33,996 | 6,077,256 | |||||||
| Total HBMdemand (mn Gb) | Total HBMdemand (mn Gb) | 48,618 |
Source: Company data, Morgan Stanley Research (e) estimates. Note: Estimates are compiled using our Asian supply chain checks.
Exhibit 12: AI wafer consumption: At least US$59bn in 2027
| AI chip vendor | Product name | CoWoS capacity allocation (k wafers) | Chips per CoWoS wafer | Implied shipments (k) | Compute die size | Geometry | Compute die units | Wafer consumption (k wafers) | Wafer price (US$) | Wafer revenue TAM (US$ mn) |
|---|---|---|---|---|---|---|---|---|---|---|
| AI GPU (2027e) | ||||||||||
| B300 | 40 | 14 | 560 | 850 | 4nm | 2 | 44 | 23,042 | 1,024 | |
| Vera CPU | 250 | 23 | 5,750 | 850 | 3nm | 1 | 228 | 27,300 | 6,229 | |
| NVIDIA | Rubin R200 | 740 | 8 | 5,920 | 850 | 3nm | 2 | 470 | 27,300 | 12,827 |
| Rubin Ultra | 130 | 8 | 1,040 | 850 | 3nm | 2 | 83 | 27,300 | 2,253 | |
| MI350 series | 24 | 12 | 288 | 110 | 3nm | 8 | 8 | 27,300 | 229 | |
| MI455 | 157 | 7 | 1,099 | 850 | 2nm | 2 | 116 | 30,000 | 3,489 | |
| AMD | MI450 (for Meta) | 35 | 14 | 490 | 850 | 2nm | 1 | 26 | 30,000 | 778 |
| MI500 (Arcadia) | 24 | 4 | 96 | 850 | 2nm | 2 | 10 | 30,000 | 305 | |
| Venice CPU | 270 | 21 | 5,670 | 155 | 2nm | 8 | 227 | 30,000 | 6,804 | |
| AI ASIC (2027e) | ||||||||||
| TPU v7p (Ironwood; AVGO) | 13 | 16 | 208 | 700 | 3nm | 2 | 14 | 27,300 | 371 | |
| TPU v8i (Sunfish; AVGO) | 330 | 12 | 3,960 | 800 | 3nm | 2 | 296 | 27,300 | 8,075 | |
| TPU v8t (Zebrafish; MediaTek) | 180 | 20 | 3,600 | 800 | 3nm | 2 | 269 | 27,300 | 7,341 | |
| TPU v9 (Humufish; MediaTek) | 400 | 850 | 2nm | 4 | 63 | 30,000 | 1,905 | |||
| AWS | Trainium 3 | 140 | 17 | 2,380 | 700 | 3nm | 2 | 127 | 27,300 | 3,465 |
| GUC's customers | 60 | 20 | 1,200 | 645 | 4nm | 1 | 29 | 23,042 | 674 | |
| Microsoft | Maia 300 | 50 | 11 | 550 | 850 | 2nm | 1 | 29.1 | 30,000 | 873 |
| Meta | MTIA 3 (Iris) | 55 | 10 | 550 | 850 | 3nm | 2 | 44 | 27,300 | 1,192 |
| Others | 18 | |||||||||
| Total | 2,664 | 33,996 | 2,119 | 58,798 |
Source: Company data, Morgan Stanley Research (e) estimates. Note: Estimates are compiled using our Asian supply chain checks.
M
Exhibit 13: CoWoS allocation breakdown by CoW vendor
| (k wafer) | 2023 | 2024 | 2025 | 2026e | 2027e | 2023 | 2024 | 2025e | 2026e | 2027e |
|---|---|---|---|---|---|---|---|---|---|---|
| NVIDIA | 53 | 200 | 425 | 780 | 1,222 | 45% | 54% | 62% | 56% | 45% |
| TSMC | 390 | 680 | 1,090 | |||||||
| CoWoS-L | 390 | 650 | 910 | |||||||
| CoWoS-S | 0 | 20 | 50 | |||||||
| CoWoS-R | 0 | 10 | 130 | |||||||
| Non-TSMC | 35 | 100 | 132 | |||||||
| Amkor | 35 | 100 | 132 | |||||||
| CoWoS-S | 20 | 20 | 12 | |||||||
| CoWoS-R | 15 | 80 | 120 | |||||||
| ASE/SPIL | 0 | 0 | 0 | |||||||
| CoWoS-S | 0 | 0 | 0 | |||||||
| CoWoS-R | 0 | 0 | 0 | |||||||
| Broadcom | 23 | 68 | 85 | 300 | 484 | 20% | 18% | 12% | 22% | 18% |
| TSMC | 83 | 260 | 420 | |||||||
| CoWoS-L | 0 | 15 | 55 | |||||||
| CoWoS-S | 83 | 245 | 365 | |||||||
| ASE/SPIL | 2 | 30 | 40 | |||||||
| CoWoS-L | 0 | 0 | 0 | |||||||
| CoWoS-S | 2 | 30 | 40 | |||||||
| Amkor | 10 | 24 | ||||||||
| CoWoS-S | 10 | 24 | ||||||||
| AMD | 7 | 40 | 60 | 130 | 530 | 6% | 11% | 9% | 9% | 20% |
| TSMC | 60 | 80 | 240 | |||||||
| CoWoS-L | 0 | 70 | 230 | |||||||
| CoWoS-S | 60 | 10 | 10 | |||||||
| ASE/SPIL | 0 | 50 | 170 | |||||||
| CoWoS-L | 0 | 50 | 170 | |||||||
| Amkor | 0 | 120 | ||||||||
| CoWoS-L | 0 | 120 | ||||||||
| Xilinx | 3 | 10 | 10 | 10 | 10 | 3% | 3% | 1% | 1% | 0% |
| MediaTek | 40 | 180 | 3% | 7% | ||||||
| TSMC | 40 | 180 | ||||||||
| CoWoS-S | 40 | 180 | ||||||||
| AWS/Annapurna | 60 | 62 | 90 | 4% | 3% | |||||
| TSMC | 60 | 32 | 54 | |||||||
| CoWoS-R | 60 | 32 | 54 | |||||||
| ASE/SPIL | 30 | 36 | ||||||||
| CoWoS-R | 30 | 36 | ||||||||
| AWS/Alchip | 9 | 16 | 5 | 26 | 36 | 8% | 4% | 1% | 2% | 1% |
| Intel Habana | 0 | 7 | 9 | 0 | 0 | 0% | 2% | 1% | 0% | 0% |
| Marvell | 1 | 18 | 15 | 17 | 64 | 1% | 5% | 2% | 1% | 2% |
| TSMC | 5 | 50 | ||||||||
| CoWoS-L | 5 | 50 | ||||||||
| CoWoS-R | 15 | 0 | 0 | |||||||
| ASE/SPIL | 12 | 14 | ||||||||
| CoWoS-R | ||||||||||
| 12 | 14 | |||||||||
| GUC | 1 | 1 | 2 | 14 | 60 | 1% | 0% | 0% | 1% | 2% |
| Cisco | 2 | 3 | 5 | 6 | 1% | 0% | 0% | 0% | ||
| Others | 20 | 10 | 15 | 10 | 12 | 17% | 3% | 2% | 1% | 0% |
| Total demand | 117 | 372 | 689 | 1,394 | 2,694 | 100% | 100% | 100% | 100% | 100% |
Source: Company data, Morgan Stanley Research (e) estimates. Note: Estimates are compiled using our Asian supply chain checks.
M
Exhibit 14: Global CoWoS demand breakdown: 2026e vs. 2027e
Global CoWoS capacity demand by key customer
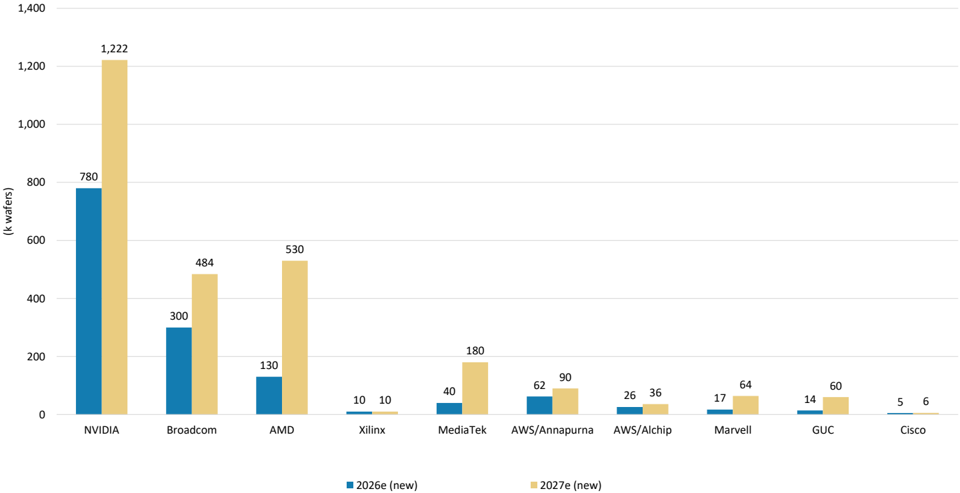
Source: Company data, Morgan Stanley Research (e) estimates; note: estimates are complied using our supply chain checks
Exhibit 15: Global CoWoS demand Y/Y growth profile
| Y/Y | 2023 | 2024 | 2025 | 2026e | 2027e |
|---|---|---|---|---|---|
| NVIDIA | 119% | 280% | 113% | 84% | 57% |
| Broadcom | 56% | 191% | 25% | 253% | 61% |
| AMD | 485% | 470% | 50% | 117% | 308% |
| Xilinx | 63% | 242% | 0% | 0% | 0% |
| AWS/Annapurna | 3% | 45% | |||
| AWS/Alchip | 71% | (69%) | 420% | 38% | |
| Marvell | (22%) | 1438% | (17%) | 13% | 276% |
| GUC | (15%) | 300% | 600% | 329% | |
| Cisco | 36% | 67% | 10% | ||
| Others | 23% | (49%) | 50% | (33%) | 20% |
| Total demand | 95% | 218% | 85% | 102% | 93% |
Source: Company data, Morgan Stanley Research (e) estimates; note: estimates are complied using our supply chain checks
M
Exhibit 16: Global CoWoS capacity expansion by year-end and by vendor
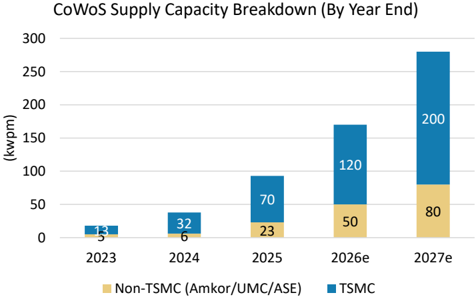
Source: Company data, Morgan Stanley Research (e) estimates
Exhibit 18:
AI HBM consumption: up to 30bn Gb in 2026
| AI chip vendor | Product name | CoWoS capacity allocation (k wafers) | Chips per CoWoS wafer | Implied shipments (k) | HBMchip density (GB) | HBMchip units | Total HBMsize (GB) | HBM generation | HBMvendor | TotalHBM demand (k GB) |
|---|---|---|---|---|---|---|---|---|---|---|
| AI GPU (2026e) | ||||||||||
| B300 | 390 | 14 | 5,460 | 36 | 8 | 288 | HBM3e 12hi | Hynix/Micron/Samsung | 1,572,480 | |
| Vera CPU | 90 | 23 | 2,070 | |||||||
| NVIDIA | Spectrum/CPX | 60 | - | |||||||
| Rubin R200 | 260 | 8 | 2,080 | 36 | 8 | 288 | HBM4 12hi | Hynix/Micron/Samsung? | 599,040 | |
| H200 | 20 | 27 | 540 | 24 | 6 | 141 | HBM3e 8hi | Hynix | 76,140 | |
| MI300 | 3 | 12 | 36 | 24 | 8 | 192 | HBM3e 12hi | Samsung | 6,912 | |
| MI350/375 | 7 | 12 | 84 | 36 | 8 | 288 | HBM3e 12hi | Samsung/Micron | 24,192 | |
| AMD | MI455 | 65 | 7 | 455 | 36 | 12 | 432 | HBM4 12hi | Samsung/Micron | 196,560 |
| Venice | 50 | 21 | 1,050 | |||||||
| AI ASIC (2026e) | ||||||||||
| TPU v7p (Ironwood; AVGO) | 145 | 16 | 2,320 | 24 | 8 | 192 | HBM3e 8hi | Hynix/Samsung | 445,440 | |
| TPU v8i (Sunfish; AVGO) | 80 | 12 | 960 | 36 | 8 | 288 | HBM3e 12hi | Hynix/Samsung/Micron | 276,480 | |
| TPU v8t (Zebrafish; MediaTek) | 40 | 20 | 800 | 36 | 6 | 216 | HBM3e 12hi | Hynix/Micron | 172,800 | |
| AWS | Trainium 3 | 100 | 17 | 1,700 | 36 | 4 | 144 | HBM3e 12hi | Hynix/Samsung/Micron | 244,800 |
| GUC's customers | 10 | 20 | 200 | 24 | 6 | 144 | HBM3e 8hi | Samsung? | 1,152 | |
| Microsoft | Maia 200 | 4 | 29 | 116 | 16 | 4 | 64 | HBM3 | Samsung | 7,424 |
| Maia 300 | 5 | 11 | 55 | 36 | 8 | 288 | HBM4 12hi | Samsung | 15,840 | |
| Meta | MTIA 3 (Iris) | 15 | 10 | 150 | 36 | 8 | 288 | HBM3e 12hi | Hynix/Samsung | 43,200 |
| Total | 1,424 | 18,526 | 3,741,260 | |||||||
| Total HBMdemand (mn Gb) | Total HBMdemand (mn Gb) | 29,930 |
Source: Company data, Morgan Stanley Research (e) estimates. Note: Estimates are compiled using our Asian supply chain checks.
Exhibit 19: AI wafer consumption: At least US$26bn in 2026
| AI chip vendor | Product name | CoWoS capacity allocation (k wafers) | Chips per CoWoS wafer | Implied shipments (k) | Compute die size | Geometry | Compute die units | Wafer consumption (k wafers) | Wafer price (US$) | Wafer revenue TAM (US$ mn) |
|---|---|---|---|---|---|---|---|---|---|---|
| AI GPU (2026e) | ||||||||||
| B300 | 390 | 14 | 5,460 | 850 | 4nm | 2 | 433 | 21,945 | 9,510 | |
| Vera CPU | 90 | 23 | 2,070 | 3nm | ||||||
| NVIDIA | Spectrum/CPX | 60 | - | |||||||
| Rubin R200 | 260 | 8 | 2,080 | 850 | 3nm | 2 | 165 | 26,000 | 4,292 | |
| H200 | 20 | 27 | 540 | 814 | 4nm | 1 | 15 | 21,945 | 331 | |
| MI300 | 3 | 12 | 36 | 110 | 5nm | 8 | 1 | 18,000 | 19 | |
| MI350/375 | 7 | 12 | 84 | 850 | 3nm | 2 | 5 | 26,000 | 139 | |
| AMD | MI455 | 65 | 7 | 455 | 850 | 2nm | 2 | 48 | 28,125 | 1,354 |
| Venice | 50 | 21 | 1,050 | 155 | 2nm | 8 | 70 | 28,125 | 1,969 | |
| AI ASIC (2026e) | ||||||||||
| TPU v7p (Ironwood; AVGO) | 145 | 16 | 2,320 | 700 | 3nm | 2 | 152 | 26,000 | 3,942 | |
| TPU v8i (Sunfish; AVGO) | 80 | 12 | 960 | 800 | 3nm | 2 | 72 | 26,000 | 1,864 | |
| TPU v8t (Zebrafish; MediaTek) | 40 | 20 | 800 | 800 | 3nm | 2 | 60 | 26,000 | 1,554 | |
| AWS | Trainium 3 | 100 | 17 | 1,700 | 700 | 3nm | 2 | 91 | 26,000 | 2,357 |
| GUC's customers | 10 | 20 | 200 | 645 | 4nm | 1 | 5 | 21,945 | 107 | |
| Maia 200 | 4 | 29 | 116 | 700 | 3nm | 1 | 3.0 | 26,000 | 79 | |
| Microsoft | Maia 300 | 5 | 11 | 55 | 850 | 2nm | 1 | 2.9 | 28,125 | 82 |
| Meta | MTIA 3 (Iris) | 15 | 10 | 150 | 850 | 3nm | 2 | 11.9 | 26,000 | 310 |
| Total | 1,424 | 18,526 | 1,165 | 28,619 |
Source: Company data, Morgan Stanley Research (e) estimates. Note: Estimates are compiled using our Asian supply chain checks.
Exhibit 17: Global CoWoS consumption, by customer
Source: Company data, Morgan Stanley Research (e) estimates; note: estimates are compiled using our supply chain checks
nublll ullp oilptnenlto vo. vn lvlle laun olmpitlelllo
3
2.5
2
1.5
0.5
Quarterly shipment (mn units)
M
30
25
20
Aligning Blackwell and Rubin Chip Shipments with HGX and Rack Shipments
We analyzed Blackwell chip shipments versus rack shipments in our last June AI tracker. We believe TSMC's Blackwell chip output, based on CoWoS-L capacity, aligns more closely with underlying demand as reflected in AI capex trends.
5
We now incorporate HGX systems (8 GPUs per server) into our chip consumption model and assume that nine HGX servers are equivalent to one NVL72 rack. We forecast 5.4mn Blackwell units in 2026, with chip supply sufficient to meet Grace Blackwell NVL72 demand by 2H26.
Our latest checks also suggest shipments of nearly 7mn Rubin and Rubin Ultra units in 2027, while total Rubin NVL72 rack shipments could reach 90k units in 2027 ( Exhibit 22 ).
All Blackwell chip "inventory" has proven to be supply-chain buffer stock and should be fully absorbed by 2026. As a result, we see little reason for concern over inventory levels. We expect Rubin to follow a similar pattern. Rubin should begin ramping up in 3Q26, with rack shipments starting in 4Q26.
Exhibit 20: (old) Blackwell chip vs. GB NVL72 rack shipments
Source: Morgan Stanley Research estimates
Exhibit 21: (new) Blackwell chip vs. GB NVL72 and HGX equivalent rack shipments
Source: Morgan Stanley Research estimates
Exhibit 22: Rubin chip shipments vs. VR NVL72 rack shipments
Source: Morgan Stanley Research (e) estimates
2Q26e
3k NVL72
3Q26e
4Q26e
1Q27e
- Rubin chip volume (LHS)
Слила. Лілемак Саліли Валалел Inl antimataa
M
AI semis - stock implications, P/E multiples, revenue exposure
Exhibit 23: P/E multiple trend of AI semis
Note: Alternative AI semis group: AMD, Alchip, Andes, Marvell, Broadcom. AI semi enablers group: TSMC, Synopsys, Cadence, ASML, BESI, Ibiden, KYEC, Advantest. Source: Company data, Morgan Stanley Research.
Exhibit 24: We still expect AI chip revenue to rise QoQ
Source: Company data, Refinitiv, Morgan Stanley US Research (e) estimates.
M
Exhibit 25: TSMC's AI-related revenue 2024-29e CAGR could reach 60%
Source: Company data, Morgan Stanley Research (e) estimates
AI GPU and ASIC rental price tracker
Exhibit 26: AI GPU H100 per GPU per hour as of end-March
Source: Company data, Morgan Stanley Research
Exhibit 27: AI ASIC equivalent computing power - 16x Inferentia 2 per hour
Source: Company data, Morgan Stanley Research
M
Exhibit 28: NVIDIA 5090 graphic cards pricing has rebounded recently, mainly in response to market expectations for price hikes and strong AI inference demand from China
Source: TaoBao, Morgan Stanley Research, various media (e.g., Vice, Jan. 3, 2026)
Idea
M
GUC: Estimate revisions summary
We raise our 2026 EPS estimate 13%, 2027 11% and 2028 11%: We expect 2027 and 2028 revenue to grow strongly from several CSP projects as well as Chinese ADAS customers. With turnkey revenue share seen increasing in both 2026 and 2027, we now assume that gross margin will fall from 20.8% in 2026 to 15.3% in 2028.
Exhibit 29: GUC: Estimate revisions summary
| NT$ mn | New '26e | Old '26e | Diff. | New '27e | Old '27e | Diff. | New '28e | Old '28e | Diff. |
|---|---|---|---|---|---|---|---|---|---|
| Net sales | 63,487 | 61,536 | 3% | 181,440 | 148,903 | 22% | 264,915 | 240,937 | 10% |
| NRE | 9,452 | 8,032 | 18% | 11,003 | 8,728 | 26% | 12,555 | 9,349 | 34% |
| Turnkey | 54,035 | 53,504 | 1% | 170,437 | 140,175 | 22% | 252,360 | 231,588 | 9% |
| Gross profit | 13,179 | 12,164 | 8% | 28,269 | 25,909 | 9% | 40,642 | 38,340 | 6% |
| Operating profit | 7,554 | 6,576 | 15% | 21,650 | 19,485 | 11% | 32,978 | 29,820 | 11% |
| Pretax Income | 7,844 | 6,976 | 12% | 21,919 | 19,733 | 11% | 33,247 | 30,068 | 11% |
| Net income | 6,740 | 5,939 | 13% | 18,631 | 16,773 | 11% | 28,260 | 25,558 | 11% |
| Reported EPS | 49.97 | 44.04 | 13% | 138.14 | 124.37 | 11% | 209.53 | 189.50 | 11% |
| Margins | |||||||||
| Gross margin | 20.8% | 19.8% | 15.6% | 17.4% | 15.3% | 15.9% | |||
| Opex ratio | 8.9% | 9.1% | 3.6% | 4.3% | 2.9% | 3.5% | |||
| Operating margin | 11.9% | 10.7% | 11.9% | 13.1% | 12.4% | 12.4% | |||
| Net margin | 10.6% | 9.7% | 10.3% | 11.3% | 10.7% | 10.6% |
Source: Company data, Morgan Stanley Research (e) estimates
Exhibit 30: GUC: Quarterly financials
| (NT$ mn) | 1Q25 | 2Q25 | 3Q25 | 4Q25 | 1Q26 | 2Q26 | 3Q26e | 4Q26e | 2024 | 2025 | 2026e | 2027e | 2028e |
|---|---|---|---|---|---|---|---|---|---|---|---|---|---|
| Total revenues | 7,024 | 6,105 | 8,613 | 12,400 | 11,448 | 13,897 | 15,288 | 22,855 | 25,044 | 34,141 | 63,487 | 181,440 | 264,915 |
| Q/Q Change | 16.6% | -13.1% | 41.1% | 44.0% | -7.7% | 21.4% | 10.0% | 49.5% | |||||
| Y/Y Change | 23.4% | -9.2% | 30.3% | 105.9% | 63.0% | 127.6% | 77.5% | 84.3% | -4.6% | 36.3% | 86.0% | 185.8% | 46.0% |
| Cost of Sales | 5,051 | 4,071 | 6,527 | 10,038 | 8,335 | 10,903 | 12,460 | 18,611 | 16,937 | 25,687 | 50,308 | 153,171 | 224,273 |
| Percent of Revenues | 71.9% | 66.7% | 75.8% | 81.0% | 72.8% | 78.5% | 81.5% | 81.4% | 67.6% | 75.2% | 79.2% | 84.4% | 84.7% |
| Gross Profit | 1,973 | 2,034 | 2,086 | 2,361 | 3,113 | 2,994 | 2,828 | 4,244 | 8,108 | 8,454 | 13,179 | 28,269 | 40,642 |
| Gross Margin | 28.1% | 33.3% | 24.2% | 19.0% | 27.2% | 21.5% | 18.5% | 18.6% | 32.4% | 24.8% | 20.8% | 15.6% | 15.3% |
| Total Opex | 878 | 1,090 | 1,031 | 1,105 | 1,289 | 1,318 | 1,432 | 1,586 | 4,305 | 4,104 | 5,625 | 6,619 | 7,665 |
| Percent of Revenues | 12.5% | 17.9% | 12.0% | 8.9% | 11.3% | 9.5% | 9.4% | 6.9% | 17.2% | 12.0% | 8.9% | 3.6% | 2.9% |
| R&D | 800 | 837 | 813 | 880 | 1,013 | 1,046 | 1,081 | 1,142 | 3,223 | 3,330 | 4,282 | 4,791 | 5,320 |
| Percent of Revenues | 11.4% | 13.7% | 9.4% | 7.1% | 8.9% | 7.5% | 7.1% | 5.0% | 12.9% | 9.8% | 6.7% | 2.6% | 2.0% |
| General & Adm Exp. | -18 | 159 | 125 | 129 | 151 | 153 | 183 | 193 | 674 | 395 | 679 | 740 | 1,020 |
| Percent of Revenues | -0.3% | 2.6% | 1.5% | 1.0% | 1.3% | 1.1% | 1.2% | 0.8% | 2.7% | 1.2% | 1.1% | 0.4% | 0.4% |
| Selling Expenses | 97 | 94 | 93 | 96 | 125 | 119 | 168 | 251 | 407 | 379 | 663 | 1,089 | 1,325 |
| Percent of Revenues | 1.4% | 1.5% | 1.1% | 0.8% | 1.1% | 0.9% | 1.1% | 1.1% | 1.6% | 1.1% | 1.0% | 0.6% | 0.5% |
| Operating Income | 1,095 | 944 | 1,055 | 1,257 | 1,824 | 1,676 | 1,396 | 2,658 | 3,803 | 4,350 | 7,554 | 21,650 | 32,978 |
| Operating Margin | 15.6% | 15.5% | 12.2% | 10.1% | 15.9% | 12.1% | 9.1% | 11.6% | 15.2% | 12.7% | 11.9% | 11.9% | 12.4% |
| Total Non-operating Income (loss) | 48 | -15 | -40 | 99 | 101 | 80 | 55 | 55 | 260 | 93 | 290 | 269 | 269 |
| Profit Before Taxes | 1,143 | 929 | 1,015 | 1,356 | 1,925 | 1,756 | 1,450 | 2,713 | 4,062 | 4,443 | 7,844 | 21,919 | 33,247 |
| Percent of Revenues | 16.3% | 15.2% | 11.8% | 10.9% | 16.8% | 12.6% | 9.5% | 11.9% | 16.2% | 13.0% | 12.4% | 12.1% | 12.6% |
| Taxes | 181 | 147 | 148 | 196 | 278 | 201 | 218 | 407 | 612 | 673 | 1,104 | 3,288 | 4,987 |
| Tax Rate | 15.9% | 15.9% | 14.6% | 14.5% | 14.5% | 11.4% | 15.0% | 15.0% | 15.1% | 15.2% | 14.1% | 15.0% | 15.0% |
| Minor interest | 0 | 0 | 0 | 0 | 0 | 0 | 0 | 0 | 0 | 0 | 0 | 0 | 0 |
| Total Net Income to Parent | 961 | 782 | 867 | 1,160 | 1,646 | 1,555 | 1,233 | 2,306 | 3,451 | 3,770 | 6,740 | 18,631 | 28,260 |
| Percent of Revenues | 13.7% | 12.8% | 10.1% | 9.4% | 14.4% | 11.2% | 8.1% | 10.1% | 13.8% | 11.0% | 10.6% | 10.3% | 10.7% |
| Reported Basic EPS (NT$, TW GAAP) | 7.13 | 5.80 | 6.43 | 8.60 | 12.21 | 11.53 | 9.14 | 17.10 | 25.63 -2% | 27.95 | 49.97 | 138.14 | 209.53 |
| Y/Y Change | 45% | -14% | -16% | 37% | 71% | 99% | 42% | 99% | 9% | 79% | 176% | 52% |
Source: Company data, Morgan Stanley Research (e) estimates
M
GUC: Price target rises 10% to NT$6,288
This reflects our 2027-28 estimate revisions. All of our key valuation assumptions are unchanged, including cost of equity of 9.2% (a beta of 1.2, a risk premium of 6%, and a riskfree rate of 2%), intermediate growth rate of 14.5%, and terminal growth of 5.0%.
Our bull and bear case values rise by similar magnitudes, to NT$8,545 and NT$3,870, respectively.
Exhibit 31: GUC: Residual income model
| NT$million | 2026e | 2027e | 2028e | 2029e | 2030e | 2031e | 2032e | 2033e | 2034e | 2035e | 2036e | 2037e |
|---|---|---|---|---|---|---|---|---|---|---|---|---|
| Total Equity | 17,607 | 32,579 | 50,726 | 64,460 | 80,186 | 98,192 | 118,809 | 142,415 | 169,444 | 200,392 | 235,828 | 276,402 |
| Net Profit | 6,740 | 18,631 | 28,260 | 32,358 | 37,050 | 42,422 | 48,573 | 55,616 | 63,680 | 72,914 | 83,486 | 95,592 |
| ROAE | 44.2% | 74.2% | 67.8% | 56.2% | 51.2% | 47.6% | 44.8% | 42.6% | 40.8% | 39.4% | 38.3% | 37.3% |
| Residual Income | 4,515 | 11,453 | 19,107 | 23,833 | 27,091 | 30,762 | 34,924 | 39,660 | 45,059 | 51,224 | 58,268 | 66,324 |
| Spread | 35.0% | 65.0% | 58.6% | 47.0% | 42.0% | 38.4% | 35.6% | 33.4% | 31.6% | 30.2% | 29.1% | 28.1% |
| Ending Equity Capital | 17,607 | |||||||||||
| PV of Forecast Period | 195,341 | |||||||||||
| PV of Continuing Value | 629,740 | |||||||||||
| Equity Value | 842,687 | |||||||||||
| No. of Shares | 134 | |||||||||||
| Projected Price | 6,288 |
Source: Company data, Morgan Stanley Research (e) estimates
GUC: Relative valuation
Our price target of NT$6,288 implies 45x our 2027 EPS estimate, lower than +1 SD from GUC's historical NTM P/E since 2013. We maintain our view that the design service market will proliferate with AI ASIC outgrowing AI GPU in the long term, and therefore we believe a further re-rating would be justified with project wins likely to come. Despite slower recovery of non-AI business, we continue to appreciate GUC's growing exposure to cloud AI semis (including AI accelerators, AI server CPU, and BMC chips).
Exhibit 32: GUC: NTM rolling P/E
Source: Company data, FactSet, Morgan Stanley Research estimates
M
GUC: Financial Summary
Income Statement
| NT$mn (Years End Dec ) | 2024 | 2025 | 2026e | 2027e | 2028e |
|---|---|---|---|---|---|
| Net sales | 25,044 | 34,141 | 63,487 | 181,440 | 264,915 |
| COGS | (16,937) | (25,687) | (50,308) | (152,474) | (223,075) |
| Gross profit | 8,108 | 8,454 | 13,179 | 28,966 | 41,840 |
| Operating expenses | (4,305) | (4,104) | (5,625) | (6,619) | (8,330) |
| Operating income | 3,803 | 4,350 | 7,554 | 22,347 | 33,510 |
| Non-operating income | 260 | 93 | 290 | 269 | 269 |
| Pre-tax income | 4,062 | 4,443 | 7,844 | 22,616 | 33,780 |
| Income tax | 612 | 673 | 1,104 | 3,392 | 5,067 |
| Minority Interest | 0 | 0 | 0 | 0 | 0 |
| Reported net Income | 3,451 | 3,770 | 6,740 | 19,224 | 28,713 |
| Adj.wtd.avg.shrs( m) | 134 | 134 | 134 | 134 | 134 |
| Reported EPS (NT$) | 25.63 | 27.95 | 49.97 | 142.53 | 212.89 |
| Modelware EPS (NT$) | 25.63 | 27.95 | 49.97 | 142.53 | 212.89 |
Balance Sheet
| NT$mn (Years End Dec ) | 2024 | 2025 | 2026e | 2027e | 2028e |
|---|---|---|---|---|---|
| Cash | 10,427 | 6,650 | 7,181 | 3,431 | 13,874 |
| Mkt Securities | 2,980 | 2,082 | 2,082 | 2,082 | 2,082 |
| AR/NR | 2,007 | 3,417 | 5,044 | 14,415 | 21,047 |
| Inventory | 2,794 | 10,148 | 14,255 | 35,767 | 44,965 |
| Other | 6,271 | 3,440 | 3,440 | 3,440 | 3,440 |
| Current Assets | 24,480 | 25,737 | 32,002 | 59,136 | 85,408 |
| Long-term investments | 0 | 0 | 0 | 0 | 0 |
| Fixed assets | 942 | 1,347 | 1,347 | 1,347 | 1,347 |
| Deffered assets | 37 | 24 | 24 | 24 | 24 |
| Other assets | 850 | 1,335 | 1,335 | 1,335 | 1,335 |
| Total Assets | 26,309 | 28,443 | 34,707 | 61,841 | 88,114 |
| S/T borrowings | 0 | 0 | 0 | 0 | 0 |
| AP/NP | 1,691 | 4,126 | 5,697 | 17,266 | 25,260 |
| Other ST liabilities | 12,977 | 10,907 | 10,907 | 10,907 | 10,907 |
| LT debt | 73 | 169 | 169 | 169 | 169 |
| Other LT liabilities | 273 | 328 | 328 | 328 | 328 |
| Common shares | 1,340 | 1,340 | 1,340 | 1,340 | 1,340 |
| Total Liabilities | 15,015 | 15,530 | 17,101 | 28,670 | 36,664 |
| Additional capital | 1,812 | 2,158 | 2,158 | 2,158 | 2,158 |
| Retained earning | 8,145 | 9,431 | 14,125 | 29,690 | 47,967 |
| Other shareholders' equity | (3) | (16) | (16) | (16) | (16) |
| Total Equity | 11,294 | 12,913 | 17,607 | 33,172 | 51,449 |
| Total Liab. & Shrhldr's Equity | 26,309 | 28,443 | 34,707 | 61,841 | 88,114 |
E = Morgan Stanley Research Estimates
Source: Morgan Stanley Research, Company Data
Cash Flow Statement
| NT$mn (Years End Dec ) | 2024 | 2025 | 2026e | 2027e | 2028e |
|---|---|---|---|---|---|
| Cashflow from Operations | 6,242 | (1,143) | 2,850 | 182 | 21,151 |
| Net profits | 3,451 | 3,770 | 6,740 | 19,224 | 28,713 |
| Depreciation | 247 | 273 | 273 | 273 | 273 |
| Working Capital Change | 1,925 | (5,930) | (4,163) | (19,315) | (7,835) |
| Other adjustments | 619 | 744 | 0 | 0 | 0 |
| Cashflow from Investing | (1,522) | (398) | (273) | (273) | (273) |
| Capex | (471) | (840) | (273) | (273) | (273) |
| Change of LT Investment | 0 | 0 | 0 | 0 | 0 |
| Change of ST Investment | (850) | 688 | 0 | 0 | 0 |
| Other adjustments | (201) | (246) | 0 | 0 | 0 |
| Cashflow from financing | (1,962) | (2,227) | (2,046) | (3,659) | (10,435) |
| Increase in L/T debt | (40) | 96 | 0 | 0 | 0 |
| Increase in S/T debt | 0 | 0 | 0 | 0 | 0 |
| Cash Dividend Paid | (1,876) | (2,144) | (2,046) | (3,659) | (10,435) |
| Dir& Emp Bonus Paid | 0 | 0 | 0 | 0 | 0 |
| Issuance of stock | 0 | 0 | 0 | 0 | 0 |
| Other adjustments | (46) | (178) | 0 | 0 | 0 |
| Exchange rate adjustment | 31 | (10) | 0 | 0 | 0 |
| Net change in cash | 2,790 | -3,778 | 531 | -3,750 | 10,443 |
Financial Ratios
| 2024 | 2025 | 2026e | 2027e | 2028e | |
|---|---|---|---|---|---|
| Growth(%) | |||||
| Turnover | -4.6 | 36.3 | 86.0 | 185.8 | 46.0 |
| Operating profits | -4.2 | 14.4 | 73.7 | 195.8 | 50.0 |
| Pretax profits | -2.2 | 9.4 | 76.6 | 188.3 | 49.4 |
| Net profits | -15.8 | 9.2 | 78.8 | 185.2 | 49.4 |
| EPS | -1.5 | 9.1 | 78.8 | 185.2 | 49.4 |
| Margins (%) | |||||
| Gross Margin | 32.4 | 24.8 | 20.8 | 16.0 | 15.8 |
| Operating Margin | 15.2 | 12.7 | 11.9 | 12.3 | 12.6 |
| Pretax Margin | 16.2 | 13.0 | 12.4 | 12.5 | 12.8 |
| Net Profit | 13.8 | 11.0 | 10.6 | 10.6 | 10.8 |
| Return (%) | |||||
| ROAE | 32.9 | 31.1 | 44.2 | 75.7 | 67.9 |
| ROAA | 14.6 | 13.8 | 21.3 | 39.8 | 38.3 |
| Gearing (%) | |||||
| Net Debt/Equity | (92.3) | (51.5) | (40.8) | (10.3) | (27.0) |
| Liabilities/Equity | 132.9 | 120.3 | 97.1 | 86.4 | 71.3 |
| Ratios (X) | |||||
| Current ratio | 1.7 | 1.7 | 1.9 | 2.1 | 2.4 |
| Quick ratio | 0.8 | 0.7 | 0.7 | 0.6 | 1.0 |
| Others | |||||
| AR/NR Turnover (days) | 29 | 29 | 29 | 29 | 29 |
| Inventory Turnover (days) | 82 | 92 | 82 | 72 | 62 |
| AP Turnover (days) | 36 | 41 | 41 | 41 | 41 |
| Cash Conversion (days) | 75 | 80 | 70 | 60 | 50 |
M
Alchip: Earnings estimate revisions summary
We raise our earnings estimates 17% for 2026, 25% for 2027, and 67% for 2028: Our
2026-2027 EPS upward revisions come mostly from better than expected Trainium3 margin. 2028 revenue and earnings increase more than doubles from our previous forecast given larger Trainium4 contribution, of which we now forecast US$8bn revenue to Alchip vs. our previous forecast of US$4bn.
Exhibit 33: Alchip: Earnings estimate revisions
| NT$ mn | New '26E | Old '26E | Diff. | New '27E | Old '27E | Diff. | New '28E | Old '28E | Diff. |
|---|---|---|---|---|---|---|---|---|---|
| Net sales | 94,550 | 92,318 | 2% | 135,780 | 134,592 | 1% | 303,800 | 165,250 | 84% |
| Gross profit | 21,308 | 18,559 | 15% | 28,414 | 23,547 | 21% | 46,815 | 28,546 | 64% |
| Operating profit | 16,633 | 13,954 | 19% | 22,011 | 17,462 | 26% | 36,362 | 21,472 | 69% |
| Pretax Income | 18,186 | 15,590 | 17% | 23,372 | 18,677 | 25% | 37,599 | 22,576 | 67% |
| Net income | 14,632 | 12,550 | 17% | 18,697 | 14,941 | 25% | 30,079 | 18,061 | 67% |
| Reported EPS | 176.72 | 151.58 | 17% | 225.82 | 180.46 | 25% | 363.29 | 218.13 | 67% |
| Margins | |||||||||
| Gross margin | 22.5% | 20.1% | 20.9% | 17.5% | 15.4% | 17.3% | |||
| Operating margin | 17.6% | 15.1% | 16.2% | 13.0% | 12.0% | 13.0% | |||
| Net margin | 15.5% | 13.6% | 13.8% | 11.1% | 9.9% | 10.9% | |||
| Opex% | 4.9% | 5.0% | 4.7% | 4.5% | 3.4% | 4.3% |
Source: Morgan Stanley Research (E) estimates
Exhibit 34: Alchip: Quarterly financials
| (NT$ mn) YE DEC 31 | 1Q25 | 2Q25 | 3Q25 | 4Q25 | 1Q26 | 2Q26E | 3Q26E | 4Q26E | 2023 | 2024 | 2025 | 2026E | 2027E | 2028E |
|---|---|---|---|---|---|---|---|---|---|---|---|---|---|---|
| Total revenues | 10,485 | 9,144 | 6,570 | 4,727 | 4,187 | 7,640 | 28,831 | 53,892 | 30,482 | 51,969 | 30,926 | 94,550 | 135,780 | 303,800 |
| Q/Q Change | -19.8% | -12.8% | -28.2% | -28.0% | -11.4% | 82.5% | 277.4% | 86.9% | ||||||
| Y/Y Change | 0.0% | -32.7% | -55.7% | -63.8% | -60.1% | -16.5% | 338.8% | 1040.0% | 122.1% | 70.5% | -40.5% | 205.7% | 43.6% | 123.7% |
| Cost of Sales | 8,056 | 7,257 | 4,729 | 2,730 | 2,086 | 4,978 | 23,065 | 43,114 | 23,687 | 41,768 | 22,772 | 73,242 | 107,366 | 256,985 |
| Percent of Revenues | 76.8% | 79.4% | 72.0% | 57.7% | 49.8% | 65.2% | 80.0% | 80.0% | 77.7% | 80.4% | 73.6% | 77.5% | 79.1% | 84.6% |
| Gross Profit | 2,429 | 1,887 | 1,841 | 1,997 | 2,101 | 2,662 | 5,766 | 10,778 | 6,794 | 10,201 | 8,154 | 21,308 | 28,414 | 46,815 |
| Gross Margin | 23.2% | 20.6% | 28.0% | 42.3% | 50.2% | 34.8% | 20.0% | 20.0% | 22.3% | 19.6% | 26.4% | 22.5% | 20.9% | 15.4% |
| Incremental Margin | NM | NM | NM | NM | NM | 16% | 15% | 20% | 14% | 16% | NM | 21% | 17% | 11% |
| Total Opex | 934 | 737 | 684 | 782 | 733 | 1,015 | 1,298 | 1,628 | 3,033 | 3,705 | 3,138 | 4,675 | 6,403 | 10,453 |
| Percent of Revenues | 8.9% | 8.1% | 10.4% | 16.6% | 17.5% | 13.3% | 4.5% | 3.0% | 10.0% | 7.1% | 10.1% | 4.9% | 4.7% | 3.4% |
| R&D | 467 | 494 | 453 | 417 | 508 | 742 | 792 | 792 | 1,547 | 2,142 | 1,831 | 2,834 | 3,545 | 4,915 |
| Percent of Revenues | 4.5% | 5.4% | 6.9% | 8.8% | 12.1% | 9.7% | 2.7% | 1.5% | 5.1% | 4.1% | 5.9% | 3.0% | 2.6% | 1.6% |
| General & Adm Exp. | 406 | 157 | 175 | 273 | 164 | 207 | 217 | 297 | 1,237 | 1,286 | 1,011 | 886 | 1,500 | 2,500 |
| Percent of Revenues | 3.9% | 1.7% | 2.7% | 5.8% | 3.9% | 2.7% | 0.8% | 0.6% | 4.1% | 2.5% | 3.3% | 0.9% | 1.1% | 0.8% |
| Selling Expenses | 61 | 86 | 56 | 92 | 61 | 66 | 288 | 539 | 250 | 276 | 295 | 955 | 1,358 | 3,038 |
| Percent of Revenues | 0.6% | 0.9% | 0.9% | 2.0% | 1.5% | 0.9% | 1.0% | 1.0% | 0.8% | 0.5% | 1.0% | 1.0% | 1.0% | 1.0% |
| Operating Income | 1,494 | 1,150 | 1,157 | 1,215 | 1,368 | 1,647 | 4,469 | 9,150 | 3,761 | 6,496 | 5,017 | 16,633 | 22,011 | 36,362 |
| Operating Margin | 14.3% | 12.6% | 17.6% | 25.7% | 32.7% | 21.6% | 15.5% | 17.0% | 12.3% | 12.5% | 16.2% | 17.6% | 16.2% | 12.0% |
| Total Non-operating Income (loss) | 299 | 449 | 433 | 522 | 416 | 388 | 374 | 374 | 436 | 1,312 | 1,703 | 1,553 | 1,361 | 1,237 |
| Profit Before Taxes | 1,793 | 1,599 | 1,591 | 1,737 | 1,784 | 2,035 | 4,843 | 9,524 | 4,198 | 7,808 | 6,720 | 18,186 | 23,372 | 37,599 |
| Percent of Revenues | 17.1% | 24.2% | 42.6% | 26.6% | 16.8% | 17.7% | 13.8% | 15.0% | 21.7% | 19.2% | 17.2% | 12.4% | ||
| 17.5% | 36.7% | 3,557 | ||||||||||||
| Taxes | 332 | 265 | 250 | 1,858 | 877 | 1,362 | 4,674 | 7,520 | ||||||
| Tax Rate Minor interest | 18.5% -2 | 277 17.3% -1 | 16.6% -2 | 14.4% 3 | 357 20.0% -1 | 397 19.5% -1 | 945 19.5% -1 | 19.5% -1 | 20.9% -5 | 17.4% 1 | 1,124 16.7% -2 | 19.6% -3 | 20.0% 0 | 20.0% 0 |
| Total Net Income to Parent | 1,464 | 1,324 | 1,328 | 1,483 | 1,428 | 1,639 | 3,899 | 7,667 | 3,325 | 6,446 | 5,598 | 14,632 | 18,697 | 30,079 |
| Percent of Revenues | 14.0% | 14.5% | 20.2% | 31.4% | 34.1% | 21.4% | 13.5% | 14.2% | 10.9% | 12.4% 93.8% | 18.1% | 15.5% | 13.8% | 9.9% |
| Y/Y change | 19.0% | -16.6% | -25.9% | -19.2% | -2.4% | 23.8% | 193.6% | 416.8% | 81.3% | 79.05 | -13.1% 67.68 | 161.4% 176.72 | 27.8% | 60.9% 363.29 |
| Diluted EPS (NT$) | 17.69 | 16.02 | 16.04 | 17.92 | 17.25 | 19.79 | 47.09 | 92.60 | 43.27 | 225.82 | 367.32 | |||
| Reported Basic EPS (NT$, TW GAAP) | 18.13 | 16.37 | 16.40 | 18.33 | 17.55 | 20.01 | 47.61 | 93.63 | 45.42 | 81.51 | 69.22 | 178.80 | 228.33 |
Source: Company data, Morgan Stanley Research (E) estimates
M
Alchip: Valuation methodology
We raise our price target from NT$5,088 to NT$5,888: As well as reflecting our new 2028 earnings forecast, we cut some of our key assumptions given the ongoing competition from global peers and more newcomers to compete with AI ASIC projects, including GUC, QCOM, AMD, etc.
We continue to derive our base case value, which is also our price target, from a residual income model. Our cost of equity of 10.4% (beta of 1.4, equity risk premium of 6.0%, and risk-free rate of 2.0%) remains unchanged, while intermediate growth rate of is cut from 16% to 12.5%, and terminal growth rate from 5.0% to 4%.
Our bear case value of NT$2,465 and bull case value of NT$6,880 are also raised from NT $2,130 and NT$5,950, respectively.
Exhibit 35: Alchip: Residual income model
| NT$ million | 2026E | 2027E | 2028E | 2029E | 2030E | 2031E | 2032E | 2033E | 2034E | 2035E | 2036E | 2037E |
|---|---|---|---|---|---|---|---|---|---|---|---|---|
| Total Equity | 40,824 | 51,625 | 60,209 | 77,861 | 97,720 | 120,061 | 145,194 | 173,469 | 205,279 | 241,065 | 281,324 | 326,615 |
| Net Profit | 14,632 | 18,697 | 30,079 | 33,839 | 38,069 | 42,827 | 48,181 | 54,203 | 60,979 | 68,601 | 77,176 | 86,823 |
| ROAE | 36.4% | 40.4% | 53.8% | 49.0% | 43.4% | 39.3% | 36.3% | 34.0% | 32.2% | 30.7% | 29.5% | 28.6% |
| Residual Income | 10,281 | 12,267 | 22,401 | 23,251 | 25,666 | 28,271 | 31,129 | 34,294 | 37,817 | 41,752 | 46,158 | 51,097 |
| Spread | 26.0% | 30.0% | 43.4% | 38.6% | 33.0% | 28.9% | 25.9% | 23.6% | 21.8% | 20.3% | 19.1% | 18.2% |
| Ending Equity Capital | 40,824 | |||||||||||
| PV of Forecast Period | 167,072 | |||||||||||
| PV of Continuing Value | 279,635 | |||||||||||
| Equity Value | 487,532 | |||||||||||
| No. of Shares | 83 | |||||||||||
| Projected Price | 5,888 |
Source: Morgan Stanley Research (E) estimates
M
Alchip: Financial Summary
Exhibit 36: Alchip Financial Summary
Income Statement
| NT$mn (Years End Dec ) | 2024 | 2025 | 2026E | 2027E | 2028E |
|---|---|---|---|---|---|
| Net sales | 51,969 | 30,926 | 94,550 | 135,780 | 303,800 |
| COGS | (41,768) | (22,772) | (73,242) | (107,366) | (256,985) |
| Gross profit | 10,201 | 8,154 | 21,308 | 28,414 | 46,815 |
| Operating expenses | (3,705) | (3,138) | (4,675) | (6,403) | (10,453) |
| Operating income | 6,496 | 5,017 | 16,633 | 22,011 | 36,362 |
| Non-operating income | 1,312 | 1,703 | 1,553 | 1,361 | 1,237 |
| Pre-tax income | 7,808 | 6,720 | 18,186 | 23,372 | 37,599 |
| Income tax | 1,362 | 1,124 | 3,557 | 4,674 | 7,520 |
| Minority Interest | 1 | (2) | (3) | 0 | 0 |
| Reported net Income | 6,446 | 5,598 | 14,632 | 18,697 | 30,079 |
| Adj.wtd.avg.shrs( m) | 79 | 81 | 82 | 82 | 82 |
| Reported EPS (NT$) | 79.05 | 67.68 | 176.72 | 225.82 | 363.29 |
| Modelware EPS (NT$) | 79.05 | 67.68 | 176.72 | 225.82 | 363.29 |
Balance Sheet
| NT$mn (Years End Dec ) | 2024 | 2025 | 2026E | 2027E | 2028E |
|---|---|---|---|---|---|
| Cash | 27,044 | 32,627 | 19,071 | 62,993 | 17,641 |
| Mkt Securities | 16 | 163 | 163 | 163 | 163 |
| AR/NR | 5,730 | 3,011 | 13,361 | 19,188 | 42,931 |
| Inventory | 8,661 | 6,945 | 25,097 | 36,790 | 88,059 |
| Other | 4,733 | 10,311 | 10,311 | 10,311 | 10,311 |
| Current Assets | 46,184 | 53,057 | 68,003 | 129,444 | 159,105 |
| Long-term investments | 1,600 | 2,204 | 2,204 | 2,204 | 2,204 |
| Fixed assets | 1,775 | 1,680 | 1,680 | 1,680 | 1,680 |
| Deffered assets | 169 | 440 | 440 | 440 | 440 |
| Other assets | 582 | 659 | 659 | 659 | 659 |
| Total Assets | 50,309 | 58,039 | 72,984 | 134,426 | 164,086 |
| S/T borrowings | 0 | 0 | 0 | 50,000 | 50,000 |
| AP/NP | 1,826 | 1,986 | 6,132 | 8,989 | 21,514 |
| Other ST liabilities | 8,845 | 14,988 | 14,988 | 14,988 | 14,988 |
| LT debt | 0 | 0 | 0 | 0 | 0 |
| Other LT liabilities | 161 | 240 | 240 | 240 | 240 |
| Common shares | 806 | 813 | 813 | 813 | 813 |
| Total Liabilities | 10,833 | 17,214 | 21,360 | 74,217 | 86,742 |
| Additional capital | 25,350 | 25,755 | 25,755 | 25,755 | 25,755 |
| Retained earning | 10,752 | 13,405 | 24,205 | 32,790 | 49,924 |
| Other shareholders' equity | 2,568 | 852 | 852 | 852 | 852 |
| Total Equity | 39,477 | 40,824 | 51,625 | 60,209 | 77,344 |
| Total Liab. & Shrhldr's Equity | 50,309 | 58,039 | 72,984 | 134,426 | 164,086 |
E = Morgan Stanley Research Estimates
Source: Morgan Stanley Research, Company Data
Cash Flow Statement
| NT$mn (Years End Dec ) | 2024 | 2025 | 2026E | 2027E | 2028E |
|---|---|---|---|---|---|
| Cashflow from Operations | 3,358 | 15,272 | (6,982) | 6,778 | (29,664) |
| Net profits | 6,446 | 5,598 | 14,632 | 18,697 | 30,079 |
| Depreciation | 2,129 | 2,744 | 2,744 | 2,744 | 2,744 |
| Working Capital Change | (869) | 4,741 | (24,357) | (14,663) | (62,486) |
| Other adjustments | (4,348) | 2,189 | 0 | 0 | 0 |
| Cashflow from Investing | (676) | (5,828) | (2,744) | (2,744) | (2,744) |
| Capex | (1,998) | (2,287) | (2,744) | (2,744) | (2,744) |
| Change of LT Investment | 1,748 | (3,701) | 0 | 0 | 0 |
| Change of ST Investment | (953) | (929) | 0 | 0 | 0 |
| Other adjustments | 527 | 1,089 | 0 | 0 | 0 |
| Cashflow from financing | 12,855 | (2,653) | (3,831) | 39,887 | (12,944) |
| Increase in L/T debt | 0 | 0 | 0 | 0 | 0 |
| Increase in S/T debt | 0 | 0 | 0 | 50,000 | 0 |
| Cash Dividend Paid | (1,818) | (2,946) | (3,831) | (10,113) | (12,944) |
| Issuance of stock | 0 | 0 | 0 | 0 | 0 |
| Other adjustments | 14,673 | 293 | 0 | 0 | 0 |
| Exchange rate adjustment | 1,348 | (1,208) | 0 | 0 | 0 |
| Net change in cash | 16,885 | 5,583 | -13,557 | 43,922 | -45,352 |
Financial Ratios
| 2024 | 2025 | 2026E | 2027E | 2028E | |
|---|---|---|---|---|---|
| Growth(%) | |||||
| Turnover | 70.5 | -40.5 | 205.7 | 43.6 | 123.7 |
| Operating profits | 72.7 | -22.8 | 231.5 | 32.3 | 65.2 |
| Pretax profits | 86.0 | -13.9 | 170.6 | 28.5 | 60.9 |
| Net profits | 93.8 | -13.1 | 161.4 | 27.8 | 60.9 |
| EPS | 82.7 | -14.4 | 161.1 | 27.8 | 60.9 |
| Margins (%) | |||||
| Gross Margin | 19.6 | 26.4 | 22.5 | 20.9 | 15.4 |
| Operating Margin | 12.5 | 16.2 | 17.6 | 16.2 | 12.0 |
| Pretax Margin | 15.0 | 21.7 | 19.2 | 17.2 | 12.4 |
| Net Profit | 12.4 | 18.1 | 15.5 | 13.8 | 9.9 |
| Return (%) | |||||
| ROAE | 22.4 | 13.9 | 31.7 | 33.4 | 43.7 |
| ROAA | 15.6 | 10.3 | 22.3 | 18.0 | 20.2 |
| Gearing (%) | |||||
| Net Debt/Equity | (68.5) | (79.9) | (36.9) | (21.6) | 41.8 |
| Liabilities/Equity | 27.4 | 42.2 | 41.4 | 123.3 | 112.2 |
| Ratios (X) | |||||
| Current ratio | 4.3 | 3.1 | 3.2 | 1.7 | 1.8 |
| Quick ratio | 3.1 | 2.1 | 1.5 | 1.1 | 0.7 |
| Others | |||||
| AR/NR Turnover (days) | 29 | 52 | 52 | 52 | 52 |
| Inventory Turnover (days) | 89 | 125 | 125 | 125 | 125 |
| AP Turnover (days) | 16 | 31 | 31 | 31 | 31 |
| Cash Conversion (days) | 101 | 146 | 146 | 146 | 146 |
M
Key Featured Reports on the AI Supply Chain
| Asia-Pacific Technology: AI Supply Chain: GPU Architecture Optimization Given Memory Shortage and Supernode Challenge (10 Aug 2026) |
|---|
| Asia-Pacific Technology: AI Supply Chain: Further Updates on 2027 CoWoS Allocation and ASIC Dynamics (8 Jul 2026) |
| Asia-Pacific Technology: AI Supply Chain: Preliminary 2027 TSMC CoWoS Allocation (23 Jun 2026) |
| Asia-Pacific Technology: AI Supply Chain: Cloud Capex Strength; More CoWoS Allocation for TPU (7 May 2026) |
| Asia-Pacific Technology: AI Supply Chain: Addressing Questions on Nvidia GPU/LPU and Google TPU (9 Apr 2026) |
| Greater China Semiconductors: AI Supply Chain Tracker: Key Investor Feedback from GTC/ OFC (23 Mar 2026) |
| Asia Technology: AI Supply Chain: CPO and ASIC Dynamic Update (3 Mar 2026) |
| Foundation |
| Technology: Rise of the AI Agent - Global Implications (19 Apr 2026) |
| Global Technology: Supply-chain Reorientation (24 Jul 2025) |
| Global Technology: China - AI: The Sleeping Giant Awakens (13 May 2025) |
| Global Technology: AI Cloud Capex in the Spotlight (26 Feb 2025) |
| Global Semiconductors: AI ASIC 2.0: Potential winners (15 Dec 2024) |
| Global Technology: Global Technology - Dawn of the AI Smartphone Era: Edge AI - Apple Intelligence Fuels Innovation - More Charts, Fewer Words (17 Jul 2024) |
| Global Technology: AI PCs To Usher In The Next Leg Of PC Market Growth (21 May, 2024) |
| Key upstream AI supply chain companies |
| Asia-Pacific Technology: Connecting Dots: HK investors' feedback on Asian semis (9 Aug 2026) |
| King Yuan Electronics Co Ltd: AI revenue pushed out to 4Q26 and 2027 (7 Aug 2026) |
| AP Memory Technology Corp: More upside ahead; move to Top Pick (6 Aug 2026) |
| FOCI Fiber Optic Communications Inc: We Expect 2Q Earnings to Mark the Near-Term |
| Technology Co Ltd: Revising Full-year Revenue, But Tempering |
| WinWay GMExpectations (6 Aug 2026) |
M
Risk Reward - Global Unichip Corp (3443.TW) Risk Reward - Global Unichip Corp (3443.TW)
Winning more CSP projects
NT$6,288.00 PRICE TARGET
Base case, residual income model. Key assumptions: a cost of equity of 9.2%, an intermediate growth rate of 14.5%, and a terminal growth rate of 5%.
NT$5,542.67
Source: Refinitiv, Morgan Stanley Research
BULL CASE
61x 2027e EPS
Multiple leading-edge NRE projects successfully translate into volume production with healthy margin profiles. Many AI chipsets or other projects start to proliferate with substantial end demand, with customers' interest in migrating to more advanced nodes. Networking switch demand is stronger than expected, while SSD controller project contributions are sustainable in 2026. 3/5nm turnkey revenue growth is stronger than expected in 2026 and beyond.
NT$8,545.00
BASE CASE
45x 2027e EPS
Networking switch turnkey projects volume remains stable. A few new leading-edge turnkey projects start to show decent shipments. TSMC's leading-edge tape-out numbers increase steadily, while some "turnkey 2/3" (TK2 and TK3) projects contribute to NRE and turnkey revenue. CSP (AI) revenue contribution should be the major growth driver for 2026 and 2027, as well as the auto chip and SSD controller projects.
NT$6,288.00
OVERWEIGHT THESIS
- Besides strong Google CPU revenue contribution in 2026, we see 2027 revenue upside from Tesla AI5, Amazon edge AI chips, and SanDisk SSD controllers.
- We think the stock should rebound after new CPS projects design wins, now trading at 38x our 2027 EPS estimate.
- We maintain our view that the design service market will proliferate with AI ASIC outgrowing AI GPU in the long term.
- Despite slower recovery of non-AI business, we still appreciate GUC's growing exposure to cloud AI semis (including AI accelerators, AI server CPU, and BMC chips).
New Data Era:
Positive
Pricing Power:
Negative
Secular Growth:
Positive
View descriptions of Risk Rewards Themes here
BEAR CASE
28x 2027e EPS
AI chipsets and other projects lack concrete end demand, resulting in delayed tape-outs. TSMC's leading-edge tape-out numbers decrease or some customers turn directly to TSMC. BMC and SSD project losses arise from customers' in-sourcing. Fiercer-thanexpected talent competition leads to higher opex to retain R&D engineers. High volume turnkey projects carry lower-than-expected gross margin.
NT$3,870.00
M
Risk Reward - Global Unichip Corp (3443.TW)
KEY EARNINGS INPUTS
| Drivers | Dec 2025 | Dec 2026e | Dec 2027e | Dec 2028e |
|---|---|---|---|---|
| NRE revenue Y/Y (%) | (4.8) | 17.7 | 16.4 | 14.1 |
| Turnkey revenue Y/Y (%) | 59.2 | 110.0 | 215.4 | 48.1 |
| Turnkey revenue (NT$, mn) | 25,736 | 54,035 | 170,437 | 252,360 |
| Turnkey revenue contribution (%) | 75.4 | 85.1 | 93.9 | 95.3 |
INVESTMENT DRIVERS
- ASIC/ASSP industry demand
- Technology migration to more advanced nodes
- New projects driven by China's semi localization efforts
GLOBAL REVENUE EXPOSURE
Source: Morgan Stanley Research Estimate View explanation of regional hierarchies here
MS ALPHA MODELS
3 Month Horizon
Source: Refinitiv, FactSet, Morgan Stanley Research; 1 is the highest favored Quintile and 5 is the least favored Quintile
RISKS TO PT/RATING
RISKS TO UPSIDE
- 5nm, 3nm and advanced packaging customers decide to accelerate tape-outs.
- AI and other high-growth projects gain substantial customer traction.
- 5nm turnkey momentum is stronger than expected.
RISKS TO DOWNSIDE
- AI and other high-growth projects lose significant customer traction.
- Customers' inventory correction is longer than expected.
- 5nm and below ASIC projects contribution is lower than expected.
OWNERSHIP POSITIONING
Inst. Owners, % Active
67%
Source: Refinitiv, Morgan Stanley Research
MS ESTIMATES VS. CONSENSUS
M
Risk Reward - Alchip Technologies Ltd (3661.TW) Risk Reward - Alchip Technologies Ltd (3661.TW)
Strong Trainium4 upside in 2028
NT$5,888.00 PRICE TARGET
Base case value, derived from a residual income model. We assume the cost of equity is constant at 10.4% (2% risk-free rate, 6% risk premium, 1.4 beta). Our intermediate growth rate and terminal growth rates are 12.5% and 4%, respectively.
NT$5,743.46
Morgan Stanley Estimates
Mean
Consensus Price Target Distribution
NT$3,755.00
NT$6,800.00
Source: Refinitiv, Morgan Stanley Research
MS PT
Source: Refinitiv, Morgan Stanley Research
BULL CASE
NT$6,880.00
30x 2027e EPS
AI chipsets and HPC projects start to proliferate, amid substantial end demand.
Alchip's leading-edge tape-out numbers increase significantly, with some high-profile project wins at 3nm or even 2nm. Alchip is able to secure enough foundry capacity (front-end wafers and back-end packaging) and substrates for all of its leading-edge turnkey production. Alchip gradually gains market share within the design service market, amid continued proliferation of custom chip demand.
BASE CASE
26x 2027e EPS
AI chipsets and HPC projects start to proliferate amid strong end demand, resulting in steady growth in tape-outs and volume. There might be a slowdown in Alchip's Chinese customers' design activity for leading-edge chips as a result of US export controls; we believe this would be largely offset by ASIC demand strength from non-China regions.
NT$5,888.00
OVERWEIGHT THESIS
- We continue to believe that AI ASICs will outgrow AI GPUs in the coming years, and Alchip is one of the few ASIC design service providers that can deal with increasingly complex designs (at 2nm) with good production/design track records for large leading edge chips.
- AWS's announcement of its 3nm Trainium3 chip matches the timing of Alchip's 3nm project win. The growing number of use cases for Trainium (e.g., Apple's adoption) bodes well for Alchip's revenue growth in 2026.
- We believe Alchip has strong potential to win Trainium4.
- Our price target implies 26x our 2027e EPS, which we find undemanding vs. our >100% revenue CAGR for 2025-28e.
Consensus Rating Distribution
Source: Refinitiv, Morgan Stanley Research
Risk Reward Themes
New Data Era: Secular Growth:
Positive Positive
View descriptions of Risk Rewards Themes here
BEAR CASE
11x 2027e EPS
AI chipsets and HPC projects lack concrete end demand, resulting in delayed tape-outs and mass production. Alchip's leading-edge project pipeline deteriorates, or some customers turn directly to TSMC. AI GPU's dominance in AI computing compresses the market share gain potential for overall ASIC, with customers starting to slow their custom silicon developments - and therefore ASIC procurement plans.
NT$2,465.00
M
Risk Reward - Alchip Technologies Ltd (3661.TW)
KEY EARNINGS INPUTS
| Drivers | Dec 2025 | Dec 2026e | Dec 2027e | Dec 2028e |
|---|---|---|---|---|
| HPC revenue (NT$, mn) | 25,816 | 47,317 | 67,890 | 151,900 |
| Networking revenue (NT$, mn) | 698 | 14,877 | 21,725 | 48,608 |
INVESTMENT DRIVERS
- New promising AI chipset entrants
- NRE revenue growth
- Faster migration of semi industry to 7nm
GLOBAL REVENUE EXPOSURE
Source: Morgan Stanley Research Estimate View explanation of regional hierarchies here
MS ALPHA MODELS
3/5 MOST
3 Month
Horizon
Source: Refinitiv, FactSet, Morgan Stanley Research; 1 is the highest favored Quintile and 5 is the least favored Quintile
RISKS TO PT/RATING
RISKS TO UPSIDE
- Demand for Chinese GPUs and AI chipsets takes off earlier than expected.
- NRE demand accelerates.
- Alchip wins more US hyperscaler HPC projects.
RISKS TO DOWNSIDE
- China's HPC localization progress slows down.
- AI chipset progress is much slower to develop.
- NRE demand decelerates.
- Pricing competition intensifies.
OWNERSHIP POSITIONING
Inst. Owners, % Active
Source: Refinitiv, Morgan Stanley Research
MS ESTIMATES VS. CONSENSUS
M
Valuation Methodology and Risks
MediaTek (2454.TW)
Base case, residual income model. Key assumptions: cost of equity 9.2%, intermediate growth rate 12.0%, terminal growth rate 3.0%.
Risks to Upside
- n Edge AI proliferates smartphone replacement cycle.
- n Smartphone demand rises in China and other EMs.
- n New products attract high demand, resulting in market share gains.
- n Google's TPU spurs demand.
Risks to Downside
- n Smartphone demand deteriorates in China and other EMs.
- n Competition heats up, resulting in pricing competition.
- n New products attract low demand, causing market share loss.
- n Margin dilution is more severe.
Idea
M
Risk Reward Reference links
- View explanation of Options Probabilities methodology -Options_Probabilities_Exhibit_Link.pdf
- View descriptions of Risk Rewards Themes - RR_Themes_Exhibit_Link.pdf
-
View explanation of regional hierarchies - GEG_Exhibit_Link.pdf
-
View explanation of Theme/Exposure methodology -
-
ESG_Sustainable_Solutions_External_Link.pdf
- View explanation of HERS methodology - ESG_HERS_External_Link.pdf
M