PDF 原檔:報告_MS_NAND產業_20260702_original.pdf
圖片清單(已驗證 2026-07-03)
| 檔名 | size | 分類 | 親眼所見內容 |
|---|---|---|---|
| _001.png | 46,116 | 真資料圖 | Exhibit 4 YMTC 產能(kwpm, 縱軸310–470) × AI SSD 需求 YoY 成長%(橫軸30–60%) 熱力圖,格內為 2028 缺口/過剩百分比(-6%~+9%),綠=過剩、紅=短缺 |
| _002.png | 63,429 | 真資料圖 | Exhibit 5 DRAM Inventory Level 折線圖(4Q19–2Q26),五條線:DRAM suppliers/PC OEMs/Major module houses/Server/Smartphone |
| _003.png | 56,481 | 真資料圖 | Exhibit 6 NAND Inventory Level 折線圖(2Q20–2Q26),同五類別線 |
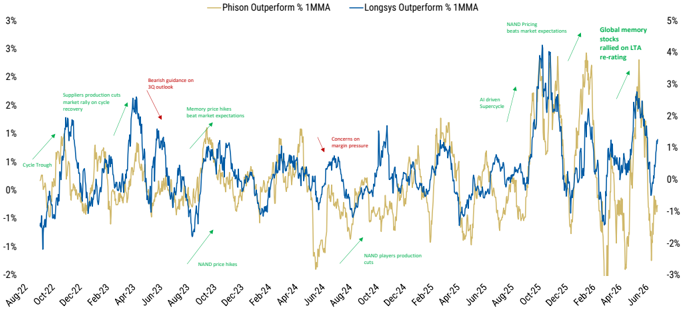
| _005.png | 100,058 | 真資料圖 | Exhibit 9 Module makers relative performance:Phison vs Longsys 「Outperform % 1MMA」走勢圖(Aug-22–Jun-26),圖上標註多個事件(cycle trough、memory price hikes beat market、AI driven supercycle、global memory stocks rallied on LTA re-rating 等) |
| _007.png | 50,895 | 真資料圖(估值 band,不嵌) | Exhibit 17 SIMO P/E band 圖(2019–2026):Average 19.6x、+1SD 27x、−1SD 12.2x |
| _008.png | 52,747 | 真資料圖(估值 band,不嵌) | Exhibit 18 SIMO DOI 圖:Revenue/Inventories 柱狀 + Ave Days of Inventory 折線(1Q17–1Q26) |
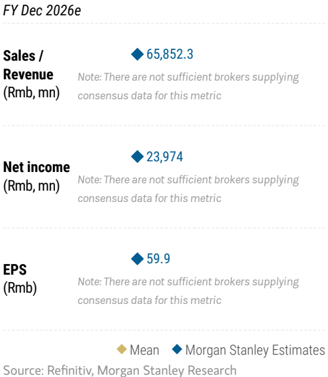
| _014.png | 42,639 | 文字卡 | Longsys「MS ESTIMATES VS. CONSENSUS」FY Dec 2026e 數字卡:Sales Rmb65,852.3mn、Net income Rmb23,974mn、EPS Rmb59.9(註記:consensus 券商數過少無法比較) |
| _015.png | 66,099 | 真資料圖(估值 band,不嵌) | Exhibit 25 Phison P/E multiple 圖(2010–2026):Average 11x、+1SD 16x、−1SD 6x |
| _016.png | 42,280 | 真資料圖(評等/目標價沿革,不嵌) | Phison Risk Reward Chart:股價走勢(Jul25–Jul26) + 目標價扇形圖,Bull NT$3,400(+51.79%)/Base NT$2,588(+15.54%)/Bear NT$1,250(−44.20%) |
| _019.png | 45,705 | 文字卡 | Phison「MS ESTIMATES VS. CONSENSUS」FY Dec 2027e 數字卡:Sales/EBITDA/Net income/EPS 之 MS 估計 vs Mean 區間 |
| _020.png | 64,668 | 真資料圖(評等沿革,不嵌) | 海外記憶體股(幣別/公司未標示,數值級距約萬~15萬)股價走勢 + 評等異動(E/A、O/A、E/I、E/C)與目標價階梯圖(2023-07–2026-07) |
| _021.png | 78,794 | 真資料圖(評等沿革,不嵌) | 另一檔海外記憶體股(數值級距約萬~38萬)股價走勢 + 評等異動與目標價階梯圖(2023-07–2026-07) |
| _022.png | 71,767 | 真資料圖(評等沿革,不嵌) | 另一檔海外記憶體股(數值級距約萬~30萬)股價走勢 + 評等異動與目標價階梯圖(2023-07–2026-07) |
| _023.png | 78,412 | 真資料圖(評等沿革,不嵌) | 另一檔海外記憶體股(數值級距達百萬,疑似韓元)股價走勢 + 評等異動(O/A、U/C、E/C、E/I)與目標價階梯圖(2023-07–2026-07) |
lib 嵌圖只挑 _001(YMTC 產能 vs AI 需求熱力圖)、_002/_003(DRAM/NAND 庫存水位)、_005(module maker outperform 走勢)四張產業結構圖;SIMO/Phison 的 P/E band、DOI、risk-reward、評等沿革與海外個股評等階梯圖(_007/_008/_014/_015/_016/_019/_020/_021/_022/_023)依嵌圖鐵則一律不嵌(估值 band / 評等沿革 / MS-vs-consensus 文字卡)。<40KB 者(_004/_006/_009~_013/_017/_018)未逐張 Read。
原始內容
M July 2, 2026 11:09 AM GMT
Global Technology
NAND Industry Outlook: Diverging Trends
| What's Changed Shenzhen Longsys Electronics Co Ltd Price Target | From Rmb300.00 | To Rmb673.00 |
|---|---|---|
| Silicon Motion (SIMO.O) Price Target | US$155.00 | US$400.00 |
| Phison Electronics Corp (8299.TWO) Price Target | NT$2,248.00 | NT$2,588.00 |
AI continues to create shortages in the NAND industry into 2027, while supply and demand dynamics depend on supply discipline moving into 2028 and beyond. We still like suppliers for L TA downside protection and enhanced shareholder returns, and are starting to see consumer pricing plateau.
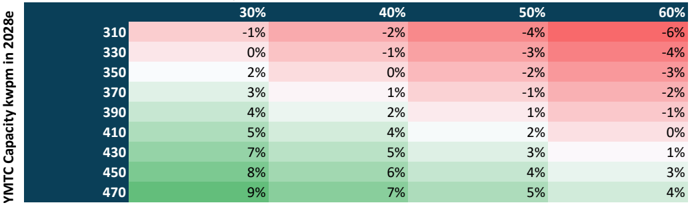
What's changed? We update our global NAND supply and demand forecast for 2026-27 and conducted a scenario test on greenfield expansion vs. AI demand growth for 2028. Our calculation shows significant shortages should persist into 2027. Moving into 2028, node migration and greenfield expansion may ease some supply tightness (-5% shortage if 60% YoY AI NAND growth with current base case capacity expansion), while in a bear case scenario where both China restrictions and supply discipline ease, there is potential risk of oversupply.
Bifurcation - AI vs. consumer: We see overall server demand remaining strong as LTAs have provided downside protections on pricing. On the consumer side, inventory levels have increased at module makers and distributors, and smartphone and PC customers are facing increasing pressure on the volume vs. margin trade-off. This is not new to the market, but we have begun to see actual order cuts after 2Q26 price hikes, indicating pricing for consumer products might hit a ceiling very soon while volume remains muted as suppliers shift capacity to AI.
Stock implications: We remain bullish on the memory cycle and continue to like supplier names with LTA supporting valuation expansion and shareholder returns. Tactically, we prefer DRAM over NAND due to better LTA terms, higher demand visibility, supply discipline capped by EUV and a potential HBM4E capacity squeeze. In NAND, we prefer suppliers over module makers, reflecting margin durability.
Global perspective: In DRAM, Samsung Electronics is Asia Tech team's Top Pick for its market leadership and potentially stronger shareholder returns. In NAND, Kioxia is our Japan Semi team's Top Pick for solid FCF generation and shareholder return potential while Macronix is our GC Semi team's Top Pick. We remain OW on Micron , SK hynix and SanDisk amid a durable memory cycle, as well as Fadu , a key eSSD controller supplier to SanDisk. We raise our SIMO PT to reflect the eSSD opportunity. We remain EW on Longsys and Phison on concerns around muted volume growth but raise our PTs on stronger pricing and margin assumptions.
Global Idea
| Morgan Stanley Asia Limited+ | |
|---|---|
| Duan Liu | |
| Equity Analyst Duan.Liu@morganstanley.com | +852 2239-7357 |
| Morgan Stanley & Co. International plc+ | |
| Shawn Kim | |
| Equity Analyst | |
| Shawn.Kim@morganstanley.com | +44 20 7677-1018 |
| Cindy Huang | |
| Equity Analyst | |
| Cindy.Huang@morganstanley.com | +44 20 7425-2915 |
| Morgan Stanley Taiwan Limited+ | |
| Charlie Chan | |
| Equity Analyst | |
| Charlie.Chan@morganstanley.com | +886 2 2730-1725 |
| Morgan Stanley & Co. LLC | |
| Joseph Moore | |
| Equity Analyst | |
| Joseph.Moore@morganstanley.com | +1 212 761-7516 |
| Morgan Stanley MUFG Securities Co., Ltd.+ | |
| Kazuo Yoshikawa, CFA | |
| Equity Analyst | |
| Kazuo.Yoshikawa@morganstanleymufg.com | +81 3 6836-8408 |
| Morgan Stanley Taiwan Limited+ | |
| Daniel Yen, CFA | |
| Equity Analyst | |
| Daniel.Yen@morganstanley.com | +886 2 2730-2863 |
| Morgan Stanley & Co. International plc, Seoul Branch+ | Morgan Stanley & Co. International plc, Seoul Branch+ |
| Ryan Kim | |
| Equity Analyst | |
| Ryan.G.Kim@morganstanley.com | +82 2 399-4939 |
| Morgan Stanley & Co. LLC | |
| Mason Wayne | |
| Research Associate | |
| Mason.Wayne@morganstanley.com | +1 212 761-6012 |
| Morgan Stanley Taiwan Limited+ | |
| Tiffany Yeh | |
| Equity Analyst | |
| Tiffany.Yeh@morganstanley.com | +886 2 7712-3032 |
| S. Korea Technology | |
| Asia Pacific Industry View | Attractive |
Morgan Stanley does and seeks to do business with companies covered in Morgan Stanley Research. As a result, investors should be aware that the firm may have a conflict of interest that could affect the objectivity of Morgan Stanley Research. Investors should consider Morgan Stanley Research as only a single factor in making their investment decision.
For analyst certification and other important disclosures, refer to the Disclosure Section, located at the end of this report.
+= Analysts employed by non-U.S. affiliates are not registered with FINRA, may not be associated persons of the member and may not be subject to FINRA restrictions on communications with a subject company, public appearances and trading securities held by a research analyst account.
M
Global Perspectives
Sandisk/Micron
Joseph Moore
We remain OW on Sandisk and MU, as supply demand outcomes continue to look compelling for both NAND and DRAM. With AI now the principal driver of memory bits and little to no inventory across the supply, the biggest risk to memory stocks is a broader AI capex slowdown, which we do not expect to peak in the near term, supporting a path to higher earnings power well beyond 2027 (when consensus currently assumes pricing will begin to normalize). We expect continued upward revisions to estimates, and at <10x P/E for both SNDK and MU multiples should still have room to benefit from extended visibility. L TAs are part of what's enabling that higher level of visibility, and are symptomatic of a market that could should stay tight for another 2-3 years. Meanwhile, MU and Sandisk should continue to be attractive capital return stories, as we expect both to pursue meaningful buybacks in 2027.
KIOXIA
Kazuo Yoshikawa
We maintain KIOXIA as our Top Pick within our Japan semiconductor coverage, reflecting solid FCF generation and shareholder return potential.
KIOXIA appears well positioned to capture AI-driven storage demand with a broad SSD lineup. The CM Series addresses high-throughput, low-latency KV cache needs for inference AI, while the GP Series targets Super High IOPS applications that can complement HBM. The LC Series supports large-scale AI storage demand with 245TB QLC SSDs, with mass-production shipments already underway.
On capital allocation, KIOXIA plans to use FCF for both growth investments and shareholder returns. We see scope for stronger returns, supported by expected annual FCF generation of ¥ 4.0-5.0trn in FY3/27-3/28 even under our conservative ASP assumptions, and management's indication that a substantial portion of excess accumulated FCF could potentially be returned to shareholders.
KIOXIA is also progressing LTA discussions, mainly with data center and enterprise customers. LTAs are expected to cover more than 50% of CY27 shipments, while CY28 coverage is likely to remain around 50% to preserve flexibility.
Samsung Electronics/SK hynix
Shawn Kim
We maintain OW ratings for both Samsung Electronics (Top Pick) and SK hynix as key beneficiaries to AI compute and agentic AI trends (see Agentic AI - The Surge Begins). We estimate more than 20-30% DRAM price hikes in 3Q26, enough to keep the YoY rate of change accelerating. Pricing power is translating into earnings revisions that in turn support P/E stability, at 5.2x 2027e earnings.
However, we are mindful of the rate of change that still matters for memory stocks. With YoY pricing likely to plateau in 4Q26 vs. supply discipline visibility in 2028, we believe
M
stocks might lack near-term cyclical catalysts until supply and demand dynamics become more clear into 2028 and beyond. That said, multiples could continue to re-rate on the back of favorable LTAs.
Longsys
Duan Liu
We have significantly raised our estimates for Longsys on better-than-expected pricing trends and high conviction levels on 2027 shortages. We expect Longsys's long-term margin profile to improve due to its better product mix. Its TCM business model will likely bring a more stable margin profile over the long term (25-35%) as inventory pressure is shifted to customers, and the company's in-house controller development could further increase the value add on firmware and customized services. We are slightly concerned about muted volume growth due to suppliers' shifting capacity to CSP customers, which should cap near-term volume growth, but this should be well understood by the market and already in the price.
Phison
Charlie Chan
2Q26 preliminary results were a strong beat vs. estimates, driven by more resilient pricing hike intervals and shipments than expected. 3Q26 is expected to be the peak quarter of the year, supported by additional supply support from Kioxia's dummy die, which could drive around 20% QoQ revenue growth and a better-than-feared flat QoQ margin. However, this strength appears cyclical rather than sustainable; gross margin expansion is still expected to peak around 2Q26-3Q26 as low-cost NAND inventory is depleted and higher-cost supply begins to flow through under FIFO accounting. By 4Q26, emerging weakness in consumer tech and a more moderate pricing environment are expected to drive revenue down around 20% QoQ, with margins normalizing to roughly 50%. Although the better 2026 pricing environment supports stronger-than-expected profitability into 2027, this upside is partially offset by continued R&D investment and broader structural risks, including constrained NAND supply, weakening consumer SSD demand, limited raw NAND supplier support, modest eSSD revenue contribution of only around 10-20% for most Asia-based SSD vendors and hyperscalers' tendency to purchase directly from NAND fab owners or negotiate long-term supply agreements, which may limit the long-term addressable market for module vendors such as Phison.
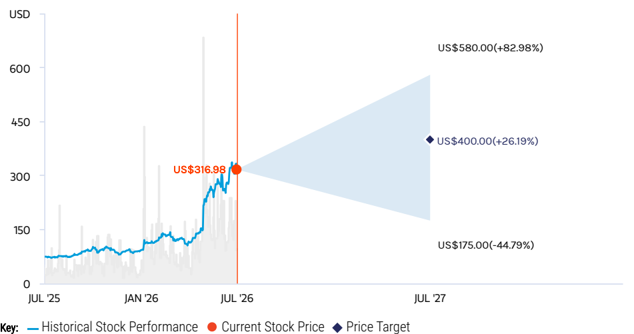
SIMO (PT increases to US$400 from US$155)
Tiffany Yeh
For FY2026, the company expects record revenue, sequential growth every quarter, margin expansion, and an improving mix. Some important incremental growth vectors are: 1) Boot drive storage, where SIMO is expanding from current DPU boot-drive shipments into broader next-gen AI GPU/CPU platform content, including DPU, Ethernet, and NVLinkrelated switch opportunities. We expect boot drive and other SSD solutions to account for 23%/26% of SIMO's 2026e/2027e total revenue, see more detailed analysis in AI Module: Boot Drive Bottom-up Updates section.
2) Enterprise SSD / MonTitan: SIMO's enterprise SSD business, MonTitan, has started production with two customers. The company expects to add five more Tier 1 CSPs by late
M
2026 and targets MonTitan to contribute 5-10% of expanded 2026 revenue on an exit run-rate basis. However, as we see SIMO continuing to make progress, we expect its eSSD (MonTitan) business to account for 5%/13%/19% of SIMO's total revenue in 2026e/ 2027e/2028e, as besides off-the-shelf eSSD controllers, we also see the possibility for SIMO to customize eSSD controllers for CSPs in the long run.
3) Although overall consumer demand remains lukewarm, we continue to see SIMO gaining market share in mobile, PC and edge AI products even into 2H26. As a result, we raise our price target to US$400 from US$155, implying 23x 2027e EPS, above its historical average of 20x since 2019. We view this as justifiable as SIMO is diversifying into more AI-exposed areas. Overall, we expect to see continual upward inflection in SIMO's enterprise/AI storage strategy, with 2026 the first meaningful ramp year and 2027-28 as the scaling phase.
Fadu
Ryan Kim
We believe Fadu is gradually transitioning from a recovery story to a structurally scaling AI storage semiconductor story. Although the company remains relatively small in absolute revenue today, management commentary increasingly suggests the key uncertainty is shifting away from demand visibility and toward execution/ramp timing. Importantly, management now frames 2026 revenue of W300bn+ as effectively secured, supported by hyperscaler-related enterprise SSD controllers, while also guiding for meaningful operating leverage due to a controller-heavy mix and limited incremental SG&A. The broader debate is no longer whether hyperscaler exposure exists, but rather how far the company can penetrate AI-centric storage architectures over the next 3-5 years. The company believes it can eventually cover 3-4 of the top global hyperscalers through indirect and direct engagement models. If realized, this could materially expand both the revenue visibility and valuation frameworks vs. historical perceptions.
Macronix, Winbond, GigaDevice
Daniel Yen
For SLC/MLC NAND, we have seen supply tightness for a while with mainstream vendors existing the market and only a handful of legacy players able to maintain or even increase capacity. In addition, we are now seeing demand upside. High-density SLC NAND can support datacenter eSSD as they have fast reading and writing speeds (link). In addition, given the MLC NAND shortfall, enterprise HDDs are likely shifting to high-density SLC NAND. Enterprise HDDs previously used MLC NAND for firmware, hot data and defect mapping. We believe strong pricing momentum will continue into 4Q, following 50-60% increases in 3Q.
We remain OW on Macronix (Top Pick; SLC/MLC NAND), Winbond (SLC NAND) and GigaDevice (SLC NAND).
M
Exhibit 1: Order of Preference
| Fadu 440110.KQ | Macronix 2337.TW | Winbond 2344.TW | Silicon Motion SIMO.O | Kioxia 285A.T | Samsung Electronics 005930.KS | GigaDevice 603986.SS | Micron MU.O | SK hynix 000660.KS | SanDisk SNDK.O | Phison 8299.TWO | Longsys 301308.SZ | Longsys 301308.SZ | Longsys 301308.SZ | Longsys 301308.SZ | Longsys 301308.SZ | Longsys 301308.SZ | Longsys 301308.SZ | Longsys 301308.SZ | |
|---|---|---|---|---|---|---|---|---|---|---|---|---|---|---|---|---|---|---|---|
| Street View: Ratings | |||||||||||||||||||
| Buy/Overweight Hold/Equal-weight Sell/Underweight | ||||||||||||||||||||||||| 100% 0% 0% | 3% | ||||||||||||||||||||||| 90% 0% ||| 10% | ||||||||||||||||||||||||| 100% 0% 0% | ||||||||||||||||||||||| 90% ||| 10% 0% | |||||||||||||||||||||| 88% 0% ||| 12% | |||||||||||||||||||||||| 95% | 3% | ||||||||||||||||||||||| 94% || 6% 0% | |||||||||||||||||||||||| | 4% 2% | 94% ||||||||||||||||||||||| 93% | 5% | 2% | |||||||||||||||||||| 79% |||| 17% | 3% | ||||||||||||||||||||||| 92% || 8% 0% | ||||||||||||||||||||||||| 100% 0% 0% | ||||||||||||||||||||||||| 100% 0% 0% | ||||||||||||||||||||||||| 100% 0% 0% | ||||||||||||||||||||||||| 100% 0% 0% | ||||||||||||||||||||||||| 100% 0% 0% | ||||||||||||||||||||||||| 100% 0% 0% | ||||||||||||||||||||||||| 100% 0% 0% | ||||||||||||||||||||||||| 100% 0% 0% |
| Bull Case Value Upside (%) | 200,000.0 142% | 355.0 147% | 342.0 80% | 580.0 83% | 150,000.0 70% | 430,000.0 37% | 1,542.0 100% | 1,650.0 43% | 3,000,000.0 17% | 2,635.0 16% | 3,400.0 50% 1,250.0 | 852.0 28% | 852.0 28% | 852.0 28% | 852.0 28% | 852.0 28% | 852.0 28% | 852.0 28% | 852.0 28% |
| Bear Case Value | 49,000.0 | 130.0 | 118.0 | 175.0 | 55,000.0 | 190,000.0 -40% | 648.0 -16% | 1.0 | 1,100,000.0 | 1,100.0 | -45% | 587.0 | 587.0 | 587.0 | 587.0 | 587.0 | 587.0 | 587.0 | 587.0 |
| Downside (%) | -41% | -9% | -38% | -38% | -42% | -57% 0.3 | -52% | 1.1 | -12% | -12% | -12% | -12% | -12% | -12% | -12% | -12% | |||
| FY26e Sales | 3.5 KRW JPY 311,953 8,541,709 58,068 7,145,993 | TWD 77,854 30,271 | 2.1 TWD 269,908 134,605 | -45% USD 1,698 387 | KRW 736,812,539 | 6.2 | 0.3 | USD 128,983 106,861 | KRW 347,635,052 296,571,444 | 11,953 | 260,963 86,035 | CNY 65,852 29,968 | |||||||
| Risk/Reward Skew | 15.7 | 1.9 | 1.9 | 0.9 | USD 19,480 | TWD | 2.3 | 2.3 | 277,967,250 | 2.3 | 2.3 | 2.3 | 2.3 | 2.3 | |||||
| Morgan Stanley Estimates | 1,014.96 | 25.02 | 118,994 21.27 | 6,802,293 | 461,965,627 420,718,910 53,984.91 | CNY 28,399 13,300 | 73.30 | 65.03 | 340.55 | 29,835 | 29,835 | 318,485.81 | 29,835 | 29,835 | 29,835 | 29,835 | 29,835 | ||
| EBITDA EBIT EPS | 48,530 | 22,733 9.84 143,216 | 357 9.44 | 8,784.37 | 13,050 16.68 | 97,375 | 11,288 | 85,965 | 59.86 | 59.86 | 59.86 | 59.86 | 59.86 | 59.86 | 59.86 | 59.86 | |||
| 604,243 133,106 | 432,740 | 2,566 723 | 9,487,908 | 1,025,374,254 | 32,761 | ||||||||||||||
| 38.29 | 693 17.54 | 7,950,991 | 74,381.23 | 30.27 | 419,982,814 459,011.81 | ||||||||||||||
| FY27e | 120,312 | 23,396 | 32,691 | ||||||||||||||||
| EBITDA EBIT EPS | 132.63 | 42.62 | 42.62 | 42.62 | 42.62 | 42.62 | 42.62 | 42.62 | 42.62 | ||||||||||
| 214,635 | 39,913 214.73 | 21,371 | 21,371 | 21,371 | 21,371 | 21,371 | 21,371 | 21,371 | 21,371 | ||||||||||
| -8.3% | 6.8% -0.6% | -25.4% -25.6% | -8.1% -7.7% | 11.0% NA | 58.9% | 3.0% 3.9% | 0.2% | -31.0% -34.5% | |||||||||||
| Sales | -13.5% | -4.0% | |||||||||||||||||
| FY26 MSe vs. Consensus Sales | 0.4% -8.7% | 7,569,791 9,852.41 | 695,982,873 639,337,811 | 46,298 23,646 | 266,867 243,477 | 515,353,508 448,532,938 | 48,826 40,589 | 260,963 | 85,564 21,412 | 85,564 21,412 | 85,564 21,412 | 85,564 21,412 | 85,564 21,412 | 85,564 21,412 | 85,564 21,412 | 85,564 21,412 | |||
| 2,137.84 | 64,657 58,187 | 234,811 | 230,431 | ||||||||||||||||
| -7.3% | 8.7% -2.7% | -22.2% -24.8% | 4.0% | 37.8% | 0.1% | -0.3% 3.6% | -23.6% | 75.5% 217.0% | 75.5% 217.0% | 75.5% 217.0% | 75.5% 217.0% | 75.5% 217.0% | 75.5% 217.0% | 75.5% 217.0% | 75.5% 217.0% | ||||
| EBITDA | -22.6% | -29.6% -8.5% | 17.4% | 42.1% 38.8% | 168.52 | -3.3% | 1811.4% 83.2% | 1811.4% 83.2% | 1811.4% 83.2% | 1811.4% 83.2% | 1811.4% 83.2% | 1811.4% 83.2% | 1811.4% 83.2% | 1811.4% 83.2% | |||||
| EBIT EPS | 7.5% | -27.6% | 87.1% | -1.5% 1.1% 0.5% | 1.6% | -36.0% | |||||||||||||
| FY27 EPS | -10.8% -18.4% | -11.9% 14.6x 13.6x 10.2x 4.0x -14.3% | 22.9% 30.5% | 0.2% | |||||||||||||||
| MSe vs. Sales | 18.9% | -15.7% | |||||||||||||||||
| Consensus | -5.9% | -7.1% 1.7% | 6.2% | 11.7% 24.7% | 115.0% | ||||||||||||||
| EBITDA EBIT | 38.6x 33.3x 30.1x | 5.7x 4.4x 4.0x | 5.0x 3.0x 2.8x | 2.5% 4.9% 3.3% | -17.6% | 0.5% | 7.1% | ||||||||||||
| FY26e P/E EV/EBIT | 29.1x 23.0x | -16.8% | 107.1% | 7.6% 7.5% | 1.8% | 24.0% | -36.6% | 108.3% 208.3% | 108.3% 208.3% | 108.3% 208.3% | 108.3% 208.3% | 108.3% 208.3% | 108.3% 208.3% | 108.3% 208.3% | 108.3% 208.3% | ||||
| EV/EBITDA EV/Sales FCF Yield | 12.8x -1.6% | NA 15.8% | 131.3% | 8.7% | -34.9% -43.5% -44.1% | 264.1% 219.2% | 264.1% 219.2% | 264.1% 219.2% | 264.1% 219.2% | 264.1% 219.2% | 264.1% 219.2% | 264.1% 219.2% | 264.1% 219.2% | ||||||
| Valuation Multiples at Last | 17.3% | -14.1% -33.6% | 14.4% | 5.0% 4.7% | 15.7% 15.5% | ||||||||||||||
| 81.4x 82.1x 68.6x | 8.9x | 46.3x | 11.2x | 11.2x | 11.2x | 11.2x | 11.2x | 11.2x | 11.2x | 11.2x | |||||||||
| FY27e | 48.4x | 10.0x | 38.1x | 15.7x | 8.1x 2.4x | 8.7x 4.0x 8.4% | 8.7x 4.0x 8.4% | 8.7x 4.0x 8.4% | 8.7x 4.0x 8.4% | 8.7x 4.0x 8.4% | 8.7x 4.0x 8.4% | 8.7x 4.0x 8.4% | 8.7x 4.0x 8.4% | ||||||
| 3.0x | 39.4x 35.9x | 6.8x | 2.9x | 17.5x | 12.1x 10.1x | ||||||||||||||
| 6.8x | 5.8x 5.0x | 37.4x | 13.3x | 8.0x | 11.4x 8.1x | 8.8x | 8.8x | 8.8x | 8.8x | 8.8x | 8.8x | 8.8x | 8.8x | ||||||
| 6.0x | 6.4x | 4.6x | 6.4x | 35.0x | |||||||||||||||
| 8.2x -0.1% | 5.4x 9.3% | 6.0x 5.1x 1.0% | 28.4x 26.8x | 10.9% | |||||||||||||||
| 4.2% | 16.4x | ||||||||||||||||||
| 3.1% | |||||||||||||||||||
| 1.8% | 4.0% | 2.8% | |||||||||||||||||
| P/E | 8.9x | 4.2x | 25.5x | 6.8x | 19.4x | 15.7x | 15.7x | 15.7x | 15.7x | 15.7x | 15.7x | 15.7x | 15.7x | ||||||
| 5.6x | 10.6x | ||||||||||||||||||
| 5.5x | 20.6x | 11.8x | 11.8x | 11.8x | 11.8x | 11.8x | 11.8x | 11.8x | 11.8x | ||||||||||
| EV/EBIT | 21.8x | 5.0x | 3.9x | 7.2x | 12.8x | ||||||||||||||
| EV/EBITDA EV/Sales FCF Yield | 6.6x | 1.8x | 1.5x | 6.5x | 5.3x 4.4x | 3.1x 2.8x | 20.4x | 4.8x | 3.6x 3.1x | 7.1x | 12.8x 2.4x | 11.8x | 11.8x | 11.8x | 11.8x | 11.8x | 11.8x | 11.8x | 11.8x |
| 0.5% | 21.0% | 11.0% | 1.9x | 4.3x | |||||||||||||||
| 1.8% | 10.4x | ||||||||||||||||||
| 8.5% | 5.9x | ||||||||||||||||||
| 20.4% | 3.6% | 2.9x | 2.9x | 2.9x | 2.9x | 2.9x | 2.9x | 2.9x | 2.9x | ||||||||||
| 10.4% | |||||||||||||||||||
| 3.6% | 3.6% | 3.6% | 3.6% | 3.6% | 3.6% | 3.6% | 3.6% | ||||||||||||
| 9.5% | 5.1% | ||||||||||||||||||
| 9.6% |
Source: Company data, Morgan Stanley Research (e) estimates. Data as of June 30, 2026.
M
Global NAND Supply & Demand Model
In this note, we update our global NAND supply and demand model. Our calculations indicate that AI-related NAND demand will increase by 60% YoY, or a 9% demand-supply gap (supply shortage) in 2027.
- We rely on ASIC/GPGPU shipment data published by our Greater China Semiconductor team (AI Supply Chain: Preliminary 2027 TSMC CoWoS Allocation) as the basis for our AI NAND consumption calculation.
- In practice, CSP usually has 8-16TB eSSD per ASIC tray for the in-rack eSSD deployment, while the externally attached/CMS-like rack can have 16-64 TB eSSD per tray, depending on the application scenario. We group datalake-related demand into QLC usage, which is capped by supply allocation.
- For Nvidia NAND usage, we include CSP's extra attachment in practice (which is equivalent to 64TB per 4GPU compute node in total) when they deploy the BlackWell rack, while other assumptions follow the company's official configurations.
- For smartphone and PC NAND demand, we assume content will be flat while units decrease in line with our US hardware team's model. For enterprise's eSSD usage, we assume 10% growth YoY for both 2026 and 2027 due to AI adoption.
- For NAND supply estimates, we leverage our US SPE analyst Shane Brett's estimates for 2026-27. He sees 27% YoY bit growth in 2027 and early signs of NAND WFE acceleration emerging (see Raising our memory WFE forecasts (mainly DRAM). Our 2025 supply numbers also include excessive inventory across the supply chain carried from the last down cycle.
M
Exhibit 2: AI NAND demand
| 2025 | 2026e | 2027e | |
|---|---|---|---|
| ASIC | |||
| AWS Trainium (k units) | 1,285 | 1,700 | 2,380 |
| ASIC per compute tray | 4 | 4 | 4 |
| AWS Tray # (k units) | 321 | 425 | 595 |
| eSSD per tray (TB) | 32 | 32 | 32 |
| Total eSSD (EB) | 10 | 14 | 19 |
| Meta MTIA (k units) | 50 | 150 | 550 |
| ASIC per compute tray | 4 | 4 | 4 |
| MTIA Tray # (k units) | 13 | 38 | 138 |
| eSSD per tray (TB) | 64 | 64 | 64 |
| Total eSSD (EB) | 1 | 2 | 9 |
| Google TPU (k units) | 4,080 | 8,168 | |
| TPU per compute tray | 4 | 4 | |
| Google Tray # (k units) | 1,020 | 2,042 | |
| eSSD per tray (TB) | 16 | 16 | |
| Total eSSD (EB) | 16 | 33 | |
| Total ASIC eSSD usage (EB) | 11 | 32 | 61 |
| GPGPU | |||
| Nvidia (k units) | |||
| B200/B300 | 5,819 | 5,460 | 560 |
| R200 | 2,080 | 5,920 | |
| R300 | 1,040 | ||
| In-rack eSSD | |||
| GPU per compute tray | 4 | 4 | 4 |
| Total # of compute tray | 1,455 | 1,885 | 1,880 |
| eSSD per tray (TB) | 18 | 18 | 18 |
| Total eSSD (EB) | 26 | 34 | 34 |
| Blackwell extra (CSP deployment) per tray | |||
| Total eSSD (EB) | 46 67 | 46 63 | 46 6 |
| STX CMS Context Memory Platform | |||
| # of NVL72Rack | 28,889 | 96,667 | |
| # of CMSvsNVL72Rack | 0.125 | 0.125 | |
| # of storage tray (unit) | 16 | 16 | |
| eSSD per tray (TB) | 32 | 32 | |
| Total eSSD (EB) | 2 | 6 | |
| AMD (k units) | |||
| MI300/MI308 | 180 | 36 | - |
| MI325/350/375 | 540 | 84 | 288 |
| MI400 | 650 | 1,920 | |
| MI500 | 96 | ||
| GPU per compute tray | 4 | 4 | 4 |
| Total # of compute tray | 180 | 193 | 576 |
| eSSD per tray (TB) | 64 | 64 | 64 |
| Total eSSD (EB) | 12 | 12 | 37 |
| Total GPGPU eSSD usage (EB) | 105 | 111 | 83 |
| CPU Rack | |||
| Vera CPU | 1,030 | 2,270 | |
| eSSD per CPU (TB) | 8 | 8 | |
| Total eSSD (EB) | 8 | 18 | |
| Others | |||
| ChinaCSPusage (EB) | 80 | 120 | 180 |
| QLCusage(EB) | - | 100 | 230 |
| CSPInventory buffer% | 5% | 10% | 10% |
| TotalAINANDdemand(EB) | 205 | 400 | 609 |
Source: Company data, Gartner, Morgan Stanley Research estimates
M
Exhibit 3: Global NAND supply and demand still point to shortage in 2027
| 2025 | 2026e | 2027e | |
|---|---|---|---|
| Total AINANDdemand(EB) | 205 | 400 | 609 |
| Other Applications (EB) | |||
| non-AISSD (general server, PC, enterprise etc) | 396 | 387 | 401 |
| PCSSD | 209 | 181 | 175 |
| Enterprise SSD (non-AI) | 187 | 206 | 226 |
| Smartphones | 337 | 291 | 301 |
| Tablets | 34 | 34 | 34 |
| Flash Cards | 15 | 15 | 15 |
| USB Flash Drives | 10 | 10 | 10 |
| Other | 113 | 113 | 113 |
| Total non-AINANDdemand(EB) | 905 | 850 | 874 |
| TotalNANDdemand(EB) | 1,111 | 1,250 | 1,484 |
| Total NANDsupply (EB) | 1,128 | 1,058 | 1,347 |
| Sufficiency Ratio (%) | 2% | (15%) | (9%) |
| AI as %ofNANDdemand(EB) | 18% | 32% | 41% |
Source: Company data, Gartner, Morgan Stanley Research estimates
2028 Scenario Test
We think the biggest swing factor for 2028 and beyond could be related to YMTC. This Chinese NAND supplier currently has Fab4 and Fab5 under construction at the same time, with each having 100kwpm planned capacity. If they decide to dedicate all of that to NAND, with the announced five fabs, they could eventually take 24% market share in the global NAND industry (see Chipflation - Navigating A Memory Crisis).
In our base case scenario, we assume 5% YoY growth for non-AI NAND demand, and the rest of the supplier's capacity expansion to be the same as in our US Semiconductor team's forecast. We assume AI SSD demand will grow by another 30-60% YoY in 2028 vs. YMTC capacity ranging from 310kwpm (current base case) to 470kwpm (potential max capacity of all announced five fabs).
In conclusion, we still see NAND supply remaining tight into 2028 if AI capex continues to grow and YMTC keeps a more disciplined approach on expansion. However, if YMTC or other players accelerate greenfield expansion, there will likely be potential risks of oversupply.
M
Exhibit 4: YMTC capacity expansion vs. AI SSD growth scenario test
AI SSD demand growth % YoY in 2028
| 2% | 30% | 40% | 50% | 60% |
|---|---|---|---|---|
| 310 | -1% | -2% | -4% | -6% |
| 330 | 0% | -1% | -3% | -4% |
| 350 | 2% | 0% | -2% | -3% |
| 370 | 3% | 1% | -1% | -2% |
| 390 | 4% | 2% | 1% | -1% |
| 410 | 5% | 4% | 2% | 0% |
| 430 | 7% | 5% | 3% | 1% |
| 450 | 8% | 6% | 4% | 3% |
| 470 | 9% | 7% | 5% | 4% |
Source: Company data, Morgan Stanley Research
What's not included in our analysis?
- Potential wafer consumption and capacity squeeze from "Super High IOPS" SSD designed for AI inference workloads: If these new products enter volume production in 2028, they will likely consume 3x more capacity than a normal SSD would do, significantly tightening overall industry supply.
- New technology and AI applications that requires more SSD than we currently estimate.
- Potential demand upside from edge AI devices, or traditional cycle recovery.
M
Channel Checks
- 3Q26 NAND pricing is tracking at +30% QoQ for TLC eSSD while up only slightly for consumer grade NAND products due to pricing pressure weighing on smartphone and PC customers' margin.
- 3Q26 DRAM pricing is tracking at +20% QoQ for server grade products as consumer customers face similar pressure. Legacy DRAM products such as DDR3/4 tracking are much higher at +30-40% QoQ due to continued tightening supply and growing demand from AI related products (see Old Memory: Better to buy more)
- LTAs among memory suppliers and key major customers are still under negotiations. Micron announced in their past earnings that LTAs have both ceiling and floor prices that cap potential upside for pricing trends. According to our channel checks, customers are more willing to pay for the DRAM pricing to secure supply, while NAND pricing has received some push back.
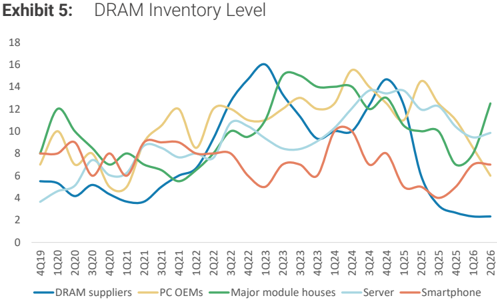
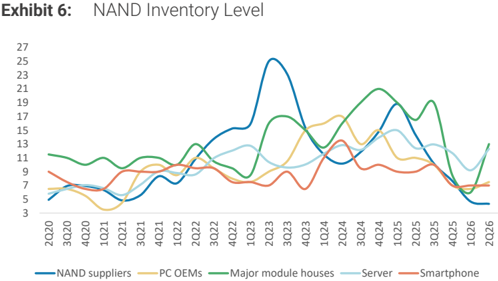
- At the end of 2Q26, supplier inventory levels remain at historical lows. Module makers inventory levels increased significantly from both DRAM and NAND, consistent with their inventory building strategy. Server customers' inventory level improved marginally while smartphone makers are receiving more DRAM inventory. PC markers' inventory levels continued to fall for DRAM while remaining flat for NAND.
- According to our channel checks, inventory levels for consumer grade (PC, smartphone) memory products are elevated at some Chinese memory distributors, while server products remain tight. Distributors noted that pricing levels are high (and their costs are also high given the aggressive price hikes in the past three quarters), discouraging mid-small buyers in the market. They do not think demand is fundamentally getting worse, but volume shrinkage leads to pressure from holding inventories for too long.
Based on our calculations, supply and demand dynamics will not reverse in the near term. However, increasing pricing pressure at the supply chain, customers' unwillingness/incapability to take higher prices and increasing levels of inventory at module makers/distributors indicate that mainstream consumer products pricing might hit a ceiling soon.
Source: TrendForce, Morgan Stanley Research
Source: TrendForce, Morgan Stanley Research
M
Module Makers: A Less Cyclical Business Model
The classic playbook: In the past decade, the memory industry has typically faced 4-6 quarters of upcycle, with inflection when new capacity comes online to meet demand. The cycle hasn't remained at an elevated level due to reinforced customer behavior - chase and add more orders - hence, exaggerating the shortage in an upcycle when pricing increases every quarter, while de-committing during the downcycle expecting pricing to be lower in the next quarter.
Traditionally, low cost inventory plays an important role in a module maker's business model. Module makers hoard low cost inventories at cycle troughs and sell into upcycles with greater margin elasticity. This business model also influences module makers' share price reactions - usually when low cost inventory is depleted, margin peaks and the stock price corrects.
Is this time different? Under a scenario where the memory industry faces prolonged shortage due to the AI demand boom, memory prices could remain at elevated levels for the next 3-5 years through LTAs. We believe this would fundamentally change the module maker business model in a more durable upcycle as well.
-
Stable margin vs. cyclical volatility: Low cost inventory will likely be depleted at some point this year (Longsys currently holds 2-3 quarters of inventory). With consumer memory pricing hikes narrowing into 2H26 and seen remaining at elevated levels, margins should gradually return to more normalized levels and become more stable than what we've seen in previous years.
-
Limited supply: We expect muted volume growth for module makers in both 2026 and 2027 as suppliers' allocations are being shifted to CSP customers. Moving into 2028, aggressive greenfield capacity expansion from domestic Chinese suppliers could be a tailwind for volume growth, but at the same time, they could present challenges on pricing support in a scenario of oversupply.
-
EPS lift through mix shift and margin expansion: In an environment where volume growth limited and market pricing is stable, module makers would be challenged to differentiate themselves through premium product mix shifts and new growth engines that can increase ASPs, hence the earnings to support valuation and share price performance.
M
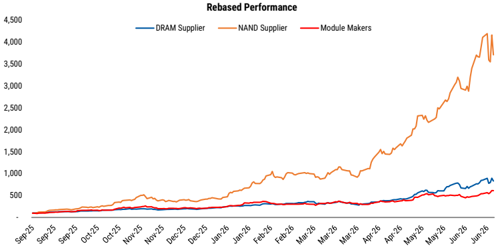
Exhibit 7: NAND suppliers have outperformed significantly in this supercycle
Source: FactSet, Morgan Stanley Research
Exhibit 9:
Module makers relative performance vs. respective country index
Source: FactSet, Morgan Stanley Research
Exhibit 8: Module makers' valuation has contracted to a more reasonable level after significant upward earnings revisions
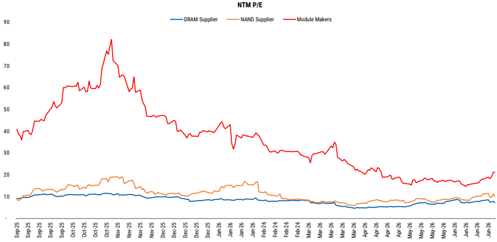
Source: FactSet, Morgan Stanley Research
M
AI Module: Boot Drive Bottom-up Updates
In our February Phison downgrade report, we published a bottom-up analysis for our boot drive model for the growing AI market. As there is now more visibility into 2027's AI GPU, CPU and ASIC chip shipments, together with ongoing price increases for boot drive modules, we further update our bottom-up analysis:
Boot drive modules are a foundational, but often overlooked, component in modern server racks, particularly in large-scale AI and cloud infrastructure. While they do not participate directly in model training or inference workloads, boot drives are missioncritical for system availability, orchestration and recoverability. At a high level, boot drives provide the persistent local storage required to initialize hardware, load operating systems, and maintain essential control-plane functions across compute nodes, switches, and management servers within a rack.
Core Functions of Boot Drive Modules
- System Initialization and Hardware Bring-Up: Boot drives store the system firmware, boot loader, and operating system images required to power on servers, switches, and management nodes. Without a local boot device, hardware cannot reliably initialize, even in disaggregated or network-booted environments.
- Control Plane and OS Persistence: In modern AI racks, boot drives host: 1) containerized operating systems; 2) device drivers (GPU, NIC, NVLink, accelerators); 3) system services and orchestration agents. This ensures each node can operate autonomously and recover independently from network or storage disruptions.
- Configuration, Logs, and Telemetry Storage: Boot drives retain system configuration files, event logs, and telemetry data critical for debugging, compliance and fleet-level monitoring. This function is particularly important in hyperscale and AI factory environments where rapid fault isolation is required.
- Fast Recovery and Operational Resilience: Local boot drives enable rapid reboot and redeployment, Isolation of failures to individual nodes, reduced dependency on shared storage during recovery events. This materially improves system uptime and operational efficiency.
While boot drives represent a smaller share of total storage capacity compared with data cache or training storage, their ubiquity and mandatory nature make them a stable and scalable demand driver. As system software footprints expand due to containerization, monitoring, and local inference workloads, boot drive capacity requirements continue to rise, increasing cumulative storage content per rack.
We try to gauge the TAM for NVIDIA's Blue Field 3 and upcoming Blue Field 4 boot drive, based on the rack shipments we see as reasonable in the near term. We also try to size other boot drive markets, as general servers and ASIC server racks also require boot drives to function.
SIMO and Solidigm are the major providers of the Blue Field 3 boot drive module. However, we see SIMO as having 100% market share in controllers, as the other module maker pairs its SSD with SIMO's solution. We estimate the GB200/300 server rack and Blue Field 3 boot drive will contribute 2.3%/0.9% of total revenue to SIMO in
M
2026/2027e.
As NVIDIA decided to increase and standardize the boot drive content in its upcoming Vera Rubin rack, we have seen multiple module, controller and raw NAND vendors joining the supply for Blue Field-4 boot drives. These include, SIMO, Phison and Realtek.
As a general server, AMD's GPU and other ASIC server racks would also require boot drive modules/controllers inside the system, we calculate the TAM for non-boot drives needed based on our current estimates for shipments.
Exhibit 10: Gauging the TAM for boot drives in Vera Rubin Rack: SIMO to see around 3%/7% of total revenue coming from Vera Rubin rack in 2026e/2027e; But we see the revenue contribution remaining quite limited for Phison into 2027e
| Boot Drive Content per Vera Rubin rack Tray name | Tray numbers | Boot drive | SSD required spec | boot drive demand |
|---|---|---|---|---|
| Compute Tray | 18 | 1 | 1.92 TB M.2 NVMe | 18 |
| Switch Tray (NVLink) | 9 | 1 | 240G-960G M.2 | 9 |
| ToR Switch (IB/Eth) | 3 | 1 | 128G-256G M.2 | 3 |
| Management Server | 1 | 2 | 480G-960G M.2 (RAID1) | 2 |
| Total boot drive demand per rack | 32 | |||
| ASP per M.2 SSD module (US$) | 150 |
Source: Company data , Morgan Stanley Research estimates
Exhibit 11: Gauging the TAM for boot drives in CMS racks
| 2026e | 2027e | |
|---|---|---|
| Rubin (R200) chip shipment (mn units) | 2,080 | 5,920 |
| Rubin Ultra (R300) chip shipment (mn units) | 1,040 | |
| Implied Vera Rubin (Ultra) shipment (k units) | 29 | 97 |
| STX CMS Context Memory Platform | ||
| Storage tray (units) | 16 | 16 |
| Boot drive (units) | 2 | 2 |
| Content per 8 units of VR rack | 1 | 1 |
| Total CMS Boot Drive Consumption (k units) | 116 | 387 |
| Boot Drive ASP (US$) | 150 | 200 |
| SIMO market shares | 30% | 30% |
| Revenue contribution to SIMO (US$mn) | 5 | 23 |
Source: Company data , Morgan Stanley Research estimates
| 2026e | 2027e | |
|---|---|---|
| Total BlueField 4 boot drive content per rack | 32 | 32 |
| Rubin (R200) chip shipment (mn units) | 2,080 | 5,920 |
| Rubin Ultra (R300) chip shipment (mn units) Implied Vera Rubin (Ultra) shipment (k units) | 29 | 1,040 97 |
| Module ASP (US$) | 150 | 200 |
| Controller ASP (US$) | 20 | 20 |
| Module Market Shares | ||
| Phison | 30% | 30% |
| Silicon Motion | 30% | 30% |
| Others | 40% | 40% |
| Phison module revenue (US$mn) | 42 | 186 |
| Phison total revenue (US$mn) | 2,009 | 1,607 |
| %of total Phison revenue | 2.1% | 11.5% |
| SIMO module revenue (US$mn) | 42 | 186 |
| SIMO total revenue | 1,698 | 2,566 |
M
Exhibit 12: Gauging the TAM for boot drives in general servers and ASIC: SIMO to benefit most, with revenue contribution likely to reach 10%/12% in 2026e/2027e even with our conservative market share estimates of 5% in the overall TAM
| 2026e | 2027e | |
|---|---|---|
| Other application requiring boot drive | ||
| General Server shipment (k units) | 21,097 | 27,426 |
| General Server shipment Y/Y | 30.0% | 30.0% |
| AMD - MI series (k units) | 770 | 2,304 |
| GPU per compute tray | 4 | 4 |
| AMD Tray # (k units) | 193 | 576 |
| ASIC - AWS Trainium (k units) | 1,700 | 2,380 |
| ASIC per compute tray | 4 | 4 |
| AWS Tray # (k units) | 425 | 595 |
| ASIC - Meta MTIA (k units) | 150 | 550 |
| ASIC per compute tray | 4 | 4 |
| MTIA Tray # (k units) | 37.5 | 137.5 |
| Google TPU (k units) | 4,080 | 8,168 |
| ASIC per compute tray | 4 | 4 |
| Google Tray # (k units) | 1,020 | 2,042 |
| Number of boot drive needed per tray | 1 | 1 |
| Total boot drive consumption in general server and ASICs (k units) | 22,772 | 30,776 |
| ASP for boot drive module | 150 | 200 |
| ASP for boot drive controller | 20 | 20 |
| Market share analysis | ||
| Phison | 5% | 5% |
| SIMO | 5% | 5% |
| Others | 90% | 90% |
| Revenue contribution | ||
| Phison module revenue (US$mn) | 171 | 308 |
| Phison total revenue (US$mn) | 8,699 | 6,949 |
| %of total Phison revenue | 2.0% | 4.4% |
| SIMO module revenue (US$mn) | 171 | 308 |
| SIMO total revenue (US$mn) | 1,698 | 2,566 |
| %of total SIMO revenue | 10.1% | 12.0% |
Source: Company data, Morgan Stanley Research estimates
M
Exhibit 13: We expect AI boot drives to contribute 2%/7% of Phison's 2026e/2027e total revenue, while SIMO sees 15%/21% in the same period
| 2026e | 2027e | |
|---|---|---|
| Phison Revenue (US$mn) | ||
| Vera Rubin and BlueField 4 Boot Drive Module | 42 | 186 |
| General server, AI GPU, ASIC and other Boot Drive Module | 171 | 308 |
| Total Revneue contribution from Boot Drive Module | 212 | 493 |
| Phison total revenue (US$mn) | 8,699 | 6,949 |
| %of total Phison revenue | 2% | 7% |
| SIMO Revenue (US$mn) | ||
| Grace Blackwell and BlueField 3 Boot Drive Module | 39 | 24 |
| Vera Rubin and BlueField 4 Boot Drive Module | 42 | 186 |
| General server, AI GPU, ASIC and other Boot Drive Module | 171 | 308 |
| STX CMS Context Memory Boot Drive Module | 5 | 23 |
| Total Revneue contribution from Boot Drive Module | 256 | 541 |
| SIMO total revenue (US$mn) | 1,698 | 2,566 |
| %of total SIMO revenue | 15% | 21% |
Source: Company data, Morgan Stanley Research estimates
M
SIMO: Earnings Revision Estimates, Valuation Methodology and Quarterly Financials
We factor in actual 1Q26 results and lift GAAP EPS by 59% and 66% for 2026e and 2027e, and introduce 2028e estimates: We factor in the better-than-expected 1Q26 result and strong 2Q26 and 2026 full-year guidance, as the company is seeing market share gains in the consumer tech area and enterprise SSD front. We also factor in our estimates for the boot drive TAM analysis in this report. For gross margin, we raise our assumptions for the SSD module business, but lower our gross margin estimates for boot drives given the elevated raw NAND costs. The difference between GAAP and non-GAAP earnings primarily reflects unrealized investment gains recorded in recent quarters.
Exhibit 14: SIMO: Earnings estimate revisions
| US$ mn, in GAAP | New '26E | Old '26E | Diff. | New '27E | Old '27E | Diff. | New '28E |
|---|---|---|---|---|---|---|---|
| Net sales | 1,698 | 1,268 | 34% | 2,566 | 1,586 | 62% | 3,485 |
| Gross profit | 825 | 621 | 33% | 1,298 | 816 | 59% | 1,843 |
| Operating profit | 357 | 247 | 44% | 693 | 431 | 61% | 1,104 |
| Pretax Income | 385 | 255 | 51% | 700 | 439 | 59% | 1,110 |
| Net income | 324 | 204 | 59% | 581 | 351 | 65% | 922 |
| GAAP EPS (US$) | 9.55 | 6.01 | 59% | 17.13 | 10.35 | 66% | 27.17 |
| Non-GAAP EPS (US$) | 9.44 | 6.54 | 44% | 17.54 | 10.88 | 61% | 27.58 |
| Margins | |||||||
| Gross margin | 48.6% | 49.0% | 50.6% | 51.4% | 52.9% | ||
| Operating margin | 21.0% | 19.5% | 27.0% | 27.2% | 31.7% | ||
| Pretax margin | 22.7% | 20.1% | 27.3% | 27.7% | 31.9% | ||
| Net margin | 19.1% | 16.1% | 22.6% | 22.1% | 26.4% |
Source: Company data, Morgan Stanley Research estimates
Exhibit 15: SIMO: Quarterly financials
| US$ in million | 1Q26 | 2Q26E | 3Q26E | 4Q26E | 1Q27E | 2Q27E | 3Q27E | 4Q27E | 1Q28E | 2Q28E | 3Q28E | 4Q28E | 2024 2025 2026E 2027E 2028E | 2024 2025 2026E 2027E 2028E | 2024 2025 2026E 2027E 2028E | 2024 2025 2026E 2027E 2028E | 2024 2025 2026E 2027E 2028E | 2024 2025 2026E 2027E 2028E |
|---|---|---|---|---|---|---|---|---|---|---|---|---|---|---|---|---|---|---|
| Total Revenues | 342 | 414 | 452 | 490 | 568 | 614 | 679 | 705 | 757 | 836 | 919 | 973 | 804 | 886 | 1,698 | 2,566 | 3,485 | 3,485 |
| Sequential Change | 22.9% | 21.1% | 9.0% | 8.5% | 15.9% | 8.1% | 10.7% | 3.8% | 7.4% | 10.4% | 10.0% | 5.8% | ||||||
| Change vs Year Ago | 105.5% | 108.5% | 86.6% | 75.9% | 65.9% | 48.1% | 50.5% | 44.0% | 33.4% | 36.2% | 35.3% | 38.0% | 25.7% | 10.2% | 91.7% | 51.1% | 35.8% | 35.8% |
| Cost of Sales - GAAP | 181 | 212 | 231 | 249 | 282 | 304 | 335 | 347 | 361 | 397 | 431 | 455 | 435 | 458 | 872 51% | 1,268 49% | 1,643 | 1,643 |
| Percent of Revenues | 53% | 51% | 51% | 51% | 50% | 50% | 49% | 49% | 48% | 47% | 47% | 47% | 54% | 52% | 1,268 | 47% | ||
| Cost of Sales - non GAAP | 181 | 211 | 231 | 249 | 282 | 304 | 335 | 347 | 361 | 397 | 431 | 455 | 434 | 458 | 872 | 1,643 | 1,643 | |
| Percent of Revenues | 53% | 51% | 51% | 51% | 50% | 50% | 49% | 49% | 48% | 47% | 47% | 47% | 54% | 52% | 51% | 49% | 47% | 47% |
| Gross Profit - GAAP | 161 | 203 | 221 | 241 | 286 | 310 | 344 | 358 | 397 | 439 | 489 | 518 | 369 | 428 | 825 | 1,298 | 1,843 | 1,843 |
| Gross Margin GAAP% | 47.1% | 48.9% | 48.9% | 49.2% | 50.4% | 50.5% | 50.7% | 50.7% | 52.4% | 52.5% | 53.2% | 53.3% | 45.9% | 48.3% | 48.6% | 50.6% | 52.9% | 52.9% |
| Gross Profit - non GAAP | 161 47.2% | 203 48.9% | 221 48.9% | 241 49.2% | 286 50.4% | 310 50.5% | 344 50.7% | 358 | 397 52.4% | 439 52.5% | 489 53.2% | 518 53.3% | 369 46.0% | 428 48.3% | 826 48.7% | 1,298 50.6% | 1,843 52.9% | 1,843 52.9% |
| Gross Margin non GAAP% | 50.7% | |||||||||||||||||
| Total Opex - GAAP | 109 | 115 | 125 | 119 | 135 | 156 | 161 23.8% | 152 21.5% | 158 20.9% | 179 | 199 | 202 | 278 | 334 | 468 27.6% | 605 23.6% | 739 | 739 |
| Percent of Revenues Total Opex - non GAAP | 31.9% 99 | 27.7% 111 | 27.7% 122 | 24.4% 116 | 23.9% 132 | 25.4% 153 | 158 | 149 | 155 | 21.4% 176 | 21.7% 196 | 20.8% 199 | 34.6% 261 | 37.8% 309 | 450 | 591 | 725 | 725 |
| Percent of Revenues | 29.0% | 26.9% | 27.0% | 23.3% | 24.9% | 23.3% | 21.1% | 20.5% | 21.0% | 21.3% | 20.4% | 32.5% | 34.8% | 26.5% | 23.0% | 20.8% | 20.8% | |
| R&D - GAAP | 86 | 91 | 23.7% | 110 | 130 | 125 | 150 | 170 | 172 | 218 | 261 | 374 | 500 | 622 | 622 | |||
| Percent of Revenues | 25.2% | 22.1% | 101 22.5% | 95 19.4% | 19.4% | 21.2% | 135 19.9% | 17.7% | 130 17.2% | 17.9% | 18.5% | 17.7% | 27.1% | 29.4% | 22.0% | 19.5% | 17.8% | 17.8% |
| R&D - non GAAP | 81 | 91 | 101 | 95 | 110 | 130 | 135 | 125 | 130 | 150 | 170 | 172 | 207 | 243 | 369 | 500 | 622 | 622 |
| Percent of Revenues | 23.8% | 22.1% | 22.5% | 19.4% | 19.4% | 21.2% | 19.9% | 17.7% | 17.2% | 17.9% | 18.5% | 17.7% | 25.7% | 27.4% | 21.8% | 19.5% | 17.8% | 17.8% |
| SG&A - GAAP | 23 | 23 | 24 | 24 | 25 | 26 | 26 | 27 | 28 | 29 | 29 | 30 | 60 | 74 | 94 | 105 | 117 | 117 |
| Percent of Revenues | 6.7% | 5.6% | 5.3% | 5.0% | 4.5% | 4.2% | 3.9% | 3.8% | 3.8% | 3.5% | 3.2% | 3.1% | 7.5% | 8.3% | 5.6% | 4.1% | 3.4% | 3.4% |
| SG&A - non GAAP | 19 | 20 | 20 | 21 | 22 | 23 | 23 | 24 | 25 | 26 | 26 | 27 | 55 | 66 | 80 | 91 | 103 | 103 |
| Percent of Revenues | 5.7% | 4.8% | 4.5% | 4.3% | 3.9% | 3.7% | 3.4% | 3.3% | 3.3% | 3.1% | 2.8% | 2.7% | 6.8% | 7.4% | 4.7% | 3.5% | 3.0% | 3.0% |
| Operating Income - GAAP | 52 | 88 | 96 | 122 | 151 | 154 | 183 | 206 | 238 | 260 | 289 | 316 | 91 | 93 | 357 | 693 | 1,104 | 1,104 |
| Percent of | 15.3% | 21.2% | 21.1% | 24.8% | 26.6% | 25.1% | 26.9% | 29.2% | 31.5% | 31.1% | 31.5% | 32.5% | 11.3% | 10.5% 2% | 21.0% | 27.0% | 31.7% | 31.7% |
| Revenues Change vs Year Ago | 435% | 293% | 227% | 283% | 189% | 75% | 54% | 128% | 284% | 59% | 59% | |||||||
| Operating Income - non GAAP | 62 | 91 | 99 | 125 | 154 | 157 | 92% 186 | 69% | 58% | 69% | 58% | 320 | 108 | 119 | 94% | 1,118 | 1,118 | |
| Percent of Revenues | 18.2% | 22.1% | 21.9% | 25.5% | 27.2% | 25.6% | 27.4% | 209 29.7% | 242 31.9% | 264 31.6% | 293 31.8% | 32.8% | 13.4% | 13.5% | 376 22.2% | 707 27.6% | 32.1% | 32.1% |
| Change vs Year Ago | 319% | 261% | 159% | 133% | 148% | 72% | 88% | 67% | 57% | 68% | 57% | 53% | 76% | 10% | 215% | 88% | 58% | 58% |
| Total Non-operating Income(Loss) | 23 | 2 | 2 | 2 | 2 | 2 | 2 | 2 | 2 | 2 | 2 | 2 | 17 | 47 | 28 | 6 | 6 | 6 |
| Profit Before Taxes | 76 | 89 | 97 | 123 | 152 | 155 | 185 | 207 | 240 | 262 | 291 | 318 | 107 | 140 | 385 | 700 | 1,110 | 1,110 |
| Percent of Revenues | 22% | 22% | 22% | 25% | 27% | 25% | 27% | 29% | 32% | 31% | 32% | 33% | 13% | 16% | 23% | 27% | 32% | 32% |
| Taxes | 9 | 15 | 17 | 21 | 26 | 26 | 31 | 35 | 41 | 45 | 49 | 54 | 18 | 17 | 61 | 119 | 189 | 189 |
| Tax Rate | 11.6% | 17.0% | 17.0% | 17.0% | 17.0% | 17.0% | 17.0% | 17.0% | 17.0% | 17.0% | 17.0% | 17.0% | 16.9% | 12.5% | 15.9% | 17.0% | 17.0% | 17.0% |
| Net Income - GAAP | 67 | 74 | 81 | 102 | 126 | 129 | 153 | 172 | 199 | 217 | 241 | 264 | 89 | 123 | 324 | 581 | 922 | 922 |
| Percent of Revenues Change vs Year Ago | 20% | 18% | 18% 106% | 21% 114% | 22% | 21% | 23% | 24% | 26% | 26% | 26% | 27% | 11% | 14% | 19% | 23% | 26% | 26% |
| 243% | 355% | 89% | 74% | 90% | 68% | 57% | 69% | 58% | 53% | 69% | 37% | 164% | 79% | 59% | 59% | |||
| Net Income - non GAAP | 54 | 78 | 84 | 106 | 130 | 132 | 221 | 101 | 107 | 935 | 935 | 935 | ||||||
| Percent of Revenues | 16% | 22% | 157 | 176 | 203 | 26% | 245 27% | 267 | 12% | 320 19% | 27% | 27% | ||||||
| 19% | 19% | 23% | 22% | 23% | 25% | 27% | 27% | 13% | 595 23% | |||||||||
| Diluted Earnings per ADS (US$, GAAP) | 1.97 | 2.19 | 2.38 | 3.01 | 3.73 | 3.80 | 4.52 | 5.08 | 5.87 | 6.41 | 7.12 | 7.78 | 2.65 | 3.63 9.55 | 17.13 79% | 27.17 | ||
| Change vs Year Ago (US$, | 105% | 114% | 89% | 74% | 68% | 37% 163% | 59% | 59% | 59% | |||||||||
| Diluted Earnings per ADS | 243% 1.59 | 350% 2.29 | 2.48 | 3.12 | 3.83 | 3.91 | 90% 4.62 | 68% 5.18 | 57% | 69% | 58% 7.22 | 53% 7.88 | 3.01 | 3.16 | 9.44 | 27.58 | 17.54 | 17.54 |
| non GAAP) Change vs Year Ago | 165% | 235% | 147% | 148% | 141% | 70% | 86% | 66% | 5.97 56% | 6.51 67% | 56% | 52% | 64% | 5% | 198% 86% | 57% | 57% |
Source: Company data, Morgan Stanley Research estimates
We increase our price target from US$155 to US$400: This reflects the changes in our 2026-27 earnings estimates and also introduced 2028e estimates. We also roll forward our RI base from 2025 to 2026e. We keep other RI assumptions unchanged, including a cost of equity of 9.5% (risk-free rate 2.0%, risk premium 6%, beta of 1.25), payout ratio of
M
62%, intermediate-term growth rate of 8.6%, and long-term growth rate of 4%. Our bull and bear case also increase from US$225 and US$68 to US$580 and US$175, respectively, implying 33x and 10x 2027e EPS.
Exhibit 16: SIMO: RI model
| US$million | 2026E | 2027E | 2028E | 2029E | 2030E | 2031E | 2032E | 2033E | 2034E | 2035E | 2036E | 2037E |
|---|---|---|---|---|---|---|---|---|---|---|---|---|
| Total Equity | 1,106 | 1,557 | 2,246 | 2,707 | 3,207 | 3,750 | 4,339 | 4,980 | 5,675 | 6,431 | 7,251 | 8,142 |
| Net Profit | 324 | 581 | 922 | 1,001 | 1,087 | 1,180 | 1,282 | 1,392 | 1,512 | 1,642 | 1,783 | 1,937 |
| ROAE | 33.5% | 43.6% | 48.5% | 40.4% | 36.8% | 33.9% | 31.7% | 29.9% | 28.4% | 27.1% | 26.1% | 25.2% |
| Residual Income | 199 | 377 | 606 | 694 | 737 | 783 | 831 | 883 | 938 | 998 | 1,063 | 1,133 |
| Spread | 23.9% | 34.1% | 38.9% | 30.9% | 27.2% | 24.4% | 22.2% | 20.3% | 18.8% | 17.6% | 16.5% | 15.6% |
| Ending Equity Capital | 1,106 | |||||||||||
| PV of Forecast Period | 4,654 | |||||||||||
| PV of Continuing Value | 7,818 | |||||||||||
| Equity Value | 13,578 | |||||||||||
| No. of Shares | 34 | |||||||||||
| Projected Price | 400 |
Source: Company data, Morgan Stanley Research estimates
Exhibit 17: SIMO: P/E band
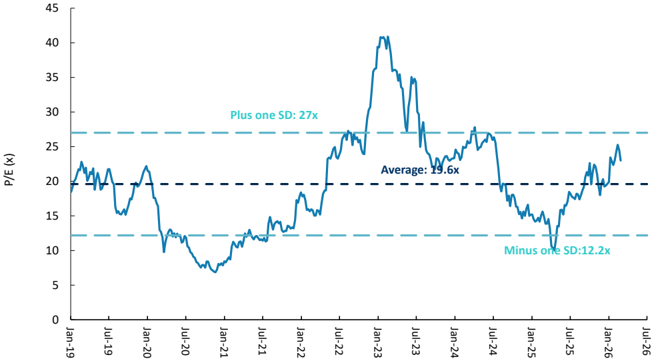
Source: Company data, Factset, Morgan Stanley Research estimates
Exhibit 18: SIMO: DOI
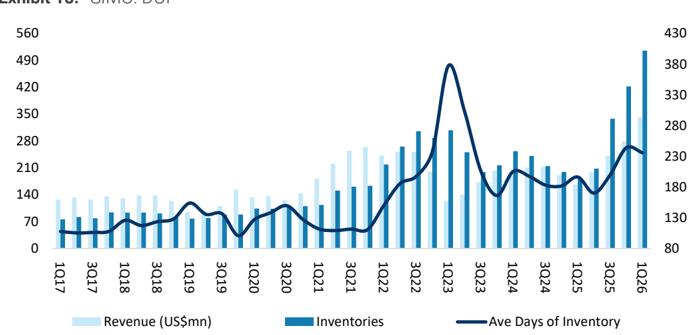
Source: Company data, Factset, Morgan Stanley Research estimates
M
Risk Reward - Silicon Motion (SIMO.O) Risk Reward - Silicon Motion (SIMO.O)
More eSSD opportunities from 2026; OW
US$400.00 PRICE TARGET
Base case, residual income model. Key assumptions: cost of equity of 9.5% (risk-free rate 2.0%, risk premium 6%, beta of 1.25), payout ratio of 62%, intermediate-term growth rate of 8.6%, and long-term growth rate of 4%.
US$266.74
Mean
Consensus Price Target Distribution
Source: Refinitiv, Morgan Stanley Research
RISK REWARD CHART
Source: Refinitiv, Morgan Stanley Research
BULL CASE
US$580.00
33x 2027e EPS
Rapid SSD controller IC growth: SSD
controller ICs enjoy fast adoption in EM. The eMMC business also grows via new design wins. SSD solutions show strong growth momentum given increasing demand from data center customers. The consumer tech and PC market recovers faster than expected. Inventory problems are also resolved.
US$80.00
BASE CASE
US$400.00
23x 2027e EPS
Stronger revenue momentum along with
GM expansion: SSD penetration ramps up as expected, providing downside support, and UFS secures sustained design wins in the next few years. Better-than-expected momentum into 2H26 as we see some green shoots in PC OEMs on low inventory levels. We see more outsourcing opportunities from NAND players and new opportunities at NVIDIA.
US$450.00
MS PT
Morgan Stanley Estimates
OVERWEIGHT THESIS
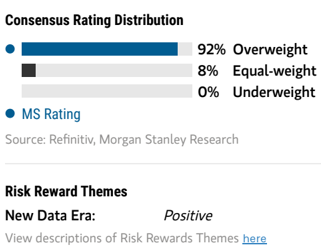
- We expect SIMO to enjoy better pricing power and earnings visibility, supported by a growing backlog and more business opportunities in the AI era.
- We believe SIMO can enjoy AI-era trends. 1) AI PCs can be a catalyst accelerating notebook market growth. 2) We see QLC and TLC NAND business potential for enterprise servers and smartphone customers in the US and China. 3) NVIDIA's Blue Field ecosystem offers new TAM in AI.
- We expect further margin expansion in 2026-27, reaching the company's target of 48-50%.
- We expect the stock to trade to 23x 2027e EPS, given the better outlook for 2026, more outsourced opportunities from NAND players and new opportunities in AI boot drives and NVIDIA.
BEAR CASE
10x 2027e EPS
Key customer moves UFS in-house; slower PCIe gen 4 development: Customers
successfully introduce in-house UFS controller ICs and allocate less than 50% of orders to Silicon Motion. SSD controller ICs do not gain widespread adoption amid price declines due to lukewarm EM demand, while SIMO's own product migration slows. China's data center demand slows significantly and the economy recovers later than expected. The inventory issues are more severe than expected.
US$175.00
M
Risk Reward - Silicon Motion (SIMO.O)
KEY EARNINGS INPUTS
| Drivers | Dec 2025 | Dec 2026e Dec 2027e Dec 2028e | Dec 2026e Dec 2027e Dec 2028e | Dec 2026e Dec 2027e Dec 2028e |
|---|---|---|---|---|
| Revenue from eMMC + UFS (US$, mn) | 336 | 625 | 676 | 698 |
| Revenue from SSD Controllers (US$, mn) | 468 | 665 | 1,216 | 1,872 |
| Revenue from Removable Memory Card (US$, mn) | 40 | 0 | 0 | 0 |
| Revenue from SSD solutions (Shannon+ Ferri) (US$, mn) | 37 | 382 | 666 | 908 |
INVESTMENT DRIVERS
- SSD market growth and new customer wins
- Enterprise SSD solution business development
- Progress in eMMC business
GLOBAL REVENUE EXPOSURE
Source: Morgan Stanley Research Estimate View explanation of regional hierarchies here
RISKS TO PT/RATING
CATALYST CALENDAR
| Date | Source: Refinitiv, Morgan Stanley Event |
|---|---|
| 23 Sep 2026 - | Silicon Motion Technology Corp Annual Shareholders |
| 27 Sep 2026 | Meeting |
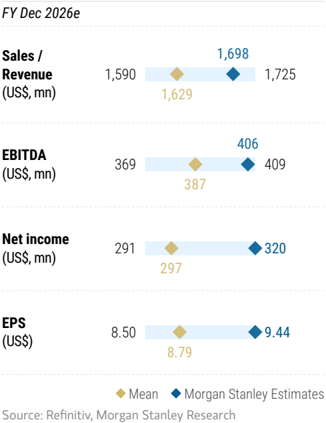
MS ESTIMATES VS. CONSENSUS
RISKS TO UPSIDE
- New acquisition deals announced
- Significantly increased penetration of SSD
- Traction for open channel module
- eSSD share gain
RISKS TO DOWNSIDE
- Weaker-than-expected penetration of SSD
- Open channel module loses traction with weaker-than-expected demand
- eSSD share loss
OWNERSHIP POSITIONING
| Inst. Owners, % Active | 84.1% |
|---|---|
| HF Sector Long/Short Ratio | 2.1x |
| HF Sector Net Exposure | 29.5% |
Refinitiv; MSPB Content. Includes certain hedge fund exposures held with MSPB. Information may be inconsistent with or may not reflect broader market trends. Long/Short Ratio = Long Exposure / Short exposure. Sector % of Total Net Exposure = (For a particular sector: Long Exposure - Short Exposure) / (Across all sectors: Long Exposure - Short Exposure).
M
SIMO: Financial Summary
Income Statement
| US$mn (Years End Dec ) | 2024 | 2025E | 2026E | 2027E | 2028E |
|---|---|---|---|---|---|
| Net sales | 804 | 886 | 1,698 | 2,566 | 3,485 |
| COGS | (434) | (458) | (872) | (1,268) | (1,643) |
| Gross profit | 369 | 428 | 826 | 1,298 | 1,843 |
| Operating expenses | (278) | (335) | (469) | (605) | (739) |
| Operating income | 91 | 93 | 357 | 693 | 1,104 |
| Non-operating income | 17 | 47 | 28 | 6 | 6 |
| Pre-tax income | 107 | 140 | 385 | 700 | 1,110 |
| Income tax | 18 | 17 | 61 | 119 | 189 |
| Reported net Income | 89 | 123 | 324 | 581 | 922 |
| Adj.wtd.avg.shrs( m) | 34 | 34 | 34 | 34 | 34 |
| Earnings per ADS (US$, GAAP) | 2.65 | 3.63 | 9.55 | 17.13 | 27.17 |
| Earnings per ADS (US$, non GAAP) | 3.01 | 3.16 | 9.44 | 17.54 | 27.58 |
| Modelware EPS (US$) | 3.01 | 3.16 | 9.44 | 17.54 | 27.58 |
Balance Sheet
| US$mn (Years End Dec ) | 2024 | 2025E | 2026E | 2027E | 2028E |
|---|---|---|---|---|---|
| Cash | 276 | 202 | 72 | 48 | 257 |
| Mkt Securities | 0 | 0 | 0 | 0 | 0 |
| AR/NR | 234 | 212 | 532 | 805 | 1,093 |
| Inventory | 199 | 422 | 597 | 868 | 1,125 |
| Other | 88 | 108 | 108 | 108 | 108 |
| Current Assets | 797 | 943 | 1,310 | 1,829 | 2,583 |
| Long-term investments | 17 | 30 | 30 | 30 | 30 |
| Fixed assets | 188 | 219 | 201 | 183 | 164 |
| Deferred assets | 0 | 0 | 0 | 0 | 0 |
| Other assets | 30 | 31 | 31 | 31 | 31 |
| Total Assets | 1,033 | 1,223 | 1,571 | 2,072 | 2,807 |
| S/T borrowings | 0 | 0 | 0 | 0 | 0 |
| AP/NP | 18 | 35 | 108 | 157 | 204 |
| Other ST liabilities | 182 | 305 | 305 | 305 | 305 |
| LT debt | 0 | 0 | 0 | 0 | 0 |
| Other LT liabilities | 60 | 52 | 52 | 52 | 52 |
| Common shares | 0 | 0 | 0 | 0 | 0 |
| Total Liabilities | 259 | 392 | 466 | 515 | 561 |
| Additional capital | 0 | 0 | 0 | 0 | 0 |
| Retained earning | 0 | 0 | 275 | 726 | 1,415 |
| Other shareholders' equity | 774 | 831 | 831 | 831 | 831 |
| Total Equity | 774 | 831 | 1,106 | 1,557 | 2,246 |
| Total Liab. & Shrhldr's Equity | 1,033 | 1,223 | 1,571 | 2,072 | 2,807 |
E = Morgan Stanley Research Estimates
Source: Morgan Stanley Research, Company Data
Cash Flow Statement
| US$mn (Years End Dec ) | 2024 | 2025E | 2026E | 2027E | 2028E |
|---|---|---|---|---|---|
| Cashflow from Operations | 77 | 61 | (69) | 117 | 453 |
| Net profits | 89 | 123 | 324 | 581 | 922 |
| Depreciation | 25 | 30 | 30 | 30 | 30 |
| Working Capital Change | (60) | (190) | (423) | (494) | (498) |
| Other adjustments | 22 | 99 | 0 | 0 | 0 |
| Cashflow from Investing | (44) | (27) | (12) | (12) | (12) |
| Capex | (43) | (27) | (12) | (12) | (12) |
| Change of LT Investment | 0 | 0 | 0 | 0 | 0 |
| Change of ST Investment | 0 | 0 | 0 | 0 | 0 |
| Other adjustments | (1) | 0 | 0 | 0 | 0 |
| Cashflow from financing | (71) | (92) | (49) | (130) | (232) |
| Increase in L/T debt | 0 | 0 | 0 | 0 | 0 |
| Increase in S/T debt | 0 | 0 | 0 | 0 | 0 |
| Cash Dividend Paid | (67) | (67) | (49) | (130) | (232) |
| Dir& Emp Bonus Paid | 0 | 0 | 0 | 0 | 0 |
| Issuance of stock | 0 | 0 | 0 | 0 | 0 |
| Other adjustments | (4) | (24) | 0 | 0 | 0 |
| Exchange rate adjustment | 0 | (17) | 0 | 0 | 0 |
| Net change in cash | -38 | -74 | -130 | -24 | 209 |
Financial Ratios
| 2024 | 2025E | 2026E | 2027E | 2028E | |
|---|---|---|---|---|---|
| Growth(%) | |||||
| Turnover | 25.7 | 10.2 | 91.7 | 51.1 | 35.8 |
| Operating profits | 127.9 | 2.4 | 283.8 | 94.2 | 59.2 |
| Pretax profits | 75.9 | 30.5 | 175.0 | 81.7 | 58.6 |
| Net profits | 68.8 | 37.4 | 164.1 | 79.4 | 58.6 |
| EPS | 64.0 | 5.3 | 198.3 | 85.8 | 57.3 |
| Margins (%) | |||||
| Gross Margin | 46.0 | 48.3 | 48.7 | 50.6 | 52.9 |
| Operating Margin | 11.3 | 10.5 | 21.0 | 27.0 | 31.7 |
| Pretax Margin | 13.4 | 15.8 | 22.7 | 27.3 | 31.9 |
| Net Profit | 11.1 | 13.8 | 19.1 | 22.6 | 26.4 |
| Return (%) | |||||
| ROAE | 11.8 | 15.3 | 33.5 | 43.6 | 48.5 |
| ROAA | 8.7 | 10.9 | 23.2 | 31.9 | 37.8 |
| Gearing (%) | |||||
| Net Debt/Equity | (35.7) | (24.3) | (6.5) | (3.1) | (11.4) |
| Liabilities/Equity | 33.5 | 47.2 | 42.1 | 33.1 | 25.0 |
| Ratios (X) | |||||
| Current ratio | 4.0 | 2.8 | 3.2 | 4.0 | 5.1 |
| Quick ratio | 2.6 | 1.2 | 1.5 | 1.8 | 2.7 |
| Others | |||||
| AR/NR Turnover (days) | 114 | 114 | 114 | 114 | 114 |
| Inventory Turnover (days) | 250 | 250 | 250 | 250 | 250 |
| AP Turnover (days) | 45 | 45 | 45 | 45 | 45 |
| Cash Conversion (days) | 319 | 319 | 319 | 319 | 319 |
M
Longsys: Estimate Revisions
We previously forecast a downcycle from 2H27 onward, with shortages persisting in 2027. We now delay our downcycle assumption to 2H28, partially offset by volume shipment increases in a scenario where China domestic supply catches up.
We expect Longsys to continue to enhance its product mix profile and shift memory cost pressures through the TCM business (customers secure memory supply by themselves while Longsys provides customized module design and assembly services). Its R&D for the controller business will likely further enhance its margin profile over the long term through cost efficiency and firmware value-added services. Hence, we increase our longterm margin assumption to 25-38%, from the high teens previously.
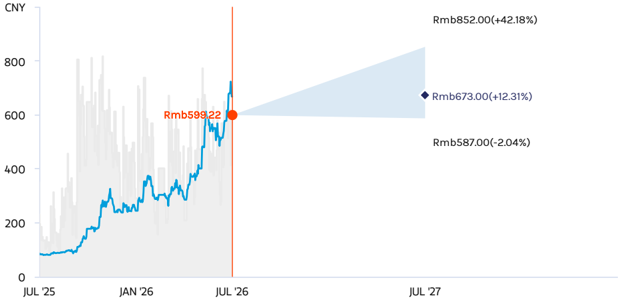
As such, our 2026-28 EPS estimates increase by 299%, 247% and 244%, respectively. Our residual income based model implied price target is now Rmb673, up from Rmb300 previously, implying 15.8x 2027e P/E.
In a bull case scenario where AI PC takes off and triggers investment sentiment on potential business upside, we raise our scenario value to Rmb852, from Rmb435, implying 20x 2027e P/E.
In a bear case scenario where edge AI demand recovery is weaker than expected due to shortage created from CSP capacity crowding-out effects, pricing likely remains at elevated levels. We raise our scenario value to Rmb587, from Rmb90, implying 5.0x 2027e P/B.
Exhibit 19: Estimate revisions
| 2026E | 2026E | 2026E | 2027E | 2027E | 2027E | 2028E | 2028E | 2028E | |
|---|---|---|---|---|---|---|---|---|---|
| (RMB mm) | Prior | New | Change | Prior | New | Change | Prior | New | Change |
| Total Sales | 36,899 | 65,852 | 78% | 40,850 | 85,564 | 109% | 48,745 | 81,251 | 67% |
| Embedded Storage | 20,912 | 24,865 | 19% | 23,224 | 30,894 | 33% | 27,579 | 29,263 | 6% |
| Mobile Memory | 4,457 | 19,719 | 342% | 5,061 | 24,317 | 380% | 5,695 | 22,645 | 298% |
| Solid-State Drive | 7,932 | 14,462 | 82% | 8,631 | 21,115 | 145% | 10,659 | 20,504 | 92% |
| Memory Module | 3,384 | 6,690 | 98% | 3,710 | 9,102 | 145% | 4,581 | 8,673 | 89% |
| Others | 213 | 116 | (46%) | 224 | 136 | (39%) | 231 | 165 | (28%) |
| Total GP | 11,605 | 36,052 | 211% | 10,364 | 29,928 | 189% | 8,835 | 21,610 | 145% |
| Embedded Storage | 6,443 | 13,135 | 104% | 5,342 | 9,924 | 86% | 5,516 | 7,376 | 34% |
| Mobile Memory | 2,488 | 11,815 | 375% | 2,025 | 10,295 | 408% | 1,139 | 7,854 | 590% |
| Solid-State Drive | 1,744 | 7,595 | 335% | 1,985 | 6,805 | 243% | 1,492 | 4,563 | 206% |
| Memory Module | 851 | 3,463 | 307% | 927 | 2,854 | 208% | 596 | 1,757 | 195% |
| Others | 78 | 44 | (44%) | 85 | 50 | (41%) | 92 | 61 | (34%) |
| GP Margin | 31% | 55% | 23.7 pp | 25% | 35% | 10.0 pp | 18% | 27% | 8.5 pp |
| Embedded Storage | 31% | 53% | 21.8 pp | 23% | 32% | 9.1 pp | 20% | 25% | 5.2 pp |
| Mobile Memory | 56% | 60% | 3.9 pp | 40% | 42% | 2.3 pp | 20% | 35% | 14.7 pp |
| Solid-State Drive | 22% | 53% | 30.5 pp | 23% | 32% | 9.2 pp | 14% | 22% | 8.3 pp |
| Memory Module | 25% | 52% | 26.8 pp | 25% | 31% | 6.4 pp | 13% | 20% | 7.3 pp |
| Others | 37% | 38% | 1.0 pp | 38% | 37% | (1.0)pp | 40% | 37% | (3.0)pp |
| NP | 6,169 | 23,974 | 289% | 5,057 | 17,070 | 238% | 3,025 | 10,370 | 243% |
| EPS (RMB$) | 14.99 | 59.86 | 299% | 12.28 | 42.62 | 247% | 7.33 | 25.19 | 244% |
Source: Company data, Morgan Stanley Research (E) estimates
Exhibit 20: Residual Income model
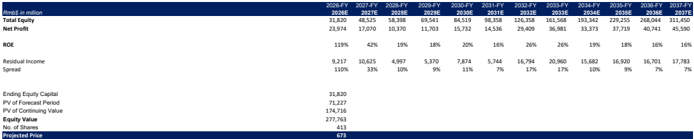
| Rmb$ in million | 2026-FY 2026E | 2027-FY 2027E | 2028-FY 2028E | 2029-FY 2029E | 2030-FY 2030E | 2031-FY 2031E | 2032-FY 2032E | 2033-FY 2033E | 2034-FY 2034E | 2035-FY 2035E | 2036-FY 2036E | 2037-FY 2037E |
|---|---|---|---|---|---|---|---|---|---|---|---|---|
| Total Equity | 31,820 | 48,525 | 58,398 | 69,541 | 84,519 | 98,358 | 126,358 | 161,568 | 193,342 | 229,255 | 268,044 | 311,450 |
| Net Profit | 23,974 | 17,070 | 10,370 | 11,703 | 15,732 | 14,536 | 29,409 | 36,981 | 33,373 | 37,719 | 40,741 | 45,590 |
| ROE | 119% | 42% | 19% | 18% | 20% | 16% | 26% | 26% | 19% | 18% | 16% | 16% |
| Residual Income | 9,217 | 10,625 | 4,997 | 5,370 | 7,874 | 5,744 | 16,794 | 20,960 | 15,682 | 16,920 | 16,701 | 17,783 |
| Spread | 110% | 33% | 10% | 9% | 11% | 7% | 17% | 17% | 10% | 9% | 7% | 7% |
| Ending Equity Capital | 31,820 | |||||||||||
| PV of Forecast Period | 71,227 | |||||||||||
| PV of Continuing Value | 174,716 | |||||||||||
| Equity Value | 277,763 | |||||||||||
| No. of Shares | 413 | |||||||||||
| Projected Price | 673 |
Source: Company data, Morgan Stanley Research (E) estimates
M
Exhibit 21: Financial Summary
| Income Statement | Cash Flow Statement | 2024 | 2025 | 2026E | 2027E | ||||||||
|---|---|---|---|---|---|---|---|---|---|---|---|---|---|
| (RMB mm) | 2023 | 2024 | 2025 | 2026E | 2027E | 2028E | (RMB mm) | 2023 (2,798) | (1,190) | (1,201) | 24,185 | 10,611 | 2028E 11,281 |
| Sales | 10,125 | 17,463 | 22,766 | 65,852 | 85,564 | 81,251 | Cash Flow from Operations | ||||||
| Cost of Sales | 9,296 | 14,136 | 18,349 | 29,800 | 55,637 | 59,641 | Net Income | (837) | 505 | 1,497 | 24,713 | 17,598 | 10,401 |
| Gross Profit | 829 | 3,327 | 4,417 | 36,052 | 29,928 | 21,610 | Depreciation and Amortization | 117 | 322 | 392 | 133 | 41 | 43 |
| Operating Expenses | 1,516 | 2,287 | 2,566 | 6,217 | 8,556 | 8,938 | Change in Working Capital | (1,894) | (1,123) | (3,661) | (661) | (7,028) | 837 |
| Operating Income | (686) | 1,040 | 1,852 | 29,835 | 21,371 | 12,673 | Other Non-Cash Items | (185) | (895) | 571 | 0 | 0 | 0 |
| EBITDA | (1,220) | 656 | 1,736 | 28,511 | 20,136 | 12,067 | |||||||
| Non-Operating Income | (371) | (450) | (107) | (391) | (421) | (290) | Cash Flow from Investing | (1,661) | (1,102) | (968) | (257) | (274) | (292) |
| Net Interest Income | 288 | 249 | 326 | 326 | 327 | 327 | Capital Expenditure | (1,455) | (601) | (544) | (167) | (176) | (184) |
| Pre-Tax Income | (1,058) | 590 | 1,744 | 29,444 | 20,950 | 12,382 | Increase in LT Investment | (36) | (331) | (192) | (94) | (104) | (114) |
| Income Tax | (221) | 84 | 247 | 4,731 | 3,352 | 1,981 | Increase in ST Investment | 562 | (180) | 141 | (10) | (10) | (10) |
| Minority Interest | (9) | 7 | 74 | 739 | 528 | 31 | Other Adjustments | (732) | 10 | (374) | 14 | 15 | 16 |
| Net Income | (827) | 499 | 1,423 | 23,974 | 17,070 | 10,370 | |||||||
| Reported EPS | (2) | 1.2 | 3.6 | 59.9 | 42.6 | 25.2 | Cash Flow from Financing | 3,718 | 2,141 | 2,625 | (292) | 165 | 636 |
| (RMB$) | Increase in LT Debt | 1,842 | 424 | 1,861 | 438 | 482 | 530 | ||||||
| Growth Rates | 22% | 72% | Increase in ST Debt | 1,841 | 780 | 1,548 | 524 | 577 | 635 | ||||
| Sales Operating Income | (446%) | 30% | 189% | 30% | (5%) (41%) | Cash Dividend Paid | (37) | (25) | (76) | (1,254) | (893) | (528) 0 | |
| EBITDA | NM | 78% | 1511% | (28%) | Issuance of Common Stock | 0 | 3 | 3 | 0 | 0 | |||
| Net Income | NM (1237%) | NM NM | 165% 185% | 1543% 1585% | (29%) (29%) | (40%) (39%) | Other Adjustments Net Change in Cash | 72 (742) | 958 (151) | (711) 456 | 0 23,635 | 0 10,502 | 0 11,625 |
| Balance Sheet Financial Ratios | Balance Sheet Financial Ratios | Balance Sheet Financial Ratios | Balance Sheet Financial Ratios | Balance Sheet Financial Ratios | Balance Sheet Financial Ratios | Balance Sheet Financial Ratios | Balance Sheet Financial Ratios | Balance Sheet Financial Ratios | Balance Sheet Financial Ratios | Balance Sheet Financial Ratios | Balance Sheet Financial Ratios | Balance Sheet Financial Ratios | Balance Sheet Financial Ratios |
| (RMB mm) | 2023 | 2024 | 2025 | 2026E | 2027E | 2028E | (RMB mm) | 2023 | 2024 | 2025 | 2026E | 2027E | 2028E |
| Cash & Cash Equivalents | 1,219 | 1,025 | 1,478 | 25,114 | 35,616 | 47,240 | Return | ||||||
| Marketable Securities | 0 | 180 | 39 | 49 | 59 | 69 | ROE | (13%) | 7% | 19% | 119% | 42% | 19% |
| Accounts and Notes Receivables | 1,345 | 1,672 | 2,040 | 5,413 | 6,564 | 5,565 | ROA | (7%) | 3% | 7% | 68% | 30% | 14% |
| Inventories | 5,893 | 7,833 | 11,678 | 9,797 | 17,529 | 17,974 | Return on Sales | (8%) | 3% | 6% | 36% | 20% | 13% |
| Other Current Assets | 608 | 974 | 1,373 | 985 | 1,111 | 1,156 | |||||||
| Current Assets | 9,065 | 11,683 | 16,608 | 41,357 | 60,878 | 72,004 | Margin Gross Margin | 8% | 19% | 19% | 55% | 35% | 27% |
| LT Investments | 419 | 750 | 942 | 1,036 | 1,139 | 1,253 | Operating Margin Pre-Tax Margin | (7%) | 6% | 8% | 45% | 25% 24% | 16% |
| Property and Equipment | 2,019 465 | 2,423 424 | 2,661 431 | 2,695 | 2,830 | 2,971 431 | Net Income Margin | (10%) (8%) | 3% | 8% 6% | 45% | 15% 13% | |
| Intangible Assets Deferred Tax Assets | 446 | 538 | 504 | 431 504 | 431 504 | 504 | 3% | 36% | 20% | ||||
| Total Assets | 1,265 13,680 | 1,078 | 1,606 22,751 | 1,606 47,628 | 67,388 | 1,606 | Gearing Current Ratio | 2 | 2 | 2 | 4 | 5 | |
| Other Assets | 16,897 | 1,606 | 78,769 | Debt to Equity | 78% | 90% | 115% | 33% | 24% | 5 22% | |||
| 1,147 | 2,449 | 4,420 | (59%) | ||||||||||
| ST Debt | 2,916 | 3,696 | 5,245 | 5,769 | 6,346 | 6,981 | Net Debt to Equity | 59% | 75% | 97% | (46%) | (49%) | |
| Accounts Payable | 1,141 | 2,017 | 4,739 | ||||||||||
| Other ST Liabilities | 870 | 2,386 | 2,462 | 2,472 | 2,482 5,297 | 2,492 | Asset Turnover | ||||||
| 2,092 | 2,517 | 4,377 | 4,815 | 5,826 | Turnover | ||||||||
| LT Debt | 0.7 | 1.0 | 1.0 | 1.4 | 1.3 | 1.0 | |||||||
| Other LT Liabilities | 205 | 257 | 288 | 303 | 318 | 334 | Days Receivable | 41 | 35 | 31 | 30 | 28 | 25 |
| Total Liabilities | 7,230 | 9,997 | 14,389 | 15,808 | 18,863 | 20,371 | Days Inventory | 189 | 130 | 135 | 120 | 115 | 110 |
| Days Payables | 36 | 36 | 35 | 30 | 29 | 29 | |||||||
| Paid-In Capital | 4,491 | 4,832 | 4,713 | 4,713 | 4,713 | 4,713 | Per Share | ||||||
| Retained Earnings | 1,319 | 1,714 | 3,135 | 26,594 | 43,298 | 53,172 | EPS | (2.03) | 1.22 | 3.63 | 59.86 | 42.62 | 25.19 |
| Other Shareholder's Equity | 639 | 354 | 513 | 513 | 513 | 513 | Consensus EPS | (2.03) | 2.37 | 2.59 | 1.30 | 1.30 | 1.30 |
| Total Equity | 6,449 | 6,900 | 8,362 | 31,820 | 48,525 | 58,398 | BVPS | 15.62 | 16.71 | 20.25 | 77.07 | 117.53 | 141.45 |
| Total Liab. and Equity | 13,680 | 16,897 | 22,751 | 47,628 | 67,388 | 78,769 | DPS | 0.09 | 0.06 | 0.18 | 2.99 | 2.13 | 1.26 |
Source: Company data, Morgan Stanley Research (E) estimates
M
Risk Reward - Shenzhen Longsys Electronics Co Ltd Risk Reward - Shenzhen Longsys Electronics Co Ltd (301308.SZ)
(301308.SZ) Lack of near-term catalysts; await more clarity on 2027 pricing and margin; EW
Rmb673.00 PRICE TARGET
Base case, derived from residual income model. We assume a cost of equity of 9.10% (riskfree rate of 2.5%, risk premium of 5.5%, beta of 1.2) and a terminal growth rate of 6.3%.
RISK REWARD CHART
Key:
- Historical Stock Performance
- Current Stock Price
Source: Refinitiv, Morgan Stanley Research
BULL CASE
Rmb852.00
20x 2027e P/E
Aggressive growth supported by AI
tailwinds : We assume: 1) overall supply discipline and CSPs' aggressive AI spending continue; and 2) edge AI devices trigger strong demand recovery for the smartphone and PC markets, creating a shortage for NAND into 2028 and beyond.
- Price Target
BASE CASE
15x 2027e P/E
Risk/reward appears balanced, reflecting 1) NAND's secular growth, supported by AI and China's localization, and 2) Longsys' self-help in enterprise business, overseas expansion and TCM&PTM business models likely enhancing its medium-/long-term growth and margin profile.
EQUAL-WEIGHT THESIS
- The AI era has finally come to NAND, with shortages seen extending into 2027.
- We like the company's medium- to longterm growth story through enterprise business expansion and a mix shift to a TCM model.
- Continued supply discipline, normalized domestic customers' inventory levels, and Longsys's self-help should help the stock rerate.
- Our price target implies 15.8x 2027e P/E, in-line with its A-share peers and significantly lower than its historical average of 30x P/E, reflecting robust and more durable earnings upward revision in the NAND upcycle.
Risk Reward Themes
Secular Growth: Self-help:
Positive Positive
View descriptions of Risk Rewards Themes here
BEAR CASE
5.0x 2027e P/B
Weaker - than - expected market growth : We assume: 1) a weaker edge AI cycle moving into 2028 and beyond and 2) pricing starting to decline in 2H28.
Rmb587.00
Rmb673.00
M
Risk Reward - Shenzhen Longsys Electronics Co Ltd (301308.SZ)
KEY EARNINGS INPUTS
| Drivers | Dec 2025 | Dec 2026e | Dec 2027e | Dec 2028e |
|---|---|---|---|---|
| Embeded Storage ASP Growth (%) | (1.6) | 162.3 | 27.2 | (8.5) |
| Mobile Memory ASP Growth (%) | 27.6 | 314.3 | 41.4 | 1.1 |
| SSD ASP Growth (%) | (13.8) | 183.9 | 46 | 0.6 |
| Memory Module ASP Growth (%) | 4.7 | 214.3 | 35.7 | (1.3) |
INVESTMENT DRIVERS
- Commodity memory pricing cycle
- eSSD business expansion progress
GLOBAL REVENUE EXPOSURE
Source: Morgan Stanley Research Estimate View explanation of regional hierarchies here
MS ALPHA MODELS
3/5 MOST
3 Month
Horizon
Source: Refinitiv, FactSet, Morgan Stanley Research; 1 is the highest favored Quintile and 5 is the least favored Quintile
RISKS TO PT/RATING
RISKS TO UPSIDE
- Better-than-expected consumer demand recovery in 2H26
- Better-than-expected eSSD market expansion, which would support revenue and margin improvement during the down-cycle
RISKS TO DOWNSIDE
- Prolonged commodity down-cycle that drags down memory prices and margins
- Share loss to new entrants in the Chinese memory market
OWNERSHIP POSITIONING
Inst. Owners, % Active
85.3%
Source: Refinitiv, Morgan Stanley Research
MS ESTIMATES VS. CONSENSUS
M
Phison: Estimate Revisions
We raise our 2026, 2027 and 2028 EPS estimates by 71%, 13% and 8%, respectively:
We factor in stronger-than-expected 2Q26 results. 2Q26 delivered a strong beat vs. our forecasts, driven by more resilient pricing hike intervals and shipments than expected. We expect 3Q26 to be the peak of the year, supported by more support from Kioxia's dummy die, leading to around 20% QoQ revenue growth and a better-than-feared (flat Q/Q) margin. In 4Q26, we expect emerging weakness from consumer tech and a more moderate pricing environment to result in 4Q revenue declining 20% QoQ, with margins normalizing to ~50%. Reflecting the better pricing environment seen for 2026, this leads to strongerthan-expected profitability in 2027, partially offset by the ongoing R&D investments.
Exhibit 22: Phison: Estimate revisions
| NT$ mn | Current 2026E | Previous 2026E | Diff.% | Current 2027E | Previous 2027E | Diff.% | Current 2028E | Previous 2028E | Diff.% |
|---|---|---|---|---|---|---|---|---|---|
| Net sales | 260,963 | 169,828 | 54% | 208,459 | 165,204 | 26% | 154,119 | 130,255 | 18% |
| Gross profit | 155,833 | 91,990 | 69% | 90,396 | 71,566 | 26% | 60,900 | 54,074 | 13% |
| Operating profit | 85,965 | 49,614 | 73% | 32,691 | 31,077 | 5% | 12,077 | 13,463 | -10% |
| Pretax Income | 90,915 | 52,976 | 72% | 35,646 | 31,484 | 13% | 15,031 | 13,870 | 8% |
| Reported net income | 75,050 | 43,940 | 71% | 29,229 | 25,817 | 13% | 12,326 | 11,373 | 8% |
| Reported EPS | 340.55 | 199.39 | 71% | 132.63 | 117.15 | 13% | 55.93 | 51.61 | 8% |
| Margins | |||||||||
| Gross margin | 59.7% | 54.2% | 43.4% | 43.3% | 39.5% | 41.5% | |||
| Operating margin | 32.9% | 29.2% | 15.7% | 18.8% | 7.8% | 10.3% | |||
| Pretax margin | 34.8% | 31.2% | 17.1% | 19.1% | 9.8% | 10.6% | |||
| Net margin | 28.8% | 25.9% | 14.0% | 15.6% | 8.0% | 8.7% |
Source: Company data, Morgan Stanley Research (E) estimates
Exhibit 23: Phison: Quarterly financials
| NT$ in million | 1Q26 0 | 2Q26E 0 | 3Q26E | 4Q26E | 1Q27E 0 | 2Q27E 0 | 3Q27E 0 | 4Q27E 0 | 2024 0 | 2025 0 | 2026E 0 | 2027E 0 | 2028E 0 |
|---|---|---|---|---|---|---|---|---|---|---|---|---|---|
| Total Revenues | 40,967 | 69,547 | 0 83,483 | 0 66,965 | 53,747 | 55,548 | 53,301 | 45,862 | 58,936 | 72,664 | 260,963 | 208,459 | 154,119 |
| Sequential Change | 79.7% | 69.8% | 20.0% | -19.8% | -19.7% | 3.4% | -4.0% | -14.0% | |||||
| Change vs Year Ago | 196.0% | 288.7% | 360.3% | 193.7% | 31.2% | -20.1% | -36.2% | -31.5% | 22.2% | 23.3% | 259.1% | -20.1% | -26.1% |
| Cost of Sales | 15,849 | 25,190 | 30,444 | 33,646 | 28,589 | 31,121 | 31,365 | 26,988 | 39,837 | 47,806 | 105,129 | 118,062 | 93,219 |
| Percent of Revenues | 39% | 36% | 36% | 50% | 53% | 56% | 59% | 59% | 68% | 66% | 40% | 57% | 60% |
| Gross Profit | 25,118 | 44,357 | 53,039 | 33,320 | 25,158 | 24,427 | 21,936 | 18,875 | 19,099 | 24,858 | 155,833 | 90,396 | 60,900 |
| Percent of Revenues | 61.3% | 63.8% | 63.5% | 49.8% | 46.8% | 44.0% | 41.2% | 41.2% | 32.4% | 34.2% | 59.7% | 43.4% | 39.5% |
| Incremental Margin | 86% | 67% | 62% | NM | NM | -41% | NM | NM | 28% | 42% | 70% | NM | NM |
| Total Opex | 10,277 | 17,075 | 21,691 | 20,826 | 13,257 | 14,333 | 15,239 | 14,876 | 15,566 | 16,591 | 69,869 | 57,705 | 48,823 |
| Percent of Revenues | 25.1% | 24.6% | 26.0% | 31.1% | 24.7% | 25.8% | 28.6% | 32.4% | 26.4% | 22.8% | 26.8% | 27.7% | 31.7% |
| R&D | 8,671 | 14,000 | 18,000 | 18,000 | 11,000 | 12,000 | 13,000 | 12,950 | 12,586 | 13,775 | 58,671 | 48,950 | 42,350 |
| Percent of Revenues | 21.2% | 20.1% | 21.6% | 26.9% | 20.5% | 21.6% | 24.4% | 28.2% | 21.4% | 19.0% | 22.5% | 23.5% | 27.5% |
| General & administrative | 830 | 1,409 | 1,691 | 1,357 | 1,075 | 1,111 | 1,066 | 917 | 1,286 | 1,169 | 5,287 | 4,169 | 3,082 |
| Percent of Revenues | 2.0% | 2.0% | 2.0% | 2.0% | 2.0% | 2.0% | 2.0% | 2.0% | 2.2% | 1.6% | 2.0% | 2.0% | 2.0% |
| Selling & marketing | 776 | 1,666 | 1,999 | 1,470 | 1,182 | 1,222 | 1,173 | 1,009 | 1,694 | 1,647 | 5,911 | 4,586 | 3,391 |
| Percent of Revenues | 1.9% | 2.4% | 2.4% | 2.2% | 2.2% | 2.2% | 2.2% | 2.2% | 2.9% | 2.3% | 2.3% | 2.2% | 2.2% |
| Operating Income | 14,841 | 27,283 | 31,348 | 12,493 | 11,901 | 10,094 | 6,697 | 3,998 | 3,533 | 8,266 | 85,965 | 32,691 | 12,077 |
| Percent of Revenues | 36.2% | 39.2% | 37.6% | 18.7% | 22.1% | 18.2% | 12.6% | 8.7% | 6% | 11% | 33% | 16% | 8% |
| Change vs Year Ago | N/A | 1062.9% | 2101.0% | 274.7% | -19.8% | -63.0% | -78.6% | -68.0% | -2% | 134% | 940% | -62% | -63% |
| Total Non-operating Income(Loss) | 3,057 | 416 | 739 | 739 | 739 | 739 | 739 | 739 | 6,216 | 1,939 | 4,950 | 2,955 | 2,955 |
| Profit Before Taxes | 17,898 | 27,699 | 32,087 | 13,232 | 12,640 | 10,833 | 7,436 | 4,737 | 9,749 | 10,206 | 90,915 | 35,646 | 15,031 |
| Percent of Revenues | 44% | 40% | 38% | 20% | 24% | 20% | 14% | 10% | 17% | 14% | 35% | 17% | 10% |
| Taxes | 2,723 | 4,986 | 5,776 | 2,382 | 2,275 | 1,950 | 1,338 | 853 | 1,795 | 1,465 | 15,866 | 6,416 | 2,706 |
| Tax Rate | 15.2% | 18.0% | 18.0% | 18.0% | 18.0% | 18.0% | 18.0% | 18.0% | 18% | 14% | 17% | 18% | 18% |
| Net Income, Cont Ops | 15,175 | 22,713 | 26,311 | 10,850 | 10,365 | 8,883 | 6,097 | 3,884 | 7,954 | 8,741 | 75,049 | 29,229 | 12,326 |
| Percent of Revenues | 37% | 33% | 32% | 16% | 19% | 16% | 11% | 8% | 13% | 12% | 29% | 14% | 8% |
| Net Income (incl. Emp. Bonus Expense) | 15,175 | 22,713 | 26,311 | 10,850 | 10,365 | 8,883 | 6,097 | 3,884 | 7,955 | 8,743 | 75,050 | 29,229 | 12,326 |
| Percent of Revenues | 37% | 33% | 32% | 16% | 19% | 16% | 11% | 8% | 13.5% | 12.0% | 28.8% | 14.0% | 8.0% |
| Reported | 0% | 0% 22,713 | 0% 26,311 | 0% | 0% | 0% | 0% | 0% 3,884 | 0% 7,955 | 0% 8,743 | 0% | 0% 29,229 | 0% 12,326 |
| Income (TW GAAP) | 15,175 | 10,850 | 10,365 | 8,883 | 6,097 | 75,050 | |||||||
| Percent of Revenues | 37% | 33% | 32% | 16% | 19% | 16% | 11% | 8% | 13% | 12% | 29% | 14% | 8% |
| Change vs Year Ago | 0% | 0% | 0% | 0% | 0% | 0% | 0% | 0% | 119% | 10% | 758% | -61% | -58% |
| Reported EPS (NT$, TW | 68.86 | 103.06 | 119.39 | 49.23 | 47.03 | 40.31 | 27.67 | 17.63 | 35.68 | 39.70 | 340.55 | 132.63 | 55.93 |
| GAAP) | 1233% | 1082% | -64% | ||||||||||
| Change vs Year Ago | 2937% | 134% | -32% | -61% | -77% | 102% | 11% | 758% | -61% | -58% |
Source: Company data, Morgan Stanley Research (E) estimates
M
Phison: Valuation Methodology
We raise our price target from NT$2,248 to NT$2,588, reflecting our estimate changes. Our other RI parameters are unchanged, including a cost of equity of 9.0%, a mediumterm growth rate of 9.0%, a terminal growth rate of 4.0% and a dividend payout ratio assumption of 51.2%. We increase our bull and bear case values from NT$3,090 and NT $1,125 to NT$3,400 and NT$1,250, respectively, implying 10x 2026e and 26x 2027e EPS in the bull case and 4x 2026e and 9x 2027e EPS in the bear.
Exhibit 24: Phison: RI model
| NT$million | 2026E | 2027E | 2028E | 2029E | 2030E | 2031E | 2032E | 2033E | 2034E | 2035E | 2035E |
|---|---|---|---|---|---|---|---|---|---|---|---|
| Total Equity | 130,690 | 121,591 | 118,989 | 138,089 | 158,908 | 181,601 | 206,336 | 233,298 | 262,686 | 294,718 | 329,634 |
| Net Profit | 75,050 | 29,229 | 31,860 | 34,727 | 37,853 | 41,260 | 44,973 | 49,021 | 53,433 | 58,241 | 63,483 |
| ROAE | 78.7% | 23.2% | 26.5% | 27.0% | 25.5% | 24.2% | 23.2% | 22.3% | 21.5% | 20.9% | 20.3% |
| Residual Income | 41,895 | 18,561 | 21,298 | 21,474 | 22,813 | 24,256 | 25,816 | 27,506 | 29,339 | 31,331 | 33,496 |
| Spread | 69.7% | 14.2% | 17.5% | 18.0% | 16.5% | 15.3% | 14.2% | 13.3% | 12.6% | 11.9% | 11.4% |
| Ending Equity Capital | 130,690 | ||||||||||
| PV of Forecast Period | 143,241 | ||||||||||
| PV of Continuing Value | 296,882 | ||||||||||
| Equity Value | 570,813 | ||||||||||
| No. of Shares | 221 | ||||||||||
| Projected Price | 2,588 |
Source: Company data, Morgan Stanley Research (E) estimates
Exhibit 25: Phison: P/E multiple
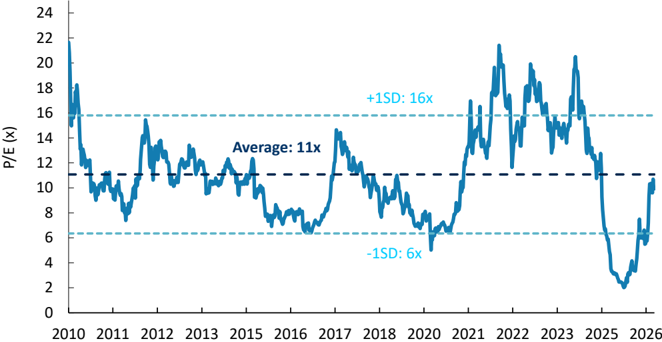
Source: Company data, Morgan Stanley Research estimates
M
Risk Reward - Phison Electronics Corp (8299.TWO) Risk Reward - Phison Electronics Corp (8299.TWO)
AI Boosts NAND Market, but Module Makers Face Hurdles; EW
NT$2,588.00 PRICE TARGET
Base case, residual income model. Key assumptions: a cost of equity of 9.0%, a medium-term growth rate of 9.0%, a terminal growth rate of 4.0%, and a dividend payout ratio assumption of 51.2%.
NT$2,931.98
MS PT
Mean
NT$4,130.00
Morgan Stanley Estimates
Consensus Price Target Distribution
Source: Refinitiv, Morgan Stanley Research
RISK REWARD CHART
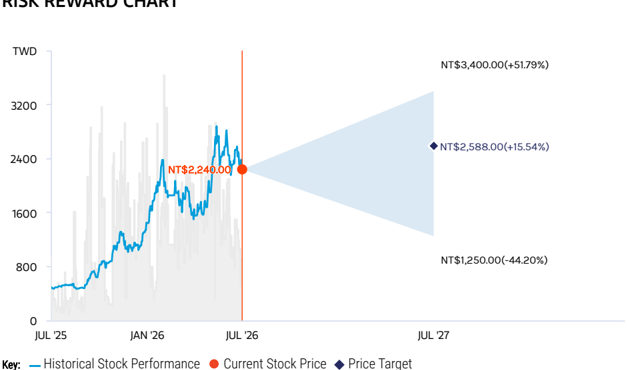
Source: Refinitiv, Morgan Stanley Research
BULL CASE
26x 2027e EPS
Growing SSD demand and limited supply growth prompt NAND fl ash shortages; SSD market growth accelerates: 1) Revenue
increases at a CAGR of >40% over 2024-28; 2) gross margin rises to 90% in 2026 from 34% in 2025; 3) flash controller IC revenue increases 50% Y/Y in 2026.
NT$3,400.00
NT$2,240.00
BASE CASE
19x 2027e EPS
A good year for NAND modules in 2026, but we doubt it can be sustained into 2027: 1)
Revenue increases at a CAGR of 27% Y/Y over 2024-28e; 2) gross margin increases to 59.7% in 2026 from 33.4% in 2023 from the price hike benefit; 3) flash module revenue rises 355% Y/Y in 2026 vs. -20% in 2027; 4) flash controller IC revenue increases 24% Y/Y in 2026.
NT$2,588.00
EQUAL-WEIGHT THESIS
- AI-driven storage demand is extending the industry upcycle, but we see limited upside for module vendors given constrained NAND supply, FIFO-driven margin normalization, and weakening consumer SSD demand amid elevated NAND prices.
- Although eSSD and AI-related storage represent meaningful growth opportunities for Asian module house vendors such as Phison and Longsys, we believe the scale remains insufficient to offset broader consumer SSD weakness.
- We see risks on the execution as raw NAND suppliers are looking to further cut support to module houses as they would like to prioritize their other customers first. Industry average sees -40% YoY on shipments, which could create risks for Phison
Consensus Rating Distribution
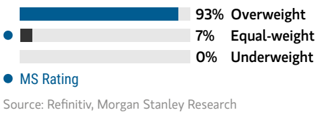
Risk Reward Themes
Secular Growth:
Positive
View descriptions of Risk Rewards Themes here
BEAR CASE
9x 2027e EPS
No outsourcing from Micron, low SSD market growth, NAND fl ash price drops more than in our base case: 1) Revenue to <40% in 2026 vs. 33.4% in 2023; 3) flash increases at a CAGR of <10% in 2024-28; 2) gross margin faces more significant erosion, controller IC revenue increases 10% Y/Y in 2026.
NT$1,250.00
M
Risk Reward - Phison Electronics Corp (8299.TWO)
KEY EARNINGS INPUTS
| Drivers | Dec 2025 | Dec 2026e | Dec 2027e | Dec 2028e |
|---|---|---|---|---|
| Flash module revenue Y/Y (%) | 22 | 354.9 | (19.8) | (28.1) |
| Flash controller IC revenue Y/Y (%) | 44.7 | 23.9 | (29.1) | (3.1) |
| Flash module gross margin (%) | 33.5 | 60.6 | 43.3 | 39.1 |
| Flash controller IC gross margin (%) | 43.9 | 45.3 | 43.3 | 43.3 |
INVESTMENT DRIVERS
- Rising NAND flash prices
- Higher SSD penetration rate
- Adoption of solution by key OEMs
GLOBAL REVENUE EXPOSURE
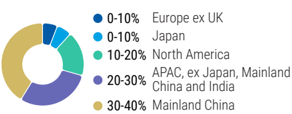
Source: Morgan Stanley Research Estimate View explanation of regional hierarchies here
MS ALPHA MODELS
1/5 MOST
3 Month Horizon
Source: Refinitiv, FactSet, Morgan Stanley Research; 1 is the highest favored Quintile and 5 is the least favored Quintile
RISKS TO PT/RATING
RISKS TO UPSIDE
- Faster-than-expected eMMC controller IC outsourcing rate
- Faster SSD market growth
- Market share gain in ultrabooks and SSDs
RISKS TO DOWNSIDE
- Weaker-than expected NAND demand
- Milder impact on global NAND supply
- Non-acceptance of price hikes on NAND modules
OWNERSHIP POSITIONING
Inst. Owners, % Active
57.9%
Source: Refinitiv, Morgan Stanley Research
MS ESTIMATES VS. CONSENSUS
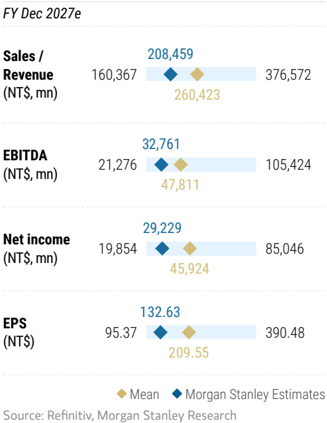
M
Phison: Financial Summary
Income Statement
| NT$mn (Years End Dec ) | 2024 | 2025E | 2026E | 2027E | 2028E |
|---|---|---|---|---|---|
| Net sales | 58,936 | 72,664 | 260,963 | 208,459 | 154,119 |
| COGS | (39,837) | (47,806) | (105,129) | (118,062) | (93,219) |
| Gross profit | 19,099 | 24,858 | 155,833 | 90,396 | 60,900 |
| Operating expenses | (15,566) | (16,591) | (69,869) | (57,705) | (48,823) |
| Operating income | 3,533 | 8,266 | 85,965 | 32,691 | 12,077 |
| Non-operating income | 6,216 | 1,939 | 4,950 | 2,955 | 2,955 |
| Pre-tax income | 9,749 | 10,206 | 90,915 | 35,646 | 15,031 |
| Income tax | 1,795 | 1,465 | 15,866 | 6,416 | 2,706 |
| Reported net Income | 7,954 | 8,741 | 75,049 | 29,229 | 12,326 |
| Adj.wtd.avg.shrs( m) | 204 | 207 | 221 | 221 | 221 |
| Reported EPS (NT$) | 35.68 | 39.70 | 340.55 | 132.63 | 55.93 |
Balance Sheet
| NT$mn (Years End Dec ) | 2024 | 2025E | 2026E | 2027E | 2028E |
|---|---|---|---|---|---|
| Cash | 19,982 | 16,275 | 77,837 | 73,148 | 81,190 |
| Mkt Securities | 784 | 1,475 | 1,475 | 1,475 | 1,475 |
| AR/NR | 8,011 | 13,689 | 32,634 | 26,068 | 19,273 |
| Inventory | 24,614 | 35,609 | 29,945 | 33,629 | 26,553 |
| Other | 649 | 1,432 | 1,432 | 1,432 | 1,432 |
| Current Assets | 54,041 | 68,480 | 143,322 | 135,752 | 129,922 |
| Long-term investments | 651 | 1,171 | 1,171 | 1,171 | 1,171 |
| Fixed assets | 3,783 | 3,883 | 3,983 | 4,083 | 4,183 |
| Deferred assets | 701 | 629 | 629 | 629 | 629 |
| Other assets | 10,164 | 11,593 | 11,593 | 11,593 | 11,593 |
| Total Assets | 69,339 | 85,756 | 160,698 | 153,228 | 147,497 |
| S/T borrowings | 41 | 0 | 0 | 0 | 0 |
| AP/NP | 1,309 | 8,878 | 13,239 | 14,867 | 11,739 |
| Other ST liabilities | 12,870 | 16,417 | 16,417 | 16,417 | 16,417 |
| LT debt | 6,054 | 352 | 352 | 352 | 352 |
| Other LT liabilities | 0 | 0 | 0 | 0 | 0 |
| Common shares | 2,058 | 2,180 | 2,180 | 2,180 | 2,180 |
| Total Liabilities | 20,273 | 25,648 | 30,008 | 31,637 | 28,508 |
| Additional capital | 13,054 | 19,104 | 19,104 | 19,104 | 19,104 |
| Retained earning | 34,283 | 39,151 | 109,734 | 100,634 | 98,032 |
| Other shareholders' equity | (329) | (327) | (327) | (327) | (327) |
| Total Equity | 49,066 | 60,108 | 130,690 | 121,591 | 118,989 |
| Total Liab. & Shrhldr's Equity | 69,339 | 85,756 | 160,698 | 153,228 | 147,497 |
E = Morgan Stanley Research Estimates
Source: Morgan Stanley Research, Company Data
Cash Flow Statement
| NT$mn (Years End Dec ) | 2024 | 2025E | 2026E | 2027E | 2028E |
|---|---|---|---|---|---|
| Cashflow from Operations | 2,094 | 1,598 | 66,200 | 33,810 | 23,139 |
| Net profits | 7,955 | 8,743 | 75,050 | 29,229 | 12,326 |
| Depreciation | 695 | 755 | 70 | 70 | 70 |
| Working Capital Change | (3,895) | (9,886) | (8,920) | 4,510 | 10,743 |
| Other adjustments | (2,661) | 1,986 | 0 | 0 | 0 |
| Cashflow from Investing | 3,903 | (1,908) | (170) | (170) | (170) |
| Capex | (955) | (1,397) | (170) | (170) | (170) |
| Change of LT Investment | (705) | (529) | 0 | 0 | 0 |
| Change of ST Investment | (53) | (402) | 0 | 0 | 0 |
| Other adjustments | 5,616 | 420 | 0 | 0 | 0 |
| Cashflow from financing | (673) | (3,109) | (4,468) | (38,329) | (14,928) |
| Increase in L/T debt | 5,681 | (5,701) | 0 | 0 | 0 |
| Increase in S/T debt | 41 | (41) | 0 | 0 | 0 |
| Cash Dividend Paid | (2,661) | (5,172) | (4,468) | (38,329) | (14,928) |
| Dir& Emp Bonus Paid | 0 | 0 | 0 | 0 | 0 |
| Issuance of stock | 0 | 0 | 0 | 0 | 0 |
| Other adjustments | (3,733) | 7,806 | 0 | 0 | 0 |
| Exchange rate adjustment | 437 | (288) | 0 | 0 | 0 |
| Net change in cash | 5,762 | -3,707 | 61,562 | -4,689 | 8,041 |
Financial Ratios
| 2024 | 2025E | 2026E | 2027E | 2028E | |
|---|---|---|---|---|---|
| Growth(%) | |||||
| Turnover | 22.2 | 23.3 | 259.1 | -20.1 | -26.1 |
| Operating profits | -2.5 | 134.0 | 939.9 | -62.0 | -63.1 |
| Pretax profits | 137.8 | 4.7 | 790.8 | -60.8 | -57.8 |
| Net profits | 119.5 | 9.9 | 758.6 | -61.1 | -57.8 |
| EPS | 102.4 | 11.3 | 757.9 | -61.1 | -57.8 |
| Margins (%) | |||||
| Gross Margin | 32.4 | 34.2 | 59.7 | 43.4 | 39.5 |
| Operating Margin | 6.0 | 11.4 | 32.9 | 15.7 | 7.8 |
| Pretax Margin | 16.5 | 14.0 | 34.8 | 17.1 | 9.8 |
| Net Profit | 13.5 | 12.0 | 28.8 | 14.0 | 8.0 |
| Return (%) | |||||
| ROAE | 17.3 | 16.0 | 78.7 | 23.2 | 10.2 |
| ROAA | 11.8 | 11.3 | 60.9 | 18.6 | 8.2 |
| Gearing (%) | |||||
| Net Debt/Equity | (28.3) | (26.5) | (59.3) | (59.9) | (67.9) |
| Liabilities/Equity | 41.3 | 42.7 | 23.0 | 26.0 | 24.0 |
| Ratios (X) | |||||
| Current ratio | 3.8 | 2.7 | 4.8 | 4.3 | 4.6 |
| Quick ratio | 2.0 | 1.2 | 3.7 | 3.2 | 3.6 |
| Others | |||||
| AR/NR Turnover (days) | 46 | 46 | 46 | 46 | 46 |
| Inventory Turnover (days) | 104 | 104 | 104 | 104 | 104 |
| AP Turnover (days) | 46 | 46 | 46 | 46 | 46 |
| Cash Conversion (days) | 104 | 104 | 104 | 104 | 104 |
M
Risk Reward Reference links
- View explanation of Options Probabilities methodology -Options_Probabilities_Exhibit_Link.pdf
-
View descriptions of Risk Rewards Themes - RR_Themes_Exhibit_Link.pdf
-
View explanation of regional hierarchies - GEG_Exhibit_Link.pdf
-
View explanation of Theme/Exposure methodology -
-
ESG_Sustainable_Solutions_External_Link.pdf
- View explanation of HERS methodology - ESG_HERS_External_Link.pdf
M
Disclosure Section
The information and opinions in Morgan Stanley Research were prepared or are disseminated by Morgan Stanley & Co. LLC and/or Morgan Stanley C.T.V.M. S.A. and/or Morgan Stanley México, Casa de Bolsa, S.A. de C.V. and/or Morgan Stanley Canada Limited and/or Morgan Stanley & Co. International plc and/or Morgan Stanley Europe S.E. and/or RMB Morgan Stanley Proprietary Limited and/or Morgan Stanley MUFG Securities Co., Ltd. and/or Morgan Stanley Capital Group Japan Co., Ltd. and/or Morgan Stanley Asia Limited and/or Morgan Stanley Asia (Singapore) Pte. (Registration number 199206298Z) and/or Morgan Stanley Asia (Singapore) Securities Pte Ltd (Registration number 200008434H), regulated by the Monetary Authority of Singapore (which accepts legal responsibility for its contents and should be contacted with respect to any matters arising from, or in connection with, Morgan Stanley Research) and/or Morgan Stanley Taiwan Limited and/or Morgan Stanley & Co International plc, Seoul Branch, and/or Morgan Stanley Australia Limited (A.B.N. 67 003 734 576, holder of Australian financial services license No. 233742, which accepts responsibility for its contents), and/or Morgan Stanley Wealth Management Australia Pty Ltd (A.B.N. 19 009 145 555, holder of Australian financial services license No. 240813, which accepts responsibility for its contents), and/or Morgan Stanley India Company Private Limited having Corporate Identification No (CIN) U22990MH1998PTC115305, regulated by the Securities and Exchange Board of India ('SEBI') and holder of licenses as a Research Analyst (SEBI Registration No. INH000001105), Stock Broker (SEBI Stock Broker Registration No. INZ000244438), Merchant Banker (SEBI Registration No. INM000011203), and depository participant with National Securities Depository Limited (SEBI Registration No. IN-DP-NSDL-567-2021) having registered office at Altimus, Level 39 & 40, Pandurang Budhkar Marg, Worli, Mumbai 400018, India; Telephone no. +91-22-61181000; Compliance Officer Details: Mr. Tejarshi Hardas, Tel. No.: +91-22-61181000 or Email: tejarshi.hardas@morganstanley.com; Grievance officer details: Mr. Tejarshi Hardas, Tel. No.: +91-22-61181000 or Email: msic-compliance@morganstanley.com which accepts the responsibility for its contents and should be contacted with respect to any matters arising from, or in connection with, Morgan Stanley Research, and their affiliates (collectively, "Morgan Stanley"). Morgan Stanley India Company Private Limited (MSICPL) may use AI tools in providing research services. All recommendations contained herein are made by the duly qualified research analysts.
For important disclosures, stock price charts and equity rating histories regarding companies that are the subject of this report, please see the Morgan Stanley Research Disclosure Website at www.morganstanley.com/eqr/disclosures/webapp/generalresearch, or contact your investment representative or Morgan Stanley Research at 1585 Broadway, (Attention: Research Management), New York, NY, 10036 USA.
For valuation methodology and risks associated with any recommendation, rating or price target referenced in this research report, please contact the Client Support Team as follows: US/Canada +1 800 303-2495; Hong Kong +852 2848-5999; Latin America +1 718 754-5444 (U.S.); London +44 (0)20-7425-8169; Singapore +65 6834-6860; Sydney +61 (0)2-9770-1505; Tokyo +81 (0)3-6836-9000. Alternatively you may contact your investment representative or Morgan Stanley Research at 1585 Broadway, (Attention: Research Management), New York, NY 10036 USA.