PDF 原檔:報告_MS_整合電源方案IPS_20261006_original.pdf
圖片清單(已驗證 2026-10-07)
本報告抽出 143 張圖,≥40KB 候選 63 張。技術/架構/產品圖逐張 Read 驗證;財務表、股價與估值倍數圖依 Exhibit 標題歸類為財務圖、未逐張檢視(見表末)。lib 嵌圖只挑「真資料圖」。
| 檔名 | size | 分類 | 親眼所見內容 |
|---|---|---|---|
報告_MS_整合電源方案IPS_20261006_002.png |
114KB | 真資料圖 | Nvidia「800 VDC Equipment Readiness」時間軸:Option 1A Power Rack(Q3 2026,660 kW)、1B DC Power Center(Q2 2027,1.6 MW)、1C Power Block(Q1 2028,4.8 MW+),下方為接地保護/認證/保護裝置/母線連接器/高密度電源轉換五項準備度表 |
報告_MS_整合電源方案IPS_20261006_003.png |
125KB | 真資料圖 | Infineon 簡報:傳統變壓器(約 20 t、市場 >USD 15bn)對比 SST(約 500 kg 加機櫃、約 40x 較輕、14x 較小、施工時間快約 50%、2030 年市場 >USD 1bn,EasyPACK SiC 模組),底部列 Delta、DG Matrix、SolarEdge 為早期合作夥伴 |
報告_MS_整合電源方案IPS_20261006_006.png |
66KB | 真資料圖 | 「SOFC Application」系統流程圖:氫氣/天然氣/氨氣進 SOFC System,輸出 DC 經 PCS/UPS 與市電併接供高耗能場域(資料中心、半導體、鋼鐵、醫院),附 CCUS 碳捕捉與吸收式冷卻機 |
報告_MS_整合電源方案IPS_20261006_011.png |
123KB | 真資料圖 | 左:Nvidia 的 AI 伺服器功率曲線與儲能削峰示意(放電紅色/充電藍色,綠線為平滑後功率);右:Panasonic BBU 儲存模組,鋰電池 cell 插入機櫃 shelf |
報告_MS_整合電源方案IPS_20261006_012.png |
212KB | 真資料圖 | Panasonic CBU(Capacitor Bank Unit)實體照,圓柱電容 cell 排列加控制板 |
報告_MS_整合電源方案IPS_20261006_013.png |
81KB | 真資料圖 | GB300 電源 shelf 內部俯視,綠框標示「Energy Storage」電容組 |
報告_MS_整合電源方案IPS_20261006_014.png |
153KB | 真資料圖(含數據) | Delta 簡報「480 VAC vs 800 VDC」:480 VAC 四級轉換(變壓器、UPS 雙轉換、PDU 降壓、伺服器 PSU)效率約 93%,800 VDC 三級轉換效率約 95% |
報告_MS_整合電源方案IPS_20261006_015.png |
142KB | 真資料圖(含數據) | Delta 簡報「What Does That Mean in Dollars」:100 MW、US$0.08/kWh、93% vs 95%,每年節省約 19,800 MWh/US$1.6M,1GW 園區約 US$15.9M,10GW 約 US$160M/年 |
報告_MS_整合電源方案IPS_20261006_016.png |
185KB | 真資料圖 | Nvidia 800 VDC Equipment Readiness(同 002,較大尺寸) |
報告_MS_整合電源方案IPS_20261006_017.png |
27KB | 真資料圖(<40KB,補驗) | 左:800VDC 電源機櫃成本圓餅(PSU 50-55%、BBU 25-30%、其他 15-20%);右:每瓦美元含量柱狀,機內 PSU 為 1x、HVDC power rack 為 4-5x |
報告_MS_整合電源方案IPS_20261006_018.png |
105KB | 真資料圖 | Infineon 資料中心電力演進:由 5-10 MW、180-250 MW、約 650 MW 到 GW 級;三種架構(LFT+機內 PSU;AC-DC sidecar ±400V/800V;設施級 SST 接 ≥800V DC microgrid) |
報告_MS_整合電源方案IPS_20261006_020.png |
168KB | 真資料圖 | 同 003 的 Infineon SST 簡報(較大尺寸) |
報告_MS_整合電源方案IPS_20261006_021.png |
104KB | 真資料圖 | 質子交換型燃料電池原理圖:氫氣進陽極、氧氣進陰極、電解質中氫離子移動、電子經外部負載、產生水(3M 來源) |
報告_MS_整合電源方案IPS_20261006_022.png |
108KB | 真資料圖 | Delta SOFC Application 系統圖(同 006,較大尺寸) |
報告_MS_整合電源方案IPS_20261006_023.png |
146KB | 真資料圖 | Panasonic 路線圖:每櫃功率 30kW 至 1MW;BBU cell 輸出 80W→120W(新 cell)→>200W;CBU 第一代/第二代;第一代 CBU 與 Panasonic Industry 合作、FY3/27 內量產;HVDC 用 BBU FY3/27 內量產 |
報告_MS_整合電源方案IPS_20261006_031.png |
67KB | 真資料圖 | Infineon AI 伺服器暫態功率波形:180%(<0.5 ms)、150%(<50 ms)、100%,斜率 2.5 A/µs |
報告_MS_整合電源方案IPS_20261006_032.png |
53KB | 真資料圖 | Nvidia 削峰示意(同 011 左圖,單獨一張) |
報告_MS_整合電源方案IPS_20261006_033.png |
70KB | 真資料圖 | ADI BBU 方塊圖:電池組+BMS、Charger、Discharger、MCU、Aux Power、風扇、ORing/Hot Swap/Fuse、Connector |
報告_MS_整合電源方案IPS_20261006_034.png |
73KB | 真資料圖 | Panasonic BBU 儲存模組與 shelf、鋰電池 cell |
報告_MS_整合電源方案IPS_20261006_035.png |
212KB | 真資料圖 | Panasonic CBU 實體照(同 012) |
報告_MS_整合電源方案IPS_20261006_036.png |
81KB | 真資料圖 | GB300 電源 shelf 內含電容「Energy Storage」(同 013) |
報告_MS_整合電源方案IPS_20261006_037.png |
335KB | 真資料圖(含數據) | 光寶簡報「Power smoothing for Nvidia Vera Rubin NVL72 110kW power shelf」:GB200/GB300 NVL72(5.5kW)與 Vera Rubin NVL72(18.3kW)示波器波形;Ipk-max/Ipk-min:15.9A/8.3A(91.57%)、13.3A/8.6A(54.65%)、12.8A/10.3A(24.27%) |
報告_MS_整合電源方案IPS_20261006_039.png |
306KB | 真資料圖 | Delta「800 VDC In-Row Power Rack Solution」:典型 AI 機櫃約 3/4 被伺服器佔用、無空間放電源 shelf/BBU/Super-Cap shelf(PCS),右側 In-Row power rack 堆疊 PDU、BBU、PCS、Power Shelf |
報告_MS_整合電源方案IPS_20261006_040.png |
153KB | 真資料圖 | Delta「480 VAC vs 800 VDC」流程圖(同 014) |
報告_MS_整合電源方案IPS_20261006_041.png |
142KB | 真資料圖 | Delta 效率節省美元圖(同 015) |
報告_MS_整合電源方案IPS_20261006_042.png |
263KB | 真資料圖 | Nvidia Phase I 800VDC power rack:行級配置,Power Whip 100A、RPP 約 1MW,可用容量約 6 MW,連接運算負載(VR)3.36 MW,480 Vac 液冷 |
報告_MS_整合電源方案IPS_20261006_043.png |
212KB | 真資料圖 | Nvidia Phase II 800 VDC power center:Tap Can 125A、Busway 1250A、Power Center 1.6-2 MW,可用容量 4.8-6 MW |
報告_MS_整合電源方案IPS_20261006_044.png |
292KB | 真資料圖 | Nvidia Phase III power block:Busway Branch 1250A、Main 6000A、整流 4.8 MW,每區塊 XMR/AC SWB/Rectifier/DC SWB(5MVA/4.8MW),可用容量 20 MVA |
報告_MS_整合電源方案IPS_20261006_045.png |
240KB | 真資料圖 | Nvidia 供電架構四層比較:415 VAC 現況、800 VDC In-Row Power Rack、800 VDC White Space(LV Rectifier+DC Dist)、800 VDC Facility(Rectifier 或 SST+DC Dist),含 BESS/電池/儲能選配 |
報告_MS_整合電源方案IPS_20261006_046.png |
185KB | 真資料圖 | Nvidia 800 VDC Equipment Readiness(同 002) |
報告_MS_整合電源方案IPS_20261006_049.png |
128KB | 真資料圖 | Infineon:低頻變壓器 LFT 對比 SST(AC/DC 輸入→整流或主動前端→DC-DC+MFT 中頻變壓器→AC/DC 輸出) |
報告_MS_整合電源方案IPS_20261006_050.png |
170KB | 真資料圖 | Infineon 資料中心電力演進與三種架構(同 018) |
報告_MS_整合電源方案IPS_20261006_052.png |
137KB | 真資料圖 | 貨櫃式 MV to LV AC/DC Converter 內部:MV Side(MV Fuse、MV Cable)、Control Box、SiC Power Module(報告標示 Delta SST) |
報告_MS_整合電源方案IPS_20261006_053.png |
45KB | 真資料圖 | Eaton 標示的灰色大型 SST/變壓器機櫃外觀 |
報告_MS_整合電源方案IPS_20261006_055.png |
32KB | 真資料圖(<40KB,補驗) | Delta 標示的白色四門 SOFC 機櫃外觀 |
報告_MS_整合電源方案IPS_20261006_056.png |
227KB | 真資料圖 | Bloom Energy 燃料電池機組外觀:成排深灰色機殼沿建築排列 |
報告_MS_整合電源方案IPS_20261006_057.png |
104KB | 真資料圖 | 燃料電池原理圖(同 021) |
報告_MS_整合電源方案IPS_20261006_058.png |
108KB | 真資料圖 | Delta SOFC Application 系統圖(同 006) |
報告_MS_整合電源方案IPS_20261006_068.png |
312KB | 真資料圖(非財務,公司頁不嵌) | Delta 全球據點世界地圖,紅=銷售據點、藍=廠區、黃=研發中心 |
報告_MS_整合電源方案IPS_20261006_095.png |
334KB | 真資料圖 | Delta Power Electronics 產品矩陣:Components(電感、模組、變壓器、EMI 濾波器等)、Power and System(嵌入式/adapter/工業/醫療/高壓/氫能電源)、Fans and Thermal Management(晶片級散熱、冷板、機內/列間 CDU、rack manifold、電泵等) |
報告_MS_整合電源方案IPS_20261006_096.png |
309KB | 真資料圖 | Delta Infrastructure 產品矩陣:UPS、BBU、800 VDC In-Row Power、PDU、rRPP、液冷、PCS、ESS、太陽能/風電變流器、固態變壓器平台、SOFC、氫能方案、Display 等 |
報告_MS_整合電源方案IPS_20261006_097.png |
94KB | 真資料圖(非本論點,不嵌) | Delta Mobility 產品:EV 電力電子、牽引、x-EV 電源管理、車載網路與 AI 運算、車用熱管理、低壓動力、EV 充電 |
報告_MS_整合電源方案IPS_20261006_098.png |
226KB | 真資料圖(非本論點,不嵌) | Delta Automation 產品:變頻器、伺服、馬達、CNC、機器人、Delta Controls、LOYTEC、VIVOTEK 等 |
報告_MS_整合電源方案IPS_20261006_107.png |
266KB | 真資料圖(非財務) | 光寶全球據點地圖:總部台北、產地(泰國、越南海防、台灣桃園/台南/高雄、墨西哥、巴西)、研發測試中心(美、歐、日、中) |
報告_MS_整合電源方案IPS_20261006_133.png |
169KB | 真資料圖(非財務) | 光寶 Global operation 地圖:總部(台灣)與歐洲、中國、日本、新加坡、美國銷售中心 |
報告_MS_整合電源方案IPS_20261006_134.png |
46KB | 真資料圖(非本論點,不嵌) | 光寶光電半導體產品:車用 LED、SMD LED、Flash LED、UV LED、光耦合器、光感測器、紅外 |
報告_MS_整合電源方案IPS_20261006_135.png |
67KB | 真資料圖(非本論點,不嵌) | 光寶消費電子:筆電/網通 adapter、PC 電源 |
報告_MS_整合電源方案IPS_20261006_136.png |
103KB | 真資料圖(非本論點,不嵌) | 光寶網通與監控:攝影機、門禁警報、5G/WLAN/交換器 |
報告_MS_整合電源方案IPS_20261006_026.png |
51KB | 真資料圖 | 運算效能(TFLOP)對 TDP 散點:Nvidia B300/R200、AMD MI455X 約 2,500W 高點,Google TPU、舊 GeForce 與 Intel CPU 在低端 |
報告_MS_整合電源方案IPS_20261006_141.png |
51KB | 真資料圖(股價/目標價,非嵌圖) | 台達電股價與歷史目標價階梯圖,最新 2,700 |
報告_MS_整合電源方案IPS_20261006_142.png |
53KB | 真資料圖(股價/目標價,非嵌圖) | 光寶股價與歷史目標價階梯圖,最新 176 |
報告_MS_整合電源方案IPS_20261006_143.png |
56KB | 真資料圖(股價/目標價,非嵌圖) | Panasonic 股價與歷史目標價階梯圖,最新 4,700 |
報告_MS_整合電源方案IPS_20261006_062.png |
55KB | 真資料圖(估值,非嵌圖) | 台達 NTM 本益比(Avg ≈23x、±1/2 StDev 線,2026 年中高點接近 50x) |
報告_MS_整合電源方案IPS_20261006_067.png |
48KB | 真資料圖(估值,非嵌圖) | 台達泰國與台達的 12M forward P/E 差距折線圖(2020 年後由近 0 拉大,高峰約 90) |
財務圖(依 Exhibit 標題分類、未逐張檢視,≥40KB):_063(Ex.70 DET NTM P/E)、_064(Ex.69 Delta NTM P/E)、_065(Ex.71 TWSE NTM P/E)、_066(Ex.72 SET NTM P/E)、_090(Ex.96 台達折舊)、_099、_100(Ex.106/107 台達月營收與股價)、_102(Ex.110 FINI 持股)、_103(光寶股價與目標價)、_105(光寶 MS vs consensus)、_106(Ex.114 光寶 NTM P/E)、_128(Ex.136 光寶折舊)、_137、_138(Ex.150/151 光寶月營收與股價)、_140(Ex.154 FINI 持股)。<40KB 其餘(Exhibit 1、4、7-10、16 之外的小圖、財務趨勢圖與 logo)預設非嵌圖對象。
原始內容
| Morgan Stanley Taiwan Limited+ | Morgan Stanley Taiwan Limited+ | Morgan Stanley Taiwan Limited+ |
|---|---|---|
| Derrick Yang Equity Analyst | Derrick Yang Equity Analyst | Derrick Yang Equity Analyst |
| D rrick.Yang@morganstanl y.com | D rrick.Yang@morganstanl y.com | +886 2 2730-2862 |
| Morgan Stanley MUFG Securities Co., Ltd.+ | Morgan Stanley MUFG Securities Co., Ltd.+ | Morgan Stanley MUFG Securities Co., Ltd.+ |
| Kazuo Yoshikawa, CFA Equity Analyst | Kazuo Yoshikawa, CFA Equity Analyst | Kazuo Yoshikawa, CFA Equity Analyst |
| Kazuo.Yoshikawa@morganstanl ymufg.com | Kazuo.Yoshikawa@morganstanl ymufg.com | +81 3 6836-8408 |
| Morgan Stanley Asia Limited+ | Morgan Stanley Asia Limited+ | Morgan Stanley Asia Limited+ |
| Andy Meng, CFA | Andy Meng, CFA | Andy Meng, CFA |
| Equity Analyst Andy.M ng@morganstanl y.com | Equity Analyst Andy.M ng@morganstanl y.com | +852 2239-7689 |
| Morgan Stanley Taiwan Limited+ | Morgan Stanley Taiwan Limited+ | Morgan Stanley Taiwan Limited+ |
| Vivi Huang R s arch Associat Vivi.Huang@morganstanl y.com | Vivi Huang R s arch Associat Vivi.Huang@morganstanl y.com | +886 2 2730-2860 |
| Morgan Stanley MUFG Securities Co., Ltd.+ Hidetaka Suzuki | Morgan Stanley MUFG Securities Co., Ltd.+ Hidetaka Suzuki | Morgan Stanley MUFG Securities Co., Ltd.+ Hidetaka Suzuki |
| R s arch Associat Hid taka.Suzuki@morganstanl ymufg.com | R s arch Associat Hid taka.Suzuki@morganstanl ymufg.com | +81 3 6836-8402 |
| Greater China Technology Hardware | Greater China Technology Hardware | Greater China Technology Hardware |
| Asia Pacific Industry View In-Line | Asia Pacific Industry View In-Line | Asia Pacific Industry View In-Line |
| What's Changed | What's Changed | What's Changed |
| Delta Electronics Inc. (2308.TW) | From | To |
| Price Target | NT$2,700.00 | NT$2,500 00 |
| Lite-On Tec nology (2301.TW) | From | To |
| Price Target | NT$176.00 | NT$315 00 |
Morgan Stanley does and seeks to do business with companies covered in Morgan Stanley Research. As a result, investors should be aware that the firm may have a conflict of interest that could affect the objectivity of Morgan Stanley Research. Investors should consider Morgan Stanley Research as only a single factor in making their investment decision.
For analyst certification and other important disclosures, refer to the Disclosure Section, located at the end of this report.
= Analysts employed by non-U.S. affiliates are not registered with FINRA, may not be associated persons of the member and may not be subject to FINRA restrictions on communications with a subject company, public appearances and trading securities held by a research analyst account.
M Asia Pacific Insight October 6, 2026 12:44 AM GMT
Greater China Technology Hardware
Integrated Power Solutions Driving Secular Demand
Increasing power consumption, along with the deployment of BBU/CBU/8 /±4 VDC/SST in AI clusters, could push the technology barrier higher and present growth opportunities for players with superior capabilities. Fuel cells could also emerge as a new opportunity amid power constraints.
Secular demand for power amid AI capex: AI related power consumption will continue to increase, and we believe this will lead to secular demand for power related components, such as power supply units (PSUs), battery backup units (BBUs), capacitor bank units (CBUs), coolant distribution units (CDUs), and so on. Moreover, the requirement for efficiency will inevitably necessitate the adoption of 800/±400 voltage direct current (VDC) in the power rack/center/block configuration (initially from late 2026 and broadly in 2028, we estimate), eventually extending to the deployment of solid state transformers (SST) in the longer term - all pointing to a more centralized power delivery architecture in the future. This trend of aggregation could raise the technology barriers amid the fusion of white/ grey space, favoring players with better capabilities and execution. Overall, we forecast the datacenter PSU market size to grow at a 75% three year CAGR to reach US$33bn in 2028.
Fuel cell to improve flexibility and re ilience of AI power delivery: Despite the strong AI capex outlook (MSe global cloud capex +97%/20% YoY in 2026/2027), power has become a bottleneck, indicated by MS's forecast power shortfall of 5GW in 2026, scaling to a total 72GW through 2029 (see report). Fuel cells, among other alternative energy sources, could emerge as a good solution to pick up some slack and enhance efficiency through active micro grid management. Those who are able to offer comprehensive solutions from power sources to power delivery could be increasingly more competitive in the market.
A uming coverage of Delta and Lite-On:
- Delta (OW, PT NT$2,500, based on 30x 2027/2028 P/E) should maintain its dominant position in the industry with its integrated power/thermal related solutions while fuel cells could add incremental growth opportunities in the longer term. We think a 30x P/E target multiple is justified by our estimated 63% earnings CAGR in 2025 28, driven by a 44% revenue CAGR and operating margin expansion to 22.1% in 2028 vs 15.1% in 2025,
- Lite On (EW, PT NT$315, based on 17x 2027/2028 P/E), the second largest player in AI power related products, should also ride the tailwinds despite its slower progress in HVDC power racks and liquid cooling solutions. We think a 17x P/E target multiple is justified by our estimated 47% earnings CAGR in 2025 28 (29% revenue CAGR and 6.8ppt OPM expansion to 16.8% in 2028).
M Asia Pacific Insight
The Story in Charts
Exhibit 1: AI s rv rs continuing to s high r TDP...
Sourc : Company data, Morgan Stanl y R s arch stimat s
Exhibit 3: HVDC to s arly adoption from lat 2026...
Sourc : Nvidia
Exhibit 5: SST is also in th pip lin for mor c ntraliz d pow r d liv ry
Exhibit 2: ...which driv s data c nt r pow r supply d mand
Sourc : Company data, Morgan Stanl y R s arch stimat s
Exhibit 4: ...with a much high r dollar cont nt
Sourc : Morgan Stanl y R s arch
Exhibit 6: Fu l c lls ar a good option for b tt r r sili nc in pow r archit ctur
Sourc : Infin on
Sourc : D lta
IIDIA
M Asia Pacific Insight
Executive Summary
AI cluster performance evolving to fulfill demand
The rapid adoption of artificial intelligence is driving a significant increase in global data center compute demand. Advances in foundation models, reasoning capabilities, agentic AI, and enterprise AI deployment are increasing the computational resources required for both training and inference. To support this growth, hyperscalers and model developers continue to deploy larger and more powerful AI clusters, driving demand for greater compute, memory, and networking capacity.
As AI infrastructure scales, cluster performance is increasingly determined by the efficiency of the entire system rather than the capabilities of individual processors alone. Compute, networking, cooling, and power infrastructure must all evolve together to support higher rack densities and larger deployments. While semiconductor innovation remains critical, supporting infrastructure is becoming an equally important factor in enabling future AI growth.
AI cluster performance is fundamentally a power problem
As AI clusters continue to scale in size and performance, power consumption is becoming one of the most important constraints on future infrastructure deployment. The power challenge is no longer limited to GPUs alone, as modern AI clusters comprise tightly integrated compute, networking, memory, storage, and cooling systems, all of which require increasing amounts of power as performance requirements rise. Consequently, the next phase of AI infrastructure investment should be viewed not only as a semiconductor upgrade cycle but also as a broad based power infrastructure upgrade cycle.
Server power consumption has increased significantly across successive AI hardware generations. Nvidia's architecture roadmap illustrates the industry's migration from relatively modest server level power budgets under the Ampere and Hopper generations toward rack scale systems under Blackwell and future Rubin architectures. Estimated rack level power consumption has increased from roughly 40kW for Hopper systems to approximately 120kW for GB200 NVL72 and 140kW for GB300 NVL72, with future Vera Rubin systems expected to approach 200 300kW per rack with current Vera Rubin systems reaching up to 330kW per rack while future Vera Rubin generations are expected to surpass these levels. As compute density continues to increase, power delivery infrastructure is becoming a critical enabler of system performance.
The increase in power consumption is not limited to compute hardware. Networking systems are also becoming increasingly power intensive as switch bandwidth scales from 100G architectures toward 800G and 1.6T generations. Despite substantial process node improvements, switch ASIC power consumption has continued to rise due to increasing complexity and higher SerDes speeds. As a result, networking equipment now requires significantly larger power budgets than previous generations, creating additional demand for higher capacity power supplies throughout the data center.
M Asia Pacific Insight
Exhibit 7: TDP roadmap for Nvidia racks
Sourc : Morgan Stanl y R s arch
Exhibit 8: Pow r supply d nsity for Tomahawks
■
Sourc : Morgan Stanl y R s arch
The growth in power consumption is driving a corresponding upgrade cycle for power supply units (PSUs). Earlier AI server generations typically relied on multiple 3 3.3KW power supplies installed directly within individual server chassis. As the industry transitions toward rack scale architectures, power conversion is increasingly centralized into dedicated power shelves capable of supporting substantially larger power loads. In Blackwell systems, power shelves utilize 5.5KW power supplies, while future Rubin generation platforms are expected to increase PSU ratings to approximately 18KW, representing a significant increase in both PSU content and power density.
Delivering higher power within a similar footprint creates significant engineering challenges. Increasing PSU power density requires advances across multiple areas, including higher performance power semiconductors such as silicon carbide (SiC) and gallium nitride (GaN), more efficient power conversion topologies, smaller and more capable magnetic components, improved thermal management solutions, and greater system integration. As output power increases, thermal constraints become increasingly important, making heat dissipation, airflow optimization, and mechanical design critical determinants of PSU performance.
Consequently, on top of the volume driven growth, the power supply industry is benefiting from the technology driven dynamics, where efficiency, power density, and thermal performance are becoming key competitive differentiators. As AI rack power requirements continue to increase, PSU innovation will become an increasingly important component of the broader AI infrastructure investment cycle.
M Asia Pacific Insight
Exhibit 9: Pow r d nsity p r PSU tr nd in Nvidia s rv r syst ms
Sourc : Nvidia, Morgan Stanl y R s arch
Overall, we estimate the global datacenter power supply market will grow at a three year CAGR of 75% to reach US$33bn in 2028 from US$6bn in 2025, driven mainly by server shipment growth, increasing power consumption per rack, and the adoption of HVDC power racks from 2027.
Exhibit 10: Global datac nt r pow r supply mark t for cast
Sourc : Company data, Morgan Stanl y R s arch stimat s
Complementary hardware for more resilient power delivery
As AI clusters become more power intensive, maintaining stable and resilient power delivery is emerging as a critical design priority. Traditional centralized power architectures are increasingly being complemented by localized energy storage and power conditioning technologies that can respond rapidly to dynamic workload demands.
Battery Backup Units (BBUs) represent one of the most important additions to modern AI power architectures. Positioned close to the computing workload, BBUs provide localized energy storage capable of responding significantly faster than facility level backup systems. Their role extends beyond conventional backup power functionality. BBUs can M Asia Pacific Insight absorb transient fluctuations, smooth power ramps, and improve overall rack level power stability. By providing local buffering capacity, BBUs help reduce the burden on upstream power distribution infrastructure while improving overall system resilience.
Sourc : Panasonic
Capacitor Backup Units (CBUs) address an even shorter duration segment of the power stability challenge. Utilizing supercapacitors and other high power density storage technologies, CBUs can deliver and absorb power within milliseconds, making them particularly effective for managing rapid GPU power spikes. These systems act as shock absorbers within the electrical architecture, preventing sudden load changes from propagating throughout the broader power network. As AI rack power densities continue increasing, capacitor based energy storage is becoming an attractive solution for improving power quality without requiring substantial oversizing of facility infrastructure.
Exhibit 14: GB300 pow r sh lf with int grat d capacitors
Exhibit 13: CBU
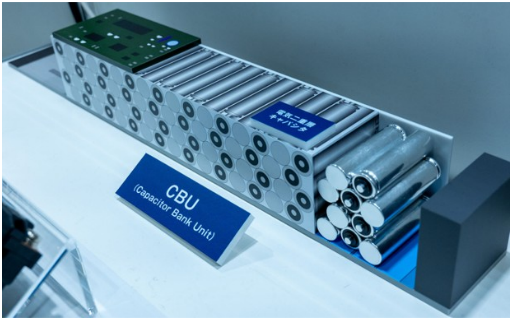
Sourc : Panasonic Sourc : Nvidia Together, BBUs and CBUs provide complementary benefits. BBUs are designed to handle longer duration events, while CBUs are optimized for extremely fast transient response. The integration of these technologies enables operators to improve power quality, reduce stranded infrastructure capacity, enhance system reliability, and increase effective utilization of expensive electrical assets. As rack densities continue to rise, localized energy storage solutions are likely to become a standard component of AI data center design rather than an optional enhancement.

M Asia Pacific Insight
The adoption of BBU and CBU architectures may also enable future increases in rack density. As operators attempt to push toward several hundred kilowatts per rack, localized power buffering solutions can help mitigate transient peaks and reduce stress on grid facing infrastructure. This allows operators to deploy higher density computing resources without proportionately increasing upstream electrical capacity.
Exhibit 15: Comparison of CBU and BBU
| Dimension | CBU | BBU |
|---|---|---|
| Primary storage medium | EDLC supercapacitors, LICs or high-capacitance | Typically lithium-ion battery cells managed by a BMS |
| Primary strength | High power, fast charge/discharge and frequent | Higher stored energy and longer sustained |
| Main function | Transient smoothing, peak shaving, voltage | Outage backup, source-transfer bridging and orderly workload |
| Response profile | Well suited to millisecond-class load support and | Fast switchover, but generally optimized for sustained support rather |
| Typical duration | Milliseconds to seconds; selected systems can extend toward tens of seconds or more | Commonly tens of seconds to several minutes, depending on battery and rack design |
| Power versus energy density | Higher power capability but lower energy storage per unit volume than a battery | Higher energy density, making it more economical for longer events |
| Cycle life | Eaton specifies more than one million cycles and up to 20 years for certain supercapacitor modules | Battery life is more sensitive to depth of discharge, temperature and repeated cycling; BMS supervision is therefore essential. |
| State management | Requires cell balancing, voltage/temperature monitoring and state-of-health tracking, but does not use a conventional battery fuel | Requires BMS functions including charge control, state of charge, state of health and cell protection |
| Best-fit use case | Repetitive AI power spikes, inrush events, PSU load leveling and bus stabilization | Power continuity through outages, brownouts or generator/source- transfer intervals |
Sourc : Morgan Stanl y R s arch
HVDC emerging as a necessity, with T in the pipeline
800VDC and ±400VDC progressing simultaneously
The rapid increase in AI rack power density is creating growing challenges for conventional power distribution architectures. As rack level power consumption rises from tens of kilowatts to several hundreds of KWs, electrical losses, cable size, thermal management requirements, and overall system complexity increase significantly. Under traditional low voltage power architectures, delivering larger amounts of power requires proportionally higher current, which increases resistive losses and places greater stress on cables, connectors, busbars, and power conversion equipment.
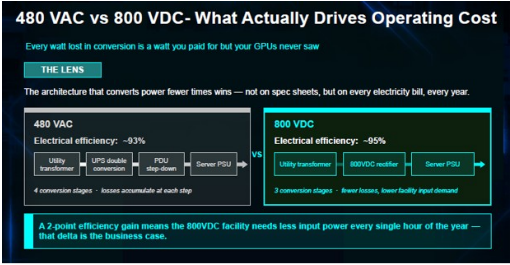
At the same time, every power conversion stage introduces efficiency losses and generates additional heat. As AI deployments scale into multi megawatt and eventually gigawatt level campuses, even small efficiency improvements can translate into meaningful reductions in operating costs, cooling requirements, and infrastructure investment. Consequently, the industry is increasingly focused on power architectures that can reduce conversion stages, lower current levels, and improve overall power delivery efficiency.
Against this backdrop, high voltage direct current (HVDC) is emerging as one of the most important architectural upgrades for next generation AI infrastructure. By increasing distribution voltage, HVDC allows the same amount of power to be delivered at a lower current, reducing conduction losses and improving system efficiency. Higher voltage architectures also improve scalability for ultra high density rack deployments by alleviating some of the physical and thermal constraints associated with conventional power distribution systems.
M Asia Pacific Insight
Exhibit 16: B tt r pow r ffici ncy for 800VDC archit ctur
Sourc : D lta
Exhibit 17: B tt r ffici ncy l ads to cost savings
Nvidia's roadmap illustrates the industry's gradual migration toward higher voltage power architectures. Earlier AI server generations primarily utilized conventional power delivery schemes centered around rack level 48V distribution. As rack power requirements increased with Blackwell generation systems, industry participants began evaluating higher voltage architectures capable of supporting substantially greater power density. Looking ahead, the industry is increasingly converging around 800VDC as a potential next generation standard for large scale AI deployments, particularly as rack level power consumption approaches several hundred kilowatts. The transition reflects the need to improve power distribution efficiency while supporting the continued growth of AI computing infrastructure.
We believe that the adoption of the 800VDC power rack could start from late 4Q26, though it should be small scope deployment through 2027, since the in rack power shelf is the reference design in the Vera Rubin NVL72 rack. Broader adoption should happen more likely from late 2027 and 2028, as the Vera Rubin Ultra rack further pushes up the power consumption.
Exhibit 18: HVDC d ploym nt roadmap
800 VDC Equipment Readiness
Sourc : Nvidia
M Asia Pacific Insight
The 800VDC power rack BOM is primarily driven by the PSU, which accounts for 50-55% of total cost, followed by the BBU at 25-30%, with other components comprising the remaining 15-20%. This cost structure reflects the broader functionality integrated into an HVDC power rack, combining power conversion, backup power and supporting components within a centralized architecture.
For power supply players, one of the most direct implications is that an HVDC power rack carries around 4-5x higher dollar content per watt compared with a conventional in rack PSU solution, since the former integrates more components into a robust system and power supply players usually ship the entire rack instead of just the components.
Exhibit 19: BOM cost br akdown for an 800VDC pow r rack
Exhibit 20: High r dollar cont nt for HVDC pow r racks
Sourc : Morgan Stanl y R s arch
Sourc : Morgan Stanl y R s arch
However, the industry has not yet fully converged on a single architecture. While Nvidia's roadmap increasingly points toward 800VDC, several hyperscalers and members of the Open Compute Project (OCP) ecosystem have expressed interest in ±400VDC architectures. Both approaches deliver similar total voltage levels and pursue many of the same objectives, including lower current, higher efficiency, and improved scalability. The debate largely centers on implementation trade offs rather than end goals.
Supporters of 800VDC generally highlight the advantages of a simpler single bus architecture, potentially lower system complexity, and closer alignment with existing industrial high voltage DC equipment. The architecture avoids the need to maintain balanced positive and negative voltage rails and may simplify certain aspects of power conversion and system integration. These characteristics make 800VDC particularly attractive in environments where operational simplicity and interoperability with existing electrical infrastructure are key priorities.
Advocates of ±400VDC, meanwhile, emphasize the advantages of a bipolar architecture. By creating positive and negative voltage rails around a neutral reference point, ±400VDC can potentially reduce insulation requirements, simplify certain fault management scenarios, and provide improved flexibility for load balancing and future system expansion. Many hyperscalers also view the bipolar approach as being more compatible with long term visions for highly distributed power systems incorporating energy storage, renewable energy, and microgrid functionality.
Importantly, the ultimate beneficiaries may be largely independent of which standard gains wider adoption. With the exception of certain power semiconductor and protection system requirements, many component suppliers across the power ecosystem remain M Asia Pacific Insight broadly agnostic between 800VDC and ±400VDC implementations. Higher voltage architectures in either form require similar upgrades in power conversion, power management, cooling, connectors, magnetics, and infrastructure equipment. As a result, the industry's migration toward HVDC matters significantly more than the eventual selection of any single voltage standard.
Exhibit 21: Comparison of 800VDC and ±400VDC
| Metric | ±400VDC | 800VDC |
|---|---|---|
| Voltage to ground | 400V relative to ground | 800V relative to ground |
| Voltage differential | 800V | 800V |
| Power distribution efficiency | High | Slightly higher |
| Scalability | Good | Excellent |
| Insulation requirements | Lower | Higher |
| Maintenance safety | Better | More challenging |
| System architecture simplicity | Dual-rail system | Single-bus system |
| Grounding Complexity | More complicated | Simpler |
| Electrical footprint | Small | Smaller |
| Ability to reduce conversion stages | Moderate | Highest |
| Long-distance distribution capability | Excellent | Excellent |
| Maturity of ecosystem | Better today | Early but rapidly developing |
| Industry players | OCP, hyperscalers | Nvidia |
| Long term industry direction | Transitional architecture | Likely end-state architecture |
Sourc : Morgan Stanl y R s arch
olid-state transformers to follow after 800VDC/±400VDC matures
Looking further ahead, solid state transformers (SSTs) represent a potential next generation evolution of power infrastructure. Unlike traditional transformers that operate primarily as passive devices, SSTs leverage power electronics to provide voltage conversion, power conditioning, and bidirectional energy management within a single platform. This enables greater controllability and flexibility while supporting increasingly digitalized power networks.
Although SSTs remain at an early stage of commercialization and face challenges related to economics, reliability, and large scale deployment, the technology aligns well with long term data center trends. As AI campuses evolve into utility scale power consumers incorporating energy storage, distributed generation, and advanced power management, SSTs could eventually become a key enabling technology.
Therefore, while HVDC is expected to drive the next phase of power architecture upgrades, SSTs represent a longer term technology roadmap that could further transform how future data centers distribute and manage electricity.
M Asia Pacific Insight
Exhibit 22: SST nabling mor ffici nt pow r d liv ry archit ctur
Sourc : Infin on
Exhibit 23: SST off rs b tt r pow r ffici ncy with at l ast 30% l ss spac /w ight
Sourc : Morgan Stanl y R s arch
According to Infineon, SST could represent an emerging >US$1bn market opportunity by 2030, as the technology begins to replace a portion of the >US$15bn conventional transformer market, particularly in smaller power applications. While SST penetration is expected to remain relatively modest versus the overall transformer market, the opportunity is significant for relevant players in the longer term.
Exhibit 24: SST to s initial adoption in 2030
Solid-state transformers: new application for semiconductors with significant additional market potential
Comparson refers to muiti modutar inverter (dual stage with HFT) based on owm estimations.
Sourc : Infin on
M Asia Pacific Insight
Fuel cells for better flexibility and resilience
Fuel cells generate electricity through an electrochemical reaction rather than combustion. Hydrogen, natural gas, biogas, or other fuels are supplied to the fuel cell stack, where chemical energy is converted directly into electricity, heat, and in some cases water. Unlike batteries, which store energy, fuel cells continuously generate power as long as fuel is supplied.
Exhibit 25: Fu l c ll diagram
Sourc : 3M
Fuel cells can offer several benefits, including:
- High energy efficiency: Direct electrochemical conversion enables higher efficiency than conventional combustion based power generation, reducing fuel consumption and operating costs.
- Low carbon emi ion : Fuel cells produce minimal direct emissions and can support long term decarbonization goals when powered by low carbon fuels such as hydrogen.
- Grid independence and energy ecurity: Provides reliable onsite power generation, reducing dependence on grid availability and improving energy resilience.
- Long-duration energy torage enabler: Hydrogen based fuel cell systems can complement renewable energy by storing energy over extended periods, supporting long duration and seasonal energy storage.
- Fuel flexibility: Certain fuel cell technologies can operate on hydrogen, natural gas, biogas, ammonia derived hydrogen, and other hydrogen rich fuels, allowing deployment using existing fuel infrastructure.
- Low maintenance and quiet operation: Limited moving parts reduce maintenance requirements while providing quieter operation than conventional combustion based generators.
- Scalable deployment: Can be deployed across a wide range of power levels, from distributed backup systems to utility scale installations, making fuel cells suitable for large AI data center campuses
M Asia Pacific Insight
However, the following challenging are hurdles for wider deployment:
- High y tem co t: Fuel cells remain more expensive than conventional power generation technologies, limiting large scale adoption.
- Limited hydrogen infra tructure: Hydrogen production, transportation, storage, and refueling networks remain underdeveloped in most regions.
- Durability requirement : Long term reliability and stack lifetime remain key challenges, particularly for large scale and mission critical deployments.
- Regulatory and afety con ideration : Hydrogen handling requires specialized infrastructure and compliance with stringent safety regulations, increasing deployment complexity.
- Lack of tandardization: Multiple fuel cell technologies compete across different applications, creating uncertainty around long term technology standards and adoption paths.
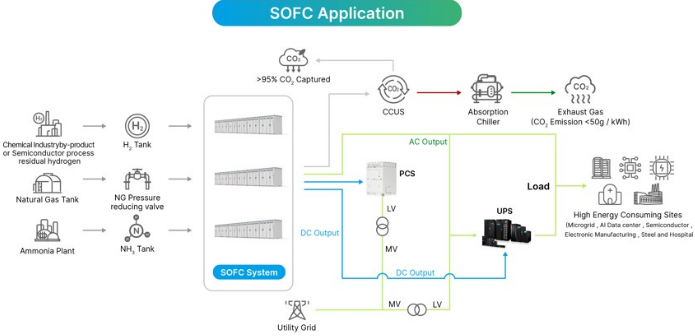
Fuel cells have the potential to fundamentally reshape future data center power architectures. Traditionally, data centers rely on grid electricity as the primary power source and diesel generators for backup power. However, as AI driven workloads significantly increase power demand and power availability becomes a key deployment constraint, hyperscalers are increasingly evaluating fuel cells not only as a backup power solution but also as a potential primary power source. This could accelerate the transition from a grid centric architecture toward one incorporating distributed onsite generation, enabling data center deployment in regions where utility power capacity is limited.
Over the longer term, fuel cells could become a core component of AI data center microgrids that integrate renewable generation, battery storage, hydrogen storage, and intelligent energy management systems. Such an architecture would improve scalability, resilience, and energy independence while reducing reliance on centralized utility infrastructure. In addition, because fuel cells inherently generate DC power, they align well with the industry's migration toward HVDC based power distribution architectures. This could simplify power delivery by reducing conversion stages between generation and IT equipment, improving overall system efficiency and supporting next generation high density AI deployment
Exhibit 26: Fu l c ll in datac nt r pow r d liv ry archit ctur
Sourc : D lta M Asia Pacific Insight
tock picks
Delta (2308.TW, OW, PT NT$2,500)
Dominant upplier in the AI power upply offering : Delta has been one of the most competitive players in power related components and systems, as its offerings spanning from the core power supply units, the complementary BBU/CBU for AI servers, the highly anticipated HVDC power rack, grey space power facilities to air/cooling solutions. We estimate that it has ~60% market share in the datacenter power supply market and is among the leading suppliers of the 800VDC/±400VDC power rack to Nvidia/hyperscalers in 2H26 (wider adoption likely from late 2027). Longer term, when the HVDC becomes more mature, the centralized power delivery architecture could migrate into SSTs, where Delta already has small volume shipment now. With the solid technology, close customer relationships and strong execution, we believe Delta should stay competitive even amid the fusion of the white space and grey space.
Extending from power delivery to power ource: In addition to the offerings in the power delivery, Delta signed a licensing agreement with Ceres Power (CRW.GB) for its solid oxide fuel cell (SOFC) technology in early 2024. This could extend its business scope into the power source area. which we believe could add more value to its customers as it could help mitigate the power constraints for datacenter build and enhance the operational efficiency through active micro grid management.
Solid near term momentum: Despite the slower revenue growth owing to the component supply tightness in 3Q26, we expects its 4Q26 revenue to grow by double digit % QoQ on alleviated component supply and solid demand. 3Q26 GM should be flat to slightly up QoQ and 4Q26 might see further expansion on the tailwinds price hikes.
OW with PT of NT$2,500: We see power/thermal as one of the major secular AI related themes in the downstream tech space and Delta is well positioned to benefit, potentially driving a 63% earnings CAGR in 2025 28, in our estimate. We thus assume the coverage of Delta with an OW rating and the PT of NT$2,500, based on 30x 2027/2028 P/E. Our target multiple implies a PEG of 0.5 vs. the average PEG of 1.2 in 2020 25, when the stock was trading at an average 12M forward P/E of 22x with the earnings CAGR of 19%.
Lite-On (2301.TW, EW, PT NT$315)
Ri ing tide lifting all boat : Lite On is the second largest power supply vendor globally and has been engaging with hyperscalers regarding the ASIC and Nvidia GPU servers. Looking ahead, it expects to expand its share in a couple of hyperscalers from late 2026. It should have over 50% of the total revenue generated from the cloud segment for PSUs, BBUs, and to a lesser extent, other mechanical components like liquid cooling, chassis/ rack, etc. Moreover, it also has the HVDC power rack solutions ready and is qualifying with potential customers. The cloud shall remain as the major growth driver in the coming years.
A piration in the optical communication pace: Lite On has always had an opto business (10 20% of total revenue in 2026) in both visible and invisible light applications. Post the strategic investment at Dense Light (21% stake), an InP epi wafer and chip process manufacturer, it plans to leverage its expertise in packaging and provides the optical M Asia Pacific Insight modules and engine for the data interconnects. While the end applications looks promising, we think it might take some time to see more meaningful revenue contribution in Lite On.
Cloud momentum extending into the coming quarter : We expect its 4Q26 revenue to grow by double digit QoQ driven mainly by the could segment and GM should normalize at ~25% in 2H26 vs. 27.2% in 2Q26 on some inventory write off reversal and high margin product shipment delayed from the previous quarter.
EW with PT of NT$315: We think Lite On will grow along with the AI capex cycle, driven by its power related offerings (47% earnings CAGR in 2025 28, in our estimate), though execution and progress with new customers is worth monitoring. We assume coverage of Lite On with an EW rating and a PT of NT$315, based on 17x 2027/2028 P/E. Our target multiple implies a PEG of 0.4 vs. the average PEG of 1.6 in 2020 25, when the stock was trading at an average 12M forward P/E of 14x on an earnings CAGR of 9%.
Panasonic Holdings (EW, PT ¥4,700, covered by Kazuo Yoshikawa)
Pana onic ha an approximately 80% hare of the BBU market and i well po itioned to benefit from ri ing AI data center power demand: The company expects data center energy storage revenue to grow from ¥322bn in FY3/26 to approximately ¥550bn in FY3/27 and around ¥1trn in FY3/29. Importantly, all of the business underpinning its FY3/29 revenue target has already been awarded, meaning agreements have been reached with customers on product development and orders.
BBU: Panasonic has begun limited mass production of new high capacity BBU cells above 200W, with products adopted by a major GPU vendor and ramping from June July. Discussions for next generation server platforms are in the final stages, and the company expects to maintain its approximately 80% market share. It also sees scope for higher pricing as rack level power consumption rises.
The company is also close to securing awards for BBUs used in dedicated power racks. As its medium term plan includes only already awarded business, additional design wins could provide upside.
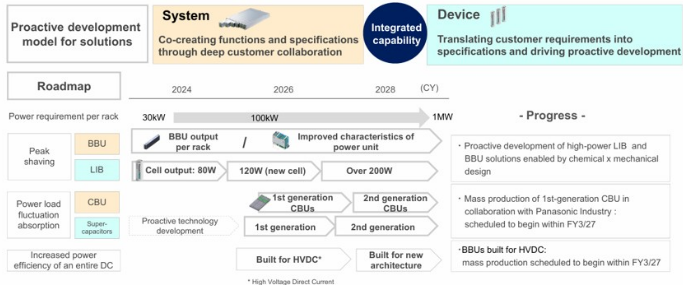
CBU: CBUs are emerging as a new growth opportunity as GPU and ASIC power consumption increases. Panasonic is working with power supply vendors to propose integrated BBU+CBU solutions and is receiving inquiries from US and Chinese hyperscalers, including customers that were not previously BBU users.
M Asia Pacific Insight
Exhibit 27: Panasonic Holdings: Str ngth n proposal and d v lopm nt capabiliti s for th n xt g n ration
Sourc : Company data
Risks to our positive view
Risks to our positive view on power related demand include:
- Component supply tightness leading to lower shipment of products
- Shortfall in hardware shipments, yield issues, electricity availability, etc. slowing down datacenter builds
- Lower than expected penetration of new power delivery architectures like 800VDC/±400VDC, SST, etc.
- More intense competition leading to margin erosion among most players
- Hyperscalers prove unable to finance aggressive capex through internal and external funding.
M Asia Pacific Insight
AI Cluster Performance Evolving to Fulfill Demand
AI adoption driving exponential growth in compute demand
AI is becoming a mainstream computing workload
Over the past three years, generative AI has evolved from a research application into a core technology platform. Consumer applications such as ChatGPT, Claude, Gemini, and Copilot now serve hundreds of millions of users globally, while enterprises are increasingly embedding AI into software development, customer service, document analysis, enterprise search, healthcare, financial research, and industrial automation.
Historically, software demand scaled roughly with the number of users. AI demand is fundamentally different because every user interaction consumes computational resources in real time. Unlike traditional cloud applications, where the bulk of computation occurs during software development, AI applications continuously consume compute whenever a model generates a response. Consequently, rising AI adoption directly translates into higher demand for data center compute resources.
Model complexity continues to increase
The AI industry has historically improved model performance through scaling laws: larger models trained on larger datasets using more compute generally produce better outcomes. While efficiency improvements continue, leading AI developers remain committed to scaling model capabilities.
More importantly, the industry is moving beyond conventional language models toward significantly more compute intensive architectures.
Reasoning models
Traditional LLMs generate answers directly from a prompt. New reasoning models perform multiple internal computational steps before producing a response. Instead of generating a few hundred output tokens, advanced reasoning systems may generate thousands or even tens of thousands of internal reasoning tokens while evaluating different solution paths. This dramatically increases inference workloads.
The industry is increasingly shifting from "parameter scaling" toward "test time compute scaling," where additional compute is consumed during inference to improve answer quality. From an infrastructure perspective, this is highly significant because inference workloads occur continuously rather than once during model training.
M Asia Pacific Insight
Exhibit 28: Incr asing d mand for comput pow r from r asoning mod ls
Sourc : Morgan Stanl y R s arch stimat s
Agentic AI
The next wave of AI applications involves autonomous agents capable of planning, executing, verifying, and refining tasks.
Instead of generating a single answer, an AI agent may search multiple information sources, run code, validate results, generate follow up tasks, and produce a final response. Each step requires additional inference cycles.
A workflow that previously required one model invocation may now require dozens of model calls, substantially increasing compute consumption per user.
Multimodal AI
AI models are increasingly processing images, video, audio, sensor data, and text simultaneously.
Video understanding is particularly compute intensive because each second of video contains vastly more information than a text prompt.
As multimodal AI adoption grows, compute demand per query rises significantly, creating another structural driver of accelerator demand.
Training demand remains robust
Although inference is becoming the largest source of AI compute demand, training workloads continue to expand. Frontier model development increasingly requires clusters containing tens of thousands of accelerators operating simultaneously.
Training runs are becoming larger because developers are pursuing larger parameter counts, more training data, longer training durations, multimodal datasets and reinforcement learning and reasoning optimization
Consequently, each new generation of foundation models typically consumes substantially more compute than the previous generation.
M Asia Pacific Insight
Importantly, training infrastructure sets the baseline for future inference deployment. Every major model developer must maintain access to large scale training clusters to remain competitive, supporting continued demand for high end AI accelerators.
More compute requests to be fulfilled by better chip performance
Rising compute demand cannot be addressed simply by adding more servers. Modern AI workloads increasingly encounter bottlenecks related to memory bandwidth, interconnect performance, power consumption, and cooling. As a result, each new generation of AI hardware delivers improvements across multiple dimensions.
Compute performance
The latest AI accelerators provide several fold performance improvements versus prior generations. For example, NVIDIA's Blackwell architecture was specifically designed to support both large scale training and high volume inference, with significant gains in AI throughput compared with previous Hopper based systems. Performance improvements are necessary because reasoning and agentic workloads require substantially more operations per query.
Memory capacity and bandwidth
AI models are increasingly constrained by memory rather than raw compute, because longer models, longer context windows, reasoning models and agentic workflows all require more memory. As model complexity increases, modern high end accelerators usually incorporate hundreds of gigabytes of High Bandwidth Memory (HBM), providing memory bandwidth measured in multiple terabytes per second.
Interconnect performance
As AI clusters scale from hundreds to thousands of accelerators, communication between processors becomes increasingly important. A large AI training cluster effectively behaves like a single massive computer. Consequently, networking technologies such as NVLink, InfiniBand, Ethernet, etc., have become critical enablers of AI scaling.
Many AI workloads can no longer be accelerated simply by increasing GPU performance; cluster interconnect bandwidth must also improve.
M Asia Pacific Insight
Exhibit 29: Comput pow r for HPCs continuing to volv
Sourc : Company data, Morgan Stanl y R s arch
M Asia Pacific Insight
AI Cluster Performance Is Fundamentally a Power Problem
As AI clusters become larger and more powerful, every component within the cluster must deliver higher throughput, lower latency, and greater bandwidth. Achieving these improvements inevitably requires more electrical power.
Therefore, the power challenge is no longer limited to GPUs. Modern AI clusters are highly integrated systems comprising compute servers, networking fabrics, memory subsystems, storage infrastructure, and cooling equipment. As cluster performance increases, power consumption rises across the entire infrastructure stack.
In our view, the next phase of AI infrastructure investment should be viewed not simply as a semiconductor upgrade cycle, but as a broad based power consumption cycle driven by the need for ever higher AI cluster performance.
erver systems seeing increasing TDP
Nvidia's AI server power roadmap is best understood as a transition from chip defined, air cooled nodes to power , cooling and fabric constrained rack scale computers: the Ampere era A100 SXM carried a disclosed 400W standard TDP-up to 500W in custom thermal designs-with 40/80GB HBM2/HBM2e and 600GB/s NVLink, while the eight GPU, dual AMD EPYC DGX A100 was a conventional 6U server with a 6.5KW maximum input rating, meaning GPU silicon represented only roughly half of the node envelope once CPUs, NVSwitches, memory, NICs, drives, fans and conversion losses were included.
Hopper stepped the H100 SXM to a disclosed 700W TDP, 80GB HBM3, roughly 3TB/s memory bandwidth and 900GB/s fourth generation NVLink, while H200 retained essentially the same Hopper compute architecture and power profile but substituted 141GB of faster HBM3e at 4.8TB/s-making H200 primarily a memory capacity/bandwidth upgrade rather than a compute TDP step up-and Nvidia rates the eight GPU, dual Xeon DGX H100/H200 at 10.2KW maximum input, versus 6.5KW for DGX A100;
The architectural discontinuity arrives with GB200. Rather than treating an eight GPU server as the scale up unit and using InfiniBand/Ethernet primarily between nodes, Grace Blackwell NVL72 makes the entire rack the scale up domain, integrating 18 one U compute trays-each with two 72 core Grace Arm CPUs and four Blackwell GPUs-plus nine NVLink switch trays, management switches, , a 50-51V DC busbar, copper NVLink cartridges and liquid manifolds, so that 36 CPUs and 72 GPUs operate as one low latency NVLink connected system. Based on the same compute die, Nvidia upgraded the HBM content to further improve the performance of GB300 chip. Overall, the rack level power consumption is estimated at ~120KW for the GB200 NVL72 and ~140KW for the GB300 NVL72.
Vera Rubin-often called VR200/R200 in industry roadmaps-pushes the same rack level philosophy further. Nvidia's disclosed architecture combines 72 dual die Rubin GPUs with 36 new Vera CPUs, replacing Grace's 72 Arm Neoverse cores with 88 custom Olympus cores, raising CPU memory capacity and bandwidth to as much as 1.5TB LPDDR5X and 1.2TB/s, and doubling coherent CPU-GPU NVLink C2C bandwidth to 1.8TB/ s; Rubin itself moves from HBM3e to 288GB HBM4 at up to 22TB/s, introduces a third M Asia Pacific Insight generation Transformer Engine and raises sixth generation NVLink scale up bandwidth to 3.6TB/s per GPU, while ConnectX 9 provides 1.6Tbps/GPU scale out connectivity and BlueField 4 increasingly offloads storage, security and infrastructure processing.
Nvidia has not published a simple Rubin chip TDP in its primary datasheet, but our supply chain checks indicate roughly 1.8kW at an efficiency oriented operating point and up to approximately 2.3kW at the performance mode, which is consistently corroborated by system vendors, with ASUS specifying 187kW Max Q and 227kW Max P for its fully liquid cooled Vera Rubin NVL72.
Looking ahead, we expect this trend to extend into the future along with the technology advancement and more critical workloads.
Exhibit 30: Comput pow r vs. TDP for HPCs
Sourc : Company data, Morgan Stanl y R s arch
Exhibit 31: TDP roadmap for Nvidia racks
Sourc : Company data, Morgan Stanl y R s arch
M Asia Pacific Insight
Networking consuming more power as well
The network switch system is another key devices within the datacenter and has been evolving over the past years, driven primarily by advances in the switch ASIC. From Tomahawk 1 (2014) to Tomahawk 6 (2025), the process node shrank from 28nm to 3nm, while aggregate switching bandwidth increased from 3.2 Tbps to 102.4 Tbps, representing a 32× increase. Over the same period, SerDes speed improved from 25 Gbps NRZ to 200 Gbps PAM4, enabling maximum port speeds to scale from 100G to 1.6T.
While process scaling significantly improved switching efficiency, it did not prevent ASIC power from rising. ASIC TDP increased from 150 W to 800 W, reflecting the growing complexity of higher radix switches and faster SerDes interfaces.
The impact of ASIC scaling is evident at the system level. As switch bandwidth increased from 100G class systems to 800G and 1.6T platforms, power delivery requirements grew dramatically. Representative PSU ratings increased from 850W in Tomahawk 2 systems to 3,200W in Tomahawk 6 systems, nearly a 4× increase.
The rise in PSU power is driven not only by the higher ASIC TDP, but also by the growing power consumption of high speed optics, increased cooling requirements, and larger overall system power budgets. As systems evolved from 100G to 1.6T ports, switch vendors were forced to add more fan redundancy, larger heatsinks, and in some cases larger chassis footprints. For example, Tomahawk 6 systems have expanded to 4U form factors with 7+1 fan redundancy to accommodate the thermal load associated with 102.4 Tbps switching capacity.
Alongside the increasing power consumption of the server racks, network switches are also witnessing higher power budgets as well.
Exhibit 32: Pow r supply d nsity for diff r nt n twork switch g n rations
■
Sourc : Company data, Morgan Stanl y R s arch
M Asia Pacific Insight
Power supply growing on both volume and specs
P U spec upgrade trend
In response to the increasing power consumption of the AI servers, the power supply architecture has been migrating as well. in the A100 and H100/200 single system servers, 6 power supply units are placed directly inside the chassis, with each capable to deliver 3.0 3.3KW of power.
When Nvidia make a broad based move to the rack level server solution from the Blackwell generation, the power supply units were no longer placed directly within the chassis housing the HPCs that consume power; instead, power supply units are separated and grouped into power shelves. In the GB200/300 systems, there are 8 power shelves sitting on the same rack as the compute trays and switch trays, each enclosing six 5.5KW power supply units.
For the upcoming Vera Rubin rack, the power supply unit will be upgraded to 18.3KW of output to comprise a power shelf of 110KW, and each power shelf will take 3U of space on the rack vs. 1U in the Blackwell generation.
Exhibit 33: Pow r d nsity for PSUs in Nvidia s rv r syst ms
Sourc : Company data, Morgan Stanl y R s arch
Challenges increasing the power density of P Us
To come up with power supply unit with higher power density, manufacturers might need to solve the following potential hurdles:
Better power semiconductors (SiC and GaN)
The biggest improvement in PSU power density comes from replacing traditional silicon power chips with newer materials such as silicon carbide (SiC) and gallium nitride (GaN). These devices waste less energy during power conversion and can operate at much higher speeds. As a result, many supporting components inside the PSU-such as transformers and inductors-can be made significantly smaller. This allows PSU manufacturers to fit more output power into the same physical size while also improving efficiency. In many ways, SiC and GaN have become the foundation for the latest generation of high density AI server power supplies.
M Asia Pacific Insight
More efficient power conversion designs
Modern PSUs use more sophisticated circuit designs, i.e., bridgeless PFC vs. conventional one, that reduce energy losses during power conversion. A conventional boost PFC includes a diode bridge and therefore incurs multiple semiconductor conduction drops. A bridgeless totem pole PFC reduces the number of devices in the active current path and is now a preferred architecture for dense server PSUs. Instead of simply converting electricity from one voltage to another, newer architectures are designed to minimize wasted energy throughout the process. Higher efficiency means less heat is generated, which directly enables higher power density. This is particularly important in AI servers, where even small efficiency improvements can translate into meaningful reductions in heat generation and cooling requirements.
Smaller and smarter magnetic components
Transformers and inductors are often among the largest components inside a PSU. A major area of innovation is reducing their size without sacrificing performance. Manufacturers are increasingly using planar magnetics, where copper traces on circuit boards replace traditional wire windings. These designs are thinner, easier to cool, and more space efficient. Some suppliers are also combining multiple magnetic functions into a single component, further reducing overall volume. As PSU power levels increase from 3 KW to 5.5 KW and beyond, shrinking magnetic components becomes one of the most important contributors to power density improvement.
Improved thermal management
As power output increases, heat becomes the primary obstacle to higher density. Even highly efficient PSUs still generate a significant amount of heat. Therefore, manufacturers are investing heavily in better cooling solutions, including optimized airflow paths, advanced heatsinks, vapor chambers, and liquid cooling technologies. The goal is to remove heat more effectively so that components can operate safely even when packed more tightly together. In many modern PSU designs, thermal engineering is just as important as electrical engineering in determining achievable power density.
igher component integration
Another way to increase power density is to reduce the amount of unused space inside the PSU. Manufacturers are integrating more functions into fewer components and using three dimensional layouts that make better use of available volume. Components are stacked, arranged vertically, or combined into integrated modules to maximize space utilization. This approach is similar to how smartphones have become more powerful without becoming larger-the same principle is increasingly being applied to server power supplies.
igher efficiency creates more thermal headroom
Efficiency improvements provide a double benefit. First, less electricity is wasted. Second, less heat is generated. For example, a 5.5 kW PSU operating at 97.5% efficiency generates roughly 30% less heat than one operating at 96.5% efficiency. While a one percentage point improvement may appear small, it can remove tens of watts of heat from the system. This allows engineers to either increase output power within the same form factor or reduce cooling requirements while maintaining existing power levels.
M Asia Pacific Insight
Reducing the size of energy storage components
Server PSUs contain capacitors that store energy and maintain power delivery during short interruptions. Historically, these capacitors occupied a significant amount of space. Newer designs use smarter control techniques that allow manufacturers to achieve the same performance with smaller capacitor banks. Reducing capacitor volume frees up valuable internal space that can be used for higher power output or additional functionality.
For example, in Infineon's 3.3 KW example, the calculated capacitance for a conventional 10ms hold up implementation was approximately 2.5 mF; allowing deeper discharge through a baby boost stage reduced the requirement to about 900 µF. The 12 KW design similarly uses a bidirectional buck boost buffer to achieve 20ms hold up at full load without the capacitor volume that a passive solution would require. The penalty is additional semiconductors, an inductor, control software and failure modes, but the net volumetric benefit can be substantial.
Advanced mechanical design
Power density is ultimately measured in watts per unit volume, making physical packaging extremely important. Manufacturers continuously optimize component placement, airflow channels, connector design, and enclosure structures to eliminate unused space. The best PSU designs are often not defined by a single breakthrough component but rather by hundreds of small mechanical optimizations that collectively improve volumetric efficiency.
Datacenter P U market size to grow at a 75% CAGR in 2025-28
Overall, we estimate the global datacenter power supply market will grow at a three year CAGR of 75% to reach US$33bn in 2028 from US$6bn in 2025, driven mainly by server shipment growth, increasing power consumption per rack, and the adoption of HVDC power racks from 2027.
Exhibit 34: Global datac nt r pow r supply mark t for cast
Sourc : Company data, Morgan Stanl y R s arch stimat s M Asia Pacific Insight
Complementary Hardware for More Resilient Power Delivery
Transient power spikes at AI servers
AI servers have a much more dynamic power profile than conventional enterprise servers because GPU utilization changes sharply throughout a workload. During large model training, thousands of GPUs typically operate in a bulk synchronous manner, and power consumption approaches the accelerator's design limit during tensor compute phases, then falls during collective communications, check pointing, data movement, or periods in which GPUs wait for slower devices to synchronize. Inference can create a similar pattern as request arrivals, batching, context length and token generation activity change rapidly.
Because the GPUs perform these transitions together, the power variation of one accelerator is multiplied across the server, rack and cluster rather than being averaged out by unrelated workloads, so the magnitude of the challenge is also rising with system density. Power spikes are therefore not simply the result of higher average consumption; they reflect the combination of higher accelerator power, more GPUs per system and increasingly synchronized workload behavior.
Exhibit 35: Transi nt pow r spik s at AI s rv rs
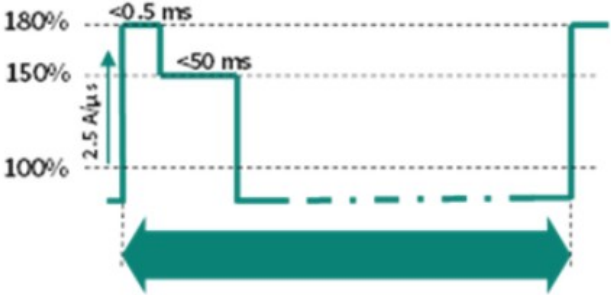
Sourc : Infin on
ystem performance and reliability potentially compromised
The key issue is that power delivery systems are designed to supply a relatively stable amount of power, while AI workloads can change power demand almost instantaneously. When the load changes faster than the power delivery system can react, a temporary mismatch occurs between power demanded by the GPUs and power supplied by the PSU, creating electrical instability throughout the server.
M Asia Pacific Insight
udden increases in GPU demand lead to voltage drops
When GPUs transition from a low utilization state (communication, synchronization, checkpointing, etc.) to a full compute state, their current demand can increase within microseconds. However, the PSU cannot instantly increase its output because its control loop requires time to detect the load change and adjust power conversion.
During this response period, the additional energy must come from capacitors located throughout the power chain. As these capacitors discharge, the voltage on the DC bus begins to fall, creating voltage drop.
If the drop becomes sufficiently large, several operational issues can occur:
- GPU throttling: The GPU reduces clock speed or performance to remain within safe operating limits.
- Computation errors: Voltage instability can affect timing margins in high speed processors and memory.
- Unexpected resets or shutdowns: Protection circuits may trigger if voltage falls below specified thresholds.
- Training interruption: Large AI training jobs running across thousands of GPUs may fail if even a small number of nodes experience instability.
In a large AI cluster, a single server failure can force the entire training job to restart from the latest checkpoint, resulting in significant productivity loss.
udden decreases in GPU demand results in voltage spike
The opposite problem occurs when GPUs rapidly reduce power consumption.
For example, after a compute intensive phase, GPUs may enter a communication phase where power consumption drops sharply. The PSU, however, is still delivering power based on the previous load condition. The excess energy has nowhere to go immediately and accumulates in the DC bus, causing a temporary voltage spike.
This can create:
- Overvoltage stress on components
- Protection circuit activation
- Accelerated degradation of capacitors and voltage regulators
- Higher risk of component failure over time
Although individual spikes may be small, AI servers can experience these transitions continuously during training, causing repeated stress throughout the power delivery chain.
Excessive current surges throughout the system
Power spikes are not only a voltage problem-they also create large current excursions.
A 1KW increase in power demand at 12V requires roughly 83A of additional current. In modern AI servers, where multiple GPUs can change utilization simultaneously, current swings can reach hundreds of amperes within a very short period.
M Asia Pacific Insight
These current surges lead to:
- Higher conductor losses
- Increased connector heating
- Greater stress on voltage regulator modules (VRMs)
- Larger thermal fluctuations in power components
- As GPU power ratings rise to over 1KW, the magnitude of these transient currents becomes increasingly difficult to manage.
Thermal cycling and reliability degradation
Perhaps the most overlooked issue is the impact on long term reliability.
Every power excursion creates a corresponding temperature excursion. When power rises, semiconductor junction temperatures increase; when power falls, temperatures decrease. This repeated heating and cooling cycle occurs thousands or even millions of times over a system's lifetime.
The result is accelerated wear on:
- Electrolytic capacitors
- Power MOSFETs
- Solder joints
- PCB interconnects
- Connectors and busbars
Consequently, even if average power remains within specification, transient power spikes can shorten component lifetime and increase failure rates.
Infrastructure overdesign and lower efficiency
To prevent instability, operators often provision the power infrastructure for the worst case peak rather than average consumption.
For example:
- A rack averaging 80KW may need infrastructure sized for 120 140KW transient peaks.
- PSUs must be oversized to accommodate short duration excursions.
- UPS systems must reserve capacity for sudden load increases.
- Cooling systems must handle peak thermal output.
This creates a significant amount of stranded capacity, where expensive electrical and cooling infrastructure remains underutilized most of the time. Furthermore, PSUs and UPS systems typically operate most efficiently near their optimal loading point; oversized systems therefore tend to operate at lower efficiency, increasing operating costs.
M Asia Pacific Insight
Conventional power delivery systems not designed to deal with power volatility
In the conventional power delivery architecture, the UPS protects the data hall against utility outages and power quality disturbances, while the PSU converts upstream power into the tightly regulated DC output required by the server. Both remain essential in the modern AI server clusters, but neither was originally optimized to absorb large, repetitive and synchronized AI load steps economically.
The PSU can use its internal capacitors to cover the initial transient, but capacitor volume is limited; once that stored energy is depleted, the PSU control loop must raise input current, potentially producing current overshoot and transferring the disturbance upstream.
The UPS is located farther from the accelerator and sees the aggregated load of many PSUs. A transient originating near the GPU can therefore occur on microsecond to millisecond timescales-including permitted GPU electrical design power excursions around 50 ms-before the complete upstream conversion chain can rebalance power.
This is a response time and location mismatch, rather than evidence that UPSs or PSUs are fundamentally incapable of supporting AI. New AI tolerant UPS platforms are being designed for faster and larger load steps, but many legacy systems may still experience voltage excursions, nuisance alarms, lower partial load efficiency or unwanted bypass transfers under steep synchronized loads.
To complement the conventional power delivery architecture, more AI server clusters are adopting BBUs or CBUs to shave peak loads and mitigate the above mentioned issues.
Exhibit 36: Conc pt of p ak shaving for AI s rv r pow r loads
Sourc : Nvidia
Battery backup units seeing increasing importance
What's a BBU?
A BBU is an integrated battery, power conversion and control system that supplies DC power to server loads when the normal power source is interrupted or temporarily insufficient. In an OCP style rack, the BBU modules are housed in a dedicated shelf located near the PSU power shelf and connect directly to the common DC busbar. Under normal conditions, the PSUs power the servers and maintain the BBU's charge; when the bus M Asia Pacific Insight voltage falls below a programmed threshold, the BBU's bidirectional converter changes from charging or standby into discharge mode and supports the rack. Analog Devices' ORV3 reference design detects a bus voltage below 48.5V for more than 2ms and is required to ramp to full support within another 2ms, while maintaining the bus above the specified minimum voltage.
Key components within a BBU
- Battery-cell pack: The cells store the energy used during discharge. Lithium ion cylindrical cells are commonly arranged in series and parallel to obtain the required voltage, power and runtime; the ORV3 reference module uses an interchangeable 11 series, 6 parallel battery pack. The cell must provide not only sufficient energy but also high discharge power, low internal resistance and predictable performance over its qualified life.
- Bidirectional DC/DC converter: The converter controls energy flow between the battery pack and the rack DC bus. It steps voltage in the appropriate direction during charging and discharging and regulates the output so that the battery's changing voltage does not destabilize the server bus. Multiphase designs divide the large current across several parallel power stages; TI's 12 KW design uses six 2 KW phases and reports peak efficiency above 99%, including above 99.5% when battery and bus voltages are close.
- Battery management y tem: The BMS measures individual cell voltages, current and temperature, balances cells and estimates state of charge and state of health. It also protects against overcharge, excessive discharge, overheating and short circuit. Accurate state of health information is important because the operator must know whether an apparently charged BBU can still deliver its required rack power and runtime after years of standby operation and periodic discharge events.
- Power-path and protection circuitry: Fuses, current sensors, disconnect switches, protection MOSFETs and hot swap circuits isolate faults and prevent uncontrolled current flow. Typical protections include overvoltage, undervoltage, overcurrent and overtemperature shutdown. Hot swap capability allows a failed or end of life module to be replaced without intentionally shutting down the entire rack, while active current sharing ensures that parallel BBU modules carry an appropriate portion of the load.
- Control, monitoring and communication : A module controller manages operating modes, converter control, fault handling, diagnostics and communication with the BMS and rack controller. Interfaces such as PMBus, Modbus, CAN, RS 485 or Ethernet can expose battery voltage, current, temperature, state of charge, state of health, fan speed and fault status to data center management systems. Analog Devices' reference platform uses separate controllers for battery monitoring and overall BBU logic, communications and housekeeping.
- Thermal-management y tem: Fans, temperature sensors, airflow paths and mechanical spacing around cells remove heat during high rate charging and discharging. Thermal management is both a performance and a safety requirement: excessive temperature accelerates battery ageing and can restrict available discharge power. Analog Devices' ORV3 design therefore incorporates fan control, airflow simulation and cell to cell spacing, while Murata's commercial 3 KW BBU includes internal forced air cooling and overtemperature protection.
M Asia Pacific Insight
- Shelf, backplane and mechanical integration: The shelf distributes DC power and communications across several modules and provides retention, service access and cooling. Modularity allows power and runtime to be scaled by adding units and enables redundancy such as the ORV3 5+1 configuration. Murata specifies a 2U, hot swappable 3 KW module, while Eaton's 19 inch BBU shelf accepts six 2.75 kW batteries and scales runtime according to the application requirement
Exhibit 38: BBU diagram
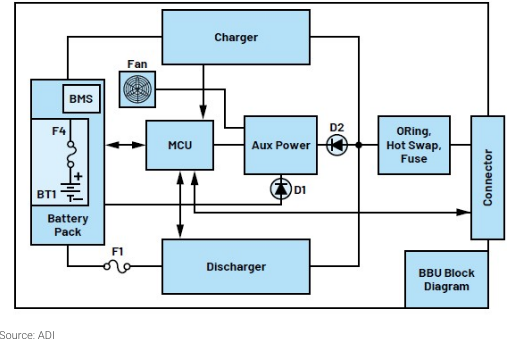
Exhibit 37: BBU
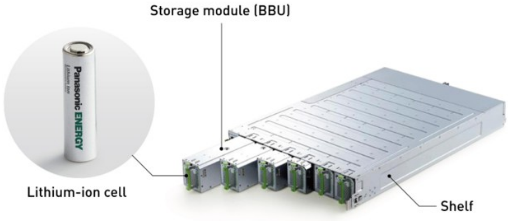
Sourc : Panasonic
Sourc : ADI
Key functions of BBUs
Backup power and outage ride-through
The BBU's fundamental function is to maintain rack operation during a brief loss of upstream power. The ride through interval gives the data center time to restore the primary source, transfer to another source, preserve critical data, migrate workloads or perform an orderly shutdown. Rather than attempting long duration operation, rack BBUs are generally optimized for high power over a relatively short period; the ORV3 example specifies 3KW per module for four minutes, and Murata guarantees a 240 second hold up period at full rated load under stated age and temperature conditions.
For AI systems, this protection is particularly valuable because a rack interruption can affect a synchronized workload extending well beyond the failed server. Local ride through prevents a momentary upstream disturbance from immediately removing GPU, CPU, networking and storage power from the rack. Infineon consequently describes the server BBU as an integrated backup supply intended to prevent data loss and maintain AI workloads during outages or grid failures.
Peak shaving and load smoothing
A BBU can be operated as an active energy buffer. as it charges during lower demand periods and discharges when server consumption temporarily exceeds a defined rack or PSU limit. This allows a relatively stable upstream power source to support a more volatile downstream AI workload. The economic benefit is that PSU, UPS and electrical capacity can be designed closer to sustained demand rather than every short theoretical peak, although the achievable benefit depends on the frequency, duration and predictability of those peaks.
M Asia Pacific Insight
The important limitation is battery cycling. A BBU designed primarily for emergency standby may not be optimized for continuous, repetitive peak shaving, so frequent cycling affects heat generation, state of charge, usable life and replacement schedules. Very short and highly repetitive transients may therefore be better supported by a CBU or hybrid battery capacitor system, leaving the battery to cover longer events. Renesas correspondingly distinguishes distributed BBUs from hybrid systems that combine batteries with capacitors for fast transient response and longer duration backup.
Power stabilization, redundancy and fault isolation
A rack BBU adds another independent source to the local power path. If a power shelf, upstream feed or AC source is interrupted, the BBU can sustain the rack while the fault is isolated or another source assumes the load. A modular shelf further improves resilience because one BBU failure need not remove the entire backup function; the remaining modules can continue operating within the available redundancy and power limits.
Distributed deployment also narrows the fault domain. A defective rack BBU affects a much smaller set of compute equipment than a failure within a centralized backup system serving a large room or data hall. The tradeoff is a much larger population of batteries, converters, controllers and fans that must be monitored, tested and eventually replaced. Digital state of health monitoring, fault reporting and hot swappable construction are therefore central to the operating model rather than optional features.
BBUs vs. UP s
While some of the functions that BBUs offer look similar to what traditional UPSs can do, we think BBUs and UPSs should be viewed as complementary rather than substitutive technologies, as they address different challenges within the datacenter power architecture.
A UPS is designed to provide facility or row level protection against utility outages, voltage sags, surges, and other power quality disturbances, ensuring continuous AC power delivery to a broad range of IT equipment. In contrast, a BBU operates much closer to the AI workload, supplying DC power directly at the rack level and responding to localized power events that occur faster than the upstream power infrastructure can efficiently manage.
As AI racks become denser and more power intensive, the UPS continues to serve as the first line of defense against external power disruptions, while the BBU acts as a second layer of protection by stabilizing the rack DC bus, supporting transient load spikes, and providing short duration ride through capability. Together, they create a hierarchical power protection architecture in which the UPS ensures overall system availability and power quality, while the BBU enhances rack level resilience and power delivery performance. Rather than replacing the UPS, BBUs help reduce the burden on centralized backup systems, improve power utilization efficiency, and enable the reliable operation of next generation AI infrastructure with increasingly dynamic power profiles M Asia Pacific Insight
Exhibit 39: Comparison of BBUs and UPSs
| Dimension | BBU | UPS |
|---|---|---|
| Location | Inside the server rack, in a BBU shelf, or in an adjacent rack/sidecar close to the compute | Typically deployed at equipment room, row or facility level and protects multiple racks or other critical loads |
| Power path | Usually DC-coupled to the rack bus through a bidirectional DC/DC converter | Takes AC input and delivers AC output; the server PSU subsequently converts AC again for the server |
| Primary objective | Short rack-local ride-through, DC-bus support, modular redundancy and-when designed for it-transient or peak-load assistance | Broad power conditioning and uninterrupted AC supply during utility sags, surges, frequency disturbances and outages |
| Response | Monitors the local bus and can inject power within a few milliseconds; the cited ORV3 reference requires full support within 2ms after a qualifying 2ms event | An online double-conversion UPS already powers the load through its inverter and therefore has zero transfer time between utility and battery operation |
| Runtime | Generally optimized for short-duration, high-power support; OCP's reference example is four minutes at full load | Runtime varies widely with battery-bank sizing and system design; its broader function is to maintain protected AC loads until another source or operating response becomes available |
| Scalability | Added rack-by-rack or module-by-module; power and runtime can be matched to each compute deployment | Scaled centrally in larger KW blocks and requires capacity planning for the aggregate protected load |
| Fault domain | A module or shelf fault is normally localized to one rack or a limited group of racks | A centralized system protects a much broader load domain, so its redundancy and maintenance design are correspondingly critical |
Sourc : Morgan Stanl y R s arch
Capacitor backup unit (CBU) another complementary power device
What's a CBU?
A CBU is an integrated energy storage subsystem positioned close to the AI load, typically in a dedicated rack shelf, capacitor tray or adjacent power sidecar, and connected to the server rack's DC power path. Its principal storage medium may be an electric double layer capacitor (EDLC or supercapacitor), lithium ion capacitor (LIC), or a bank of high capacitance electrolytic capacitors, depending on the required response time, energy duration, footprint and cost. Dedicated CBU products increasingly use EDLCs or LICs because their low internal resistance supports rapid, repetitive charge and discharge.
The CBU sits electrically alongside the PSU. Under steady state conditions, the PSU supplies the AI rack and maintains the CBU at its target state of charge. When GPU demand temporarily exceeds the desired PSU output, the CBU discharges through a controlled power converter into the DC bus; when GPU demand falls, the converter reverses direction and recharges the capacitors at a controlled rate. This prevents the full GPU load step from passing through the PSU and upstream equipment. Infineon notes that a separate CBU must be compatible with, and potentially communicate with, the PSU shelves to coordinate rack power.
An alternative to deploying a standalone CBU shelf is to integrate the energy storage capacitors directly into the power shelf, effectively combining power conversion and transient energy buffering within the same subsystem. NVIDIA's GB300 NVL72 architecture is a good example: its enhanced power shelves incorporate a substantial capacitor bank alongside the PSU modules, with NVIDIA allocating approximately 65 joules of stored energy per GPU.
NVIDIA reported that this approach reduced peak upstream power demand by roughly 30% in a measured Megatron LLM workload. Compared with a separate CBU, integrating capacitors into the power shelf can save valuable rack space, shorten the electrical path between the energy buffer and the load, and simplify coordination between the PSU and M Asia Pacific Insight energy storage system, since charging, discharging, and PSU output can be managed as one integrated power architecture. The trade off is that capacitor capacity becomes more tightly coupled to the power shelf design, potentially reducing flexibility in independently scaling or servicing the energy storage system. Nevertheless, as AI racks become increasingly power dense, integrating transient energy storage directly into the power shelf could become an attractive alternative to standalone CBUs, particularly where rack space and fast transient response are key design priorities.
Exhibit 41: GB300 pow r sh lf with int grat d capacitors
Exhibit 40: CBU
Sourc : Panasonic Sourc : Nvidia
Key components within a CBU
- Capacitor bank: The storage section contains many capacitor cells arranged in series to reach the required voltage and in parallel to provide the required power and energy. Individual EDLC cells commonly operate at only a few volts, so high voltage systems require long series strings; Abracon cites approximately 2.7 V as a typical supercapacitor cell rating, while TI's NVIDIA oriented reference architecture demonstrates an 800 V CBU using EDLC cells. LICs can provide more stored energy than conventional EDLCs, while EDLCs generally emphasize lower resistance, high peak power and very high cycling endurance. Delta, for example, offers a power capacitance shelf using fast charge/discharge LICs, rated to provide 15 seconds of hold up at 20 KW.
- Cell-balancing y tem: Because cell capacitance, leakage current and internal resistance vary across a series string, the voltage does not divide perfectly equally. A balancing circuit prevents an individual cell from exceeding its rated voltage during charging or being reverse biased during deep discharge. Passive balancing uses resistors to bleed excess charge, while active approaches use MOSFETs, amplifiers or switched converters to redistribute energy more efficiently; the design tradeoff is between cost, balancing speed, component count and standby loss.
- Bidirectional DC/DC converter: This is the active interface between the capacitor bank and the rack DC bus. During a GPU power spike, it converts the capacitor's changing voltage into a regulated bus contribution; during lower demand, it reverses power flow to recharge the bank. The converter also allows more of the capacitors' stored energy to be used than would be possible with a direct connection, because capacitor voltage declines materially during discharge.
M Asia Pacific Insight
Infineon specifically identifies a capacitor bank plus bidirectional converter as the main CBU structure, while Skeleton Technologies notes that converter based integration provides greater energy utilization and more precise power flow control than a direct bus connection.
- Controller and management oftware: The controller determines when the CBU should charge, remain idle or discharge, based on bus voltage, PSU output, rack power limits and capacitor state. It may also calculate state of health, manage balancing, regulate recharge current and coordinate multiple CBU modules.
- Protection and witching: A high power capacitor bank can release very large fault current, so fuses, contactors, pre charge circuits and overvoltage, overcurrent and overtemperature protection remain essential. Pre charge limits inrush current when the CBU is connected to the DC bus, while contactors or solid state switches isolate the bank during a fault or service event. Skeleton's reference system integrates switchgear, fuse fault detection, pre charge/discharge contactors and protection against high current and overheating events; industry discussions also highlight the need for faster DC fault isolation as CBU voltage rises.
- Monitoring and communication : Voltage, current, temperature, equivalent series resistance and state of health measurements allow operators to identify degradation before the CBU can no longer meet its specified peak power requirement. Panasonic emphasizes voltage, temperature and ESR monitoring for predictive maintenance, while Skeleton provides single cell voltage sensing, multiple temperature sensors and communication bus to its master controller.
- Thermal and mechanical y tem: Although supercapacitors are efficient, high repetitive current produces resistive heating, particularly in cells, busbars, converters and connectors. The shelf therefore requires designed airflow, temperature sensing and, at higher power levels, potentially liquid cooling. Skeleton's cabinet uses controlled fan cooling and also offers liquid cooled configurations, while the Open Compute Project presentation from Panasonic identifies lower resistance capacitors and liquid cooling as development priorities for future higher output CBUs
Main functions of CBU
Transient power stabilization
One of the most fundamental roles of a CBU is to stabilize the rack DC power bus when GPU power consumption changes very rapidly. AI workloads frequently alternate between compute intensive phases and lower power communication, synchronization, or idle phases. Because many GPUs operate in parallel, these transitions can create very large changes in rack power within milliseconds.
When GPU demand suddenly increases, the PSU cannot instantaneously increase its output. The CBU therefore discharges stored energy into the DC bus during this short response gap, helping prevent voltage drop and excessive current excursions. Conversely, when GPU demand suddenly falls, the CBU can absorb excess energy while the PSU reduces its output, helping limit voltage overshoot.
The key objective here is power quality and system stability, rather than reducing the overall power capacity required by the rack. In other words, the CBU acts as a fast M Asia Pacific Insight electrical shock absorber between the highly dynamic GPU load and the slower PSU. This becomes increasingly important as AI racks move above 100 KW and synchronized GPU workloads create larger absolute power swings.
Peak shaving
Another major function is peak shaving, whose objective is to limit the maximum power that the PSU and upstream infrastructure need to supply.
The benefit is potentially significant because the PSU, connectors, protection devices, and portions of the upstream power infrastructure no longer need to be oversized solely for short duration GPU peaks. It can also allow PSUs to operate closer to their optimal loading range, improving utilization and potentially efficiency.
Short duration ride-through
The third function is ride through, where the CBU temporarily powers the rack when the normal power source is interrupted altogether. This is fundamentally different from the first two functions because the issue is no longer a mismatch between GPU demand and PSU response-the upstream power source itself has temporarily disappeared.
A sufficiently sized CBU can maintain the DC bus during events such as a brief AC interruption, PSU switchover, source transfer event, or temporary power shelf failure. Depending on the amount and type of capacitance installed, this support can range from milliseconds to several seconds. For example, some LIC based capacitance shelves are designed to provide multi second hold up at high rack power.
However, ride through is generally a secondary function for a CBU. Capacitors have high power density but relatively low energy density, meaning they can deliver a large amount of power very quickly but cannot economically sustain that power for long periods. As the required backup duration increases from seconds toward minutes, a battery based BBU generally becomes more suitable.
Exhibit 42: Capacitors h lp smooth pow r d liv ry
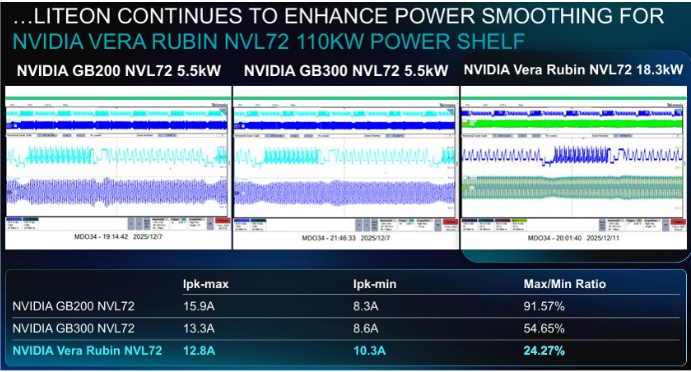
Sourc : Lit On
M Asia Pacific Insight
CBUs vs. BBUs
The two technologies should consequently be regarded as complementary rather than directly substitutive. A CBU handles the high power, short duration and high cycle portion of the load profile, while a BBU supplies the larger amount of energy required when the upstream source remains unavailable. Some describe BBUs and CBUs as coexisting in the same power sidecar, and hybrid architectures can allocate fast transients to capacitors while preserving battery charge and cycle life for longer outages.
The CBU's major advantages are rapid bidirectional response, long cycle life, high efficiency and the ability to absorb repeated GPU peaks without the same electrochemical wear mechanism as a conventional battery. It can also recharge quickly between workload cycles and may require less routine replacement. However, the CBU has materially lower energy density, its voltage falls continuously during discharge, and large banks require balancing, high current protection, cooling and valuable rack or sidecar space.
Exhibit 43: Comparison of CBUs and BBUs
| Dimension | CBU | BBU |
|---|---|---|
| Primary storage medium | EDLC supercapacitors, LICs or high-capacitance | Typically lithium-ion battery cells managed by a BMS |
| Primary strength | High power, fast charge/discharge and frequent | Higher stored energy and longer sustained |
| Main function | Transient smoothing, peak shaving, voltage | Outage backup, source-transfer bridging and orderly workload |
| Response profile | Well suited to millisecond-class load support and | Fast switchover, but generally optimized for sustained support rather |
| Typical duration | Milliseconds to seconds; selected systems can extend toward tens of seconds or more | Commonly tens of seconds to several minutes, depending on battery and rack design |
| Power versus energy density | Higher power capability but lower energy storage per unit volume than a battery | Higher energy density, making it more economical for longer events |
| Cycle life | Eaton specifies more than one million cycles and up to 20 years for certain supercapacitor modules | Battery life is more sensitive to depth of discharge, temperature and repeated cycling; BMS supervision is therefore essential. |
| State management | Requires cell balancing, voltage/temperature monitoring and state-of-health tracking, but does not use a conventional battery fuel | Requires BMS functions including charge control, state of charge, state of health and cell protection |
| Best-fit use case | Repetitive AI power spikes, inrush events, PSU load leveling and bus stabilization | Power continuity through outages, brownouts or generator/source- transfer intervals |
Sourc : Morgan Stanl y R s arch
M Asia Pacific Insight
HVDC Emerging, with SST in the Pipeline
HVDC coming along with the increasing power consumption of AI clusters
Why do we need HVDC?
Low voltage turns higher rack power into an extreme-current problem
The fundamental relationship is that at a given rack load, increasing the bulk distribution voltage from 54 V to 800 V reduces current by approximately 14.8 times. A balanced ±400 V architecture also presents 800 V between its +400 V and -400 V conductors, so its bulk transfer current is broadly equivalent to a 0-800 V architecture.
This current differential has an outsized mechanical consequence. For the same conductor resistance, I²R loss at 54V would theoretically be approximately 219 times that at 800 V, though real systems avoid this level of loss by adding copper, parallel conductors and cooling. The result is not a 219 fold difference in actual operating loss, but a trade off in which low voltage designs consume increasing amounts of busbar cross section, connector area, rack volume and cooling capacity to remain within voltage drop and temperature limits.
Exhibit 44: Transmission curr nt for diff r nt pow r scal s: 54V vs 800V
Sourc : D lta
Copper, connectors and thermal management become system constraints
At several thousand amperes, distribution cannot rely on a single ordinary conductor or connector. Designers must use broad laminated busbars, multiple parallel contacts, tightly controlled joint resistance and temperature monitoring. A small increase in contact resistance produces disproportionately high heat at these currents, raising the risk of hot spots, connector ageing and nuisance protection events. OCP's 100KW HVDC to LVDC shelf illustrates where the current problem moves: only two 62.5 A HVDC inputs are required on the ±400V side, while the 49-50V output approaches 2,000A and therefore uses a substantial bolted output connection with dedicated thermistors.
M Asia Pacific Insight
The same issue appears in power shelf packaging. Delta notes that a typical AI rack may already allocate roughly three quarters of its volume to servers, leaving insufficient room for additional power shelves, BBUs or supercapacitor shelves as power rises. Moving AC/ DC conversion, protection and storage into an adjacent power rack therefore releases compute space and separates the thermal design of power electronics from that of GPUs. Microsoft's Mt Diablo rationale similarly states that disaggregated power can enable up to 35% more accelerators in the IT rack and allows power shelf count to be sized independently for each workload configuration
Exhibit 45: Not nough room for pow r d vic s on th traditional AI s rv r rack
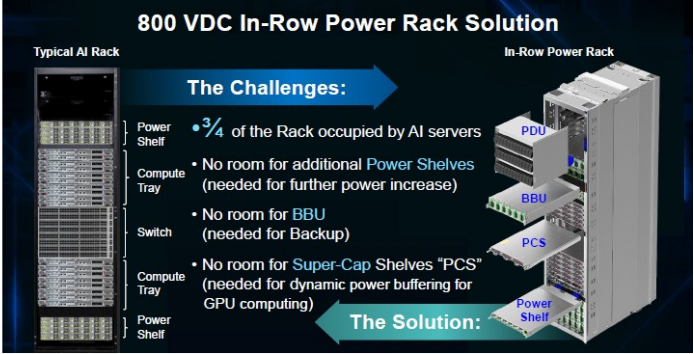
Sourc : D lta
VDC enables denser, fewer and more efficient power stages
As AI rack power scales from today's GB200/GB300 systems to Vera Rubin and future multi hundred kilowatt racks, power distribution efficiency becomes increasingly important. Our checks indicate that a conventional 480VAC architecture delivers an end to end electrical efficiency of roughly 93%, while an 800VDC architecture improves efficiency to about 95% by eliminating one power conversion stage and simplifying the power path from grid to rack.
The higher voltage 800VDC distribution also reduces current levels for the same power load, lowering resistive (I²R) losses in cables and distribution equipment and enabling more efficient delivery to increasingly power dense AI racks.
While a 2ppts of efficiency improvement may appear modest, the savings become substantial at hyperscale AI data center deployments. Delta's example shows that for a 100MW IT load, improving facility efficiency from 93% to 95% reduces annual energy consumption by approximately 19,800MWh, translating into roughly US$1.6 million of annual electricity cost savings assuming a power price of US$0.08/kWh. At a 1GW AI campus, the savings scale to nearly US$16 million per year, and at emerging multi gigawatt AI factory deployments, the annual benefit can exceed US$100 million. Consequently, the transition from conventional AC distribution and 54VDC rack power architectures toward 800VDC distribution is not only a technical necessity for supporting future 500kW to 1MW AI racks, but also a compelling economic proposition that lowers operating expenses and improves total cost of ownership through reduced energy losses and simplified electrical infrastructure.
M Asia Pacific Insight
Exhibit 46: B tt r pow r ffici ncy for 800VDC archit ctur
Exhibit 47: B tt r ffici ncy l ads to cost savings
Sourc : D lta Sourc : D lta
What's the deployment roadmap for HVDC?
The deployment roadmap for 800VDC is best understood as a multi stage evolution rather than a single step transition. Both Nvidia and major hyperscalers recognize that existing 480VAC infrastructure cannot efficiently support the rapid increase in rack power. As rack densities increase, conventional power whips, busbars, connectors, and PSU architectures increasingly become bottlenecks, driving the need for higher voltage distribution
The first phase of deployment focuses on introducing 800VDC power racks within existing AC based data centers. In this architecture, the facility remains largely unchanged, but a dedicated power rack converts 415 480VAC into 800VDC before distributing power locally to AI racks. This approach minimizes disruption to existing infrastructure while allowing operators to deploy Vera Rubin class systems that exceed the practical limits of traditional power shelves. Nvidia refers to this as the row level power rack architecture, which serves as the industry's bridge solution between legacy AC facilities and future native DC environments.
Exhibit 48: Phas I - 800VDC pow r rack
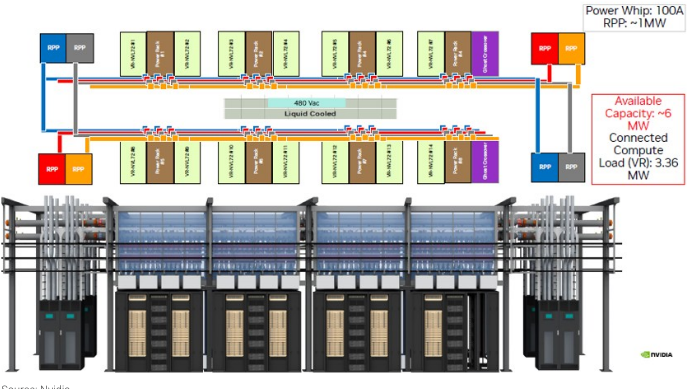
Sourc : Nvidia M Asia Pacific Insight The second phase expands 800VDC beyond individual rows into data hall level power centers. Instead of deploying a dedicated power rack for every few compute cabinets, centralized rectifier or power center systems distribute 800VDC through DC busways across an entire hall. Nvidia's roadmap identifies 1.6 2MW power centers and 1250A DC busway architectures as the next step, improving power density while reducing equipment duplication. This stage also aligns well with the deployment strategies being discussed by hyperscalers and the OCP community because it preserves existing medium voltage and low voltage infrastructure while moving a significant portion of distribution into DC
Exhibit 49: Phas II - 800VDC pow r c nt r
Sourc : Nvidia
The third phase is the transition toward facility wide 800VDC distribution, where AC is converted to DC near the utility entrance or medium voltage substation and distributed throughout the data center via high capacity DC switchboards and busways. Nvidia describes this as the DC power block architecture, utilizing approximately 4.8MW power blocks, 6000A DC busways, and integrated redundancy schemes. At this stage, the architecture begins to resemble an "AI factory," where power distribution is simplified, energy storage can be integrated directly onto the DC bus, and multiple megawatts of compute capacity can be deployed as modular building blocks
M Asia Pacific Insight
Exhibit 50: Phas III - pow r block
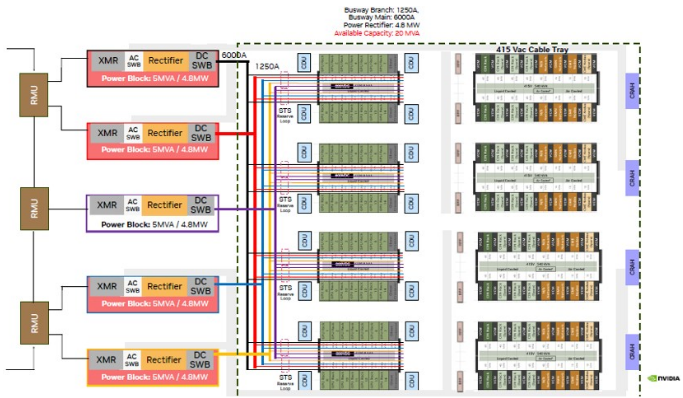
Sourc : Nvidia
The final stage is the emergence of native 800VDC compute racks, which Nvidia identifies as the long term destination. Today, even in 800VDC deployments, power is generally stepped down to 54V before entering the servers. Future systems, however, are expected to accept 800VDC directly within the rack and potentially at the server level, eliminating another conversion stage and further reducing power losses. Nvidia's public roadmap shows a progression from current 54V architectures, to 800VDC fed PSUs, and ultimately to 1MW class native 800VDC racks capable of supporting next generation AI accelerators
Exhibit 51: 800VDC nativ s rv r racks
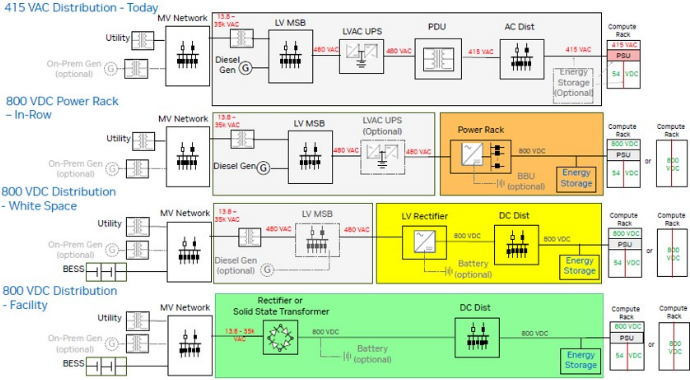
Sourc : Nvidia
In sum, deployment is likely to occur gradually because the ecosystem remains under development. NVIDIA notes that several enabling technologies-including DC protection devices, busways, connectors, grounding standards, arc flash modeling, and solid state transformers- are still undergoing certification and standardization. The roadmap presented by NVIDIA suggests a phased commercialization timeline, with 800VDC power racks reaching deployment readiness in 2026, hall level power centers in 2027, and facility scale DC power blocks becoming deployment ready around 2028. Industry
M Asia Pacific Insight
collaboration among NVIDIA, Microsoft, Google, and OCP participants is focused on ensuring interoperability and regulatory acceptance before broader hyperscale adoption.
Exhibit 52: HVDC d ploym nt roadmap
Sourc : Nvidia
800VDC represents 4-5x dollar content vs. in-rack power supply architecture
The 800VDC power rack BOM is primarily driven by the PSU, which accounts for 50-55% of the total cost, followed by the BBU at 25-30%, with other components comprising the remaining 15-20%. This cost structure reflects the broader functionality integrated into an HVDC power rack, combining power conversion, backup power and supporting components within a centralized architecture.
For power supply players, one of the most implications is that an HVDC power rack carries around 4-5x higher dollar content per watt compared with a conventional in rack PSU solution, since the former integrates more components into a robust system and power supply players usually ship the entire rack instead of just the components.
Exhibit 53: BOM cost br akdown for an 800VDC pow r rack
Exhibit 54: High r dollar cont nt for HVDC pow r racks
Sourc : Morgan Stanl y R s arch
Sourc : Morgan Stanl y R s arch
M Asia Pacific Insight
800VDC vs. ±400VDC?
The debate between ±400VDC and 800VDC centers on balancing near term practicality against long term scalability. While both architectures deliver an identical 800V differential voltage and therefore achieve similar reductions in current, copper loss, and cable size versus traditional 54V rack power systems, they differ significantly in implementation.
Under a ±400VDC architecture, each conductor operates at only 400V relative to ground, resulting in less stringent insulation, creepage, clearance, and protection requirements. This makes the architecture easier to deploy, maintain, and certify, which explains why many hyperscalers and OCP members view ±400VDC as an attractive migration path toward high density AI racks.
By contrast, NVIDIA and several power infrastructure vendors are increasingly advocating for a single bus 800VDC architecture because it simplifies overall power distribution, reduces conversion stages, and is better suited for future 500kW to 1MW rack deployments.
We believe that ±400VDC appears well positioned as a near term bridge architecture due to its lower deployment risk and more mature ecosystem, whereas 800VDC is increasingly viewed as the long term end state architecture for AI factories as rack power scales toward the megawatt era.
Exhibit 55: Comparison of 800VDC and ±400VDC
| Metric | ±400VDC | 800VDC |
|---|---|---|
| Voltage to ground | 400V relative to ground | 800V relative to ground |
| Voltage differential | 800V | 800V |
| Power distribution efficiency | High | Slightly higher |
| Scalability | Good | Excellent |
| Insulation requirements | Lower | Higher |
| Maintenance safety | Better | More challenging |
| System architecture simplicity | Dual-rail system | Single-bus system |
| Grounding Complexity | More complicated | Simpler |
| Electrical footprint | Small | Smaller |
| Ability to reduce conversion stages | Moderate | Highest |
| Long-distance distribution capability | Excellent | Excellent |
| Maturity of ecosystem | Better today | Early but rapidly developing |
| Industry players | OCP, hyperscalers | Nvidia |
| Long term industry direction | Transitional architecture | Likely end-state architecture |
Sourc : Morgan Stanl y R s arch
From a component supplier perspective, the transition toward HVDC is far more important than which architecture ultimately wins, as most hardware content increases under either scenario. PSU vendors, BBU suppliers, busbar manufacturers, connector providers, power whip suppliers, magnetics vendors, and rack level DC DC converter manufacturers are largely architecture agnostic, since both ±400VDC and 800VDC require a similar shift toward high voltage power distribution, centralized power shelves, and rack level conversion.
Our understanding is that the primary exception is the power semiconductor industry, where the choice of architecture could materially influence device content and technology adoption. A ±400VDC system can often be supported using existing 650V 900V MOSFET and SiC platforms, benefiting suppliers with exposure to lower voltage power devices. By contrast, 800VDC architectures increasingly require 1200V class SiC MOSFETs, higher M Asia Pacific Insight voltage gate drivers, hot swap controllers, isolation components, and advanced protection circuitry, driving greater semiconductor content per watt and raising technology barriers.
olid state transformer potentially being the holy grail in AI datacenter power delivery
What is a solid-state transformer ?
A datacenter solid state transformer (SST) integrates power electronics to replace or augment traditional line frequency transformers, and it's typically built around three major functional stages. The first is the medium voltage AC to DC rectifier stage, which uses high voltage semiconductor switches-often silicon carbide (SiC) or gallium nitride (GaN) devices due to their superior switching speed and thermal performance-to convert incoming grid level medium voltage AC into a regulated DC bus. The second is the isolated DC DC conversion stage, usually implemented as a dual active bridge (DAB) or LLC resonant converter, which provides galvanic isolation through a high frequency transformer (operating in the kHz to tens of kHz range rather than 50/60 Hz), dramatically shrinking the magnetic core and transformer size compared to conventional units while stepping voltage down toward datacenter distribution levels. The third is the low voltage DC AC or DC DC output stage, which conditions power into the form needed by the facility-either regulated DC for direct DC bus distribution to IT racks or inverted AC for legacy PDU/UPS infrastructure. Supporting these power stages are the control and sensing subsystems (digital controllers, gate drivers, voltage/current sensors) that manage switching, fault protection, and grid synchronization; thermal management components (heat sinks, cold plates, or liquid cooling loops) to handle the concentrated losses in the semiconductor devices; and increasingly, integrated energy storage interfaces or DC microgrid ports that allow the SST to natively support battery buffering, renewable integration, and finer grained power quality control than a passive transformer ever could
A Solid State Transformer (SST) is a power electronics based transformer that replaces the traditional 50/60Hz iron core transformer with a combination of power semiconductors, control electronics, and a medium frequency transformer. Unlike conventional transformers that perform only voltage conversion, SSTs actively process power through multiple stages, enabling both AC and DC inputs/outputs, bidirectional power flow, voltage regulation, reactive power compensation, and intelligent grid control
A SST is typically built around three major functional stages:
- The first is the medium voltage AC to DC rectifier stage, which uses high voltage semiconductor switches-often silicon carbide (SiC) or gallium nitride (GaN) devices due to their superior switching speed and thermal performance-to convert incoming grid level medium voltage AC into a regulated DC bus.
- The second is the isolated DC DC conversion stage, usually implemented as a dual active bridge (DAB) or LLC resonant converter, which provides galvanic isolation through a high frequency transformer (operating in the KHz to tens of LHz range rather than 50/60 Hz), dramatically shrinking the magnetic core and transformer size compared to conventional units while stepping voltage down toward datacenter distribution levels.
- The third is the low voltage DC AC or DC DC output stage, which conditions
M Asia Pacific Insight
power into the form needed by the facility-either regulated DC for direct DC bus distribution to IT racks or inverted AC for legacy PDU/UPS infrastructure.
Supporting these power stages are the control and sensing subsystems (digital controllers, gate drivers, voltage/current sensors) that manage switching, fault protection, and grid synchronization; thermal management components (heat sinks, cold plates, or liquid cooling loops) to handle the concentrated losses in the semiconductor devices; and increasingly, integrated energy storage interfaces or DC microgrid ports that allow the SST to natively support battery buffering, renewable integration, and finer grained power quality control than a passive transformer ever could.
Exhibit 56: Solid stat vs. traditional transform rs
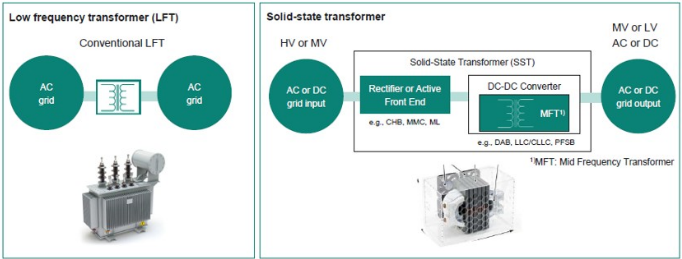
Sourc : Infin on
Why do we need Ts?
Improving efficiency in an era of gigawatt data centers
One of the strongest drivers for SST adoption is the rapid increase in AI data center power demand, which has progressed from 5 10MW facilities in the pre AI era to campuses exceeding 650MW today, with gigawatt scale facilities expected beyond 2029.
Traditional architectures use medium voltage AC distribution, followed by low frequency transformers and multiple power conversion stages before power reaches IT racks. SSTs allow facilities to convert 10 34.5KV medium voltage power directly into ±400V or 800V DC distribution networks. This reduces conversion losses and improves overall grid to chip efficiency.
The efficiency advantage could be at the order of about 2 5ppt vs, the traditional transformer architecture, but at a 1GW AI campus, this magnitude of improvement could translate into roughly 20 50MW of continuous power savings. Over the lifetime of a facility, this can result in substantial reductions in electricity cost and carbon emissions. SSTs are therefore becoming increasingly attractive for hyperscaler operators seeking lower total cost of ownership (TCO).
M Asia Pacific Insight
Exhibit 57: SST nabling mor ffici nt pow r d liv ry archit ctur
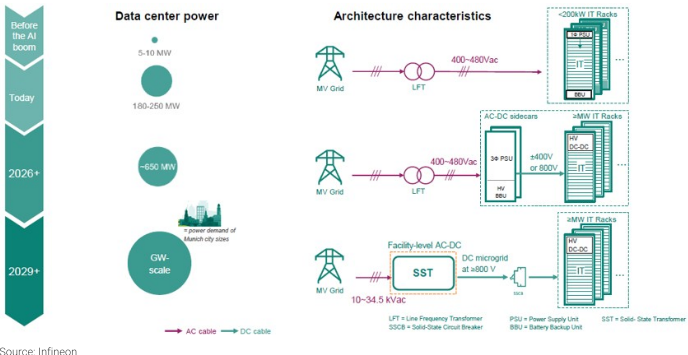
Sourc : Infin on
igher power density and smaller footprint
Because SSTs use medium frequency transformers instead of bulky 50/60Hz transformers, they can achieve significantly higher power density. Infineon indicates that SST systems can reduce both footprint and weight by at least 30% compared with conventional transformer based installations. They also accelerate site energization and facilitate modular deployment
This becomes particularly valuable in urban data centers, utility substations, EV charging hubs, and energy storage sites where space constraints directly affect project economics.
Exhibit 58: SST off rs b tt r pow r ffici ncy with at l ast 30% l ss spac /w ight
Sourc : Infin on, D lta El ctronics, Morgan Stanl y R s arch
Supporting distributed energy resources
As renewable energy penetration increases, future grids will require seamless integration of solar generation, battery storage, fuel cells, gas turbines, and other distributed energy resources.
SSTs provide intelligent power routing, bidirectional operation, and dynamic voltage control. This allows them to function as energy hubs that connect renewable generation, M Asia Pacific Insight storage, and loads through a common DC infrastructure. Such capabilities are difficult or impossible to achieve using passive transformers alone.
Improved grid intelligence
Unlike conventional transformers, SSTs can actively regulate voltage and frequency, provide reactive power compensation, support grid forming functionality, and improve overall power quality. These capabilities make SSTs an important enabler for future smart grids, microgrids, and virtual power plants.
What's the deployment status now?
Despite decades of research, SSTs remain at an early commercial deployment stage. While we started to see the SST models being unveiled by relevant suppliers and there start to be some pilot adoption, we believe that the 800VDC power rack/center/block architecture shall be deployed first, and SSTs will take more time, as more fundamental design change in the datacenter and all hardware inside will involved. We believe wider adoption probably won't happen before 2030.
Exhibit 60: SST from Eaton
Exhibit 59: SST from D lta
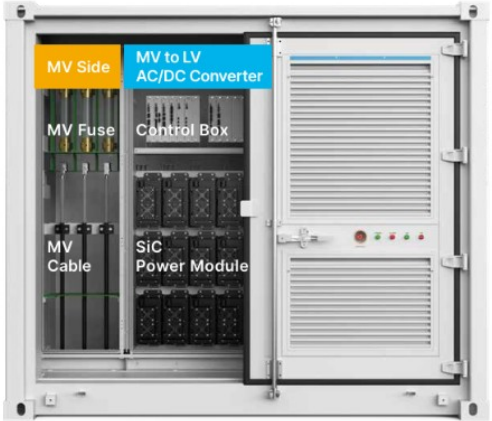
Sourc : D lta
Sourc : Eaton
According to Infineon, SST could represent a >US$1bn market opportunity by 2030, as the technology begins to replace a portion of the >US$15bn conventional transformer market, particularly in smaller power applications. While SST penetration is expected to remain relatively modest versus the overall transformer market, the opportunity is significant for relevant players in the longer term.
M Asia Pacific Insight
Exhibit 61: SST to s initial adoption in 2030
Sourc : Infin on
Key hurdles for the wider adoption of Ts
- High y tem co t remain the primary barrier: Despite their technical advantages, SSTs remain significantly more expensive than conventional transformers. Traditional transformers consist primarily of steel cores, copper windings, insulation materials, and cooling systems, all of which benefit from mature manufacturing processes and economies of scale. In contrast, SSTs require large numbers of high voltage power semiconductors, gate drivers, digital controllers, sensors, protection systems, and sophisticated thermal management solutions. The extensive use of silicon carbide (SiC) devices, which remain substantially more expensive than conventional silicon based components, further increases the overall system cost. Although SSTs can deliver efficiency gains, improved controllability, and reduced footprint, the economic benefit is often insufficient to offset the substantial upfront capital expenditure in many utility applications. Consequently, SST deployment is currently limited to applications where efficiency, power density, or system flexibility carry exceptionally high economic value, such as AI data centers, megawatt EV charging stations, and grid scale battery storage systems.
- Long term reliability ha yet to be proven: Electric utilities and large infrastructure operators place an extremely high value on reliability because transformers are expected to operate continuously for several decades with minimal maintenance. Conventional transformers routinely achieve service lifetimes exceeding 30 to 40 years and have accumulated more than a century of operating history. SSTs, however, are fundamentally different devices that incorporate thousands of semiconductor junctions, complex control electronics, communication networks, cooling systems, and software algorithms. While each individual technology may be mature, the long term reliability of the complete SST system remains largely unproven at scale. Operators therefore remain cautious about replacing a passive asset with an active power electronic system whose failure modes are more complex and less understood. For critical infrastructure such as substations, industrial facilities, or hyperscale data centers, reliability concerns often outweigh potential efficiency improvements.
M Asia Pacific Insight
- DC protection technology till evolving: One of the most significant technical challenges associated with SST deployment is fault protection, particularly in medium voltage and high voltage DC networks. Unlike AC systems, where current naturally crosses zero multiple times each cycle and facilitates fault interruption, DC currents continue flowing continuously during fault conditions. As a result, fault currents can rise extremely quickly, making them more difficult to detect and interrupt safely. Future SST based power architectures therefore require advanced protection devices such as solid state circuit breakers (SSCBs), which can react far faster than conventional mechanical breakers. However, DC protection technologies are still evolving, and there is currently no universally accepted approach equivalent to the mature protection schemes available in AC grids. The absence of standardized protection architectures increases deployment risk and remains one of the key obstacles to the wider adoption of SST based DC distribution systems.
- Sy tem complexity create engineering, qualification and maintenance challenge : Compared with traditional transformers, SSTs are considerably more complex systems that require the integration of multiple high performance subsystems. A complete SST includes medium voltage power converters, isolated DC/DC stages, high frequency transformers, semiconductor modules, digital controllers, communication interfaces, and advanced protection mechanisms. As voltage and power levels increase, the number of converter modules and semiconductor devices required can rise significantly. Although the introduction of higher voltage SiC devices can reduce subsystem count and simplify design, SST architectures remain substantially more complicated than conventional transformers. This complexity increases development costs, certification requirements, maintenance needs, and operational risks, all of which slow adoption among traditionally conservative utility customers.
- Indu try tandard and eco y tem are till developing: The transformer industry benefits from decades of established standards, testing procedures, maintenance practices, and supply chain infrastructure. SSTs, by comparison, represent an emerging technology with limited deployment history and evolving standards. Many utilities remain uncertain regarding qualification procedures, maintenance requirements, spare parts strategies, and long term asset management. Furthermore, widespread SST adoption will require parallel development of supporting technologies such as DC protection systems, DC switchgear, energy management software, and medium voltage DC distribution networks. Until the broader ecosystem matures, many customers will continue to view SSTs as a promising but relatively high risk alternative to proven transformer technologies.
M Asia Pacific Insight
Fuel Cells for Better Flexibility and Resilience
What are fuel cells?
Fuel cells are electrochemical energy conversion devices that generate electricity by combining hydrogen and oxygen without combustion. Unlike conventional power generation technologies, which convert fuel into heat and then into electricity through multiple intermediate steps, fuel cells produce electricity directly through an electrochemical reaction, resulting in higher efficiency and significantly lower emissions.
When powered by hydrogen, the primary byproducts are water and heat, making fuel cells one of the cleanest forms of power generation available today.
Fuel cells can be deployed across a wide range of applications, including passenger vehicles, heavy duty trucks, buses, trains, ships, stationary power generation, backup power systems, and increasingly data centers. As governments and industries pursue decarbonization while seeking reliable and dispatchable power sources.
Major fuel cell technologies include:
- SOFC (Solid Oxide Fuel Cell): Preferred for stationary power and data centers.
- PEMFC (Proton Exchange Membrane Fuel Cell): Dominant in transportation and backup power.
- MCFC (Molten Carbonate Fuel Cell): Large scale distributed generation.
- PAFC (Phosphoric Acid Fuel Cell): Commercial combined heat and power.
- DMFC (Direct Methanol Fuel Cell): Portable applications
Exhibit 62: Fu l c ll off ring - D lta
Exhibit 63: Fu l c ll off ring - Bloom En rgy
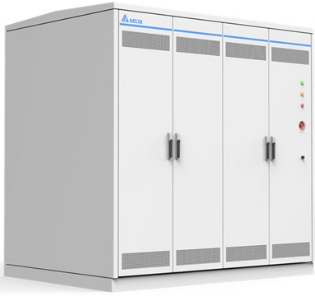
Sourc : D lta
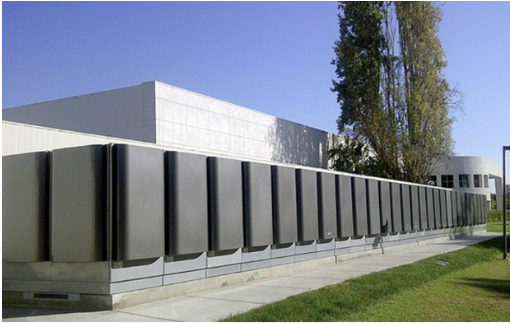
Sourc : Bloom En rgy
How do fuel cells work?
While there are several fuel cell architectures, the fundamental operating principle is largely the same: fuel is supplied to the anode, oxygen is supplied to the cathode, and an electrolyte in between allows charged ions to move while forcing electrons to flow through an external circuit. This flow of electrons generates usable electricity, while the M Asia Pacific Insight reaction also produces heat and water as byproducts. Unlike conventional generators, which rely on burning fuel to drive a turbine or engine, fuel cells produce electricity directly through electrochemical reactions, allowing them to achieve significantly higher efficiency and lower emissions.
Using solid oxide fuel cell (SOFC) technology as an example, air is supplied to the cathode side of the cell, where oxygen molecules gain electrons and form oxygen ions (O²⁻). These oxygen ions migrate through a ceramic electrolyte toward the anode side of the cell. At the same time, hydrogen or another hydrogen rich fuel is supplied to the anode. When the oxygen ions reach the anode, they react with the fuel to produce water, heat, and electrons. The generated electrons cannot pass through the electrolyte and therefore travel through an external electrical circuit before returning to the cathode, creating a continuous flow of electricity. As long as fuel and air continue to be supplied, the fuel cell can generate power continuously.
Exhibit 64: Fu l c ll diagram
Sourc : 3M
What benefits can fuel cells offer?
- High energy efficiency: Fuel cells convert the chemical energy of hydrogen directly into electricity through an electrochemical reaction, avoiding the multiple energy conversion steps associated with combustion based power generation. This allows fuel cells to achieve electrical efficiencies of over 60%, with some systems exceeding 80% total efficiency when waste heat is recovered through combined heat and power configurations, compared with roughly 35 45% for conventional gas fired power generation. The efficiency advantage translates directly into lower fuel consumption, reduced operating costs, and improved energy utilization over the lifetime of the system.
- Low carbon emi ion : When powered by hydrogen, fuel cells produce only water and heat as byproducts, generating no direct carbon emissions at the point of use. Even when operating on hydrogen derived from natural gas, fuel cells typically produce significantly lower greenhouse gas emissions than conventional combustion based power systems. As green hydrogen production scales, fuel cells offer a potential pathway toward near zero carbon power generation for transportation, industrial facilities, and distributed energy systems.
M Asia Pacific Insight
- Grid independence and energy ecurity: Fuel cells can provide reliable on site power generation independent of the electrical grid, improving energy security and resilience. This makes them attractive for mission critical applications such as data centers, hospitals, telecommunications infrastructure, defense installations, and industrial facilities that require uninterrupted power. In regions facing grid congestion or reliability concerns, fuel cells can also serve as a distributed power source located directly at the point of consumption.
- Long duration energy torage enabler: Fuel cells play an important role in the emerging hydrogen economy by enabling excess renewable energy from solar and wind farms to be stored as hydrogen and later converted back into electricity. Unlike batteries, which become increasingly expensive for longer storage durations, hydrogen storage can economically provide energy over days, weeks, or even seasonal periods. This capability could become increasingly valuable as renewable energy penetration rises worldwide.
- Fuel flexibility: Certain fuel cell technologies, particularly Solid Oxide Fuel Cells (SOFCs), can operate on a variety of fuels including hydrogen, natural gas, biogas, ammonia derived hydrogen, and other hydrogen rich fuels. This flexibility allows users to deploy fuel cell systems today using existing fuel infrastructure while maintaining a pathway toward pure hydrogen operation as hydrogen supply chains mature.
- Quiet operation and reduced maintenance: Because fuel cells contain relatively few moving parts compared with combustion engines and turbine based generators, they operate quietly and often require less routine maintenance. The absence of combustion also reduces mechanical wear and vibration, which can improve system reliability and lower lifecycle operating costs, particularly in stationary power applications.
- Scalability acro multiple application : Fuel cells can be deployed across a wide range of power levels, from portable power systems measured in watts to utility scale installations generating multiple megawatts. This scalability allows the technology to serve residential buildings, commercial facilities, industrial plants, transportation platforms, microgrids, and large scale data centers, making fuel cells one of the most versatile clean energy technologies available today.
Limitations and constraints of fuel cells
- High y tem co t: Despite significant technological progress, fuel cells remain more expensive than many conventional power generation technologies. The cost challenge stems from complex stack manufacturing, specialized materials, balance of plant components, and relatively low production volumes compared with mature technologies such as internal combustion engines, gas turbines, and batteries. While costs have declined over the past decade, achieving widespread commercial adoption will likely require further manufacturing scale, supply chain development, and technological improvements.
- Limited hydrogen infra tructure: One of the biggest challenges facing fuel cell deployment is the lack of hydrogen production, transportation, storage, and refueling infrastructure. Unlike electricity, which is already widely distributed through established grids, hydrogen supply networks remain in the early stages of
M Asia Pacific Insight
development in most regions. This infrastructure gap creates a chicken and egg challenge, where end users are reluctant to adopt fuel cell technologies without reliable hydrogen availability, while infrastructure developers are hesitant to invest until demand reaches sufficient scale.
- Durability and lifetime requirement : Although fuel cell durability has improved substantially, long term reliability remains a key focus area, particularly for commercial transportation and utility scale installations. Continuous exposure to heat, humidity, contaminants, and repeated operating cycles can gradually degrade fuel cell performance over time. Customers in sectors such as transportation, power generation, and industrial infrastructure often require operating lifetimes measured in tens of thousands of hours, creating significant engineering challenges for system developers.
- Regulatory and afety con ideration : Hydrogen is a highly flammable gas and requires specialized handling, storage, and transportation systems. Although hydrogen technologies have well established safety standards, new fueling stations, pipelines, and storage facilities must comply with stringent regulations. Developing these standards and obtaining approvals can extend deployment timelines and increase project costs.
- Technology fragmentation and lack of tandardization: The fuel cell industry encompasses multiple technology platforms, including PEM, SOFC, MCFC, and other architectures, each optimized for different applications. While this diversity encourages innovation, it can also slow industry standardization and create uncertainty for customers evaluating long term technology choices. Unlike the battery industry, which is increasingly converging around a few dominant chemistries, the fuel cell sector remains relatively fragmented.
Implications to datacenter power architecture
Transition from backup power to primary power source
Traditionally, data centers rely on grid electricity for primary power and diesel generators for backup power during outages. Fuel cells are increasingly being evaluated not only as a replacement for diesel backup generators but also as a potential primary power source. As AI driven workloads substantially increase power density and overall electricity demand, hyperscalers are exploring fuel cells as a means of deploying computing capacity in locations where grid power is constrained or unavailable. This could fundamentally shift data center power architecture from a grid centric design to one that incorporates distributed on site generation.
Potential long term evolution toward microgrid-based datacenters
In the longer term, fuel cells could become a core component of data center microgrids combining renewable generation, battery storage, hydrogen storage, and intelligent energy management systems. Rather than functioning as passive consumers of grid electricity, future AI focused data centers may increasingly operate as self contained energy ecosystems capable of managing their own generation, storage, and load balancing. Such an architecture could provide greater scalability, resilience, and energy independence than traditional grid connected designs M Asia Pacific Insight
Potential simplification of power distribution architecture
Fuel cells inherently generate DC power, which aligns more closely with the power requirements of modern servers and IT equipment. Current data centers typically involve multiple AC/DC and DC/DC conversion stages between the utility grid and the processor, each introducing efficiency losses. Over time, fuel cell adoption could encourage a greater migration toward direct DC power distribution architectures, reducing conversion losses and improving overall facility efficiency. Moreover, its DC output fits well with the shift into HVDC power delivery architecture for datacenters.
Exhibit 65: Fu l c lls in datac nt r pow r d liv ry archit ctur
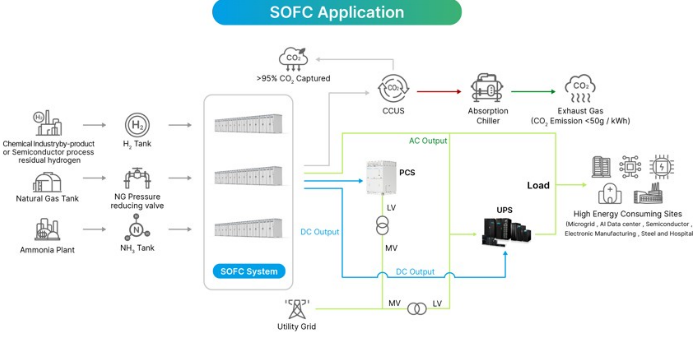
Sourc : D lta M Asia Pacific Insight
Risk Reward - Delta Electronics Inc. (23 8.TW) Risk Reward - Delta Electronics Inc. (2308.TW)
Strong combination: Power + cooling for AI infrastructure
NT$2,500.00 PRICE TARGET
Base case: P/E multiple of 30x based on average 2027-28 EPS. We believe our target multiple is justified by the 63% earnings CAGR we estimate for 2025-28, implying a PEG of 0.5, versus the stock's ~23x P/E and 23% earnings CAGR during 2022-25, which implied a PEG of 1.0.
NT$2,621.29
Consensus Price Target Distribution
NT$2,200.00
NT$4,120.00
Source: Refinitiv, Morgan Stanley Research Morgan Stanley Estimates MS PT
Mean
RISK REWARD CHART
Key: Historical Stock Performance Current Stock Price Price Target
Source: Refinitiv, Morgan Stanley Research
BULL CASE
BASE CASE
OVERWEIGHT THESIS
- ▪We view AI server power supplies and power management/cooling solutions for data centers as key growth drivers for the coming decade.
- ▪Our expectation for a re-rating reflects expanding gross/operating margins and
- increasing exposure to AI-related businesses. ▪Our 2026-28 earnings estimates reflect strength in AI server power supplies and liquid cooling.
- ▪Our price target implies a P/E of 30x based on average 2027-28 EPS.
Consensus Rating Distribution
Source: Refinitiv, Morgan Stanley Research
Risk Reward Themes
Secular Growth:
Positive
Self-help:
Positive
Technology Diffusion: Positive
View descriptions of Risk Rewards Themes here
BEAR CASE
40x average 2027-28e P/E
Strong sales growth with significant margin expansion: We assume a greater-thanexpected contribution from higher-margin businesses such as power electronics and liquid cooling as well as greater synergies from acquired companies.
30x average 2027-28e P/E
Strong YoY revenue growth in 2026-28, coupled with operating leverage: We expect steady growth in AI server power supply and data center infrastructure to be the key drivers. We see favorable mix and scale merits driving profit to grow more than double in 2027 vs. 2025.
NT$1,150.00
14x average 2027-28e P/E
Moderate sales growth with slight margin improvement: We assume further profit drag from legacy products, smaller profit contribution from higher-margin businesses, higher opex and/or less meaningful contribution from acquired companies.
NT$3,300.00
NT$2,500.00
M Asia Pacific Insight
Risk Reward - Delta Electronics Inc. (2308.TW)
KEY EARNINGS INPUTS
| Drivers | Dec 2025 | Dec 2026e | Dec 2027e | Dec 2028e |
|---|---|---|---|---|
| Power Electronics YoY (%) | 25.0 | 48.9 | 52.6 | 51.8 |
| Automation YoY (%) | 4.8 | 10.9 | 5.2 | 5.2 |
| Infrastructure YoY (%) | 81.6 | 44.6 | 51.0 | 48.2 |
INVESTMENT DRIVERS
- Transition to EV-related business and data infrastructure
- Operating margin recovery
- FINI holdings
GLOBAL REVENUE EXPOSURE
Source: Morgan Stanley Research Estimate View explanation of regional hierarchies here
MS ALPHA MODELS
2/5
MOST
3 Month
Horizon
Source: Refinitiv, FactSet, Morgan Stanley Research; 1 is the highest favored Quintile and 5 is the least favored Quintile
RISKS TO PT/RATING
RISKS TO UPSIDE
- Faster-than-expected global economic growth
- Falling raw material prices
- Margin improvement
RISKS TO DOWNSIDE
- Global economic slowdown
- Ongoing component supply tightness
- Rising raw material prices
- Margin contraction as a result of higher operating expenses or faster ASP erosion
OWNERSHIP POSITIONING
Inst. Owners, % Active
64.7%
Source: Refinitiv, Morgan Stanley Research
MS ESTIMATES VS. CONSENSUS
Source: Refinitiv, Morgan Stanley Research M Asia Pacific Insight
Financial Summary - Delta
Exhibit 66: D lta: Financial Summary
Consolidated Income Statements
| NT$mn (Year End Dec) | 2024 | 2025 | 2026E | 2027E | 2028E |
|---|---|---|---|---|---|
| Net sales | 421,148 | 554,885 | 775,166 | 1,131,877 | 1,659,520 |
| COGS | (284,567) | (364,729) | (494,374) | (707,257) | (1,028,632) |
| Gross profit | 136,580 | 190,157 | 280,792 | 424,620 | 630,887 |
| Operating expenses | (88,928) | (106,224) | (142,491) | (191,135) | (263,905) |
| Operating income | 47,652 | 83,932 | 138,300 | 233,484 | 366,983 |
| Non-operating income | 3,664 | 3,934 | 10,365 | 7,100 | 7,300 |
| Interest income | 1,859 | 1,501 | 1,687 | 2,100 | 2,300 |
| Investment income | (162) | (200) | 372 | - | - |
| Exchange gain | 1,041 | 644 | 2,091 | - | - |
| Other | 926 | 1,989 | 6,215 | 5,000 | 5,000 |
| Pre-tax income | 51,316 | 87,866 | 148,666 | 240,584 | 374,283 |
| Income tax | (10,925) | (19,930) | (32,925) | (52,189) | (81,172) |
| Minority interests | (5,163) | (7,828) | (12,433) | (20,158) | (31,363) |
| Net income | 35,229 | 60,108 | 103,307 | 168,237 | 261,747 |
| Modelware EPS (NT$) | 13.56 | 23.14 | 39.77 | 64.77 | 100.77 |
Consolidated Balance Sheets
2028E NT$mn (Year End Dec)
421,148 554,885 775,166 1,131,877 1,659,520 Operating CF
(284,567) (364,729) (494,374) (707,257) (1,028,632) Net Profits
630,887 Depreciation & Amort.
(263,905) Change in WC
366,983 Other adjustments
2,300 Change of FA (Capex)
261,747 Cash dividends
100.77 Other adjustments
| Consolidated Cash Flow Statements - NT$mn (Year End Dec) | Consolidated Cash Flow Statements - 2024 | Consolidated Cash Flow Statements - 2025 | Consolidated Cash Flow Statements - 2026E | Consolidated Cash Flow Statements - 2027E | Consolidated Cash Flow Statements - 2028E |
|---|---|---|---|---|---|
| Operating CF | 72,895 | 98,474 | 116,226 | 177,240 | 263,652 |
| Net Profits | 35,229 | 60,108 | 103,307 | 168,237 | 261,747 |
| Depreciation & Amort. | 25,016 | 27,839 | 30,912 | 33,985 | 37,058 |
| Change in WC | (2,486) | (24,190) | (55,485) | (86,295) | (125,847) |
| Other adjustments | 15,137 | 34,717 | 37,491 | 61,313 | 90,694 |
| Investing CF | (40,360) | (53,214) | (70,000) | (70,000) | (60,000) |
| Change of FA (Capex) | (33,435) | (45,950) | (70,000) | (70,000) | (60,000) |
| Change of L/T invest. | (4,739) | - | - | - | - |
| Other adjustments | (1,644) | (3,517) | - | - | - |
| Financing CF | (11,118) | (9,401) | 36,107 | (12,414) | (54,050) |
| Increase in L/T debt | 8,552 | (11,308) | 12,530 | 2,978 | 3,829 |
| Increase in S/T debt | (1,417) | 446 | 29 | 212 | 272 |
| Issuance of stock | - | - | - | - | - |
| Cash dividends | (18,696) | (20,313) | (30,131) | (51,787) | (84,335) |
| Other adjustments | 444 | 21,774 | 53,680 | 36,183 | 26,183 |
| FX adjust. | 8,586 | (2,146) | - | - | - |
| Net change in cash | 30,003 | 33,713 | 82,333 | 94,826 | 149,602 |
2028E Margins (%)
477,934 Gross margin
3,941 Operating margin
364,023 Pretax margin
298,726 Net margin
52,257 YoY growth (%)
4,876 Operating profits
124,410 Pretax profits
96,922 Net profits
2,877 Cash div payout (%)
266,379 Adjusted cash div (NT$)
337,504 Yield (%)
606,759 Net Debt/Equity (%)
730,661 ROAE (%)
25,975 ROAA (%)
507,964 AR/NR days
692,428 AP/NP days
531,898 639,619 803,727 1,051,042 1,423,089 Cash conversion
| NT$mn (Year End Dec) | 2024 | 2025 | 2026E | 2027E | 2028E |
|---|---|---|---|---|---|
| Cash | 117,459 | 151,172 | 233,505 | 328,332 | 477,934 |
| Mkt securities | 4,333 | 3,941 | 3,941 | 3,941 | 3,941 |
| A/R | 89,921 | 121,717 | 170,036 | 248,282 | 364,023 |
| Inventory | 83,856 | 101,478 | 142,217 | 205,395 | 298,726 |
| Others | 15,355 | 17,473 | 24,410 | 35,642 | 52,257 |
| Current Assets | 310,925 | 395,781 | 574,109 | 821,592 | 1,196,881 |
| Long-term investments | 4,740 | 4,876 | 4,876 | 4,876 | 4,876 |
| Fixed assets | 115,710 | 142,040 | 127,820 | 127,652 | 124,410 |
| Other assets | 100,523 | 96,922 | 96,922 | 96,922 | 96,922 |
| Total Assets | 531,898 | 639,619 | 803,727 | 1,051,042 | 1,423,089 |
| S/T borrowings | 1,918 | 2,364 | 2,393 | 2,605 | 2,877 |
| AP/NP | 69,223 | 94,452 | 128,025 | 183,154 | 266,379 |
| Other ST liabilities | 81,142 | 112,849 | 157,649 | 230,195 | 337,504 |
| Total current liabilities | 152,283 | 209,665 | 288,067 | 415,954 | 606,759 |
| L/T debt | 32,209 | 21,143 | 33,673 | 36,650 | 40,480 |
| Other LT liabilities | 67,840 | 83,422 | 83,422 | 83,422 | 83,422 |
| Total Liabilities | 252,332 | 314,230 | 405,162 | 536,026 | 730,661 |
| Common shares | 25,975 | 25,975 | 25,975 | 25,975 | 25,975 |
| Retained Earnings | 102,429 | 140,925 | 214,101 | 330,552 | 507,964 |
| Other SH equity | 151,161 | 158,489 | 158,489 | 158,489 | 158,489 |
| Shareholders' equity | 279,565 | 325,389 | 398,565 | 515,016 | 692,428 |
| Total Liab./SE | 531,898 | 639,619 | 803,727 | 1,051,042 | 1,423,089 |
Sourc : Company data, Morgan Stanl y R s arch. E = Morgan Stanl y R s arch stimat s M Asia Pacific Insight
| Consolidated Financial Ratios | Consolidated Financial Ratios | Consolidated Financial Ratios | Consolidated Financial Ratios | Consolidated Financial Ratios | Consolidated Financial Ratios |
| 2024 | 2025 | 2026E | 2027E | 2028E | |
| Margins (%) | |||||
| Gross margin | 32.4 | 34.3 | 36.2 | 37.5 | 38.0 |
| Operating margin | 11.3 | 15.1 | 17.8 | 20.6 | 22.1 |
| Pretax margin | 12.2 | 15.8 | 19.2 | 21.3 | 22.6 |
| Net margin | 8.4 | 10.8 | 13.3 | 14.9 | 15.8 |
| YoY growth (%) | |||||
| Sales | 5 | 32 | 40 | 46 | 47 |
| Operating profits | 16 | 76 | 65 | 69 | 57 |
| Pretax profits | 5 | 71 | 69 | 62 | 56 |
| Net profits | 5 | 71 | 72 | 63 | 56 |
| Others | |||||
| Cash div payout (%) | 52% | 50% | 50% | 50% | 50% |
| Adjusted cash div (NT$) | 7.0 | 11.6 | 19.9 | 32.5 | 50.5 |
| Yield (%) | 0% | 1% | 1% | 2% | 3% |
| Net Debt/Equity (%) | -31% | -40% | -51% | -57% | -63% |
| Liabilities/Equity (%) | 90% | 97% | 102% | 104% | 106% |
| Liabilities/Assets (%) | 47% | 49% | 50% | 51% | 51% |
| ROAE (%) | 13% | 20% | 29% | 37% | 43% |
| ROAA (%) | 7% | 10% | 14% | 18% | 21% |
| AR/NR days | 73 | 70 | 69 | 67 | 67 |
| Inventory days | 103 | 93 | 90 | 90 | 89 |
| AP/NP days | 79 | 82 | 82 | 80 | 80 |
| Cash conversion | 97 | 80 | 77 | 77 | 77 |
Exhibit 67: D lta: Quart rly Financials
Delta (2308.TW)
| (NT$ mn) | 1Q26 | 2Q26 | 3Q26E | 4Q26E | 1Q27E | 2Q27E | 3Q27E | 4Q27E | 2025 | 2026E | 2027E |
|---|---|---|---|---|---|---|---|---|---|---|---|
| Net sales | 159,353 | 183,256 | 201,379 | 231,177 | 231,791 | 265,526 | 302,930 | 331,630 | 554,885 | 775,166 | 1,131,877 |
| COGS | (100,392) | (117,948) | (129,404) | (146,630) | (146,821) | (166,230) | (188,191) | (206,015) | (364,729) | (494,374) | (707,257) |
| Gross profit | 58,961 | 65,308 | 71,976 | 84,547 | 84,970 | 99,295 | 114,739 | 125,615 | 190,157 | 280,792 | 424,620 |
| Operating expenses | (30,544) | (34,738) | (36,983) | (40,226) | (40,422) | (45,405) | (50,589) | (54,719) | (106,224) | (142,491) | (191,135) |
| SG&A | (16,886) | (18,956) | (20,208) | (21,963) | (22,067) | (24,959) | (27,870) | (30,178) | (57,482) | (78,014) | (105,074) |
| R&D exp. | (13,657) | (15,782) | (16,775) | (18,263) | (18,356) | (20,445) | (22,720) | (24,541) | (48,743) | (64,477) | (86,061) |
| Operating income | 28,417 | 30,570 | 34,992 | 44,321 | 44,548 | 53,891 | 64,149 | 70,896 | 83,932 | 138,300 | 233,484 |
| Non-operating income | 2,676 | 4,430 | 1,630 | 1,630 | 1,775 | 1,775 | 1,775 | 1,775 | 3,934 | 10,365 | 7,100 |
| Interest income | 428 | 398 | 430 | 430 | 525 | 525 | 525 | 525 | 1,501 | 1,687 | 2,100 |
| Investment income | 487 | (115) | - | - | - | - | - | - | (200) | 372 | - |
| Disposal of investment | - | - | - | - | - | - | - | - | - | - | - |
| Exchange gain | 1,688 | 403 | - | - | - | - | - | - | 644 | 2,091 | - |
| Other | 72 | 3,743 | 1,200 | 1,200 | 1,250 | 1,250 | 1,250 | 1,250 | 1,989 | 6,215 | 5,000 |
| Pre-tax income | 31,093 | 35,000 | 36,622 | 45,951 | 46,323 | 55,666 | 65,924 | 72,671 | 87,866 | 148,666 | 240,584 |
| Income tax | (7,258) | (7,831) | (7,910) | (9,925) | (10,423) | (11,968) | (14,174) | (15,624) | (19,930) | (32,925) | (52,189) |
| Minority interest | (3,279) | (2,033) | (3,158) | (3,963) | (3,841) | (4,676) | (5,537) | (6,104) | (7,828) | (12,433) | (20,158) |
| Net income | 20,556 | 25,136 | 25,554 | 32,063 | 32,059 | 39,022 | 46,213 | 50,943 | 60,108 | 103,307 | 168,237 |
| EPS (NT$) | 7.91 | 9.68 | 9.84 | 12.34 | 12.34 | 15.02 | 17.79 | 19.61 | 23.14 | 39.77 | 64.77 |
| Margins (%) | |||||||||||
| Gross Margin | 37.0 | 35.6 | 35.7 | 36.6 | 36.7 | 37.4 | 37.9 | 37.9 | 34.3 | 36.2 | 37.5 |
| Operating Margin | 17.8 | 16.7 | 17.4 | 19.2 | 19.2 | 20.3 | 21.2 | 21.4 | 15.1 | 17.8 | 20.6 |
| Pretax Margin | 19.5 | 19.1 | 18.2 | 19.9 | 20.0 | 21.0 | 21.8 | 21.9 | 15.8 | 19.2 | 21.3 |
| Net Margin | 12.9 | 13.7 | 12.7 | 13.9 | 13.8 | 14.7 | 15.3 | 15.4 | 10.8 | 13.3 | 14.9 |
| QoQ Growth (%) | |||||||||||
| Sales | (1) | 15 | 10 | 15 | 0 | 15 | 14 | 9 | |||
| Gross Profit | 5 | 11 | 10 | 17 | 1 | 17 | 16 | 9 | |||
| Operating Profit | 8 | 8 | 14 | 27 | 1 | 21 | 19 | 11 | |||
| Pretax Profit | 21 | 13 | 5 | 25 | 1 | 20 | 18 | 10 | |||
| Net Profit | 19 | 22 | 2 | 25 | (0) | 22 | 18 | 10 | |||
| YoY Growth (%) | |||||||||||
| Sales | 34 | 48 | 34 | 43 | 45 | 45 | 50 | 43 | 32 | 40 | 46 |
| Gross Profit | 56 | 48 | 37 | 51 | 44 | 52 | 59 | 49 | 39 | 48 | 51 |
| Operating Profit | 102 | 64 | 41 | 68 | 57 | 76 | 83 | 60 | 76 | 65 | 69 |
| Pretax Profit | 99 | 79 | 36 | 79 | 49 | 59 | 80 | 58 | 71 | 69 | 62 |
| Net Profit | 101 | 80 | 37 | 85 | 56 | 55 | 81 | 59 | 71 | 72 | 63 |
Sourc : Company data, Morgan Stanl y R s arch. E = Morgan Stanl y R s arch stimat s M Asia Pacific Insight
Valuation Methodology - Delta
Our price target (ba e ca e cenario value) i NT$2,500, derived from 30x 2027-28e
P/E: We use price/earnings as our valuation methodology because we believe it appropriately captures Delta's earnings growth potential. We believe our target P/E multiple of 30x is justified by an earnings CAGR of 63% over 2025 28, which implies a PEG of 0.5. This is lower than the average of 1.0 in 2022 25, when the stock was trading at an average P/E of 23x for a 23% earnings CAGR.
Bull ca e cenario value - NT$3,300: We apply a 40x P/E multiple to our average base case estimate for 2027 2028. This scenario assumes a greater than expected contribution from higher margin businesses such as power electronics and liquid cooling as well as greater synergies from acquired companies.
Bear ca e cenario value - NT$1,150: We apply a 14x P/E multiple to our average base case estimate for 2027 2028. This scenario assumes further profit drag from legacy products, smaller profit contribution from higher margin businesses, higher opex and/or less meaningful contribution from acquired companies.
Exhibit 68: D lta: NTM P/E chart
Sourc : FactS t cons nsus stimat s, Morgan Stanl y R s arch M Asia Pacific Insight
Why Does Delta Trade at a Significant Valuation Discount to Delta Thailand?
Discussion of the valuation gap between Delta Electronics (2308.TW, currently 33x 12M forward consensus P/E) and Delta Electronics Thailand (DELTA.TH, 71x currently) has been ongoing for several years. If we look at their valuations before 2020, Delta was actually trading at a premium, with an average 17x 12M forward P/E in 2010 2020 vs. Delta Thailand's 13x. This made sense, as Delta is much more competitive in the global arena and Delta Thailand was set up as a subsidiary focused on manufacturing.
The situation flipped after 2020. Though Delta has been re rated to trade at an average 23x 12M forward P/E since 2020, Delta Thailand has seen its valuation surge to an average of 60x over the same period. This cannot be explained by moves in their respective markets, either, as TWSE went from 14x forward P/E in 2010 20 to 16x after 2020, while the SET went from 13x to 16x.
We think this could be attributable to a few factors:
- Different po itioning within the Delta group: Delta group has increased its stake in Delta Thailand to over 60% from about 20% in 2019 through a tender offer. Since then, there has been much more collaboration between Delta group and Delta Thailand. As Thailand emerged as one of the major manufacturing hubs within the Delta group, its earnings growth (28% in 2020 25) outpaced that of Delta Taiwan (19%).
- Scarcity in the Thai tock market: Delta Thailand is one of the relatively few large cap Thai listed companies that offer direct exposure to AI/data center power and EV related themes, whereas there are many such alternatives in Taiwan.
- Limited free float: As the Delta group owns a ~62% stake in Delta Thailand and there have been a few quite stable long term shareholders, we think the effective free float is probably 20% or less.
Exhibit 70: DET NTM P/E
Sourc : FactS t cons nsus stimat s, Morgan Stanl y R s arch
Exhibit 69: D lta NTM P/E
Sourc : FactS t cons nsus stimat s, Morgan Stanl y R s arch M Asia Pacific Insight
Exhibit 71: TWSE NTM P/E
Sourc : FactS t cons nsus stimat s, Morgan Stanl y R s arch
Exhibit 72: SET Ind x NTM P/E
Sourc : FactS t cons nsus stimat s, Morgan Stanl y R s arch
Exhibit 73: Valuation gap b tw n D lta Thailand and D lta bas d on 12M forward P/E
Sourc : FactS t cons nsus stimat s, Morgan Stanl y R s arch M Asia Pacific Insight
Global Footprint - Delta
Comprehensive Global Operations
Aggressive capacity expansion plans
The company has been continuously diversifying its production base away from China owing to the trade turmoil back in 2018 2019, and then by supply chain disruptions during Covid. Management explicitly set a target of lowering China production to 60% of total capacity (from >70% previously) for the first time back in 2020. New capacity was added in Thailand, India, and Taiwan during 2020 2021. It then saw demand surge from various sectors, including EVs, automation and telecom, during 2022 23, followed by AI related power suppliers and cooling solutions emerging in 2024. In order to grasp the emerging opportunities, relevant plant build outs were planned accordingly, on top of the ongoing geographical diversification. It expanded its presence-production sites, R&D, and sales teams-in Europe and the US to better cope with operational disruptions and capture domestic demand, in addition to its existing setups in Taiwan, Thailand, and India. There was then a substantial increase in capex of NT$12.2bn in 2025 (vs. NT$5.6 6bn in 2023 24) as the company further accelerated its expansion plan, mainly on AI related power/cooling demand and increasing capacity tightness, specifically in Thailand and the US. Delta continued to expand in Thailand by adding three new plants, with another three under construction for power and liquid cooling system offerings. In view of the capacity tightness reserved for AI related business, it also started to prioritize margin accretive business-i.e., de emphasize business with net margins below 10%-which further optimized product mix.
Looking ahead into 2026 and beyond, expansion is likely to remain aggressive in order to fulfill substantial power and liquid cooling turnkey solution demand for large scale data centers, while management also indicated that the new capacity added at the end of 2025 has already been fully taken. With capacity staying tight for AI power and cooling offerings, the company will continue to expand actively in China, Thailand, the US, and Tainan, Taiwan. It also plans to add mass production lines in Taoyuan, scheduled to be ready by 2028, in addition to the pilot run lines in Tainan. Against this backdrop, the capex budget has been revised up several times and is now roughly NT$50bn for 2026.
M Asia Pacific Insight
Exhibit 74: D lta's global footprint
Sourc : Company data, Morgan Stanl y R s arch. Not : Data as of 2024.
M Asia Pacific Insight
Financial Analysis - Delta
44% Revenue CAGR in 2025-28e
Delta's revenue growth was moderate in 2020 at merely 5%, making it the only year of the Covid disruption (2019 22) that did not see double digit growth. Growth picked up to 11% in 2021, underpinned by surging demand for cloud, networking, and work from home infrastructure amid the pandemic, while the next uplift to 22% growth in 2022 was mainly fueled by increasing demand for EV and data center related components (server power supplies, networking switches, energy storage systems, etc). Revenue momentum subsequently moderated in 2023, growing just 4%, as the EV component business was impacted by the UAW strike in the US and automation demand in China stayed subdued, despite sustained demand for AI server power supplies and modules. Growth in 2024 was at a similar level, as strength in data center offerings were not enough to offset weakness in its legacy businesses.
Revenue surged 32% in 2025 to a record NT$554,885mn, driven by AI server rack power and cooling solutions, along with further spec upgrades and value growth.
We expect revenue to expand at a 44% CAGR over 2025 28, supported by ongoing AI server shipments, spec upgrades, 800 VDC power solutions, and turnkey liquid cooling offerings. As the upgrade to 800V HVDC power architecture is likely to take years given the complex design and high safety requirements, we expect AI server power solution upgrades to be separated into a few stages - from power shelves in AI server racks to standalone side car power racks, from 50V DC to 800V DC output, from 72kW per power shelf to >250kW, etc, as well as power wattage increases for next generation GPU rack designs.
By segment, Power Electronics has been the primary revenue driver, contributing at least 50% over the past years despite the company separating the Mobility segment from Power Electronics since 2024 so as to further distinguish revenue generated from EVs/ autos. We expect the segment to remain the key revenue contributor, supported by strong demand from AI server related power solutions, and estimate it will reach 58% of revenue by 2028 vs. 50% in 2025. Infrastructure, the second largest revenue contributor historically, is expected to grow along with the Power Electronics segment, fueled by demand for data center power related solutions (i.e. UPSs, CDUs, sidecars, etc) as well as energy infrastructure related offerings (i.e. SSTs (solid state transformers), fuel cells, modular power solutions, micro grid management, etc.). We model the segment's revenue contribution to reach 35% by 2028 from 24% in 2024 and 33% in 2025. For Automation and Mobility, we expect their revenue contributions to decline sequentially throughout the years, with Automation dropping from 10% in 2025 to 4% in 2028 and Mobility falling from 7% in 2025 to 2% in 2028.
M Asia Pacific Insight
Exhibit 75: D lta: R v nu CAGR, 2025-28
Sourc : Company data, Morgan Stanl y R s arch. E = Morgan Stanl y R s arch stimat s
Exhibit 77: D lta: Pow r l ctronics r v nu
Sourc : Company data, Morgan Stanl y R s arch. E = Morgan Stanl y R s arch stimat s
Exhibit 79: D lta: Automation r v nu
Sourc : Company data, Morgan Stanl y R s arch. E = Morgan Stanl y R s arch stimat s
Exhibit 76: D lta: Annual r v nu growth
Sourc : Company data, Morgan Stanl y R s arch. E = Morgan Stanl y R s arch stimat s
Exhibit 78: D lta: Infrastructur r v nu
Sourc : Company data, Morgan Stanl y R s arch. E = Morgan Stanl y R s arch stimat s
Exhibit 80: D lta: Mobility r v nu
Sourc : Company data, Morgan Stanl y R s arch. E = Morgan Stanl y R s arch stimat s M Asia Pacific Insight Sourc : Company data, Morgan Stanl y R s arch. E = Morgan Stanl y R s arch stimat s
Exhibit 81: D lta: R v nu br akdown by s gm nt
Continuous margin expansion on favorable product mix
Delta's gross margin stayed largely between 28 29% during 2021 23, as revenue was mainly driven by relatively lower margin products, including EV and consumer/IT related products, while server related offerings had yet to scale up. 2024 served as an inflection point, with the product mix changing structurally, supported by robust demand for AI data center related offerings, while its legacy businesses stayed relatively weak. Gross margin thus grew by 3.2ppt YoY during the year, from 29.2% in 2023 to 32.4% in 2024. Increasing AI computing needs further increased power consumption and cooling requirements per rack, boosting demand for high density AI power and cooling products along with related system level solutions in 2025, which lifted gross margin by another 1.8ppt YoY to 34.3% for the year.
The opex ratio was largely stable, fluctuating around 18 19% between 2020 and 2023. It then increased to 19% in 2023 and 21.1% in 2024, mainly due to operating deleverage, higher R&D costs, and ongoing capacity expansion. The ratio declined back to 19.1% in 2025 on the back of an enlarged revenue base, despite R&D related investments remaining elevated.
Looking ahead, we expect gross margin to continue expanding on the back of increasing revenue contribution from AI related power supplies. We thus pencil in a 2.0ppt gross margin expansion to 36.2% in 2026, followed by further increases of 1.3ppt and 0.5ppt YoY in 2027 and 2028, respectively, reaching 38.0% by 2028. On the opex ratio, we expect Delta to continue benefiting from operating leverage in the coming years, and thus estimate operating margin to improve more substantially than gross margin, expanding by 2.7ppt YoY in 2026 to 17.8%, followed by further expansions of 2.8ppt and 1.5ppt in 2027 and 2028, reaching 20.6% and 22.1%, respectively.
M Asia Pacific Insight
Exhibit 82: D lta: Margin tr nd
Sourc : Company data, Morgan Stanl y R s arch. E = Morgan Stanl y R s arch stimat s Sourc : Company data, Morgan Stanl y R s arch. E = Morgan Stanl y R s arch stimat s
Exhibit 83: D lta: Op x ratio
Net profit to grow at a 63% CAGR in 2025-28
Delta's operating profit grew sequentially throughout 2020 22, supported by gross margin expansion and a lower opex ratio, from NT$31,426mn in 2020 to NT$41,439mn in 2022. It then saw a slight 1% YoY decline in 2023 due to higher operating expenses as the company further stepped up its R&D investments, despite a 0.4ppt gross margin expansion in 2023. Operating margin also edged down accordingly by 0.6ppt to 10.2% during the year.
Operating profit returned to a growth trajectory from 2024 onward, growing 16% YoY in 2024 and 76% YoY in 2025, as AI related power offerings started to scale up. Operating margin expanded faster than gross margin, supported by operating leverage and disciplined cost controls, increasing by 1.1ppt in 2024 to 11.3% and another 3.8ppt to 15.1% in 2025.
With the tax rate staying largely stable at ~20% during 2020 23 before starting to edge up in 2024 and reaching 23% in 2025, Delta's net profit growth was largely aligned with its operating profit growth trajectory. 2023 was an exception, as net profit still managed to grow 2% YoY despite a 1% YoY decline in operating profit, mainly due to higher FX gains.
The net margin trend has been largely aligned with that of operating margin in recent years. After dropping from 9.0% in 2020 to 8.5% in 2021, as lower gross margin was offset by a lower opex ratio, net margin hovered around the 8.3 8.5% level during 2021 24. Net margin was largely flat YoY in 2024 despite a 1.1ppt expansion in operating margin, mainly due to lower non operating income and a slightly higher tax rate. We then saw a surge in 2025, with net margin expanding 2.5ppt YoY to 10.8%, benefiting from a larger contribution from higher margin AI power offerings.
Looking ahead, we forecast net profit to grow 72% YoY in 2026e, followed by 63% YoY growth in 2027e and 56% YoY growth in 2028e, implying a 63% CAGR in 2025 28e, assuming a stable tax rate of 22%. Net margin is likely to rise accordingly, from 10.8% in 2025 to 13.3% in 2026, followed by further expansion to 14.9% in 2027 and 15.8% in 2028.
M Asia Pacific Insight
Exhibit 84: D lta: Op rating incom tr nd
Sourc : Company data, Morgan Stanl y R s arch. E = Morgan Stanl y R s arch stimat s
Exhibit 86: D lta: N t profit tr nd
Sourc : Company data, Morgan Stanl y R s arch. E = Morgan Stanl y R s arch stimat s Sourc : Company data, Morgan Stanl y R s arch. E = Morgan Stanl y R s arch stimat s Sourc : Company data, Morgan Stanl y R s arch. E = Morgan Stanl y R s arch stimat s
Exhibit 85: D lta: Op rating margin
Exhibit 87: D lta: N t margin
ROE to rise alongside margin expansion
ROE rose gradually but steadily during 2020 22, from 14.3% to 14.5%, mainly driven by improving asset turnover, offset by lower net margin. ROE edged down to 13.8% in 2023 and fell further to 12.6% in 2024 on the back of lower asset turnover, while net margin and financial leverage remained at similar levels. It then rebounded to 18.5% in 2025, supported by both improving asset turnover and net margin expansion, which was fueled by an increasingly favorable product mix and operating leverage.
Looking ahead, we expect ROE to continue rising, reaching 25.9% in 2026, 32.7% in 2027, and 37.8% in 2028, primarily driven by continued margin expansion and improving asset turnover. Net margin is projected to expand from 10.8% in 2025 to 15.8% in 2028, supported by gross margin improvement-from 34.3% to 38.0%-and a declining operating expense ratio from 19.1% in 2025 to 15.9% in 2028.
M Asia Pacific Insight
Exhibit 88: D lta: ROE tr nd
Sourc : Company data, Morgan Stanl y R s arch. E = Morgan Stanl y R s arch stimat s Sourc : Company data, Morgan Stanl y R s arch. E = Morgan Stanl y R s arch stimat s
Exhibit 89: D lta: DuPont analysis
Improving balance sheet and continuous free cash flow generation
Delta has generated positive operating cash flow in recent years. Operating cash flow declined in 2021, mainly due to higher inventory buildup amid supply chain disruptions during the year. Free cash flow generation has also remained positive, while fluctuating with capital expenditures over the years. Free cash flow was exceptionally low at NT $5,292mn in 2021, as the company started to step up capex mainly for geographic capacity diversification and greater production flexibility-adding new capacity in Thailand, India, Tainan/Zhongli in Taiwan, and Wuhu, Wujiang, and Chongqing in Mainland China. Both absolute capex and the capex to sales ratio have trended upward since 2022, as Delta continued to add capacity for EV related offerings and power and cooling solutions during 2023 24, with further acceleration in 2025 due to capacity tightness for AI power and cooling offerings, especially in Thailand and the US.
Looking ahead, the company aims to continue adding capacity worldwide to fulfill substantial demand for power and liquid cooling turnkey solutions for large scale data centers operated by major hyperscalers beyond 2027. Capacity remains tight for AI power and cooling offerings, so it continues to expand actively in China, Thailand, the US, and Tainan. Management also plans to add mass production lines in Taoyuan, Taiwan, scheduled to be ready by 2028, in addition to the pilot run lines in Tainan. Accordingly, we now estimate capex to rise to NT$70bn in 2026 from ~NT$46bn in 2025 and stay at a similar level in 2027 before edging down slightly to NT$60bn in 2028.
Delta's net cash position has been rising since 2021, with its net cash to equity ratio improving from just 2% in 2021 to 40% in 2025. We expect this ratio to continue rising, reaching 51% in 2026, 57% in 2027, and 63% in 2028, on strong free cash flow generation despite a higher total debt level amid ongoing capacity expansion.
M Asia Pacific Insight
Exhibit 90: D lta: Positiv op rating cash flow
Sourc : Company data, Morgan Stanl y R s arch. E = Morgan Stanl y R s arch stimat s
Exhibit 92: D lta: Cap x and cap x-to-sal s ratio
Sourc : Company data, Morgan Stanl y R s arch. E = Morgan Stanl y R s arch stimat s
Exhibit 94: D lta: D bt position
Sourc : Company data, Morgan Stanl y R s arch. E = Morgan Stanl y R s arch stimat s Sourc : Company data, Morgan Stanl y R s arch. E = Morgan Stanl y R s arch stimat s Sourc : Company data, Morgan Stanl y R s arch. E = Morgan Stanl y R s arch stimat s Sourc : Company data, Morgan Stanl y R s arch. E = Morgan Stanl y R s arch stimat s
Exhibit 91: D lta: Improving fr cash flow g n ration
Exhibit 93: D lta: N t cash position
Exhibit 95: D lta: Cash on hand
After edging down slightly in 2022 from a relatively high 7.3% in 2021, Delta's capex to sales ratio has been rising alongside its aggressive capacity expansion plans since 2022, despite an expanding revenue base. Looking ahead, as we expect capex to increase further in 2026, we project a capex to sales ratio of 9.0% for the year on robust revenue growth, before declining to 6.2% in 2027 and 3.6% in 2028.
The depreciation to sales ratio hovered around the 4 5% level during 2020 25. We M Asia Pacific Insight estimate the ratio will decline sequentially as the revenue base grows faster than capex and depreciation, from 4.3% in 2025 to 3.5% in 2026, 2.7% in 2027, and 2.0% in 2028.
Exhibit 96: D lta: D pr ciation and d pr ciation to sal s
Sourc : Company data, Morgan Stanl y R s arch. E = Morgan Stanl y R s arch stimat s
Delta's cash conversion cycle (CCC) rose from 77 days in 2020 to a peak of 101 days in 2023 before improving to 80 days in 2025. By 2025, inventory days had increased from 80 days in 2020 to 93 days, while AP days had risen to 82 days after falling from 81 days in 2020 to 75 days in 2023. This was partly offset by improving AR days, which declined from 77 days in 2020 to 70 days in 2025.
Looking ahead, we expect the overall cash conversion cycle to improve further and remain at 77 days throughout 2026 28, mainly supported by improving AR days and a modest decline in inventory days.
Exhibit 98: D lta: Inv ntory days
Sourc : Company data, Morgan Stanl y R s arch. E = Morgan Stanl y R s arch stimat s
Exhibit 97: D lta: AR days
Sourc : Company data, Morgan Stanl y R s arch. E = Morgan Stanl y R s arch stimat s M Asia Pacific Insight Sourc : Company data, Morgan Stanl y R s arch. E = Morgan Stanl y R s arch stimat s Sourc : Company data, Morgan Stanl y R s arch. E = Morgan Stanl y R s arch stimat s M Asia Pacific Insight
Exhibit 99: D lta: AP days
Exhibit 100:D lta: Cash conv rsion cycl
Company Background - Delta
Company snapshot
Delta Electronics is a global provider of power and thermal management technologies, with a focus on energy efficient products and integrated solutions. Founded in 1971, the company serves a broad range of applications spanning components, power and system products, thermal management, mobility, industrial and building automation, data centers, telecom, and energy infrastructure, across industries including automotive, healthcare, data centers, and power grids. By combining its capabilities in power electronics, digital technologies, and system integration, Delta aims to support customers in improving operational efficiency and advancing smart manufacturing, smart cities, and more sustainable infrastructure.
The company is headquartered in Taipei, Taiwan. Its global network consists of 293 operations, including 165 sales offices, 55 manufacturing sites, and 73 R&D centers, supporting customers worldwide.
M Asia Pacific Insight
Exhibit 101:D lta: K y mil ston s
| Year | Key Milestones |
|---|---|
| 1971 | Delta Electronics, Inc. was established |
| 1976 | Achieved >US$1mn of revenue |
| 1977 | Moved plant to Taoyuan Guishan Industrial Park |
| 1983 | - Mass production of switching power supplies |
| 1988 | - Listed on the Taiwan Stock Exchange (code 2308) - Mass production of brushless DC fans - Invested in the establishment of Delta Electronics (Thailand) PCL, with an original stake of 6% |
| 1989 | - Established first Japan office in Tokyo - Established Delta Power Electronics laboratory in Raleigh, US |
| 1992 | - Inauguration of the first plant in China (Dongguan) - Established Delta Greentech (China) Co., Ltd. in Shanghai |
| 1995 | Delta Electronics (Thailand) PCL was listed on Thailand Stock Exchange |
| 1999 | - Inaugurated its new Taipei HQ - Established the Delta Power Electronics Center (DPEC) in Shanghai |
| 2000 | Established the Delta Power Electronics Science and Education Development program |
| 2001 | Inaugurated its Wuhu plant in China |
| 2003 | Acquired ASCOM Energy Systems and its plant in Slovakia |
| 2006 | Inaugurated Delta's Tainan Plant I |
| 2008 | Inaugurated its Rudrapur plant in India and Wuhu plant in China |
| 2010 2011 | Inaugurated Chenzhou plant in China Inaugurated Shanghai R&D and Operations Center and Taoyuan R&D Center in Taiwan |
| 2012 | Mr. Yancey Hai was elected Chairman and Mr. Ping Cheng was appointed as CEO |
| 2015 | - Acquired Eltek ASA, a leading provider of telecom power, industrial power, and data center power solutions - Inaugurated Delta Americas' headquarters green building and Taoyuan Plant 5 |
| 2017 | - Announced organizational adjustment to focus on Power Electronics, Automation, and Infrastructure as main business categories - Acquired a controlling stake in VIVOTEK |
| 2019 | - Acquired a controlling stake in Delta Electronics (Thailand) Public Company Limited - Acquired lighting-solutions brand Amerlux |
| 2020 | Accquired Trihedral, a Canadian SCADA and IIoT software company, to strengthen industrial automation and system-integration businesses |
| 2021 | Acquired March Networks, a global video-surveillance provider, and Universal Instruments, a leader in precision automation solutions for electronics manufacturing |
| 2022 | - Inaugurated a new facility at the Automotive Campus in Helmond, the Netherlands - Purchased land and a factory in Plano, Texas, United States |
| 2023 | Acquired TB&C, a leading provider of automotive high-voltage hybrid components |
| 2024 | - Mr. Ping Cheng selected as Chairman while concurrently serves as CEO - Adjusted business categories into Power Electronics, Mobility, Automation, and Infrastructure |
| 2025 | - Inaugurated new North East Asia HQ in Tokyo - Acquired ACT Genomics and Noda RF Technologies |
Sourc : Company data, Morgan Stanl y R s arch
Product offerings
Delta's key offerings can be categorized into four key areas: Power Electronics, Infrastructure, Mobility, and Automation.
1. Power Electronic
Delta operates in switching power supplies, thermal management, and passive components, supplying products for ICT, cloud computing, EVs, and industrial and commercial applications. The company frames its business around energy efficiency and M Asia Pacific Insight sustainability and now also offers grid to chip power and thermal management solutions for data centers.
- Components: Includes essential passive and magnetic components used in portable devices, AI cloud computing, automotive electronics, and IoT.
- Power and System: Contains power products and systems for AI, cloud computing, IoT, client devices, and industrial, medical, lighting, e mobility, and electrical appliance applications.
- Fans and Thermal Management: This mainly covers air and liquid cooling solutions for AI cloud and edge computing, EVs, as well as industrial, commercial, and residential sectors. Key products includes DC and EC fans, thermal modules, liquid cooling cold plates, and coolant distribution units, etc.
Exhibit 102:D lta: K y off rings for th pow r l ctronics s gm nt
Sourc : Company data, Morgan Stanl y R s arch
2. Infra tructure
Delta supplies ICT and energy infrastructure to support demand related to AI, smart cities, and IoT. Its ICT infrastructure solutions target data centers and telecom networks, while its energy infrastructure offerings integrate AIoT, power conversion, and microgrid control across energy generation, storage, and management.
- ICT Infrastructure: It mainly provides infrastructure for AI computing and 5G
M Asia Pacific Insight
communications under this category, ranging from telecom cell sites to data centers. The portfolio includes power, air and liquid cooling, networking equipment, and management software.
- Energy Infrastructure: The company offers renewable energy, AIoT based energy management, and power conversion technologies for low carbon transformation. Solutions include solar inverters, wind power converters, energy storage, EV charging, and management platforms for smart grids. It also supplies semiconductor high voltage power supplies, automated testing instruments, and variable frequency drives for industrial processes.
- Display and Visualization: Delta's display technologies serve control rooms, public information systems, projection mapping, and exhibition or event spaces. Offerings range from large scale and 8K projection systems to integrated video wall solutions and can be customized for mission critical operations.
Exhibit 103:D lta: K y off rings for th infrastructur s gm nt
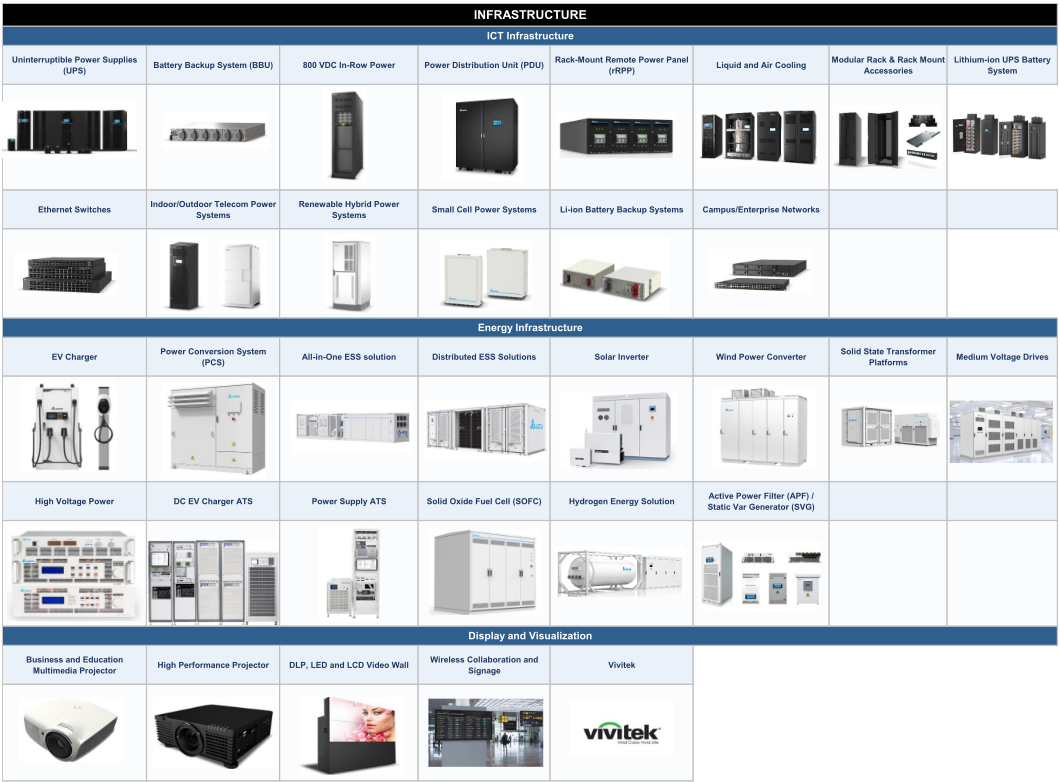
Sourc : Company data, Morgan Stanl y R s arch
3. Mobility
Delta applies its power electronics and motor technologies to smart mobility, supplying M Asia Pacific Insight power systems, drive technologies, and integrated powertrain solutions. It works with automakers to develop electric vehicles, positioning the business as part of the low carbon transition and sustainable urban mobility.
- EV Powertrain System: The company's powertrain portfolio for EV makers includes On board Charging Modules (OBCM), DC/DC converters, power electronics combos, and traction inverters, along with X in One integrated solutions.
Exhibit 104:D lta: K y off rings for th mobility s gm nt
| MOBILITY - EV Power Electronics | MOBILITY - Traction Products | MOBILITY - x-EV Power Management | MOBILITY - In-Vehicle Network and AI Driving Computing EV Powertrain System | MOBILITY - Automotive Thermal | MOBILITY - Low Voltage Powertrain | MOBILITY - EV Charging |
|---|---|---|---|---|---|---|
Sourc : Company data, Morgan Stanl y R s arch
4. Automation
Delta provides automation solutions for industrial and building applications through integrated software and hardware. Its industrial automation offerings support smart production and operational efficiency, while its building automation solutions target energy efficient, secure, and sustainable spaces.
- Industrial Automation: This segment provides automation solutions across industries by utilizing AI, big data, IoT, and digitized manufacturing models. Relevant offerings support diverse production needs, including customized, small volume and high variety production, as well as mass production.
- Building Automation: Delta's Building Automation Solutions use an IoT architecture and integrate technologies from five brands: Amerlux lighting, Delta Controls and LOYTEC IP based building control, and March Networks and VIVOTEK surveillance. The management platform enables operators to manage energy use, occupant comfort, and sustainability goals through a single interface.
M Asia Pacific Insight
Exhibit 105:D lta: K y off rings for th automation s gm nt
Sourc : Company data, Morgan Stanl y R s arch
Monthly sales vs. share price
Delta's monthly sales show that seasonality has been an important factor over the years. Following a substantial increase in monthly sales since 2024, traditional seasonal patterns have become less pronounced as revenue from AI related offerings has started to outweigh them, while liquid cooling related offerings have added a new layer of monthly sales volatility. The correlation between the company's monthly sales and share price movements has remained high, at ~87% since 2023.
The company reported August monthly sales of NT$64,586mn ( 4% MoM/+35% YoY). We saw the Power Electronics segment decline sequentially from a high base, offset by growth in Automation and slight growth in the Infrastructure segment.
Exhibit 106:D lta: Monthly sal s vs. YoY sal s growth
Exhibit 107:D lta: Monthly sal s vs. shar pric
Sourc : TEJ, Morgan Stanl y R s arch
Sourc : TEJ, Morgan Stanl y R s arch
M Asia Pacific Insight
Key management & shareholding structure
Delta's board currently consists of eight directors and five independent non executive directors. Its founder, Chung Hua Cheng (Bruce Cheng), and his sons, Ping Cheng and An Cheng, together owned a 7% stake as of March 2026. Excluding the founder and his family, the management team held a stake of ~0.1% as of March 2026.
The FINI holding percentage as of July 14, 2026, was 63%, versus a previous peak of 78% in February 2011 and a historical average (since 2010) of 69%.
Exhibit 108:D lta: Shar holding structur
| Shareholders | % |
|---|---|
| Dejico International LTD | 10.30% |
| Deltron Holding LTD | 8.40% |
| New Labor Retirement Pension Fund | 3.75% |
| Chung-Hua Cheng (Bruce CH Cheng)* | 3.15% |
| Government of Singapore-GOS-EFM C | 2.28% |
| Ping Cheng* | 2.14% |
| An Cheng (Victor Cheng)* | 1.94% |
| Yuanta/P-shares Taiwan Top 50 ETF | 1.43% |
| Labor Retirement Reserve Fund (The Old Fund) | 1.42% |
| Labor Insurance Fund | 1.32% |
| Total | 36.13% |
Sourc : Company data, Morgan Stanl y R s arch. Not : Data as of March 2026. (*) ar shown as insid rs.
Exhibit 109:D lta: FINI holdings vs. shar pric sinc 2010
Exhibit 110:D lta: FINI holdings vs. shar pric sinc 2023
Sourc : TEJ, Morgan Stanl y R s arch. Not : Data as of Oct 5, 2026
Sourc : TEJ, Morgan Stanl y R s arch. Not : Data as of Oct 5, 2026
M Asia Pacific Insight
Exhibit 111: D lta: Manag m nt profil s
| Name | Title | Education | Work Experience |
|---|---|---|---|
| Bruce C.H. Cheng | Founder and Honorary Chairman Chairman, Delta Electronics Foundation | Bachelor of Electrical Engineering - National Cheng Kung University | - 2012-present - Honorary Chairman, Delta Electronics - 1990-present - Founded and chairs the Delta Electronics Foundation - 1971-2012 - Founder and Chairman, Delta Electronics - Before 1971 - Worked at TRW and Air Asia Co. |
| Ping Cheng | Chairman and CEO | Bachelor of Business Administration - California State University, East Bay | - Joined Delta in 1988 - 2024-present - Chairman - 2012-present - CEO of Delta Electronics - 2010-2012 - Corporate Senior Vice President and President of China Region - 2008-2010 - Senior Vice President & General Manager of Power Supply Business Group - 1998-2008 - Deputy General Manager of Component Business Group (Delta China); Executive Vice President of China Region |
| Mark Ko | Vice Chairman | Bachelor of Control Engineering - National Chiao Tung University | - Joined Delta in 1988 - 2012-present - Vice Chairman of Delta Electronics - 2004-2012 - President and Chief Operating Officer of Delta Group - 1994-2004 - General Manager of Power System Business Group - Joined Delta in 1981 |
| Simon Chang | Board Member President and COO | EMBA - Chung Yuan Christian University | - 2017-present - Board Member; President and Chief Operating Officer, Delta Electronics - Before 2017 - Senior Vice President and General Manager of Industrial Automation Business Group - From 1995 - Director of Industrial Automation Division |
| Victor Cheng | Board Member CEO of Delta Electronics (Thailand) PCL. | -Master of Electrical Engineering - Santa Clara University -Bachelor of Electrical Engineering - Santa Clara University | - Joined Delta in 1993 - 2024-present - Board Member of Delta; CEO of Delta Electronics (Thailand) PCL. - 2023-2024 - Executive Vice President of Infrastructure Business - 2017-2023 - General Manager of Information and Communications Technology Business Group - 2014-2017 - General Manager of Power System Business Group - 2002-2019 - President, then Chairman of Delta Networks - 1999-2002 - Head of Video Display Business Unit - 1993-1999 - International Sales Director to Assistant General Manager of Video |
| Shan-Shan Guo | Board Member Chief Brand Officer Vice Chairman, Delta Electronics Foundation | - Master of Marketing and Communications - University of Michigan - Bachelor of Foreign Languages and Literatures - National Taiwan University | Display Business Unit - Joined Delta in 2010 - 2011-present - Chief Brand Officer of Delta |
| Johnson Lee | Executive Vice President Infrastructure Business (IFB) | - EMBA - National Taiwan University - Bachelor of Industrial Engineering and Systems Management - Feng Chia University | - Joined Delta in 1985 - 2024-present - Executive Vice President of Infrastructure Business - 2012-2017 - Chief Operating Officer of Delta Electronics - 2004-2012 - General Manager of Power Supplies Business Group - Earlier - Procurement manager; General Manager of materials management |
| Ted Shyy | Executive Vice President Power Electronics Business (PEB) | Master in Materials Science and Engineering - National Cheng Kung University | - Joined Delta in 1988 - 2024-present - Executive Vice President of Power Electronics Business - 2014-present - Chief Executive Officer of Cyntec (concurrent role) - 2011-2014 - General Manager of Delta Components Business Group - 2003-2014 - General Manager of Cyntec - 1991-2003 - Rotation in Research and Development, production and marketing, under Cyntec, a joint venture between Delta and Japan's SUSUMU |
| James Tang | Executive Vice President Mobility Business (EVB) | - EMBA - National Taiwan University - Bachelor of Management Science - National Cheng Kung University | - Joined Delta in 1988 - 2024-present - Executive Vice President of Mobility Business; continues as General Manager of Electric Vehicle Solutions Business Group - 2017-present - General Manager of Electric Vehicle Solutions Business Group - 2008-2016 - General Manager across Power Supplies, Consumer and Lighting Solutions, and Embedded Power Supplies business groups - 1988-2008 - Procurement; Materials Manager; Director of Personal Computer Business Group |
| Jimmy Yiin | Executive Vice President Global Business Operations (GBO) | Master of Business Administration - National Taiwan University and Fudan University | - Joined Delta in 1992 - 2023-present - Executive Vice President of Global Business Operations - 2019-2022 - General Manager of Power System Business Group - 2014-2019 - Vice Chairman of Delta Greentech (China); General Manager of Delta Electronics (Shanghai) - 2008-2013 - General Manager of Delta Electronics (Jiangsu) - 1999-2007 - Purchasing manager/materials section chief of Delta Dongguan and Delta Networks - Joined Delta in 1987; ~40 years of experience in the manufacturing field |
| Rock Huang | Executive Vice President Global Manufacturing | Master of Industrial Engineering and Management - National Taipei University of Technology | - 2026-present - Executive Vice President of Global Manufacturing - 2020-2026 - President of Global Manufacturing - 2019-2020 - President of Delta China - 2018-2019 - Executive Vice President of Delta China |
Sourc : Company data, Morgan Stanl y R s arch
- 2007-2018 - General Manager of Southern China, leading Dongguan team M Asia Pacific Insight
Risk Reward - Lite-On Technology (23 1.TW) Risk Reward - Lite-On Technology (2301.TW)
Stronger ASIC server power supply but fair risk-reward
NT$315.00 PRICE TARGET
Base case: P/E multiple of 17x based on average 2027-28 EPS. We believe our target multiple is justified by the 47% earnings CAGR we estimate for 2025-28, implying a PEG of 0.4, versus the stock's 16x P/E and 2% earnings CAGR during 2022-25, which implied a PEG of 7.2.
NT$300.50
Key: Historical Stock Performance Current Stock Price Price Target
Source: Refinitiv, Morgan Stanley Research
BULL CASE
BASE CASE
EQUAL-WEIGHT THESIS
- ▪We expect Lite-On Tech to benefit from strong AI server power demand in 2026-27, with the company gaining more traction on ASIC platforms.
- ▪We are mindful of weakness in consumer/IT demand amid rising input costs, which could weigh on Lite-On Tech's profit in 2026-27.
- ▪Liquid-cooling sidecar CDU system shipments may take more time to ramp up.
Risk Reward Themes
Negative
Positive
Contrarian: New Data Era: Technology Diffusion: Positive
View descriptions of Risk Rewards Themes here
BEAR CASE
27x average 2027-28e P/E
Better-than-expected margin expansion: Operating efficiency and accelerating production automation drive margin expansion, while new-business revenue comes in earlier than expected. Growth in cloud computing and automotive electronics is stronger than expected.
17x average 2027-28e P/E
AI server projects progress, but some business uncertainties remain: We expect margin improvement from a better product mix as AI server power supply projects ramp up. However, we are mindful of weakness in consumer/IT demand amid rising input costs.
NT$200.00
11x average 2027-28e P/E
Operating margin contraction: Operating efficiency improves less than expected, while pricing competition intensifies amid macro volatility; automotive electronics take longer to ramp up.
NT$500.00
NT$315.00
M Asia Pacific Insight
Risk Reward - Lite-On Technology (2301.TW)
KEY EARNINGS INPUTS
| Drivers | Dec 2025 | Dec 2026eDec | 2027eDec | 2028e |
|---|---|---|---|---|
| Opto-electronics OPM (%) | 8.3 | 7.9 | 7.5 | 7.5 |
| Information Technologies OPM (%) | 9.2 | 7.7 | 7.8 | 8.6 |
| Opto-electronics revenue YoY (%) | 0.2 | 8.0 | 1.7 | 2.3 |
| Information Technologies revenue YoY (%) | 7.7 | (5.2) | 0.5 | (0.2) |
INVESTMENT DRIVERS
- LED adoption (outdoor lighting/auto)
- Margin expansion
- Raw material prices, particularly for steel and copper
GLOBAL REVENUE EXPOSURE
Source: Morgan Stanley Research Estimate View explanation of regional hierarchies here
MS ALPHA MODELS
| 2/5 | 3 Month |
|---|---|
| MOST | Horizon |
Source: Refinitiv, FactSet, Morgan Stanley Research; 1 is the highest favored Quintile and 5 is the least favored Quintile
RISKS TO PT/RATING RISKS TO UPSIDE
- Stronger optical business growth
- Stronger data center/server demand
- PC/NB demand growth
- Downtrend in raw material prices
RISKS TO DOWNSIDE
- Macro demand weakness
- Weaker data center/server demand
- PC/NB demand slowdown
- Uptrend in raw material prices
OWNERSHIP POSITIONING
Inst. Owners, % Active
65.2%
Source: Refinitiv, Morgan Stanley Research
MS ESTIMATES VS. CONSENSUS
Morgan Stanley Estimates
Source: Refinitiv, Morgan Stanley Research M Asia Pacific Insight
Financial Summary - Lite-On
Exhibit 112:Financial Summary - Lit -On
Consolidated Income Statement
Consolidated Cash Flow Statement
2026E 2027E 2028E NT$ mn
137,134 166,085 224,829 297,964 357,670 Cash flow from Operations
-107,504 -128,046 -168,703 -219,712 -259,785 Net profits
29,630 38,039 56,126 78,252 97,885 Depreciation + Amortization
-8,782 -10,247 Disposal of Investment
-9,340 -10,162 Working Capital Change
-8,721 -11,787 -15,037 -17,200 Other adjustments
2,500 Cash flow from Investing
800 Capex
1,200 Change of LT investment
0 Other adjustments
15,635 19,713 32,958 47,563 62,740 Cash flow from financing
11,942 15,116 25,187 36,337 47,947 Cash Dividend Paid
| NT$ mn | 2024 | 2025 | 2026E | 2027E | 2028E |
|---|---|---|---|---|---|
| Net sales | 137,134 | 166,085 | 224,829 | 297,964 | 357,670 |
| COGS | -107,504 | -128,046 | -168,703 | -219,712 | -259,785 |
| Gross profit | 29,630 | 38,039 | 56,126 | 78,252 | 97,885 |
| Operating expenses | -16,648 | -21,301 | -26,044 | -33,189 | -37,645 |
| - Promotion | -5,184 | -7,629 | -6,902 | -8,782 | -10,247 |
| - ADM | -3,990 | -4,965 | -7,384 | -9,340 | -10,162 |
| - R&D | -7,476 | -8,721 | -11,787 | -15,037 | -17,200 |
| Operating income | 12,981 | 16,738 | 30,082 | 45,063 | 60,240 |
| Non-operating income | 2,653 | 2,975 | 2,876 | 2,500 | 2,500 |
| Interest income | 1,491 | 1,119 | 799 | 800 | 800 |
| Investment income | 2,808 | -956 | 1,436 | 1,200 | 1,200 |
| Disposal of investment | 75 | -537 | -77 | 0 | 0 |
| Exchange gain | 2,808 | 1,091 | 1,390 | 0 | 0 |
| Other | -4,528 | 2,258 | -672 | 500 | 500 |
| Pre-tax income | 15,635 | 19,713 | 32,958 | 47,563 | 62,740 |
| Income tax | -3,674 | -4,601 | -7,767 | -11,227 | -14,793 |
| Minority | 19 | -4 | 3 | 0 | 0 |
| Reported net income | 11,942 | 15,116 | 25,187 | 36,337 | 47,947 |
| EPS (NT$) | 5.21 | 6.64 | 11.07 | 15.97 | 21.07 |
Consolidated Balance Sheet
| NT$ mn | 2024 | 2025 | 2026E | 2027E | 2028E |
|---|---|---|---|---|---|
| Cash flow from Operations | 12,411 | 14,533 | 34,885 | 43,140 | 51,224 |
| Net profits | 11,942 | 15,116 | 25,187 | 36,337 | 47,947 |
| Depreciation + Amortization | 4,047 | 3,668 | 3,994 | 4,065 | 4,137 |
| Inv. Gain/Loss ( Equity ) | -15 | -86 | 0 | 0 | 0 |
| Disposal of Investment | 9 | 568 | 0 | 0 | 0 |
| Working Capital Change | -3,886 | -2,099 | -12,395 | -12,092 | -10,109 |
| Other adjustments | 313 | -2,635 | 18,098 | 14,830 | 9,248 |
| Cash flow from Investing | -4,843 | -7,395 | -13,287 | -8,993 | -11,919 |
| Capex | -3,283 | -6,795 | -13,287 | -8,993 | -11,919 |
| Change of LT investment | -2,234 | -43 | 0 | 0 | 0 |
| Change of ST investment | 1,453 | -417 | 0 | 0 | 0 |
| Other adjustments | -779 | -140 | 0 | 0 | 0 |
| Cash flow from financing | -3,363 | -23,099 | -19,866 | -28,659 | -37,818 |
| Increase in L/T debt | 0 | 0 | 0 | 0 | 0 |
| Increase in S/T debt | 7,584 | -10,116 | 0 | 0 | 0 |
| Cash Dividend Paid | -10,372 | -10,297 | -19,866 | -28,660 | -37,818 |
| Issuance of stock | 0 | 0 | 0 | 0 | 0 |
| Other adjustments | -574 | -2,686 | 0 | 0 | 0 |
| Exchange rate adjustment | 3,736 | -3,748 | 0 | 0 | 0 |
| Net change in cash | 7,942 | -19,709 | 1,732 | 5,487 | 1,487 |
Consolidated Financial Ratios
1,009 Gross margin
37,182 42,318 60,960 80,790 96,978 Operating margin
26,817 34,262 42,083 54,807 64,804 Pretax margin
5,458 Net margin
7,748 YoY growth
2,246 Operating profits
1,710 Pretax profits
3,860 Net profits
30,187 20,029 20,029 20,029 20,029 Net Debt/Equity
3,000 ROAA
3,111 AR/NR Turnover (days)
113,772 115,709 147,875 183,167 208,491 AP/NP Turnover (days)
23,473 23,168 23,168 23,168 23,168 Cash conversion cycle (days)
| NT$ mn | 2024 | 2025 | 2026E | 2027E | 2028E |
|---|---|---|---|---|---|
| Cash | 100,684 | 80,974 | 82,706 | 88,193 | 89,680 |
| Mkt Securities | 933 | 1,009 | 1,009 | 1,009 | 1,009 |
| AR/NR | 37,182 | 42,318 | 60,960 | 80,790 | 96,978 |
| Inventory | 26,817 | 34,262 | 42,083 | 54,807 | 64,804 |
| Others | 3,501 | 5,458 | 5,458 | 5,458 | 5,458 |
| Current Assets | 169,117 | 164,021 | 192,216 | 230,257 | 257,928 |
| Long-term investments | 8,195 | 7,748 | 7,748 | 7,748 | 7,748 |
| Fixed assets | 18,776 | 24,752 | 34,495 | 39,873 | 48,104 |
| Deferred Asset | 1,628 | 2,246 | 2,246 | 2,246 | 2,246 |
| Intangible Assets | 3,156 | 3,060 | 2,610 | 2,160 | 1,710 |
| Other assets | 3,811 | 3,860 | 3,860 | 3,860 | 3,860 |
| Total Assets | 204,683 | 205,687 | 243,175 | 286,144 | 321,597 |
| S/T borrowings | 30,187 | 20,029 | 20,029 | 20,029 | 20,029 |
| AP/NP | 43,126 | 53,608 | 67,676 | 88,138 | 104,213 |
| Other ST liabilities | 34,556 | 35,960 | 54,059 | 68,888 | 78,137 |
| Total Current Liabilities | 107,869 | 109,597 | 141,764 | 177,056 | 202,379 |
| LT debt(include CB) | 3,000 | 3,000 | 3,000 | 3,000 | 3,000 |
| Other LT liabilities | 2,903 | 3,111 | 3,111 | 3,111 | 3,111 |
| Total Liabilities | 113,772 | 115,709 | 147,875 | 183,167 | 208,491 |
| Common shares | 23,473 | 23,168 | 23,168 | 23,168 | 23,168 |
| Retained Earnings | 46,277 | 42,393 | 47,714 | 55,390 | 65,519 |
| Other shareholders' equity | 21,161 | 24,418 | 24,418 | 24,418 | 24,418 |
| Total Equity | 90,911 | 89,979 | 95,300 | 102,976 | 113,105 |
| Total Liab. & Shldr's Equity | 204,683 | 205,687 | 243,175 | 286,143 | 321,596 |
| 2024 | 2025 | 2026E | 2027E | 2028E | |
|---|---|---|---|---|---|
| Margins | |||||
| Gross margin | 21.6% | 22.9% | 25.0% | 26.3% | 27.4% |
| Operating margin | 9.5% | 10.1% | 13.4% | 15.1% | 16.8% |
| Pretax margin | 11.4% | 11.9% | 14.7% | 16.0% | 17.5% |
| Net margin | 8.7% | 9.1% | 11.2% | 12.2% | 13.4% |
| YoY growth | |||||
| Sales | -7.6% | 21.1% | 35.4% | 32.5% | 20.0% |
| Operating profits | -10.6% | 28.9% | 79.7% | 49.8% | 33.7% |
| Pretax profits | -14.9% | 26.1% | 67.2% | 44.3% | 31.9% |
| Net profits | -18.0% | 26.6% | 66.6% | 44.3% | 32.0% |
| EPS | -18.1% | 27.5% | 66.6% | 44.3% | 32.0% |
| Net Debt/Equity | -75.3% | -65.5% | -63.7% | -64.3% | -59.8% |
| Liabilities/Equity | 125.1% | 128.6% | 155.2% | 177.9% | 184.3% |
| Liabilities/Assets | 55.6% | 56.3% | 60.8% | 64.0% | 64.8% |
| ROAE | 13.6% | 16.7% | 27.2% | 36.7% | 44.4% |
| ROAA | 6.1% | 7.4% | 11.2% | 13.7% | 15.8% |
| AR/NR Turnover (days) | 92.2 | 87.4 | 83.8 | 86.8 | 90.7 |
| AP/NP Turnover (days) | 142.7 | 137.9 | 131.2 | 129.4 | 135.1 |
| Inventory Turnover (days) | 89.3 | 87.1 | 82.6 | 80.5 | 84.0 |
| Cash conversion cycle (days) | 38.9 | 36.5 | 35.2 | 37.9 | 39.6 |
Sourc : Company data, Morgan Stanl y R s arch. E = Morgan Stanl y R s arch stimat s M Asia Pacific Insight Sourc : Company data, Morgan Stanl y R s arch. E = Morgan Stanl y R s arch stimat s M Asia Pacific Insight
Exhibit 113:Lit -on: Quart rly Financials
| NT$ mn | 1Q25 | 2Q25 | 3Q25 | 4Q25 | 1Q26 | 2Q26 | 3Q26E | 4Q26E | 2025 | 2026E | 2027E |
|---|---|---|---|---|---|---|---|---|---|---|---|
| Net sales | 36,417 | 40,421 | 44,891 | 44,356 | 43,407 | 52,703 | 59,526 | 69,193 | 166,085 | 224,829 | 297,964 |
| COGS | -28,195-31,479-33,648-34,724-34,004-38,355-44,867-51,477 | -128,046-168,703-219,712 | |||||||||
| Gross profit | 8,222 | 8,942 | 11,243 | 9,633 | 9,403 | 14,348 | 14,659 | 17,716 | 38,039 | 56,126 | 78,252 |
| Operating expenses | -4,546 | -5,215 | -6,560 | -4,980 | -5,304 | -6,146 | -6,851 | -7,743 | -21,301 | -26,044 | -33,189 |
| - Promotion | -1,532 | -2,051 | -2,535 | -1,512 | -1,500 | -1,623 | -1,786 | -1,993 | -7,629 | -6,902 | -8,782 |
| - ADM | -998 | -1,048 | -1,792 | -1,127 | -1,457 | -1,783 | -1,964 | -2,180 | -4,965 | -7,384 | -9,340 |
| - R&D | -2,023 | -2,110 | -2,244 | -2,345 | -2,341 | -2,787 | -3,095 | -3,563 | -8,721 | -11,787 | -15,037 |
| Operating income | 3,675 | 3,727 | 4,683 | 4,653 | 4,099 | 8,203 | 7,807 | 9,973 | 16,738 | 30,082 | 45,063 |
| Non-operating income | 994 | 536 | 886 | 560 | 871 | 1,166 | 445 | 395 | 2,975 | 2,876 | 2,500 |
| Net interest income | 424 | 323 | 184 | 188 | 214 | 195 | 195 | 195 | 1,119 | 799 | 800 |
| Net investment income | 596 | -3,235 | 1,389 | 293 | 99 | 1,237 | 50 | 50 | -956 | 1,436 | 1,200 |
| Net gain of investment disposal | 137 | -702 | 23 | 5 | 1 | -78 | 0 | 0 | -537 | -77 | 0 |
| Exchange gain | 379 | 2,540 | -751 | -122 | 284 | 1,106 | 0 | 0 | 1,091 | 1,390 | 0 |
| Others | -542 | 1,609 | 41 | 195 | 272 | -1,295 | 200 | 150 | 2,258 | -672 | 500 |
| Pre-tax income | 4,669 | 4,262 | 5,569 | 5,213 | 4,970 | 9,368 | 8,252 | 10,368 | 19,713 | 32,958 | 47,563 |
| Income tax | -1,214 | -1,108 | -924 | -1,355 | -1,195 | -2,248 | -1,939 | -2,385 | -4,601 | -7,767 | -11,227 |
| Net income | 3,456 | 3,155 | 4,645 | 3,860 | 3,775 | 7,116 | 6,313 | 7,983 | 15,116 | 25,187 | 36,337 |
| EPS (NT$) | 1.51 | 1.39 | 2.05 | 1.70 | 1.66 | 3.14 | 2.77 | 3.51 | 6.64 | 11.07 | 15.97 |
| Margins | |||||||||||
| Gross margin | 22.6%22.1%25.0%21.7%21.7%27.2%24.6%25.6% | 22.9%25.0%26.3% | |||||||||
| Operating margin | 10.1% | 9.2% | 10.4% | 10.5% | 9.4% | 15.6% | 13.1% | 14.4% | 10.1% | 13.4% | 15.1% |
| Pre-tax margin | 12.8%10.5%12.4%11.8%11.4%17.8%13.9%15.0% | 11.9%14.7%16.0% | |||||||||
| Net margin | 9.5% | 7.8% | 10.3% | 8.7% | 8.7% | 13.5% | 10.6% | 11.5% | 9.1% | 11.2% | 12.2% |
| QoQ Growth | |||||||||||
| Sales | -4.9% | 11.0% | 11.1% | -1.2% | -2.1% | 21.4% | 12.9% | 16.2% | |||
| Gross profit | 1.0% | 8.8% | 25.7% | -14.3% | -2.4% | 52.6% | 2.2% | 20.9% | |||
| Operating profit | 5.1% | 1.4% | 25.7% | -0.6% | -11.9% | 100.1% | -4.8% | 27.7% | |||
| Pre-tax profit | 17.1% | -8.7% | 30.7% | -6.4% | -4.7% | 88.5% | -11.9% | 25.6% | |||
| Net profit | 13.3% | -8.7% | 47.2% | -16.9% | -2.2% | 88.5% | -11.3% | 26.5% | |||
| YoY Growth | |||||||||||
| Sales | 26.6%21.4%22.1%15.8%19.2%30.4%32.6%56.0% | 21.1%35.4%32.5% | |||||||||
| Gross profit | 40.6%21.0%36.3%18.3%14.4%60.5%30.4%83.9% | 28.4%47.5%39.4% | |||||||||
| Operating profit | 64.8%13.6%19.3%33.1%11.5%120.1%66.7%114.3% | 28.9%79.7%49.8% | |||||||||
| Pre-tax profit | 49.2% | 4.4% | 25.6% | 30.7% | 6.4% | 119.8% | 48.2% | 98.9% | 26.1% | 67.2% | 44.3% |
| Net profit | 44.7% | 1.3% | 37.0% | 26.6% | 9.3% | 125.5% | 35.9% | 106.8% | 26.6% | 66.6% | 44.3% |
Valuation Methodology - Lite-On
Our price target (ba e ca e cenario value) i NT$315, derived from 17x 2027-28e P/E:
We use price/earnings as our valuation methodology because we believe it appropriately captures Lite On's earnings growth potential. We believe our target P/E multiple of 17x is justified by an earnings CAGR of 47% over 2025 28, implying a PEG of 0.4. This is lower than the average PEG of 7.2 in 2022 25, when the stock was trading at an average P/E of 16x for a 2% earnings CAGR.
Bull ca e cenario value - NT$500: We apply a 27x P/E multiple to our average base case estimate for 2027 28. This scenario assumes better than expected margin expansion, driven by improved operating efficiency and accelerating production automation, while new business revenue comes in earlier than expected. Growth in cloud computing and automotive electronics is stronger than expected.
Bear ca e cenario value - NT$200: We apply an 11x P/E multiple to our average base case estimate for 2027 28. This scenario assumes weaker than expected improvement in operating efficiency, while pricing competition intensifies amid macro volatility; automotive electronics take longer to ramp up.
Exhibit 114:Lit -on: NTM P/E
Sourc : FactS t cons nsus stimat s, Morgan Stanl y R s arch M Asia Pacific Insight
Global Footprint - Lite-On
More capacity expansion to come
Lite On's production footprint spans the globe, with 15 sites in total, although it remains heavily weighted toward China. The company has been expanding aggressively, both to meet strong demand for AI power supplies and to support its strategy of geographic risk diversification and proximity to customers.
Looking at its expansion plans in recent years, the company has continued to demonstrate its commitment to diversifying production away from China and increasing proximity to customers. It completed its Thailand plant expansion and announced the second phase expansion of its Vietnam facility in 2021. It then established automotive electronics and cloud power production lines in Dallas, Texas, in 2H22, along with the official launch of the second phase of its Hai Phong plant in Vietnam, which focuses on networking and consumer products. In 2023, it began expanding its second Kaohsiung plant and announced additional capacity expansion in Vietnam. In 2024, it committed a further US $120mn to establish a wholly owned subsidiary in Vietnam and began progressively shifting production of high end power products to that facility. In 2025, the company aimed to double capacity as demand for AI server power supplies and battery backup units (BBUs) surged, focusing primarily on capacity expansion in the US, Kaohsiung, and Vietnam.
For 2026, the company expects capacity allocation of ~40% in China, 27% in Vietnam, 20% in Taiwan, and 10% in the US, with the remaining non China footprint (i.e., Mexico, Brazil, and Thailand) accounting for ~3% of total capacity. It has also announced investments of US$919mn and US$149mn in its US and Vietnam subsidiaries, respectively, to continue expanding power related capacity, mainly for PSUs. The capex budget for 2026 has also been raised to ~NT$13bn, versus ~NT$7bn in 2025.
Exhibit 115:Lit -on's global footprint
Sourc : Lit -on.
M Asia Pacific Insight
Financial Analysis - Lite-On
29% revenue CAGR in 2025-28
Lite On's revenue growth was relatively moderate during 2020 22, with revenue expanding at a CAGR of 5% over the period. The company benefited from surging cloud computing demand, which drove increasing demand for power supplies, along with rising demand from EV/automotive electronics, although growth was offset by elevated component costs and supply chain disruptions during COVID 19. Revenue then fell by 14% in 2023 and 8% in 2024 due to a post pandemic demand pullback across the consumer electronics market and PC/NB model transitions, coupled with softening demand from EV related businesses. The IT segment declined 20%/11% YoY, while the opto electronics segment declined 11%/9% YoY in 2023/2024, respectively.
Revenue rebounded in 2025, growing 21% YoY, as the company began to benefit from surging demand for AI/cloud server power supplies. Contributions from ramping high voltage/AI power infrastructure products began to increase, coupled with a partial recovery in the IT segment, mainly fueled by power adapter shipments for game consoles and gaming PCs/NBs, as well as related power offerings for low Earth orbit applications.
Looking ahead, we estimate revenue to expand at a 29% CAGR in 2025 28e, driven by the AI server power demand boom, while we remain mindful of weakness in consumer/IT demand amid elevated component costs.
By product segment, IT related products were the primary revenue driver in past years, while 2025 marked a crossover point, with the contribution from the Cloud & AIoT segment surpassing that of the IT segment, mainly supported by AI power related offerings. IT revenue contribution declined from 72% in 2020 to 38% in 2025, and we estimate it will reach 17% by 2028. For the Cloud & AIoT segment, revenue contribution grew substantially from 27% in 2021 (0% in 2020) to 45% in 2025; we estimate it will account for 74% of total revenue by 2028, on the back of surging AI power related demand. For opto electronics, we expect revenue contribution to decline from 17% in 2025 to 9% in 2028.
Exhibit 116:Lit -on: R v nu CAGR, 2025-28
Exhibit 117:Lit -on: Annual r v nu growth
Sourc : Company data, Morgan Stanl y R s arch. E = Morgan Stanl y R s arch stimat s
Sourc : Company data, Morgan Stanl y R s arch. E = Morgan Stanl y R s arch stimat s M Asia Pacific Insight
Exhibit 118:Lit -on: Cloud & AIoT r v nu
Sourc : Company data, Morgan Stanl y R s arch. E = Morgan Stanl y R s arch stimat s
Exhibit 120:Lit -on: IT r v nu
Sourc : Company data, Morgan Stanl y R s arch. E = Morgan Stanl y R s arch stimat s Sourc : Company data, Morgan Stanl y R s arch. E = Morgan Stanl y R s arch stimat s Sourc : Company data, Morgan Stanl y R s arch. E = Morgan Stanl y R s arch stimat s
Exhibit 119:Lit -on: Opto- l ctronics r v nu
Exhibit 121:Lit -on: R v nu br akdown by s gm nt
Continuing margin expansion
Lite On's gross margin rose steadily over the years, from 17.4% in 2020 to 22.0% in 2023, thanks to a continually improving product mix. Gross margin dipped to 21.6% in 2024, mainly due to a smaller revenue base, while contributions from AI/cloud had yet to scale and margins were weighed down by learning curve costs at the new Vietnam site. It then rose to 22.9% in 2025 as the AI server power business began to scale alongside rising BBU (battery backup unit) shipments, resulting in a more favorable product mix.
The opex ratio was largely stable at 10.5 11.0% during 2020 22. It then increased to 12.2% in 2023 and 12.1% in 2024, mainly due to operating deleverage and higher R&D costs. The opex ratio edged up further to 12.8% in 2025, mainly due to ongoing investment in R&D to support new business development in AI server power supplies, BBUs, liquid cooling, etc., along with a one off tariff prepayment.
Looking ahead, we expect margins to continue expanding on a favorable product mix. We now pencil in a 2.1ppt gross margin improvement in 2026 to 25.0%, followed by expansions of 1.3ppt and 1.1ppt in 2027 and 2028, to 26.3% and 27.4%, respectively. For the opex ratio, we expect it to decline sequentially as the revenue base expands. Accordingly, we estimate operating margin to improve by 3.3ppt to 13.4% in 2026, followed by expansions of 1.7ppt in both 2027 and 2028, reaching 15.1% and 16.8%.
M Asia Pacific Insight
Exhibit 122:Lit -on: Margin tr nd
Sourc : Company data, Morgan Stanl y R s arch. E = Morgan Stanl y R s arch stimat s Sourc : Company data, Morgan Stanl y R s arch. E = Morgan Stanl y R s arch stimat s
Exhibit 123:Lit -on: Op x ratio
Net profit to grow at a 47% CAGR in 2025-28
Operating profit grew steadily alongside gross margin expansion during 2020 22, from NT $10,206mn to NT$15,073mn. It then fell 4% YoY in 2023 and a further 11% YoY in 2024 due to higher operating expenses, mainly from R&D costs, despite gross margin expansion in 2023. Operating margin increased by 1.1ppt YoY to 9.8% in 2023 amid a smaller revenue base, before declining by 0.3ppt YoY to 9.5% in 2024 on lower gross margin and an elevated opex ratio.
Operating profit rebounded by 29% YoY to NT$16,738mn in 2025, supported by both an expanding revenue base and strengthening gross margin. Operating margin also improved, increasing by 0.6ppt YoY to 10.1%, as the recovery in gross margin was partly offset by higher opex.
With the tax rate remaining relatively stable at 20 24%, Lite On's net profit growth has generally tracked its operating profit growth. An exception occurred in 2023, when net profit grew 3% YoY despite a 4% decline in operating profit, mainly due to higher FX gains during the year.
Net margin has broadly tracked operating margin in recent years. It reached a record high of 9.8% in 2023 on improving gross margin, despite a higher opex ratio. It then declined to 8.7% in 2024 on gross margin erosion before rebounding to 9.1% in 2025, benefiting from increasing demand for AI power supplies.
Looking ahead, we forecast net profit to grow 67% YoY in 2026e, followed by 44% YoY growth in 2027e and 32% YoY growth in 2028e, implying a 47% CAGR in 2025 28e. Net margin is likely to rise to 11.2% in 2026, 12.2% in 2027, and 13.4% in 2028.
M Asia Pacific Insight
Exhibit 124:Lit -on: 35% CAGR for op rating profit in 2024-27
Sourc : Company data, Morgan Stanl y R s arch. E = Morgan Stanl y R s arch stimat s
Exhibit 126:Lit -on: N t profit tr nd
Sourc : Company data, Morgan Stanl y R s arch. E = Morgan Stanl y R s arch stimat s
ROE to rise
ROE movements were highly correlated with changes in net margin during 2020 22, as asset turnover and financial leverage were largely stable over the period. ROE edged down slightly in 2023 despite higher net margin, which increased from 8.2% to 9.8%, due to lower asset turnover and financial leverage. ROE fell further to a trough of 13.1% in 2024 as net margin and asset turnover declined further. It then rebounded to 16.8% in 2025, primarily supported by net margin expansion, fueled by a favorable product mix, along with an improvement in asset turnover back to the 80% level.
Looking ahead, we expect ROE to continue rising, reaching 26.4% in 2026, 35.3% in 2027, and 42.4% in 2028, primarily driven by continued margin expansion and improving asset turnover. Net margin is projected to increase from 9.1% in 2025 to 13.4% by 2028, supported by gross margin improvement from 22.9% to 27.4% and a decline in the operating expense ratio from 12.8% in 2025 to 10.5% in 2028.
Exhibit 125:Lit -on: Op rating margin
Sourc : Company data, Morgan Stanl y R s arch. E = Morgan Stanl y R s arch stimat s
Exhibit 127:Lit -on: N t margin
Sourc : Company data, Morgan Stanl y R s arch. E = Morgan Stanl y R s arch stimat s M Asia Pacific Insight Sourc : Company data, Morgan Stanl y R s arch. E = Morgan Stanl y R s arch stimat s Sourc : Company data, Morgan Stanl y R s arch. E = Morgan Stanl y R s arch stimat s
Exhibit 128:ROE tr nd
Exhibit 129:DuPont analysis
Improving balance sheet and continuous free cash flow generation
Lite On has consistently generated positive operating cash flow in recent years, although cash flow dropped notably in 2021, 2024, and 2025, mainly due to higher working capital related cash outflows. The company has also consistently generated positive free cash flow, with capital expenditures generally at the NT$3 4bn level over the years. An exception occurred in 2025, when capital expenditure rose to NT$6.7bn, mainly for power related capacity expansion in Vietnam, Taiwan, and the US.
As the company has announced investments of US$919mn and US$149mn in its US and Vietnam subsidiaries, respectively, alongside continued expansion of power related capacity, mainly for PSUs, we now estimate capex to rise to ~NT$13bn in 2026, versus ~NT $7bn in 2025. Capex should then decline to NT$9bn in 2027 as investment levels normalize.
Lite On's net cash position has remained relatively healthy, with its net cash to equity ratio improving from 65% in 2020 to 80% in 2023. It then declined to 75% in 2024 and 66% in 2025, as total debt increased by NT$7.7bn in 2024, while cash on hand declined in 2025, likely due to increasing capital investment.
Looking ahead, we assume the total debt position will remain stable despite ongoing capex investment. The net cash position should continue to grow sequentially on the back of positive free cash flow generation.
M Asia Pacific Insight
Exhibit 130:Lit -on: Positiv op rating cash flow
Sourc : Company data, Morgan Stanl y R s arch. E = Morgan Stanl y R s arch stimat s
Exhibit 132:Lit -on: Cap x and cap x-to-sal s ratio
Sourc : Company data, Morgan Stanl y R s arch. E = Morgan Stanl y R s arch stimat s
Exhibit 134:Lit -on: D bt position
Sourc : Company data, Morgan Stanl y R s arch. E = Morgan Stanl y R s arch stimat s
Exhibit 131:Lit -on: Improving fr cash flow g n ration
Sourc : Company data, Morgan Stanl y R s arch. E = Morgan Stanl y R s arch stimat s
Exhibit 133:Lit -on: N t cash position
Sourc : Company data, Morgan Stanl y R s arch. E = Morgan Stanl y R s arch stimat s
Exhibit 135:Lit -on: Cash on hand
Sourc : Company data, Morgan Stanl y R s arch. E = Morgan Stanl y R s arch stimat s
Lite On's average capex to sales ratio was around 2.3 2.4% during 2021 24, then rose to 4.1% in 2025 as the company began aggressively expanding global capacity, despite a larger revenue base during the year. Looking ahead, we project the capex to sales ratio to rise to 5.9% in 2026 amid continued production site development, before declining to 3.0 3.3% in 2027 28 as investments normalize.
M Asia Pacific Insight
The depreciation to sales ratio remained at 2.4 2.5% during 2020 22 before rising to 2.8% in 2023, in line with higher capex during the year. The ratio then declined to 2.1% in 2025 on a larger revenue base. Looking ahead, we expect the ratio to decline further as the revenue base grows faster than capex and depreciation, falling to 1.6% in 2026 and 1.0% in 2028.
Exhibit 136:Lit -on: D pr ciation and d pr ciation to sal s
Sourc : Company data, Morgan Stanl y R s arch. E = Morgan Stanl y R s arch stimat s
Lite On's cash conversion cycle (CCC) fluctuated within a relatively narrow band of roughly 35 44 days between 2020 and 2025, reflecting generally stable but modestly shifting working capital efficiency. CCC was at a relatively low level of 35 days in 2020, supported by lower inventory days and higher AP days, before rising steadily to 44 days in 2022 as both inventory days (78) and AR days (85) increased, while AP days were slightly lower (119). From 2023 onward, the cycle improved meaningfully, falling to 36 days as AP days extended sharply from 119 in 2022 to 135. This improvement partially reversed in 2024, with CCC ticking up to 39 days as inventory and AR days both increased to 89 and 92 days, respectively, even as AP days extended further to 143. CCC then eased again to 37 days in 2025 as AP days moderated slightly to 138, alongside stable inventory and receivables levels.
Looking ahead, we expect the overall cash conversion cycle to edge up slightly from 37 days in 2025 to 40 days in 2028, as increasing AR days and lower AP days are partially offset by improving inventory days.
M Asia Pacific Insight
Exhibit 137:Lit -on: AR days
Sourc : Company data, Morgan Stanl y R s arch. E = Morgan Stanl y R s arch stimat s
Exhibit 139:Lit -on: AP days
Sourc : Company data, Morgan Stanl y R s arch. E = Morgan Stanl y R s arch stimat s Sourc : Company data, Morgan Stanl y R s arch. E = Morgan Stanl y R s arch stimat s Sourc : Company data, Morgan Stanl y R s arch. E = Morgan Stanl y R s arch stimat s M Asia Pacific Insight
Exhibit 138:Lit -on: Inv ntory days
Exhibit 140:Lit -on: Cash conv rsion cycl
Company Background - Lite-On
Company snapshot
Founded in 1975, Lite On Technology is a Taiwan based manufacturer of optoelectronic components, power supplies, and information technology products. The company produced Taiwan's first LEDs and became the first technology company listed on the Taiwan Stock Exchange in 1983. It mainly operates through four business segments: Information Products (power supplies, servers, networking equipment, keyboards, and chassis), Optoelectronics (LED packaging, LED lighting, automotive electronic components, and camera modules), Storage (storage components), and other supporting businesses. Additional product lines include energy management solutions, such as data center power supply systems and cloud server chassis; networking and surveillance products; and automotive electronics, including ADAS and EV charging solutions.
Lite On is headquartered in Taipei, Taiwan. The company operates manufacturing sites, R&D centers, and sales offices across Asia (Taiwan, China, Japan, and Singapore), the US, and Europe (the UK, the Netherlands, and Germany).
M Asia Pacific Insight
Exhibit 141:Lit -on: K y mil ston s
| Year | Key Milestones |
|---|---|
| 1975 | Established LITEON's first LED factory in Zhonghe, Taiwan |
| 1983 | Became the first electronics company listed on the Taiwan Stock Exchange (Ticker: 2301) |
| 1985 | Began manufacturing power supply units. |
| 1989 | Opened first overseas plant in Bangkok, Thailand, for optoelectronic products. |
| 1990 | • Set up a switching power supply plant in Penang, Malaysia. • Silitek acquired Maxi Switch, the No. 3 U.S. keyboard maker. |
| 1991 | Acquired NPE's switching power supply plant in the UK. |
| 1994 | Established a subsidiary in California, USA. |
| 1999 | Spun off the Optoelectronics business unit as LITEON IT Corp. |
| 2002 | LITEON Electronics, Silitek, LITEON Technology, and GVC merged into LITEON Technology Corporation (Ticker: 2301) |
| 2003 | Moved global headquarters to Neihu Science Park. |
| 2006 | • Acquired BenQ's Optical Disk Drive business, becoming a top-3 global ODD maker. • Partnered with Philips to enter the automotive disc drive market. • Acquired 100% of LITEON Automotive Corp., expanding into automotive electronics. |
| 2007 | • Acquired 100% of Li Shin International via stock swap, strengthening power supply resources for LCD TVs and other products. • Completed tender offer for Perlos, the world's largest handset casing maker. |
| 2009 | Opened East China Regional HQ in Wujin, Changzhou. • Invested in Epyon Power, a supplier of fast-charging technology. |
| 2010 | • Completed the world's first Optoelectronic Semiconductor Carbon Footprint and Type III Environmental Product Declarations. |
| 2011 | Completed the world's first Product Category Rules for Circuit Boards. |
| 2013 | Acquired Power Innovations (US), strengthening cloud and power management capabilities. |
| 2014 | Selected for the Carbon Disclosure Project's Climate Disclosure Leadership Index. |
| 2016 | Opened a new operations center in Kaohsiung's Nanzih Export Processing Zone. |
| 2018 | Divested the mobile camera module and mechanical business to focus resources. |
| 2019 | Acquired 100% of LOJ via tender offer. |
| 2020 | • Launched succession plan: Tom Soong named as Chairman, Anson Chiu named as President. • Completed sale of the SSD business to KIOXIA Holdings. |
| 2021 | • Launched an Employee Stock Ownership Trust (ESOT). • Joined the O-RAN Alliance and launched 5G small cells. |
| 2022 | • Began reconstructing the Zhonghe office into the "LITEON Zhonghe Digitech Center." • Inaugurated Phase II of the LITEON Vietnam plant in Haiphong. |
| 2023 | Opened its first corporate store, 'LITEON Collection,' in Neihu Science Park. |
| 2024 | • Took a 19.99% strategic stake in COSEL. • Broke ground on a new low-carbon building in Kaohsiung. |
| 2025 | • Returned to COMPUTEX with next-gen AI solutions, winning the Sustainable Design Award (Bronze). • Reopened its founding Zhonghe headquarters after a three-year reconstruction. |
Sourc : Company data, Morgan Stanl y R s arch
M Asia Pacific Insight
Exhibit 142:Lit -on: Global op ration locations
Sourc : Company data
Exhibit 143:Lit -on: Global footprint
Headquarter
Taipei City, Taiwan
Sales Offices
Milpitas, California, U.S.A.
Plano, Texas, U.S.A.
Tokyo, Japan
Shanghai, China
Singapore
Hoofddorp, NL
Cramlington, Northumberland, UK
Wetzlar, DE
| Subsidiary | Entity name |
|---|---|
| American Fork, Utah, U.S.A. | Power Innovations International |
Sourc : Company data, Morgan Stanl y R s arch
Product offerings
Lite On's key offerings can be categorized into six key areas: Optoelectronic Semiconductors, Energy Management, Consumer Electronics, Networking and Surveillance, Automotive Electronics, and Roadway Intellimation System.
1. Optoelectronic emiconductor
Its product portfolio spans a broad technological range, encompassing illumination and sensing applications, low to high power devices, standard and custom made solutions, and components ranging from LEDs to lasers and from visible light to infrared and ultraviolet spectra.
Exhibit 144:Lit -on: Off rings for opto l ctronic s miconductors
Sourc : Company data, Morgan Stanl y R s arch
2. Energy management
The product range serves the communications, industrial automation, smart home, medical, office, and automotive electronics industries. It offers a comprehensive suite of platinum to titanium efficiency grade power supplies (CRPS, GPU, and SLIM series) suitable for both standard and AI servers, supporting AC or DC input with high power density, high reliability, and modular scalability. Power shelf and battery backup unit (BBU) solutions, along with rack cooling and liquid cooling technologies for data centers, cloud infrastructure, and AI/machine learning platforms, are also included in this segment.
M Asia Pacific Insight
Exhibit 145:Lit -on: Off rings for n rgy manag m nt
| Energy Management - Data Center Power Supply System CRPS / GPU / SLIM, Platinum-Titanium | Energy Management - Cloud Server Chassis Open Rack Standard V3 | Energy Management - Power Supply Module PoE / Industrial / LED Driver | Energy Management - Magnetic Components Transformers & Inductors |
|---|---|---|---|
| Includes components apply for cloud infrastructure, industrial power supply, white appliances, electric vehicle and consumer electric, etc | |||
| Server Power Networking Power | Server Rack Server Chassis | ||
| Open Compute Project | POE Injector Industrial Power Adapter LED Driver | Magnetic Components |
Sourc : Company data, Morgan Stanl y R s arch
3. Con umer electronic
This segment is committed to advancing home entertainment and office solutions through feature rich product design intended to enhance the overall user experience. Offerings include office/gaming solutions, laptop keyboard modules and touchpads, laptop power adapters, USB Type C/PD chargers, etc.
Exhibit 146:Lit -on: Off rings for consum r l ctronics
| Consumer Electronics - 3C Accessories - Office / Gaming / Laptop peripherals | Consumer Electronics - Power Supply Module - PC & Networking Power | Consumer Electronics - Power Supply Module |
|---|---|---|
| Office Solutions Gaming Solutions Laptop Keyboard Module Touchpad Laptop Power Adapters USB Type C/PD Charger | PC Power Supply | Networking Adapter |
Sourc : Company data, Morgan Stanl y R s arch
4. Networking and urveillance
The product portfolio covers networking solutions, video surveillance, AIoT solutions, and server related offerings. The solutions are designed to be user friendly and adaptable to emerging trends in digital intelligence.
Exhibit 147:Lit -on: Off rings for n tworking and surv illanc
| Networking and Surveillance - Video Surveillance - Home / Building / Module | Networking and Surveillance - Access Control & Alarms - Smart Hub / Access / Alarm | Networking and Surveillance - Networking Solutions - 5G / WLAN / Switch / Module |
|---|---|---|
| Home Security Camera Building Surveillance Camera Camera Module | Smart Hub Access Control Alarm Kits | 5G Total Solution Wireless LAN Wired Switch Wireless Module |
Sourc : Company data, Morgan Stanl y R s arch
5. Automotive electronic
M Asia Pacific Insight
Lite On is able to leverage its core competencies in optoelectronics and power management, along with more than four decades of expertise in automotive electronics. This segment is dedicated to advancing vehicle charging technology, ADAS (Advanced Driver Assistance Systems) solutions, and automotive lighting modules through high end engineering. AC charging solutions are offered across multiple current ratings (32/40A, 48A, 80A, and an EU specific variant), while DC charging solutions include a 30kW fast charging offering.
Exhibit 148:Lit -on: Off rings for automotiv l ctronics
| Automotive Electronics - ADAS Solutions - Vision & Lighting | Automotive Electronics - AC Charging Solutions - 32/40A - 48A - 80A - EU | Automotive Electronics - DC Charging Solutions - Fast Charging |
|---|---|---|
| Automotive Vision Solutions Vehicle Lighting Solutions | DC 30kW | |
| IC 32/40A IC 48A IC 80A IC EU |
Sourc : Company data, Morgan Stanl y R s arch
6. Roadway Intellimation Sy tem
This segment is mainly operated under the LEOTEK brand, a subsidiary of the LITEON Technology Group with dual headquarters in Silicon Valley and Taipei. It has served road infrastructure across more than 30 countries-including North America, Europe, the Middle East, and the Asia Pacific region-since 1992. The segment comprises intelligent roadway lighting, traffic signal systems, and AI driven predictive maintenance solutions, all developed to support smarter and more efficient road infrastructure.
Exhibit 149:Lit -on: Off rings for Roadway Int llimation Syst m
| Roadway Intellimation System - Roadway Lighting Intellimation - Smart LED Streetlights | Roadway Intellimation System - Intelligent Traffic Signal System - AI-driven Signal Control | Roadway Intellimation System - AI Predictive Maintenance Solution - Condition Monitoring |
|---|---|---|
| Intelligent Traffic Signal System | Includes AI warning and maintenance management, traffic flow data analysis and computation, traffic- adaptive signal control, and priority passage for emergency vehicles, etc | |
| Roadway Lighting Intellimation | AI Predictive Maintenance Solution |
Sourc : Company data, Morgan Stanl y R s arch
Monthly sales vs. share price
Lite On's monthly sales have hovered around the NT$10 20bn level since 2013. Notably, we see a high correlation of ~76% between the company's monthly sales and its share price movements since 2023.
The company reported August monthly sales of NT$19,592mn (+3% MoM/+25% YoY).
M Asia Pacific Insight
Exhibit 150:Lit -on: Monthly sal s vs. sal s YoY growth
Sourc : TEJ, Morgan Stanl y R s arch
Exhibit 151:Lit -on: Monthly sal s vs. shar pric
Sourc : TEJ, Morgan Stanl y R s arch
Key management & shareholding structure
Lite On's board currently consists of five directors and four independent non executive directors.
Its founder, Raymond Soong, and current Chairman, Tom Soong, together owned a stake of ~5% as of June 2026. Excluding the founder and Chairman, the management team owned a stake of ~0.1% as of June 2026.
The FINI holding percentage as of July 7, 2026, was 41%, versus a previous peak of 62% in April 2017 and a historical average (since 2010) of 46%.
Exhibit 152:Lit -on: Shar holding structur
| Shareholders | Ownership |
|---|---|
| Cathay MSCI Taiwan ESG Sustainability High Dividend Yield ETF | 5.6% |
| Yuanta/P-shares Taiwan Dividend Plus ETF | 5.5% |
| Ta-Rong Investment Co., Ltd | 3.7% |
| Raymond Soong* | 3.4% |
| Fuh Hwa Taiwan Technology Dividend Highlight ETF | 3.3% |
| Labor Pension fund | 2.6% |
| Ming-Hsing Investment Co., Ltd | 2.6% |
| Ta-Sung Investment Co., Ltd* | 2.1% |
| Chunghwa Post Co., Ltd | 2.0% |
| Lite-On Technology Corporation (Treasury shares)* | 1.7% |
Total
32.6%
Sourc : Company data, Morgan Stanl y R s arch. Not : Data as of August 2025. (*) ar shown as insid rs.
M Asia Pacific Insight
Exhibit 153:Lit -on: FINI holdings vs. shar pric sinc 2010
Sourc : TEJ, Morgan Stanl y R s arch. Not : Data as of Oct 5, 2026
Exhibit 155:
Lit -on: Manag m nt profil s
| Name | Title | Education | Work Experience |
|---|---|---|---|
| Tom Soong | Chairman and Chief Sustainability Officer, LITEON Technology | Electrical Engineering, University of Southern California, USA; International Business Program Attendance, NTU-FUDAN EMBA | - 20+ years at LITEON - Special Assistant to Chairman & Vice Chairman, LITEON - CEO of LITEON Smart Life and Applications Business Group - General Manager, LITEON Shanghai Operational Center |
| Anson Chiu | President and Director, LITEON Technology | Bachelor of Industrial Management, Lunghwa University of Science and Technology | - Joined LITEON Technology in 1987 - 35+ years in global supply chain and business development' - CEO, LITEON Power Conversion Business Group - General Manager, LITEON Power Conversion Business Group - Director, NB Business Unit, Power Conversion Business Group |
| Raymond Soong | Founder and Director, LITEON Technology and LITEON Cultural Foundation | Fellow, Industrial Technology Research Institute; Honorary Doctor of Management, National Chiao Tung University; Honorary Doctor of Management, Taipei University of Technology | - Chairman, LITEON Group - Chairman & Founder, LITEON Cultural Foundation - Chief Engineer, Texas Instruments Taiwan Ltd. - Board of Councilors member, Doctorate College of Technology, USC |
| Harvey Chang | Director Representative, Lite-On Technology Corp. | MBA, The Wharton School, University of Pennsylvania | - Independent Director, LITEON Technology - Chairman, IC Broadcasting - Chairman, TVBS and Catchplay Media Holdings Ltd. - President & CEO, Taiwan Mobile - Senior VP & CFO, TSMC |
| Sarina Lin | Director Representative, Lite-On; Advisor to Chairman's Office, Lite-On | Doctor of Laws, National Taiwan University | - Chief Legal Officer, Lite-On - Special Assistant to Chairman and Attorney, MediaTek Inc. - Director, MediaTek Foundation - SVP, CHRO & Chief Legal Officer, MStar Semiconductor - Director & CEO, MStar Semiconductor Charity Foundation - Director and Supervisor, MStar Semiconductor |
| Albert Hsueh | Independent Director, LITEON Technology; | MBA, Bloomsburg University, Pennsylvania, U.S.A. | - Chairman, PricewaterhouseCoopers Taiwan - Director, Corporate Governance Association in Taiwan - Professor, National Taiwan University and Tsinghua University, College of Technology Management |
| Mike Yang | Independent Director, Lite-On Technology Corp. | Master of Science, Arizona State University | - Associate Vice President, ADI Corp. Procurement Dept. - Director, LIONS Taiwan Technology Inc. - Director, Quanta Culture & Education Foundation - Cloud computing and global technology leadership |
| MK Lu | Independent Director, Lite-On Technology Corp. | Honorary Doctor, Tatung University; Honorary Doctor of Engineering, National Chiao Tung University; Department of Electrical Engineering, Tatung University | - Chairman, Tatung Company - Chairman, Sino-American Silicon Products Inc. - Chairman, Actron Technology Corporation - President, Lite-On Semiconductor Corp. - President, Vishay Lite-On Power Semiconductor Corp. - Vice President, Silitek Corp. |
| Jesse Ding | Independent Director, Lite-On Technology Corp. | PhD program, The Wharton School, University of Pennsylvania; MBA, University of Detroit, USA | - Chairman, EnTie Commercial Bank - General Manager, EnTie Commercial Bank - General Manager, TAIPEI FUBON COMMERCIAL BANK CO., LTD - Financial accounting and leadership decision-making |
Sourc : Company data, Morgan Stanl y R s arch
Exhibit 154:Lit -on: FINI holdings vs. shar pric sinc 2023
Sourc : TEJ, Morgan Stanl y R s arch. Not : Data as of Oct 5, 2026
M Asia Pacific Insight
Valuation Methodology and Risks
Panasonic Holdings (6752.T)
Our target price is based on P/E 19.5x our FY3/28 EPS forecast.
We apply: 36x to EPS generated by AI infrastructure related businesses, 5x to EPS attribu table to IRA subsidies in the automotive battery business, and 13.5x to EPS from all other businesses.
Risks to Upside
- n Acceleration of restructuring and exit/scale down of unprofitable businesses
- n Stronger than expected growth of datacenter BBU, automotive battery business
Risks to Downside
- nDeteriorating visibility for energy business
- n Expectations for business portfolio revisions sink
M Asia Pacific Insight
Risk Reward Reference links
- View explanation of Options Probabilities methodology
Options_Probabilities_Exhibit_Link.pdf
- View descriptions of Risk Rewards Themes RR_Themes_Exhibit_Link.pdf
-
View explanation of regional hierarchies GEG_Exhibit_Link.pdf
-
View explanation of Theme/Exposure methodology
ESG_Sustainable_Solutions_External_Link.pdf
- View explanation of HERS methodology ESG_HERS_External_Link.pdf
M Asia Pacific Insight
INDUSTRY COVERAGE: Greater Ch na Technology Hardware
| Company (Ticker) | Rating (As Of) | Price* (10/05/2026) |
|---|---|---|
| Andy Meng, CFA | ||
| AAC Technologies Holdings (2018.HK) | O (01/29/2024) | HK$38.64 |
| Accelink Technologies Co. Ltd. (002281.SZ) | U (05/12/2022) | Rmb164.88 |
| BYD Electronics (0285.HK) | O (04/28/2023) | HK$22.76 |
| China TransInfo Technology Co Ltd (002373.SZ) | E (07/18/2023) | Rmb7.35 |
| Dahua Technology Co. Ltd. (002236.SZ) | E (12/12/2024) | Rmb15.32 |
| Eoptolink Technology Inc Ltd (300502.SZ) | O (02/27/2026) | Rmb389.00 |
| Genius Electronic Optical Co. Ltd. (3406.TW) | U (09/10/2026) | NT$1,055.00 |
| GoerTek Inc (002241.SZ) | E (08/14/2026) | Rmb22.79 |
| Gosuncn Technology Group Co Ltd (300098.SZ) | U (11/07/2022) | Rmb4.17 |
| HIKVision Digital Technology (002415.SZ) | E (12/12/2024) | Rmb32.46 |
| Largan Precision (3008.TW) | E (09/10/2026) | NT$6,730.00 |
| LianChuang Electronic Technology Co Ltd (002036.SZ) | U (06/12/2024) | Rmb5.97 |
| Lingyi Itech Guangdong Co (002600.SZ) | U (04/23/2025) | Rmb11.88 |
| Lingyi Itech Guangdong Co (1688.HK) | O (08/14/2026) | HK$5.46 |
| Luxshare Precision Industry Co., Ltd. (2475.HK) | O (08/14/2026) | HK$53.35 |
| Luxshare Precision Industry Co., Ltd. (002475.SZ) | O (10/24/2016) | Rmb49.43 |
| OFILM Group Co Ltd (002456.SZ) | U (06/12/2024) | Rmb6.49 |
| Q Technology (Group) Company Ltd (1478.HK) | U (03/23/2026) | HK$4.91 |
| Quectel Wireless Solutions Co Ltd (603236.SS) | E (10/09/2024) | Rmb71.35 |
| Shanghai Conant Optical Co Ltd (2276.HK) | O (04/10/2026) | HK$37.16 |
| Shenzhen Transsion Holdings Co Ltd (688036.SS) | E (03/23/2026) | Rmb53.80 |
| Sunny Optical (2382.HK) | E (03/23/2026) | HK$61.95 |
| Suzhou TFC Optical Communication Co Ltd. (300394.SZ) | E (11/06/2025) | Rmb260.77 |
| Wingtech Technology Co Ltd (600745.SS) | U (05/18/2026) | Rmb16.43 |
M Asia Pacific Insight M Asia Pacific Insight Stock Ratings ar subj ct to chang . Pl as s lat st r s arch for ach company.
| Xiaomi Corp (1810.HK) | O (04/14/2021) | HK$23.88 |
|---|---|---|
| Yangtze Optical Fibre and Cable JSC Ltd (601869.SS) | U (10/13/2021) | Rmb411.16 |
| Yangtze Optical Fibre and Cable JSC Ltd (6869.HK) | O (07/15/2026) | HK$179.10 |
| Yongxin Optics Co Ltd (603297.SS) | E (11/15/2022) | Rmb106.92 |
| Zhejiang Crystal-Optech Co Ltd (002273.SZ) | O (11/15/2022) | Rmb24.40 |
| Zhongji Innolight Co Ltd (300308.SZ) | O (09/07/2026) | Rmb808.44 |
| Zhongji Innolight Co Ltd (3308.HK) | O (09/07/2026) | HK$1,111.00 |
| ZTE Corporation (0763.HK) | O (06/04/2026) | HK$21.62 |
| ZTE Corporation (000063.SZ) | E (06/04/2026) | Rmb30.58 |
| Derrick Yang | ||
| Accton Technology Corporation (2345.TW) | O (06/06/2024) | NT$2,075.00 |
| Advantech (2395.TW) | O (01/20/2021) | NT$740.00 |
| AirTAC International (1590.TW) | O (04/16/2025) | NT$1,180.00 |
| Asia Vital Components Co. Ltd. (3017.TW) | O (07/30/2024) | NT$3,585.00 |
| AU Optronics (2409.TW) | E (02/10/2026) | NT$39.05 |
| Auras Technology Co Ltd (3324.TWO) | E (05/04/2023) | NT$1,550.00 |
| Bizlink (3665.TW) | O (03/10/2025) | NT$2,485.00 |
| BOE Technology (000725.SZ) | O (09/06/2019) | Rmb5.72 |
| Chenbro (8210.TW) | O (07/23/2025) | NT$890.00 |
| Chroma Ate Inc. (2360.TW) | O (10/05/2021) | NT$2,325.00 |
| Delta Electronics Inc. (2308.TW) | O (07/13/2017) | NT$2,005.00 |
| E Ink Holdings Inc. (8069.TWO) | E (08/10/2026) | NT$146.50 |
| Ennostar Inc (3714.TW) | U (09/23/2022) | NT$68.20 |
| Fositek Corp (6805.TW) | O (06/25/2025) | NT$2,450.00 |
| Hiwin Technologies Corp. (2049.TW) | O (03/30/2026) | NT$345.50 |
| Innolux (3481.TW) | E (04/07/2025) | NT$52.30 |
| King Slide Works Co. Ltd. (2059.TW) | O (11/08/2023) | NT$13,355.00 |
| Lens Technology (300433.SZ) | E (07/22/2020) | Rmb32.31 |
| Lite-On Technology (2301.TW) | E (01/15/2025) | NT$298.00 |
| TCL Corp. (000100.SZ) | E (04/07/2025) | Rmb4.79 |
| Tianma Microelectronics (000050.SZ) | U (01/24/2018) | Rmb6.31 |
| Wuhan Jingce Electronic Group Co Ltd (300567.SZ) | E (11/26/2021) | Rmb184.03 |
| Howard Kao | ||
| Acer Inc. (2353.TW) | U (04/23/2025) | NT$31.40 |
| Asustek Computer Inc. (2357.TW) | U (11/16/2025) | NT$995.00 |
| Catcher Technology (2474.TW) | U (11/17/2025) | NT$207.00 |
| Compal Electronics (2324.TW) | U (04/23/2025) | NT$35.80 |
| Elite Material Co. (2383.TW) | O (09/14/2026) | NT$5,700.00 |
| FIT Hon Teng Ltd (6088.HK) | O (11/03/2025) | HK$4.86 |
| Foxconn Industrial Internet Co. Ltd. (601138.SS) | O (07/10/2019) | Rmb58.20 |
| Giga-Byte Technology Co. Ltd. (2376.TW) | E (11/16/2025) | NT$388.50 |
| Gold Circuit Electronics Ltd. (2368.TW) | O (10/06/2022) | NT$1,215.00 |
| Hon Hai Precision (2317.TW) | O (03/15/2024) | NT$254.00 |
| Inspur Electronic Information (000977.SZ) | E (08/28/2023) | Rmb65.93 |
| Kingboard Laminates Holdings Ltd. (1888.HK) | O (09/14/2026) | HK$55.30 |
| LandMark Optoelectronics Corporation (3081.TWO) | E (03/26/2026) | NT$3,000.00 |
| Lenovo (0992.HK) | O (07/10/2026) | HK$35.92 |
| Lotes Co. Ltd. (3533.TW) | E (05/12/2025) | NT$1,875.00 |
| Nan Ya PCB (8046.TW) | O (02/23/2026) | NT$1,495.00 |
| Pegatron Corporation (4938.TW) | E (03/25/2026) | NT$88.70 |
| Quanta Computer Inc. (2382.TW) | O (05/01/2023) | NT$331.00 |
| Shengyi Technology Co Ltd. (600183.SS) | E (05/26/2022) | Rmb129.96 |
| Shennan Circuits Co Ltd (002916.SZ) | E (08/24/2023) | Rmb373.01 |
| Unimicron (3037.TW) | O (02/23/2026) | NT$1,325.00 |
| Visual Photonics Epitaxy Co Ltd (2455.TW) | E (09/11/2023) | NT$606.00 |
| Wistron Corporation (3231.TW) | O (07/12/2023) | NT$189.50 |
|---|---|---|
| Wiwynn Corp (6669.TW) | O (11/10/2025) | NT$2,150.00 |
| Yageo Corp. (2327.TW) | O (10/28/2025) | NT$626.00 |
| Zhen Ding (4958.TW) | ++ | NT$576.00 |
| Irene Yen | ||
| Co-Tech Development Corp. (8358.TWO) | O (09/14/2026) | NT$570.00 |
| Taiwan Union Technology Corporation (6274.TWO) | O (09/14/2026) | NT$1,780.00 |
- Historical pric s ar not split adjust d.