PDF 原檔:報告_GS_台灣PCB與CCL_20261025_original.pdf
原始內容
For the exclusive use of [訂閱者已遮蔽]
Taiwan Technology: PCB/CCL tour 2026 key takeaways: Upgrade pace accelerating; Expanding High ASP/Profitability ABF opportunity
We hosted 4 meetings with companies in the Taiwan PCB/CCL/Substrate supply chain during the annual Taiwan PCB show (TPCA show) in Taipei on Oct 21, 2026, and visited more than 10 companies in the supply chain to see the current state of the PCB/CCL/Substrate industries. Our key takeaways as below:
Chao Wang
+886(2)2730-4195 | kuanchao.wang@gs.com Goldman Sachs (Asia) L.L.C., Taipei Branch
Allen Chang
+852-2978-2930 | allen.k.chang@gs.com Goldman Sachs (Asia) L.L.C.
Al Wang
+886(2)2730-4081 | al.wang@gs.com Goldman Sachs (Asia) L.L.C., Taipei Branch
End demand remains solid into LT with customers' LTAs/subsidies/investments into new capacity for 2027-30
Despite some investors' concern on slower investment in the AI hardware supply chain in coming years, we continue to see a solid demand uptrend intact for all high-end PCB/CCL/Substrate and raw materials for their respective industries. We are seeing more substrate/PCB/CCL material players' future investment plans (in 2027-30) supported by end customers (including via LTAs, subsidies on capacity expansion, prepayments and/or incentive fees), which we have not observed before (we see EMC, ZDT, Co-Tech and other high-end CCL companies being asked by their customers for LTAs/subsidies for dedicated capacity/plants; however, not all players are receptive to these arrangements), implying an even fiercer supply shortage condition in the coming years. We therefore anticipate a more favorable profitability outlook than we previously expected for the substrate and PCB/CCL/material suppliers in coming quarters/years (Exhibit 1), and we expect this (direct investment from end customers on the capacity) to strengthen investor confidence in the multi-year demand/pricing/profitability uptrend opportunity we see.
We expect this to benefit the bottom line as (1) depreciation should decrease with less equipment (Exhibit 2) and (2) profitability should increase as more pre-payment/subsidies are recognized. Also, for those companies that do not enter LTA/subsidy agreements, etc, with their customers, we believe they should find a better pricing outlook (like ABF substrate spot price players) in the long term, with more flexibility on selecting customers/projects. As a result, we view the structural changes in the supply chain positively and expect further valuation re-rating potential for PCB/CCL and material suppliers with additional capacity being booked by clients.
e92c7a75ab8b4efbba794e6b187208c8
For the exclusive use of [訂閱者已遮蔽]
Exhibit 1: We are seeing more substrate/PCB/CCL players' future investment plans in 2027-30 being supported by their end customers
Exhibit 2: Depreciation % of total revenue should continue to go down with customers' investment in equipment or more prepayment/subsidy
Source: Company data, Goldman Sachs Global Investment Research
Source: Company data, Goldman Sachs Global Investment Research
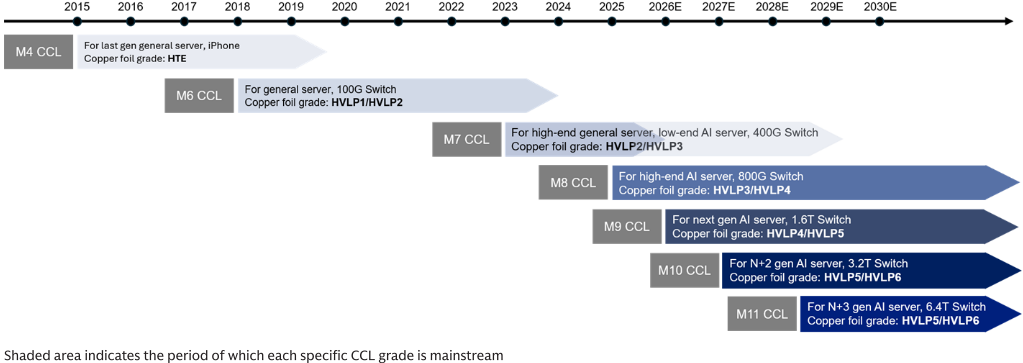
PCB CCL upgrading continues: M10 is under qualification, which should start shipments from 2H27, while we expect M11 shipments to start no later than 2030 For the PCB CCL industry overall, the key revenue/profit driver in our view is the solid specification upgrading trend (e.g., AI M7 ramp up in 2024, the M8 ramp in 2025, and M9 in 2026, Exhibit 3) which continues to drive high-end CCL players' ASP growth by 25-50% YoY annually in 2024-2026, and we are seeing the trend continuing and accelerating in coming years, despite the concerns of some investors in our conversations that a technology migration slowdown is impacting CCL players' revenue/profit growth opportunity.
During the TPCA show, we saw both EMC and TUC launch their M10/M11 solutions at the event, while both companies mentioned they are closely engaging with end customers for the next-generation AI R&D projects, based on the M10/11 solution (+ under qualification now). We believe EMC should start shipping its M10 products from 2H27 at the earliest for specific AI customer's GPU AI rack solutions and that shipments should ramp up significantly in 2028 as more GPU and ASIC AI projects start adopting this solution. For TUC's M10 products, we believe the company will start shipment from 2028 for not only high-end 3.2T Ethernet switch projects but also for some ASIC projects.
Both EMC and TUC are currently under verification with clients for their M10/M11 grade CCL, which incorporates Q-glass. In terms of the possibility of adopting PTFE-based CCL, the new solution continues to face production difficulties, making us less positive on the solution's progress, and we only expect the MP (mass production) time to occur after 2H28 at the earliest (our supply chain checks suggest the production yield for PTFE-based PCB is running at 10-15% vs. average yield of 80-90% for PCB with M9 grade CCL adopting Q-glass). As a result, we believe the PCB upgrade for switch tray in Nvidia's Rubin Ultra GPU servers starting from 2H27 could have a high likelihood of adopting M9/M10 grade CCL with Q-glass/HC (Hydrocarbon) instead of PTFE, potentially implying better EMC/TUC share than we currently expect over the next 2-3 years).
e92c7a75ab8b4efbba794e6b187208c8
For the exclusive use of [訂閱者已遮蔽]
Exhibit 3: CCL/PCB upgrade pace is accelerating
2021
Source: Goldman Sachs Global Investment Research
Source: Company data, Goldman Sachs Global Investment Research
New opportunity to enter the high ASP/GM ABF substrate supply chain for TW CCL supply chain players
Given the relatively slow capacity investment to date from Japanese substrate material suppliers (ABF CCL/ T-glass/ micro thin copper foil etc.industries are mostly dominated by Japanese players, with more than 95% market share in the past 10+ years) while demand continues to trend up (we are seeing ABF substrates' material usage doubling every 1-2 years, due to the expanding substrate size/ increasing substrate layer counts / decreasing substrate production yield rate), we started to see end customers qualification processes for Taiwan and mainland China ABF substrate supply chain vendors accelerate from 1H26, to better overcome supply constraints, implying a long term share gain trend from the Taiwan/mainland China new substrate material suppliers (including EMC and Co-Tech in our coverage space). We therefore believe EMC likely starts taking ABF substrate CCL market share from 2H26 (TAM could be up from US$0.8bn-1.2bn in 2026 to US$2.0bn-2.5bn in 2027 and US$4.0bn-4.5bn in e92c7a75ab8b4efbba794e6b187208c8
For the exclusive use of [訂閱者已遮蔽]
2028, accounting for ~15%/19%/22% of EMC's 2026/27/28E revenue, per GSe, which not only suggests significant upside potential for EMC's ASP outlook (ABF substrate CCL ASP per full sheet is ~US$1,500 vs. M7/8 only at US$130/180, Exhibit 5) but should also lead to a solid GM uptrend. We estimate the ABF substrate CCL GM is now at 50%+ which could further increase closer to the industry average of ~70%+ in the long term based on our industry checks (vs. our 2026/27/28 GM estimate on EMC is 35.2%/40.7%/43.4%). Also, we believe that micro-thin copper foil, which is dominated by Japan vendors, should also start to see some new suppliers starting from late 2027/early 2028, while Co-Tech said that it is preparing R&D resources and is working on designs for the new production lines for this new substrate-level product, which we estimate could start contributing to the company's revenue from 2H28 at the earliest per GSe.
Moreover, considering that the ABF substrate size/layer count both continue to increase, with less favorable yield rate and production efficiency, we expect the high-end AI ABF substrates consumption on ABF CCL to increase significantly. Based on prevailing specifications, we believe a quarter sheet of ABF CCL can currently produce ~6-8 units of high-end ABF substrates, but that number could decrease significantly to 2-3 units per quarter sheet in 2028 based on the substrate design, which should lead to a solid unit volume demand uptrend.
In terms of supply, EMC said that it could have 1.5mn sheets/month capacity by end of 2027 for ABF substrate CCL during TPCA event, which would then likely account for 50% of the global ABF substrate CCL capacity on our estimates, suggesting a strong focus by the company to compete in this high ASP/GM product segment.
Source: Company data, Goldman Sachs Global Investment Research
Exhibit 6: ABF CCL TAM vs. EMC revenue; ABF CCL could be a long term growth driver with its higher GM US$bn
Source: Goldman Sachs Global Investment Research
PCB/CCL upgrades to continue with limited risk from CPO adoption
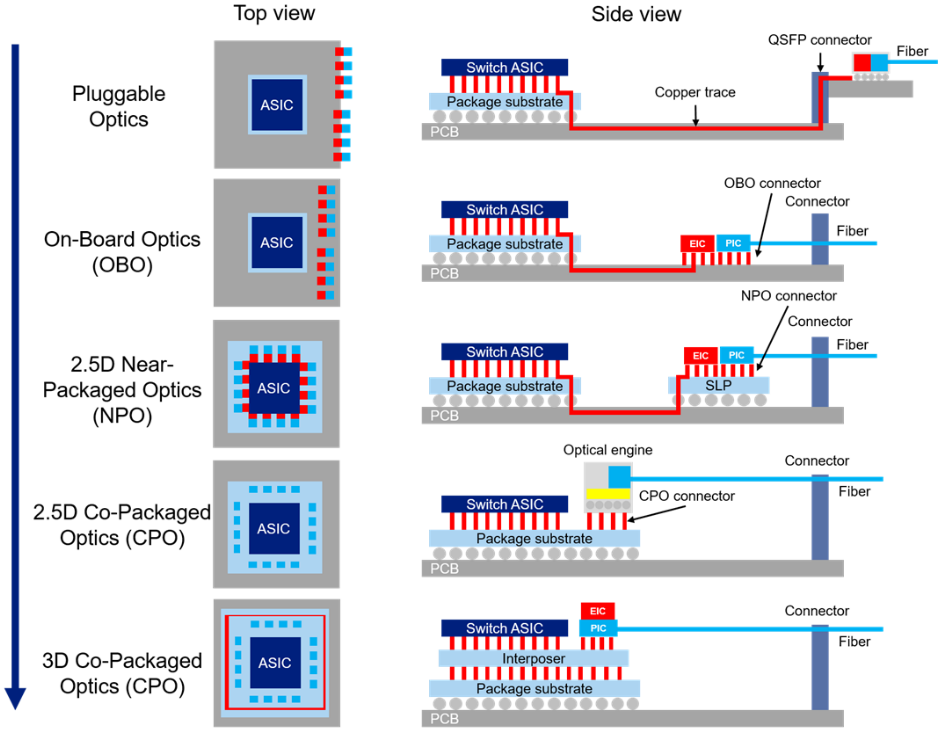
We see limited near term risk of Co-Packaged Optics (CPO) adoption as the industry should start with switch trays in GPU servers from 2028E, when we estimate switch board to account for 14% of a total CCL TAM of US$48bn in 2028E. In considering an extreme case where all switch boards are downgraded to M4/M7 grade CCL, we would expect the impact to result in a <10% reduction in the 2028E CCL TAM, an impact which we believe would be manageable. At the TPCA show, we saw ZDT showcase its 30 layers e92c7a75ab8b4efbba794e6b187208c8
For the exclusive use of [訂閱者已遮蔽]
HDI PCB switch board, and the company said that it is confident that switch board will continue to see upgrades in terms of layer count and design complexity as optical transceivers are being used as the mainstream solution for scale out, which requires high end PCB/CCL for its longer electrical path comparing to CPO (Exhibit 7). ZDT mentioned the possibility of scale up adopting CPO, but is unsure on the MP timing at this point, and we see this technology as unlikely to be available before 2030E given its technology complexities. ZDT also showcased multiple optical module mSAP solutions, including 800G/1.6T/NPO/XPO, and we believe that optical transceivers, which rely on high end PCB/CCL in switch trays, will remain mainstream in the foreseeable future and thus is beneficial to the optical module mSAP suppliers (we expect optical module mSAP to see 87% 2026-28E CAGR, Exhibit 8). We believe ZDT is well-positioned to gain share in this fast growing market as we believe the company is proactively expanding mSAP capacity (we expect ZDT's mSAP capacity to reach 5x in the next 2 years, see here, as well as the company currently holds an industry-leading yield of 90%+ for its optical module mSAP products. Optical module mSAP GMs currently average 40%-45%, and could potentially reach 50%+ following pricing hikes and yield improvements, which would be beneficial to ZDT's profitability (our 2026/27/28 GM estimate on ZDT only at 24.7%/27.6%/31.4%).
5
e92c7a75ab8b4efbba794e6b187208c8
For the exclusive use of [訂閱者已遮蔽]
Exhibit 7: Pluggable transceiver remains mainstream, the longer electrical path still relies heavily on high end PCB/CCL technology
Source: Company data
Exhibit 8: We expect optical module mSAP to register 87% 2026-28E CAGR
Source: Company data, Goldman Sachs Global Investment Research
Investment view - Focus on new substrate/MSAP/M10 opportunity and market share e92c7a75ab8b4efbba794e6b187208c8
For the exclusive use of [訂閱者已遮蔽]
gainers
EMC to see solid upside on profit potential with the new substrate CCL opportunity
We continue to see EMC make progress in the new ABF substrate CCL business, a market which the company entered in early 2026 and started producing high-end ABF substrate CCL from 2H26, with monthly revenues reaching NT$150-200mn (<1% of the company's Sep monthly revenue) for the most high-end TPU substrate CCL market (see here). We believe EMC could become one of the market leaders within the next 3-5 years (we are expecting 20-30% market share in 2028E and trending up significantly afterward), given its track record of successfully entering new markets over the past two decades. Furthermore, the company is well-positioned to gain share in the tight supply market as the company is proactive with its substrate CCL expansion plans, and the company expects to expand its substrate CCL capacity to 4-5x of current level by 2027 (current substrate CCL capacity at 300k sheet/month), which should account for 50% of the global substrate CCL capacity by end of 2027E, implying a good opportunity for the company to further ramp up market share in the long term.
M10/11 upgrades still the key to earnings growth for EMC & TUC in the next 3+ years, while the favorable S/D outlook should continue to drive the like-for-like base pricing in coming quarters
We see EMC and TUC being well-positioned in the ongoing CCL upgrade trend as both companies are currently under verification with clients for their respective next generation M10/M11 grade CCL and are also future proofing their product-portfolios by continuing to develop PTFE-based CCL. For the new M10 grade CCL, we expect EMC will start shipments from 2Q27-3Q27 while TUC should start shipments from 2028, leading to meaningful upside potential for each company's revenue, as EMC/TUC's current ASPs have been approximately US$63/46 in 2026 while the M10 grade CCL ASP is currently priced at ~US$800 per sheet, implying substantial ASP upside potential from here, all else equal.
We continue to see a solid S/D outlook for high-end CCLs in coming years (see here) as capacity expansion for these CCLs continues to track slower than demand growth (see here). However, we note TUC revised up its capacity target and expects it to increase 2.5x+ over 2026-30 (8/5/30% upward revision to the year-end target capacity for 2026/27/28 from previous guidance), and based on company comments we believe the new capacity is fully booked by clients, implying a solid revenue/profit growth outlook.
Co-Tech is currently obtaining LTAs to secure high-end copper foil capacity, suggesting a solid long term market share and revenue outlook
We believe Co-Tech is well-positioned to benefit from the structural demand for high end copper foil in a shortage environment, as the company announced capacity expansion plans for a new Plant 4 in Malaysia, with capacity being secured by more than one client, per the company. The company now target its annual HVLP3+ effective capacity to reach 10K/20K/30K tons by end of 2027/28/29 (equivalent of 833/1666/2500 tons/month by 2027/28/29 end vs. current HVLP3+ effective capacity of ~250 tons/month). This should enable the company to achieve further gains in market share amid high end copper foil supply shortage environment (see here), as well as seeing a better pricing environment going forward.
We expect Co-Tech's new capacity, after ramp up, should continue to see 100% UTR, as e92c7a75ab8b4efbba794e6b187208c8
For the exclusive use of [訂閱者已遮蔽]
most of the new capacity has been booked/sponsored by end customers already, implying a solid market share and revenue outlook in coming years. Moreover, we believe the company will start to recognize customer subsidies from 2027 at the earliest, implying further incremental upside to profitability in coming years.
ZDT continues to maintain key one-stop shop status for all ABF/BT/HDI/HLC/mSAP products, suggesting solid market share outlook in long term
We remain positive on ZDT as the company continues to make progress with its optical module mSAP and AI PCB business, and the company mentioned that both of these business are seeing capacity bookings by clients. We believe ZDT will become a market share leader in the optical module mSAP industry (see here), as we expect the company to expand mSAP capacity by 5x over the next two years based on announced capex plans. Most suppliers in the optical module mSAP industry are proactively expanding capacity as CPO adoption risk remains limited.
Also, considering that ZDT is the only company that manufactures all types of ABF/BT/HDI/HLC/mSAP products, it is well positioned for further share gains not only in the optical transceiver market, but also in the AI PCB, ABF, BT markets. Additionally, we estimate that these new products will likely carry 35-50%+ GMs in 2027, implying a solid revenue/profit outlook for the company going forward.
We also see other companies within the CCL/IC substrate sector flagging supply tightness across the whole supply chain as industry expansion has not been sufficient to meet prevailing demand. This is in line with our view that suppliers with timely capacity expansion plans are better positioned to make further market share gains and benefit from stronger pricing/profitability amid a supply-constrained environment.
P&L
Exhibit 9: EMC P&L summary
| NT$mn | 1Q26 | 2Q26 | 3Q26E | 4Q26E | 1Q27E | 2Q27E | 3Q27E | 4Q27E | 1Q28E | 2Q28E | 3Q28E | 4Q28E | 2024 | 2025 | 2026E | 2027E | 2028E |
|---|---|---|---|---|---|---|---|---|---|---|---|---|---|---|---|---|---|
| Revenue | 33,067 | 47,275 | 57,349 | 59,952 | 67,047 | 81,696 | 94,459 | 109,822 | 122,256 | 139,528 | 153,104 | 165,161 | 64,377 | 94,261 | 197,643 | 353,024 | 580,049 |
| Gross profit | 9.729 | 16,003 | 21,117 | 22,649 | 26,204 | 32,690 | 38,502 | 46,151 | 52,156 | 60,074 | 6995 | 72,969 | 17,970 | 28,120 | 69,498 | 143,548 | 251,894 |
| Operating expense | (2,601) | (3,269) | (3,556) | (3,897) | (4,392) | (4,616) | (4,912) | (5,162) | (5,502) | (6,000) | (6,277) | (6,606) | (5,818) | (9,012) | (13,322) | (19,081) | (24,385) |
| Operating inc ome | 7,128 | 12,734 | 17,561 | 18,752 | 21,813 | 28,075 | 33,591 | 40,990 | 46,655 | 54,074 | 60,418 | 66,362 | 12,152 | 19,108 | 56,176 | 124,467 | 227,509 |
| Pretax inc ome | 7,194 | 12,785 | 17,561 | 18,752 | 21,813 | 28,075 | 33,591 | 40,990 | 46,655 | 54,074 | 60,418 | 66,362 | 12,133 | 18,876 | 56,293 | 124,467 | 227,509 |
| Taxes expense | (1,855) | (2,914) | (4,039) | (4,126) | (5,017) | (6,457) | (7,726) | (9,428) | (10,731) | (12,437) | (13,896) | (15,263) | (2,564) | (4,231) | (12,934) | (28,628) | (52,327) |
| Net income | 5,340 | 9,873 | 13,522 | 14,627 | 16,796 | 21,618 | 25,865 | 31,562 | 35,924 | 41,637 | 46,522 | 51,099 | 9,578 | 14,649 | 43,362 | 95,840 | 175,182 |
| EPS, NT$ | 14.90 | 27.55 | 37.73 | 40.81 | 46.87 | 60.32 | 72.17 | 88.07 | 100.24 | 116.18 | 129.81 | 142.58 | 27.81 | 41.67 | 121.03 | 267.52 | 488.99 |
| Ratio analysis and assumption | Ratio analysis and assumption | Ratio analysis and assumption | Ratio analysis and assumption | Ratio analysis and assumption | Ratio analysis and assumption | Ratio analysis and assumption | Ratio analysis and assumption | Ratio analysis and assumption | Ratio analysis and assumption | Ratio analysis and assumption | Ratio analysis and assumption | Ratio analysis and assumption | |||||
| As % of sales | As % of sales | As % of sales | As % of sales | As % of sales | As % of sales | As % of sales | As % of sales | As % of sales | As % of sales | As % of sales | As % of sales | As % of sales | |||||
| Gross margin | 29.4% | 33.9% | 36.8% | 37.8% | 39.1% | 40.0% | 40.8% | 42.0% | 42.7% | 43.1% | 43.6% | 44.2% | 27.9% | 29.8% | 35.2% | 40.7% | 43.4% |
| Operating expense ratio | 7.9% | 6.9% | 6.2% | 6.5% | 6.6% | 5.7% | 5.2% | 4.7% | 4.5% | 4.3% | 4.1% | 4.0% | 9.0% | %9% | 6L% | 5.4% | 4.2% |
| Operating margin | 21.6% | 26.9% | 30.6% | 31.3% | 32.5% | 34.4% | 35.6% | 37.3% | 38.2% | 38.8% | 39.5% | 40.2% | 18.9% | 20.3% | 28.4% | 35.3% | 39.2% |
| Net margin | 16.1% | 20.9% | 23.6% | 24.4% | 25.1% | 26.5% | 27.4% | 28.7% | 29.4% | 29.8% | 30.4% | 30.9% | 14.9% | 15.5% | 21.9% | 27.1% | 30.2% |
| QoQ growth (%) | QoQ growth (%) | QoQ growth (%) | QoQ growth (%) | QoQ growth (%) | QoQ growth (%) | QoQ growth (%) | QoQ growth (%) | QoQ growth (%) | QoQ growth (%) | QoQ growth (%) | QoQ growth (%) | QoQ growth (%) | |||||
| Revenue | 32.7% | 43.0% | 21.3% | 4.5% | 11.8% | 21.8% | 15.6% | 16.3% | 11.3% | 14.1% | 9.7% | 7.9% | |||||
| Gross profit | 36.6% | 64.5% | 32.0% | 7.3% | 15.7% | 24.8% | 17.8% | 19.9% | 13.0% | 15.2% | 11.0% | 9.4% | |||||
| Operating inc ome | 44.5% | 78.6% | 37.9% | 6.8% | 16.3% | 28.7% | 19.6% | 22.0% | 13.8% | 15.9% | 11.7% | 9.8% | |||||
| Net income | 42.9% | 84.9% | 37.0% | 8.2% | 14.8% | 28.7% | 19.6% | 22.0% | 13.8% | 15.9% | 11.7% | 9.8% | |||||
| YoY growth (%) | YoY growth (%) | YoY growth (%) | YoY growth (%) | YoY growth (%) | YoY growth (%) | YoY growth (%) | YoY growth (%) | YoY growth (%) | YoY growth (%) | YoY growth (%) | YoY growth (%) | YoY growth (%) | |||||
| Revenue | 52.5% | 110.0% | 128.1% | 140.5% | 102.8% | 72.8% | 64.7% | 83.2% | 82.3% | 70.8% | 62.1% | 50.4% | 56% | 46% | 110% | 79% | 64% |
| Gross profit | 47.6% | 134.3% | 178.7% | 217.9% | 169.3% | 104.3% | 82.3% | 103.8% | 99.0% | 83.8% | 73.2% | 58.1% | 59% | %9% | 147% | 107% | 75% |
| Operati ng inc ome | 50% | 174.2% | 251.9% | 280.0% | 206.0% | 120.5% | 91.3% | 118.6% | 113.9% | 92.6% | 79.9% | 61.9% | 65% | 57% | 194% | 122% | 83% |
| Net income | 53.9% | 183.9% | 241.0% | 291.4% | 214.5% | 118.9% | 91.3% | 115.8% | 113.9% | 92.6% | 79.9% | 61.9% | 75% | 53% | 196% | 121% | 83% |
Source: Company data, Goldman Sachs Global Investment Research
e92c7a75ab8b4efbba794e6b187208c8
For the exclusive use of [訂閱者已遮蔽]
Exhibit 10: TUC P&L summary
| NT$mn | 1Q26 | 2Q26 | 3Q26E | 4Q26E | 1Q27E | 2Q27E | 3Q27E | 4Q27E | 1Q28E | 2Q28E | 3Q28E | 4Q28E | 2024 | 2025 | 2026E | 2027E | 2028E |
|---|---|---|---|---|---|---|---|---|---|---|---|---|---|---|---|---|---|
| Revenue | 10,054 | 14,301 | 17,621 | 19,785 | 21,664 | 25,821 | 33,587 | 39,348 | 41,153 | 45,886 | 55,305 | 60,569 | 23,070 | 30,340 | 61,760 | 120,421 | 202,913 |
| Gross profit | 2,529 | 4,250 | 5,835 | 6.897 | 7,712 | 9,395 | 12,468 | 14,883 | 15,466 | 17,196 | 21,093 | 23,533 | 5,342 | 6,898 | 19,510 | 44,457 | 77,288 |
| Operating expense | (701) | (892) | (1,022) | (1,108) | (1,181) | (1,381) | (1,511) | (1,613) | (1,708) | (1.790) | (1,963) | (2,271) | (2,010) | (2,554) | (3,723) | (5,687) | (7.732) |
| Operating inc ome | 1,828 | 3,358 | 4,813 | 5,789 | 6,531 | 8,013 | 10.956 | 13,270 | 13,758 | 15,407 | 19,130 | 21,262 | 3,332 | 4,344 | 15,787 | 38,770 | 69,556 |
| Pretax inc ome | 1,874 | 3,427 | 4,813 | 5,269 | 6,011 | 7,613 | 10,956 | 13,270 | 13,722 | 15,372 | 19,130 | 21,262 | 3,378 | 4,519 | 15,383 | 37,850 | 69,485 |
| Taxes expense | (614) | (1,085) | (1,155) | (1,265) | (1,503) | (1,903) | (2,739) | (3,317) | (3,431) | (3,843) | (4,782) | (5,315) | (773) | (1,109) | (4,119) | (9,463) | (17,371) |
| Net income | 1,260 | 2,342 | 3,658 | 4,005 | 4,508 | 5,710 | 8,217 | 9,952 | 10,292 | 11,529 | 14,347 | 15,946 | 2,604 | 3,409 | 11,264 | 28,388 | 52,114 |
| EPS, NT$ | 4.36 | 8.02 | 12.53 | 13.72 | 15.44 | 19.56 | 28.14 | 34.08 | 35.25 | 39.48 | 49.14 | 54.61 | 9.56 | 12.13 | 38.63 | 97.22 | 178.48 |
| Ratio analysis and assumption | Ratio analysis and assumption | Ratio analysis and assumption | Ratio analysis and assumption | Ratio analysis and assumption | Ratio analysis and assumption | Ratio analysis and assumption | Ratio analysis and assumption | Ratio analysis and assumption | Ratio analysis and assumption | Ratio analysis and assumption | Ratio analysis and assumption | Ratio analysis and assumption | Ratio analysis and assumption | Ratio analysis and assumption | Ratio analysis and assumption | Ratio analysis and assumption | Ratio analysis and assumption |
| As % of sales | As % of sales | As % of sales | As % of sales | As % of sales | As % of sales | As % of sales | As % of sales | As % of sales | As % of sales | As % of sales | As % of sales | As % of sales | As % of sales | As % of sales | As % of sales | As % of sales | As % of sales |
| Gross margin | 25.1% | 29.7% | 33.1% | 34.9% | 35.6% | 36.4% | 37.1% | 37.8% | 37.6% | 37.5% | 38.1% | 38.9% | 23.2% | 22.7% | 31.6% | 36.9% | 38.1% |
| Operating expense ratio | 7.0% | 6.2% | 5.8% | 5.6% | 5.5% | 5.4% | 4.5% | 4.1% | 4.2% | 3.9% | 3.6% | 3.8% | 8.7% | 8.4% | 6.0% | 4.7% | 3.8% |
| Operating margin | 18.2% | 23.5% | 27.3% | 29.3% | 30.1% | 31.0% | 32.6% | 33.7% | 33.4% | 33.6% | 34.6% | 35.1% | 14.4% | 14.3% | 25.6% | 32.2% | 34.3% |
| Net margin | 12.5% | 16.4% | 20.8% | 20.2% | 20.8% | 22.1% | 24.5% | 25.3% | 25.0% | 25.1% | 25.9% | 26.3% | 11.3% | 11.2% | 18.2% | 23.6% | 25.7% |
| QoQ growth (%) | QoQ growth (%) | QoQ growth (%) | QoQ growth (%) | QoQ growth (%) | QoQ growth (%) | QoQ growth (%) | QoQ growth (%) | QoQ growth (%) | QoQ growth (%) | QoQ growth (%) | QoQ growth (%) | QoQ growth (%) | QoQ growth (%) | QoQ growth (%) | QoQ growth (%) | QoQ growth (%) | QoQ growth (%) |
| Revenue | 10.2% | 42.2% | 23.2% | 12.3% | 9.5% | 19.2% | 30.1% | 17.2% | 4.6% | 11.5% | 20.5% | 9.5% | |||||
| Gross profit | 25.5% | 68.1% | 37.3% | 18.2% | 11.8% | 21.8% | 32.7% | 19.4% | 3.9% | 11.2% | 22.7% | 11.6% | |||||
| Operating inc ome | 41.7% | 83.7% | 43.3% | 20.3% | 12.8% | 22.7% | 36.7% | 21.1% | 3.7% | 12.0% | 24.2% | 11.1% | |||||
| Net income | 16.4% | 85.8% | 56.2% | 9.5% | 12.6% | 26.6% | 43.9% | 21.1% | 3.4% | 12.0% | 24.4% | 11.1% | |||||
| YoY growth (%) | YoY growth (%) | YoY growth (%) | YoY growth (%) | YoY growth (%) | YoY growth (%) | YoY growth (%) | YoY growth (%) | YoY growth (%) | YoY growth (%) | YoY growth (%) | YoY growth (%) | YoY growth (%) | YoY growth (%) | YoY growth (%) | YoY growth (%) | YoY growth (%) | YoY growth (%) |
| Revenue | 57.8% | 110.9% | 118.5% | 116.8% | 115.5% | 80.6% | 90.6% | 98.9% | %0.0% | 71% | 64.7% | 53.9% | 44% | 32% | 104% | 95% | 69% |
| Gross profit | 64.9% | 196.1% | 204.7% | 242.3% | 205.0% | 121.1% | 113.7% | 115.8% | 100.5% | 83.0% | 69.2% | 58.1% | 69% | 29% | 183% | 128% | 74% |
| Operating inc ome | 95.3% | 293.9% | 280.3% | 348.9% | 257.4% | 138.6% | 127.7% | 129.2% | 110.7% | 92.3% | 74.6% | 60.2% | 134% | 30% | 263% | 146% | 79% |
| Net income | 87.4% | 259.3% | 264.8% | 270.0% | 257.8% | 143.8% | 124.7% | 148.5% | 128.3% | 101.9% | 74.6% | 60.2% | 216% | 31% | 230% | 152% | 84% |
Source: Company data, Goldman Sachs Global Investment Research
Exhibit 11: Co-Tech P&L summary
| NT$mn | 1Q26 | 2Q26 | 3Q26E | 4Q26E | 1Q27E | 2Q27E | 3Q27E | 4Q27E | 1Q28E | 2Q28E | 3Q28E | 4Q28E | 2025 | 2026E | 2027E | 2028E | 2029E |
|---|---|---|---|---|---|---|---|---|---|---|---|---|---|---|---|---|---|
| Revenue | 2.532 | 2.805 | 3,230 | 3,356 | 4,160 | 5.047 | 5,973 | 7,079 | 7,100 | 7,236 | 7,788 | 8.647 | 7,880 | 11,923 | 22,259 | 30,771 | 41,803 |
| Gross profit | 727 | 768 | 907 | 1,094 | 1,613 | 2,002 | 2,345 | 3,015 | 3,212 | 3,301 | 3,396 | 3,962 | 1,715 | 3,496 | 8,975 | 13,871 | 20.177 |
| Operating expense | (78) | (83) | (89) | (99) | (119) | (146) | (179) | (198) | (206) | (210) | (218) | (254) | (268) | (349) | (643) | (888) | (1,058) |
| Operating income | 649 | 685 | 818 | 995 | 1,494 | 1,855 | 2.166 | 2,817 | 3,006 | 3,092 | 3,178 | 3,708 | 1,447 | 3,147 | 8,332 | 12,983 | 19,119 |
| Pretax income | 649 | 688 | 818 | 995 | 1,494 | 1,855 | 2,166 | 2,817 | 3,106 | 3,192 | 3.278 | 3,808 | 1,341 | 3,151 | 8,332 | 13,383 | 19,119 |
| Taxes expense | (129) | (143) | (161) | (199) | (295) | (362) | (425) | (563) | (614) | (623) | (644) | (762) | (278) | (632) | (1,646) | (2,642) | (3,772) |
| Net income | 520 | 545 | 657 | 796 | 1,199 | 1,493 | 1,740 | 2,253 | 2,493 | 2,569 | 2,634 | 3,046 | 1,063 | 2,518 | 6,686 | 10,741 | 15,347 |
| EPS, NT$ | 2.06 | 2.16 | 2.61 | 3.16 | 4.75 | 5.92 | 6.90 | 8.93 | 9.88 | 10.18 | 10.44 | 12.08 | 4.21 | 9.98 | 26.51 | 42.58 | 60.84 |
| Ratio analysis and assumption | |||||||||||||||||
| As % of sales | |||||||||||||||||
| Gross margin | 28.7% | 27.4% | 28.1% | 32.6% | 38.8% | 39.7% | 39.3% | 42.6% | 45.2% | 45.6% | 43.6% | 45.8% | 21.8% | 29.3% | 40.3% | 45.1% | 48.3% |
| Operating expense ratio | 3.1% | 3.0% | 2.8% | 3.0% | 2.9% | 2.9% | 3.0% | 2.8% | 2.9% | 2.9% | 2.8% | 2.9% | 3.4% | 2.9% | 2.9% | 2.9% | 2.5% |
| Operating margin | 25.6% | 24.4% | 25.3% | 29.7% | 359% | 36.8% | 363% | 398% | 42.3% | 42.7% | 40.8% | 42.9% | 18.4% | 26.4% | 37.4% | 42.2% | 45.7% |
| Net margin | 20.5% | 19.4% | 20.4% | 23.7% | 28.8% | 29.6% | 29.1% | 31.8% | 35.1% | 35.5% | 33.8% | 35.2% | 13.5% | 21.1% | 30.0% | 34.9% | 36.7% |
| QoQ growth (%) | |||||||||||||||||
| Revenue | 17.0% | 10.8% | 15.1% | 3.9% | 24.0% | 21.3% | 18.3% | 18.5% | 0.3% | 1.9% | 7.6% | 11.0% | |||||
| Gross profit | 28.3% | 5.7% | 18.1% | 20.7% | 47.4% | 24.1% | 17.1% | 28.6% | 65% | 2.8% | 2.9% | 16.7% | |||||
| Operating income | 33.2% | 5.5% | 19.5% | 21.6% | 50.1% | 24.2% | 16.7% | 30.1% | 6.7% | 2.8% | 2.8% | 16.7% | |||||
| Net income | 37.7% | 4.9% | 20.6% | 21.1% | 50.6% | 24.5% | 16.5% | 29.5% | 10.6% | 3.0% | 2.5% | 15.7% | |||||
| YoY growth (%) | |||||||||||||||||
| Revenue | 46.5% | 40.1% | 62.6% | 55.1% | 64.3% | 79.9% | 84.9% | 110.9% | 70.7% | 43.4% | 30.4% | 22.2% | 15.5% | 51.3% | 86.7% | 38.2% | 35.9% |
| Gross profit | 100.4% | 103.4% | 122.3% | 93.1% | 121.8% | 160.6% | 158.6% | 175.6% | 99.2% | 649% | 44.8% | 31.4% | 26.7% | 103.9% | 156.7% | 54.6% | 45.5% |
| Operating income | 112.3% | 115.8% | 142.7% | 104.3% | 130.2% | 170.9% | 164.7% | 183.1% | 101.2% | %999 | 46.7% | 31.6% | 26.6% | 117.4% | 164.8% | 55.8% | 47.3% |
| Net income | 96.1% | 226.4% | 159.6% | 111.0% | 130.7% | 174.0% | 164.7% | 183.1% | 107.9% | 72.0% | 51.4% | 35.2% | 15.3% | 137.0% | 165.5% | 60.7% | 42.9% |
Source: Company data, Goldman Sachs Global Investment Research
e92c7a75ab8b4efbba794e6b187208c8
For the exclusive use of [訂閱者已遮蔽]
Exhibit 12: ZDT P&L summary
| NT$mn | 1Q26 | 2Q26 | 3Q26E | 4Q26E | 1Q27E | 2Q27E | 3Q27E | 4Q27E | 1Q28E | 2Q28E | 3Q28E | 4Q28E | 2025 | 2026E | 2027E | 2028E | 2029E |
|---|---|---|---|---|---|---|---|---|---|---|---|---|---|---|---|---|---|
| Revenue | 40,728 | 48,431 | 64,324 | 74,492 | 72,587 | 82,511 | 101,729 | 115,762 | 107,568 | 127,860 | 162,600 | 189,606 | 182,522 | 227,975 | 372,589 | 587,634 | 787,166 |
| Gross profit | 8,812 | 11,186 | 16,700 | 19,686 | 17,504 | 21,297 | 29,949 | 34,184 | 29,849 | 38,225 | 53,477 | 63,198 | 36,136 | 56,384 | 102,934 | 184,748 | 266,597 |
| Operating expense | (6,308) | (7.425) | (8,748) | (9,088) | (8,652) | (9,386) | (11,080) | (12,385) | (11,403) | (14,251) | (16,914) | (19,107) | (22,205) | (31,569) | (41,503) | (61,676) | (77,751) |
| Operating income | 2,503 | 3,761 | 7,952 | 10,598 | 8,852 | 11,912 | 18,869 | 21,799 | 18,445 | 23,974 | 36,562 | 44,091 | 13,932 | 24,815 | 61,432 | 123,072 | 188,847 |
| Pretax income | 2,400 | 4,931 | 8,452 | 11,598 | 9,252 | 12,262 | 18,919 | 22,299 | 18,495 | 24,024 | 36,612 | 44,391 | 14,063 | 27,382 | 62,732 | 123,522 | 189,497 |
| Taxes expense | (353) | (1,204) | (1,268) | (1,740) | (1,573) | (2,084) | (2,838) | (3,345) | (3,144) | (4,084) | (5,492) | (6,659) | (3,458) | (4,565) | (9,840) | (19,379) | (30,144) |
| Net income | 1,426 | 2,392 | 5,071 | 6,959 | 5,505 | 7,210 | 11,351 | 13,379 | 11,005 | 14,126 | 21,967 | 26,634 | 6,791 | 15,847 | 37,446 | 73,732 | 112,959 |
| EPS, NT$ | 1.33 | 2.19 | 4.65 | 6.38 | 5.05 | 6.61 | 10.41 | 12.27 | 10.10 | 12.96 | 20.15 | 24.43 | 6.91 | 14.56 | 34.35 | 67.64 | 103.63 |
| Ratio analysis and assumption | Ratio analysis and assumption | Ratio analysis and assumption | Ratio analysis and assumption | Ratio analysis and assumption | Ratio analysis and assumption | Ratio analysis and assumption | Ratio analysis and assumption | Ratio analysis and assumption | Ratio analysis and assumption | Ratio analysis and assumption | Ratio analysis and assumption | Ratio analysis and assumption | Ratio analysis and assumption | Ratio analysis and assumption | Ratio analysis and assumption | Ratio analysis and assumption | Ratio analysis and assumption |
| As % of sales | As % of sales | As % of sales | As % of sales | As % of sales | As % of sales | As % of sales | As % of sales | As % of sales | As % of sales | As % of sales | As % of sales | As % of sales | As % of sales | As % of sales | As % of sales | As % of sales | As % of sales |
| Gross margin | 21.6% | 23.1% | 26.0% | 26.4% | 24.1% | 25.8% | 29.4% | 29.5% | 27.7% | 29.9% | 32.9% | 33.3% | 19.8% | 24.7% | 27.6% | 31.4% | 33.9% |
| Operating expense ratio | 15.5% | 15.3% | 13.6% | 12.2% | 11.9% | 11.4% | 10.9% | 10.7% | 10.6% | 11.1% | 10.4% | 10.1% | 12.2% | 13.8% | 11.1% | 10.5% | 96% |
| Operating margin | 6.1% | 7.8% | 12.4% | 14.2% | 12.2% | 14.4% | 18.5% | 18.8% | 17.1% | 18.7% | 22.5% | 23.3% | 7.6% | 10.9% | 16.5% | 20.9% | 24.0% |
| Net margin | 3.5% | 4.9% | 7.9% | 9.3% | 7.6% | 8.7% | 11.2% | 11.6% | 10.2% | 11.0% | 13.5% | 14.0% | 3.7% | 7.0% | 10.1% | 12.5% | 14.4% |
| QoQ growth (%) | QoQ growth (%) | QoQ growth (%) | QoQ growth (%) | QoQ growth (%) | QoQ growth (%) | QoQ growth (%) | QoQ growth (%) | QoQ growth (%) | QoQ growth (%) | QoQ growth (%) | QoQ growth (%) | QoQ growth (%) | QoQ growth (%) | QoQ growth (%) | QoQ growth (%) | QoQ growth (%) | QoQ growth (%) |
| Revenue | -28.4% | 18.9% | 32.8% | 15.8% | -2.6% | 13.7% | 23.3% | 13.8% | -7.1% | 18.9% | 27.2% | 16.6% | |||||
| Gross profit | -31.3% | 26.9% | 49.3% | 17.9% | -11.1% | 21.7% | 40.6% | 14.1% | -12.7% | 28.1% | 39.9% | 18.2% | |||||
| Operating income | -57.7% | 50.2% | 111.4% | 33.3% | -16.5% | 34.6% | 58.4% | 15.5% | -15.4% | 30.0% | 52.5% | 20.6% | |||||
| Net income | -54.9% | 67.8% | 112.1% | 37.2% | -20.9% | 31.0% | 57.4% | 17.9% | -17.7% | 28.4% | 55.5% | 21.2% | |||||
| YoY growth (%) | YoY growth (%) | YoY growth (%) | YoY growth (%) | YoY growth (%) | YoY growth (%) | YoY growth (%) | YoY growth (%) | YoY growth (%) | YoY growth (%) | YoY growth (%) | YoY growth (%) | YoY growth (%) | YoY growth (%) | YoY growth (%) | YoY growth (%) | YoY growth (%) | YoY growth (%) |
| Revenue | 1.6% | 26.8% | 35.8% | 31.0% | 78.2% | 70.4% | 58.2% | 55.4% | 48.2% | 55.0% | 59.8% | 63.8% | 6% | 25% | 63% | 58% | 34% |
| Gross profit | 49.7% | 59.6% | 60.4% | 53.4% | %98% | 90.4% | 79.3% | 73.6% | 70.5% | 79.5% | 78.6% | 84.9% | 11% | 56% | 83% | 79% | 44% |
| Operating income | 137.1% | 55.1% | 75.5% | 79.0% | 253.6% | 216.7% | 137.3% | 105.7% | 108.4% | 101.3% | 93.8% | 102.3% | 20% | 78% | 148% | 100% | 53% |
| Net income | 125.4% | 295.3% | 112.0% | 120.1% | 286.1% | 201.5% | 123.8% | 92.3% | 9.9% | 965.9% | 93.5% | 99.1% | -26% | 133% | 136% | 97% | 53% |
Source: Company data, Goldman Sachs Global Investment Research
Investment Thesis - Elite Material
EMC, a key supplier of high-end HDI material (70%+ market share) and SLP material (90%+ market share), has been focusing on the high-speed switch/server CCL market for 3-5+ years. We are positive on its market share trajectory in the server industry and expect EMC to increase its share from <10% in the Purley generation to 15-20%/20+% in the Whitley/Eagle Stream platforms. EMC is also proactively expanding its share in the switch market (40%/30%+ in 2024/23 vs. <5% before 2019), with an expanding AI customer base (only one 400G customer in 3Q20, to being one of the largest suppliers in 2023), which should continue to benefit the company's top/bottom line growth over time. We believe EMC's leading position in the AI server CCL market should drive strong revenue growth and GM/OPM expansion in the long term, given that it is the major supplier for all Nvidia/Google/AWS AI server projects, and we expect it to maintain its leadership position. Considering its leading position in the high-end CCL industry, solid production skills and earnings growth outlook, we are Buy rated on the stock. With the shares trading at a 2026E P/E below AI server component suppliers and supported by a solid growth outlook, we view valuation as attractive.
Key downside risks include: (1) RCC to replace all high-end smartphone HDI design; (2) rising trade tensions, which could lead to weaker smartphone and server shipments; and (3) rising competition from mainland China peers.
Price Target Risks and Methodology - Elite Material
Valuation methodology: Our 12m TP of NT$10,200 is based on 27x 2H27-1H28E P/E (in line with the peak P/E multiple for AI component suppliers in the past 3 years).
Key downside risks: (1) RCC to replace all high-end smartphone HDI design; (2) rising trade tensions, which could lead to weaker smartphone and server shipments; and (3) rising competition from mainland China peers.
e92c7a75ab8b4efbba794e6b187208c8
For the exclusive use of [訂閱者已遮蔽]
Investment Thesis - Taiwan Union Technology Corp.
TUC is a key high-end global CCL supplier that focuses on M7+ grade high-speed CCL (key applications include high-end switches (100G+) and AI server materials), with 20%+ market share in the past two years. The company continues to expect its unit market share in the server industry to increase from 15% in Whitley and Purley processors to higher in the Eagle Stream generation, and plans to launch two types of products for low-end and high-end customers (T2A and T2C) to gain market share. Also, strong growth in 400G/800G switch shipments and new 800G switch shipments, scheduled for launch in 2025-27, should continue to be a key demand driver for TUC, in our view. Additionally, the company is working on high-end AI projects with CSP and enterprise players, which we believe should drive revenue momentum in the long term. We view the stock as undervalued vs. Taiwan CCL peers on a P/E basis and rate it Buy.
Key downside risks include: (1) slower-than-expected share gains in the low-loss CCL segment; (2) rising trade tensions, which could lead to weaker server and switch shipments globally; and (3) rising competition from mainland China peers.
Price Target Risks and Methodology - Taiwan Union Technology Corp.
Valuation methodology: Our 12m TP of NT$3,010 is based on a 22x 2027E P/E (+2x STDV higher than the past 3-year industry average P/E multiple).
Key downside risks: (1) slower-than-expected share gains in the low-loss CCL segment; (2) rising trade tensions, which could lead to weaker server and switch shipments globally; and (3) rising competition from mainland China peers.
Investment Thesis - Co-Tech
Co-Tech is a global leading general server copper foil supplier, with ~60% market share in 2025 per GSe. We expect the company to enjoy solid share gain opportunities in the near term, considering its proactive HVLP capacity expansion plan and strong know-how in the advanced copper foil industry. Also, adoption of HVLP4 copper foil from AI servers and 1.6T networking switches starting in 2H26 should be a key demand driver for Co-Tech, in our view. Additionally, the company's proactive pricing strategy and ability to improve production yield should drive revenue momentum in the long term.
We are Buy rated as we believe Co-Tech will see better revenue/profitability in the long term given its shift to a more premium product mix along with proactive capacity plans (Plant 3 to be ready by end of 2027) and this should lead to strengthened valuations.
Valuation methodology: Our 12m TP of NT$940 is based on a 22x 2028E P/E, which is +1SD above the company's average upcycle valuation in the past 10-years.
Key downside risks: (1) earlier than expected CPO adoption in the computing IC, (2) slower than expected yield rate improvement speed, and (3) much stronger than expected capacity growth from HVLP peers, limiting pricing power e92c7a75ab8b4efbba794e6b187208c8
For the exclusive use of [訂閱者已遮蔽]
Investment Thesis - Zhen Ding Technology
Zhen Ding Technology (ZDT) is the global leading PCB supplier (top 1 in market share in sales) with 7-10% market share, and started its ABF substrate business from 2023 in Shenzhen, China; it has the highest ABF revenue exposure to the China market compared to all other ABF substrate suppliers. We believe ZDT will hold more than 40% ABF substrate market share in China by 2027E (up from 31% in 2024) and benefit the most from the strong and growing China ABF substrate market (53% 2025-27E CAGR) due to the increasing in-sourcing ratio for the AI computing ASIC/GPU market in China. We also expect the increasing foldable smartphone penetration rate in the long term to drive ZDT's FPC TAM, and account for 39% of the company's total revenue in 2027E. We see further revenue upside potential from foldable phones. We are Buy rated mainly due to our positive view on the company's China ABF substrate business opportunity, which should not only drive ZDT's revenue growth, but also improve its OPM level in the long term. We see upside for the stock price considering the company's solid growth opportunity, and our TP implied P/E multiple is still lower than the company's past 10+ year P/E average, which we believe is fair considering the potential upside from China ABF substrate market and increasing foldable phone penetration rate.
Valuation: Our 12-month TP of NT$1,025 is based on a SOTP valuation methodology, including (1) 3.5x blended 2028E P/B for ABF & BT substrate, (2) 20x 2028E P/E for high-growth AI server/switch related PCB (in line with industry average), and (3) 8x 2028E P/E for low-growth consumer electronics PCB (in line with industry downcycle average valuation).
Key downside risks include: (1) weaker-than-expected iPhone demand or slower content upgrade, (2) delay in new substrate capacity or slower-than-expected yield rate ramp up progress, and (3) fiercer competition in China ABF market.
e92c7a75ab8b4efbba794e6b187208c8
For the exclusive use of [訂閱者已遮蔽]
圖片清單(已驗證 2026-10-27)
本報告無裝飾圖。_009–_012 為評等與目標價歷史圖(附錄,原文內嵌於免責頁前),內文未引用。
| 檔名 | 分類 | 親眼所見內容 |
|---|---|---|
| 報告_GS_台灣PCB與CCL_20261025_001.png | 真資料圖(財務) | 折線圖 2015–2028E:ABF suppliers avg OPM 與 CCL suppliers avg OPM;標註 2020 年「First time seeing client paying ABF suppliers subsidy to secure capacity」與 2025 年起「more substrate/PCB/CCL players' future investment plans to be supported by end customers」;兩條線 2026E 起明顯上揚,2028E 約 33%/37%。 |
| 報告_GS_台灣PCB與CCL_20261025_002.png | 真資料圖(財務) | 折線圖:PCB、CCL、Copper foil 三類折舊占營收比,2025 年約 2.1%/1.9%/1.1%,2028 年降至約 0.7%/0.35%/0.4%。 |
| 報告_GS_台灣PCB與CCL_20261025_003.png | 真資料圖 | CCL 世代時間軸(2015–2030E):M4(HTE 銅箔,上代一般伺服器、iPhone)、M6(HVLP1/2,一般伺服器、100G switch)、M7(HVLP2/3,高階一般伺服器、低階 AI server、400G switch)、M8(HVLP3/4,高階 AI server、800G switch)、M9(HVLP4/5,次世代 AI server、1.6T switch)、M10(HVLP5/6,N+2 世代 AI server、3.2T switch)、M11(HVLP5/6,N+3 世代 AI server、6.4T switch);陰影為各世代主流期間。 |
| 報告_GS_台灣PCB與CCL_20261025_004.png | 真資料圖(財務) | 長條圖 Exhibit 4:US$ ASP,由左至右 TUC 2026 ASP、M4、EMC 2026 ASP、TUC 2027 ASP、TUC 2028 ASP、EMC 2027 ASP、M6、EMC 2028 ASP、M7、M8、M9 with LowDK2(約 300)、M9 with Q-glass(約 450)、M10 with Q-glass/HC(約 800)。 |
| 報告_GS_台灣PCB與CCL_20261025_005.png | 真資料圖(財務) | 長條圖 Exhibit 5:同上排列並加入 ABF CCL(約 US$1,500,紅柱);M7 約 120、M8 約 180。 |
| 報告_GS_台灣PCB與CCL_20261025_006.png | 真資料圖(財務) | Exhibit 6:Substrate CCL TAM 長條(2026E 約 0.8–1、2027E 約 2–2.5、2028E 約 4–4.5,US$bn)疊加 % of EMC's revenue 折線(約 15%→22%);右側 EMC GM(約 35%→43%)與 Substrate CCL GM(約 55%→70%)。 |
| 報告_GS_台灣PCB與CCL_20261025_007.png | 真資料圖 | 光互連演進示意圖(上視+側視):Pluggable Optics(Switch ASIC→package substrate→PCB 銅線→QSFP connector→光纖)、On-Board Optics(OBO)、2.5D Near-Packaged Optics(NPO,EIC+PIC 置於 SLP 上)、2.5D CPO(optical engine 與 ASIC 同 package substrate)、3D CPO(interposer 疊 EIC/PIC);紅線標示電訊號路徑,由上至下漸短。 |
| 報告_GS_台灣PCB與CCL_20261025_008.png | 真資料圖(財務) | 長條圖:Optical module mSAP 市場(US$mn)2025 約 500、2026E 約 2,000、2027E 約 5,000、2028E 約 7,100,紅箭頭標註「87% 2026-28E CAGR」。 |
| 報告_GS_台灣PCB與CCL_20261025_009.png | 真資料圖(財務) | 臻鼎(4958.TW)GS 評等與目標價歷史圖,至 2026-09-30;最後一筆目標價標示 925。 |
| 報告_GS_台灣PCB與CCL_20261025_010.png | 真資料圖(財務) | 台光電(2383.TW)GS 評等與目標價歷史圖;最後兩筆標示 9500、10200。 |
| 報告_GS_台灣PCB與CCL_20261025_011.png | 真資料圖(財務) | 台燿(6274.TWO)GS 評等與目標價歷史圖;最後標示 3010(前一筆 2860)。 |
| 報告_GS_台灣PCB與CCL_20261025_012.png | 真資料圖(財務) | 金居(8358.TWO)GS 評等與目標價歷史圖;2026-05-19 起 NA→B,目標價 900、940。 |