PDF 原檔:報告_GS_台灣ODM品牌_20260930_original.pdf
圖片清單(已驗證 2026-09-30)
| 檔名 | size | 分類 | 親眼所見內容 |
|---|---|---|---|
報告_GS_台灣ODM品牌_20260930_015.png |
40KB | 真資料圖 | 散點圖:X 軸 2027-28E avg. EPS YoY、Y 軸 2027E P/E,標示 Asus/Quanta/Gigabyte/AVC/FII 四點與迴歸線及公式(y=24.547x+10.36, R²=0.4792)(Exhibit 29:Inventec 同業 EPS 成長與 P/E 相關性) |
報告_GS_台灣ODM品牌_20260930_010.png |
49KB | 真資料圖 | 12 個月遠期 P/E 走勢圖(Jan-16 至 Jul-26),標示 +1stv 15.7x/avg 11.8x/-1stv 8.0x 三條虛線(Exhibit 18:Wistron 12m forward P/E) |
報告_GS_台灣ODM品牌_20260930_016.png |
50KB | 真資料圖 | 12 個月遠期 P/E 走勢圖(Jan-18 至 Jul-26),標示 +1stv 20.9x/avg 16.4x/-1stv 11.9x 三條虛線(Exhibit 30:Inventec 12M forward P/E ratio) |
報告_GS_台灣ODM品牌_20260930_008.png |
58KB | 真資料圖 | 長條圖:2025-26 月營收(NT$m,左軸)疊加 YoY%(右軸黃線),Jan-25 至 Nov-26(E),Sep-Oct-Nov 26(E) 以淺色長條標示(Exhibit 15:Wistron monthly revenues) |
報告_GS_台灣ODM品牌_20260930_014.png |
61KB | 真資料圖 | 「Exhibit 27: Inventec Aug revenues up 36% YoY」長條圖:2025-26 月營收(NT$m,左軸)疊加 YoY%(右軸黃線),Jan 至 Nov(E) |
分類只有三類:
真資料圖/裝飾·logo·banner/文字卡。<40KB 未 Read 者免列(預設 logo)。本份報告含多張小尺寸(<40KB)長條/折線月營收圖(如 Exhibit 1/2/6/9/11/20/22/24/26/32 等),依 size 篩選規則未逐張驗證,未列入清單、亦不嵌入 lib 頁。
原始內容
[讀者資訊已遮蔽]
Taiwan ODM/Brands: 3-month preview: Aug +9% MoM on avg; new AI server racks and smartphone models to drive growth in coming months
We preview 3-month revenues for 10 companies under coverage in the AI server/PC supply chain, and update our estimates for Wistron and Inventec. Across the supply chain, we are positive on: (1) Apple's supply chain on the back of a ramp up of new models with form factor changes (i.e. foldable phones in 2026, and the iPhone 20 in 2027) to support end demand; (2) AI server components to ride on specification upgrades; and (3) ASIC AI servers' rising penetration rate. Buy: Hon Hai, Wiwynn, Wistron, AVC; Neutral: Gigabyte, Quanta, Inventec, Compal, ASUS; Sell: Pegatron.
On a MoM basis, we expect the average revenue growth of the 10 companies to come in at +7%/ +2%/ +4% in Sep/ Oct / Nov 2026 (Exhibit 1). We expect sequential revenue growth in coming months, driven by the next-generation rack-level AI server and new flagship smartphone models shipments ramp up.
On a YoY basis, we expect the average revenue growth of the 10 companies to come in at +49%/ +57%/ +52% in Sep/ Oct / Nov 2026 (Exhibit 2), driven by the continuous ramp-up of AI servers, along with a PC product mix upgrade, new smartphone models, and high memory costs driving up the selling price.
Allen Chang
+852-2978-2930 | allen.k.chang@gs.com Goldman Sachs (Asia) L.L.C.
Verena Jeng
+852-2978-1681 | verena.jeng@gs.com Goldman Sachs (Asia) L.L.C.
e92c7a75ab8b4efbba794e6b187208c8
[讀者資訊已遮蔽]
Exhibit 1: Sep 2026E revenue MoM
Exhibit 2: Sep 2026E revenue YoY
Source: Goldman Sachs Global Investment Research
Source: Goldman Sachs Global Investment Research
Jun 2026 to Nov 2026 revenue trends for Taiwan server / PC names
Exhibit 3: Taiwan PC/server names monthly revenue summary
| Rev YoY - Jun-26 | Rev YoY - Jul-26 | Rev YoY - Aug-26 | Rev YoY - Sep-26(E) | Rev YoY - Oct-26(E) | Rev YoY - Nov-26(E) | Rev MoM - Jun-26 | Rev MoM - Jul-26 | Rev MoM - Aug-26 | Rev MoM - Sep-26(E) | Rev MoM - Oct-26(E) | Rev MoM - Nov-26(E) | |
|---|---|---|---|---|---|---|---|---|---|---|---|---|
| Wiwynn | 30% | 39% | 50% | 68% | 62% | 68% | 33% | 6% | 23% | 1% | 2% | 10% |
| Quanta | 103% | 131% | 177% | 45% | 66% | 63% | 24% | -5% | 16% | -36% | 6% | 9% |
| Gigabyte | 69% | 60% | 98% | 87% | 87% | 74% | -13% | 3% | 7% | 10% | 1% | 1% |
| Wistron | 54% | 61% | 166% | 128% | 153% | 70% | 11% | -4% | 49% | 1% | 1% | 2% |
| Inventec | 62% | 66% | 36% | 36% | 51% | 61% | 23% | -12% | -8% | -1% | 1% | 1% |
| Asus | 56% | 53% | 51% | 19% | 36% | 29% | 54% | -21% | 13% | 4% | -8% | -5% |
| Compal | 58% | 38% | 15% | 31% | 48% | 47% | 36% | -15% | -17% | 36% | 1% | 1% |
| Hon Hai | 52% | 54% | 52% | 21% | 19% | 36% | -4% | 15% | -3% | 9% | 6% | 7% |
| Pegatron | 16% | 12% | 34% | 14% | 12% | 30% | -5% | -6% | 3% | 48% | 1% | 1% |
| AVC | 66% | 57% | 54% | 37% | 32% | 39% | 11% | 6% | 4% | 2% | 9% | 11% |
Source: Company data, Goldman Sachs Global Investment Research
Exhibit 4: Taiwan ODM notebook monthly shipment
| Aug-25 | Sep-25 | Oct-25 | Nov-25 | Dec-25 | Jan-26 | Feb-26 | Mar-26 | Apr-26 | May-26 | Jun-26 | Jul-26 | Aug-26 | |
|---|---|---|---|---|---|---|---|---|---|---|---|---|---|
| Notebook shipments (m units) | 11.2 | 12.0 | 10.1 | 10.4 | 11.8 | 8.4 | 7.0 | 13.8 | 9.1 | 9.3 | 12.0 | 8.2 | 7.3 |
| Quanta | 4.1 | 4.6 | 3.5 | 3.5 | 3.9 | 2.7 | 2.0 | 5.3 | 3.5 | 3.5 | 4.5 | 2.8 | 2.6 |
| Compal | 2.3 | 2.5 | 2.1 | 2.3 | 2.4 | 1.6 | 1.5 | 2.8 | 1.8 | 2.0 | 2.4 | 1.8 | 1.4 |
| Inventec | 1.8 | 1.9 | 1.6 | 1.7 | 2.0 | 1.7 | 1.5 | 2.2 | 1.5 | 1.5 | 2.4 | 1.6 | 1.5 |
| Wistron | 2.2 | 2.2 | 2.1 | 2.2 | 2.6 | 1.7 | 1.6 | 2.8 | 1.8 | 1.7 | 2.0 | 1.6 | 1.4 |
| Pegatron | 0.8 | 0.8 | 0.8 | 0.7 | 0.9 | 0.7 | 0.4 | 0.7 | 0.5 | 0.6 | 0.7 | 0.4 | 0.4 |
| YoY | |||||||||||||
| Quanta | -5% | -6% | 9% | -3% | -9% | -4% | -35% | 8% | 6% | -8% | -10% | -30% | -37% |
| Compal | -21% | -14% | -25% | -15% | 4% | -30% | -29% | -3% | -18% | -17% | -4% | -22% | -39% |
| Inventec | 6% | 6% | -6% | 0% | 0% | 13% | -6% | 16% | -12% | -17% | 14% | -6% | -17% |
| Wistron | 29% | 16% | 17% | 29% | 44% | 13% | 7% | 47% | 6% | -6% | -17% | -20% | -36% |
| Pegatron | -6% | 0% | 41% | 12% | 23% | 15% | -26% | -4% | -14% | -26% | -34% | -47% | -48% |
| MoM / QoQ | |||||||||||||
| Quanta | 2% | 12% | -24% | 0% | 11% | -31% | -26% | 165% | -34% | 0% | 29% | -38% | -7% |
| Compal | 0% | 9% | -16% | 10% | 4% | -33% | -6% | 87% | -36% | 11% | 20% | -25% | -22% |
| Inventec | 6% | 6% | -16% | 6% | 18% | -15% | -12% | 47% | -32% | 0% | 60% | -33% | -6% |
| Wistron | 10% | 0% | -5% | 5% | 18% | -35% | -6% | 75% | -36% | -6% | 18% | -20% | -13% |
| Pegatron | 10% | 0% | -6% | -10% | 32% | -24% | -39% | 59% | -22% | 10% | 13% | -38% | 6% |
Source: Company data
e92c7a75ab8b4efbba794e6b187208c8
[讀者資訊已遮蔽]
Hon Hai (2317.TW; Buy, on CL): New AI server racks and Foldable phones to drive 3Q / 4Q26E; 3-month revenues preview
We expect Hon Hai's monthly revenues to continue sequential growth through Dec 2026, leading 3Q26 / 4Q26 revenues to grow at +14% / +23% QoQ, driven by (1) AI data center: The next-generation AI server racks and CPO switches ramp up, with higher ASP and early delivery. We expect Hon Hai to be the first one to deliver the latest model, around 2-3 months ahead of peers, driving its Sep and onward revenue growth. Followed by GPU-powered AI server racks, the LPU-powered AI server racks would fuel the growth in Dec and onward, supporting the YoY increase in 1Q27, and (2) Smartphone: riding on the major brand customer's latest model launches along with the new form factor to attract more end users. As we highlight in September (report link), we reduce global smartphone volume estimates by 1m/ 8m/ 0.2m to 1.1bn / 1.2bn/ 1.2bn in 2026-28E, or -10% / +2%/ +2% YoY on high memory costs; however, we remain positive on global leading brands to outperform the market given the strong brand awareness, large procurement power, and customers' stronger consumption power. We remain positive on foldable phones and expect premium models to continue gain market share, positive to Hon Hai. Maintain Buy (on CL).
Exhibit 5: Hon Hai's Aug revenues +52% YoY, or -3% MoM
Source: Company data
3-month revenues preview: We expect company's 3Q26E revenues to be +40% YoY/ +14% QoQ to NT$2.9 trillion. Both Jul and Aug delivered strong revenues YoY growth (+54%/ 52% YoY), and we expect to see both YoY and MoM positive growth in Sep to Dec, driven by new AI server racks, CPO switch, and latest smartphone models and foldable phones. We keep 2026E - 2028E earnings estimates largely unchanged.
e92c7a75ab8b4efbba794e6b187208c8
[讀者資訊已遮蔽]
Exhibit 6: Hon Hai monthly revenues since Jan 2025
Source: Company data, Goldman Sachs Global Investment Research
Exhibit 7: We model Hon Hai's Sep 2026 revenue to be +21% YoY or +9% MoM
Hon Hai's monthly/quarterly revenue
| Jul-26 | Aug-26 | Sep-26E | Oct-26E | Nov-26E | Dec-26E | 3Q26E | 4Q26E | |
|---|---|---|---|---|---|---|---|---|
| Revenues (NT$m) | 946,513 | 921,766 | 1,009,185 | 1,069,736 | 1,144,618 | 1,318,338 | 2,877,464 | 3,532,692 |
| YoY | 54% | 52% | 21% | 19% | 36% | 53% | 40% | 36% |
| MoM/QoQ | 15% | -3% | 9% | 6% | 7% | 15% | 14% | 23% |
| GS estimates (NT$m) | 928,592 | 1,050,629 | ||||||
| Actual vs. GS | 2% | -12% |
Source: Company data, Goldman Sachs Global Investment Research
Price Target Risks and Methodology - Hon Hai
Valuation methodology: We are Buy rated on Hon Hai. Our 12-month target price of NT$400 is based on an 17.9x 2027E P/E multiple, which is set in line with peers' PEG&M ratio (i.e., P/E vs. forward-year earnings growth and OPM).
Key downside risks: (1) slower-than-expected ramp-up of the AI server business; (2) weaker-than-expected EV total solution performance across EV assembly, design, software, and semis; (3) slower-than-expected ramp-up of capacity globally; and (4) fiercer-than-expected competition in the consumer electronics EMS business.
Quanta (2382.TW, Neutral): New AI server rack ramp up to support 2H26 growth; PC slowdown; Neutral
With a high base in 1H26, driven by PC consumption pull-in and AI server rack expansion, we expect flat QoQ in 3Q26 / 4Q26 at 2% / 2%, reflecting slowdown in PC shipment and AI server racks facing model transitions. The company's PC shipment declined by 30% / 37% YoY in Jul / Aug, reflecting the impact of PC consumption pull-in in 1H26 and slow PC shipment under high memory costs. We expect revenues to sequentially increase in Oct to Dec and further accelerate to 54% MoM in Dec, reflecting the ramp up of next generation AI server racks, which carry higher ASP. With strong AI spending driving not only AI servers (GPU and ASIC) but also general servers, along with customer requirement on capacity diversification, we estimate Quanta's capex to stay at a high level of NT$44bn / NT$32bn in 2026 / 27E (vs. NT$15bn in 2025). In Sep, Quanta announced factory rental in USA at 199k square feet (US$368k per month for 126
e92c7a75ab8b4efbba794e6b187208c8
[讀者資訊已遮蔽]
months, or NT$1.5bn of total contract value), reflecting strong demand from AI servers. As we highlighted in June (report link), we forecast leading US cloud service providers (CSPs) in aggregate will grow their capex budgets by 76%/ 35%/ 8% YoY in 2026-28E, with our estimates being raised by 8% / 27% / 25% in 2026-28E to US$1,145bn by 2028E. Maintain Neutral rating on Quanta given fair valuation with TP unchanged at NT$299 (10.7x 2027E P/E vs. +9.4% EPS YoY in 2027-28E).
Exhibit 8: Quanta monthly revenues and YoY change
Jun
Source: Company data, Goldman Sachs Global Investment Research
Exhibit 9: We model Quanta's Sep 2026E revenue +48% YoY, or -36% MoM
| Jul-26 | Aug-26 | Sep-26(E) | Oct-26(E) | Nov-26(E) | Dec-26(E) | 3Q26E | 4Q26E | |
|---|---|---|---|---|---|---|---|---|
| Rev (NT$m) | 366,274 | 423,971 | 272,034 | 288,356 | 314,308 | 484,843 | 1,062,279 | 1,087,507 |
| YoY | 131% | 177% | 48% | 66% | 63% | 78% | 114% | 70% |
| MoM/QoQ | -5% | 16% | -36% | 6% | 9% | 54% | 2% | 2% |
| GS (NT$m) | 301,464 | 293,019 | ||||||
| Actual vs. GS | 21% | 45% |
Source: Company data, Goldman Sachs Global Investment Research
Price Target Risks and Methodology - Quanta
We are Neutral-rated on Quanta. Our 12-month target price of NT$299 is based on an 10.7x 2027E P/E, which references PC/server peers' EPS growth vs. P/E multiple correlation. We see EPS growth as a major factor for the stock's performance.
Key upside/downside risks include: 1) stronger-/weaker-than-expected PC market recovery; 2) faster-/slower-than-expected AI server ramp-up; and 3) stronger-/weaker-than-expected demand for general servers.
e92c7a75ab8b4efbba794e6b187208c8
[讀者資訊已遮蔽]
AVC (3017.TW, Buy): Liquid cooling rising adoption along with new AI servers across GPU and ASIC to drive sequential monthly revenues growth; Buy
3-month revenues preview: We expect AVC's monthly revenues to continue sequential growth through Dec 2026, leading 3Q26 / 4Q26 revenues to grow at +18% / +27% QoQ, driven by (1) new AI server racks ramp up, driving overall liquid cooling penetration rate. As we highlighted in June (report link), we expect AI server rack (NVL72-equivalent) shipment (incl. Nvidia and AMD) to reach 55k/ 105k/ 163k in 2026-28E, increasing by 16% / 20% in 2027 / 28E, reflecting our positive view on AI server racks, (2) its major ASIC AI server customer's new model ramp up, driving its air-cooling and liquid-cooling components, along with a rising liquid cooling penetration rate, (3) its customer base expansion to a new ASIC AI server, to further drive its liquid cooling components in 4Q26, and (4) increasing adoption rate of ultra-thin VC in consumer electronics to fit the lightweight design and major customer's foldable phone model. We expect AVC's net income to grow at a +39% CAGR in 2026-28E, riding on the strong AI spending, a growing liquid cooling penetration rate, and AVC's leading market position in total solutions (air cooling, liquid cooling with various components / systems). Maintain Buy.
Exhibit 10: AVC monthly revenue trend
Apr
Source: Company data, Goldman Sachs Global Investment Research
Exhibit 11: AVC monthly/quarterly revenue summary
| Jul-26 | Aug-26 | Sep-26E | Oct-26E | Nov-26E | Dec-26E | 3Q26E | 4Q26E | |
|---|---|---|---|---|---|---|---|---|
| Rev (NT$m) | 18,590 | 19,481 | 19,937 | 21,731 | 24,122 | 27,896 | 58,008 | 73,749 |
| Rev YoY | 57% | 54% | 37% | 32% | 39% | 100% | 49% | 54% |
| Rev MoM / QoQ | 6% | 4% | 2% | 9% | 11% | 16% | 18% | 27% |
| GS estimates (NT$m) | 18,941 | 19,334 | ||||||
| Act vs. GS | -2% | 1% |
Source: Company data, Goldman Sachs Global Investment Research
Price Target Risks and Methodology - AVC
We are Buy-rated on AVC. Our 12-month target price for AVC is based on a near-term P/E, consistent with our Taiwan Technology coverage. We base our target price of NT$4,513 on a target P/E multiple of 30.3x applied to our forward-year EPS (2027E). Our target P/E is derived from the correlation between P/E and EPS growth of its peers in technology hardware.
Key downside risks: (1) slower-than-expected adoption of liquid cooling; (2) lower-than-expected demand for AI servers; (3) fiercer-than-expected competition;
e92c7a75ab8b4efbba794e6b187208c8
[讀者資訊已遮蔽]
and (4) a slower-than-expected recovery in general servers.
Wiwynn (6669.TW, Buy): New ASIC and GPU AI server racks in expansion; Aug strong beat; Buy
Wiwynn delivered strong Aug revenues, which were 27% ahead of our estimates, reflecting strong general servers demand from US leading CSPs, and its major customers' new ASIC AI servers ramping up. We expect sequential revenues growth to continue through Dec 2026, leading 3Q26 / 4Q26 revenues to grow at +46% / +22% QoQ, driven by (1) major customers' new ASIC AI servers ramping up, across air-cooled and liquid-cooled, (2) general servers end demand remaining solid on agentic AI, (3) new GPU-powered AI server racks entering mass production in 4Q26 across NVIDIA and AMD platforms, and (4) potential new customers in ASIC AI servers. Maintain Buy with TP of NT$3,777 (21.5x 2027E P/E).
Exhibit 12: Wiwynn monthly revenues and YoY trend
Source: Company data, Goldman Sachs Global Investment Research
Exhibit 13: Wiwynn monthly revenues preview
| Jul-26 | Aug-26 | Sep-26(E) | Oct-26(E) | Nov-26(E) | Dec-26(E) | 2Q26 | 3Q26E | 4Q26E | |
|---|---|---|---|---|---|---|---|---|---|
| Rev (NT$m) | 117,686 | 144,312 | 145,269 | 148,174 | 162,991 | 185,683 | 278,153 | 407,266 | 496,848 |
| YoY | 39% | 50% | 68% | 62% | 68% | 78% | 26% | 53% | 70% |
| MoM/ QoQ | 6% | 23% | 1% | 2% | 10% | 14% | 1% | 46% | 22% |
| GS estimates (NT$m) | 114,056 | 113,567 | 278,153 | ||||||
| Act vs. GS | 3% | 27% | 0% |
Source: Company data, Goldman Sachs Global Investment Research
Ongoing capacity expansion: As we highlighted in Aug (report link), Wiwynn announced a 2H26 capex budget of US$942m, implying 2026 capex could be up to NT$40bn (US$1.3bn). On Sep 16, the company announced equipment procurement of US$16m (NT$512m), reflecting the strong AI demand and the company's commitments on capacity expansion. We estimate the company's capex at NT$44bn in 2026E, and to stay at a similar high level through 2028E, supporting its production sites diversification across the US, Mexico, and Malaysia, AI servers expansion from ASIC to GPU-powered, and products expansion across different ASICs and GPUs, along with further customers penetration.
Price Target Risks and Methodology - Wiwynn
We are Buy-rated on Wiwynn with a 12-month TP of NT$3,777. Our target price is e92c7a75ab8b4efbba794e6b187208c8
[讀者資訊已遮蔽]
based on 21.5x 2027E P/E, which is derived from PC/server peers' EPS growth vs. P/E multiple correlation. We see EPS growth as a major factor for the stock's performance.
Key downside risks: 1) weaker-than-expected AI server demand growth; 2) slower-than-expected recovery in general server demand; and 3) more severe competition in the server ODM market.
Wistron (3231.TW, Buy): Aug strong beat on rack-level AI server; Buy with TP raised to NT$295
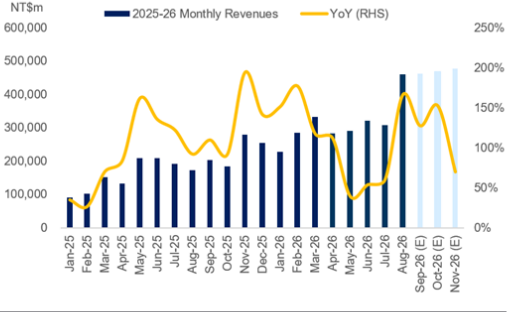
Wistron's Aug revenue was up 166% YoY to NT$460bn, or 48% higher than our estimate, which we attribute to the strong rack-level AI server shipments, offsetting the impact of AI server model transition and sluggish PC end demand. Aug PC shipment was down 13% MoM to 1.4m units, mainly on the 1H26 demand pull-in amid the rising memory cost. We expect sequential revenue growth in Sep-Dec, supported by the next generation rack-level AI server shipments ramp up across GPU, CPU, and LPU. The company plans to invest US$209m to expand its AI server capacity in US and Vietnam (link), which would further support its revenue growth in coming years, in our view. Maintain Buy.
Exhibit 14: Wistron 3-month revenue preview
| 26-Jul | 26-Aug | Sep-26 (E) | Oct-26 (E) | Nov-26 (E) | Dec-26 (E) | 3Q26 (E) | 4Q26 (E) | |
|---|---|---|---|---|---|---|---|---|
| Rev (NT$m) | 308,219 | 460,065 | 463,004 | 467,634 | 476,987 | 492,959 | 1,231,289 | 1,437,580 |
| Rev YoY | 61% | 166% | 128% | 153% | 70% | 93% | 117% | 99% |
| Rev MoM / QoQ | -4% | 49% | 1% | 1% | 2% | 3% | 38% | 17% |
| GS estimates | 237,902 | 311,301 | ||||||
| Act. Vs. GS | 30% | 48% |
Source: Company data, Goldman Sachs Global Investment Research
Exhibit 15: Wistron monthly revenues
Source: Company data, Goldman Sachs Global Investment Research
Earnings revision: We factor in Wistron's Aug revenue and revise up our 2026-28E net income by 2% / 3% / 4%, mainly on higher revenues. We raise our 2026-28E revenues by 11% / 7% / 6%, mainly on higher rack-level AI server shipments and ASP, considering the strong end demand and rising memory cost. Our 2026-28E GMs are revised down mainly on higher contribution from rack-level AI server, which usually carries lower GM than other product lines. Our 2026-28E opex ratios are largely unchanged.
e92c7a75ab8b4efbba794e6b187208c8
[讀者資訊已遮蔽]
Exhibit 16: Earnings revision
| NT m | 2026E - Old | 2026E - New | 2026E - Chg | 2027E - Old | 2027E - New | 2027E - Chg | 2028E - Old | 2028E - New | 2028E - Chg |
|---|---|---|---|---|---|---|---|---|---|
| Revenue | 3,978,099 | 4,410,615 | 11% | 5,877,711 | 6,274,898 | 7% | 6,912,921 | 7,319,379 | 6% |
| GP | 213,484 | 226,133 | 6% | 311,688 | 325,525 | 4% | 379,867 | 393,843 | 4% |
| OP | 136,383 | 140,344 | 3% | 199,975 | 206,081 | 3% | 238,152 | 243,796 | 2% |
| Net income | 52,350 | 53,200 | 2% | 73,751 | 76,137 | 3% | 85,687 | 89,154 | 4% |
| Margins | |||||||||
| GM | 5.4% | 5.1% | 5.3% | 5.2% | 5.5% | 5.4% | |||
| OPM | 3.4% | 3.2% | 3.4% | 3.3% | 3.4% | 3.3% | |||
| NM | 1.3% | 1.2% | 1.3% | 1.2% | 1.2% | 1.2% |
Source: Company data, Goldman Sachs Global Investment Research
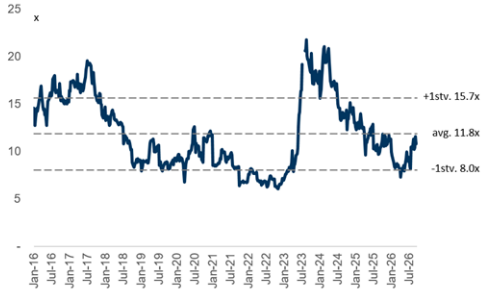
Valuation: We continue to use near-term P/E to derive our 12M TP. Our target multiple is updated to 13.2x 2027E EPS (vs. 13.1x previously), which is still derived from peers' correlation between forward trading P/E and earnings growth. With our updated earnings estimates and target multiple, our 12M TP is raised to NT$295 (vs. NT$281 previously). Our target P/E is still between the company's historical avg. and avg.+1stv. trading P/E, reflecting our positive view on Wistron's market leading position in AI server ODM. Maintain Buy.
Exhibit 17: Wistron peers' 2027E P/E vs. 2027-28E avg. EPS YoY
Exhibit 18: Wistron 12m forward P/E
Source: Company data, Goldman Sachs Global Investment Research
Source: Company data, Goldman Sachs Global Investment Research
Exhibit 19: Wistron P&L summary
| (NT$ m) | 1Q25 | 2Q25 | 3Q25 | 4Q25 | 1Q26 | 2Q26 | 3Q26E | 4Q26E | 2022 | 2023 | 2024 | 2025 | 2026E | 2027E | 2028E |
|---|---|---|---|---|---|---|---|---|---|---|---|---|---|---|---|
| Revenue | 346,485 | 551,291 | 567,805 | 720,941 | 846,303 | 895,443 | 1,231,289 | 1,437,580 | 984,619 | 867,057 | 1,049,256 | 2,186,523 | 4,410,615 | 6,274,898 | 7,319,379 |
| Gross profit | 27,056 | 24,453 | 41,965 | 40,509 | 44,094 | 50,664 | 65,417 | 65,958 | 69,729 | 68,983 | 84,091 | 133,983 | 226,133 | 325,525 | 393,843 |
| Operating expense | (5,564) | (5,881) | (5,909) | (6,705) | (7,323) | (7,748) | (11,192) | (13,067) | (42,257) | (41,593) | (45,112) | (55,430) | (85,790) | (119,444) | (150,047) |
| Operating income | 15,150 | 10,787 | 27,142 | 25,474 | 29,137 | 33,447 | 40,681 | 37,078 | 27,472 | 27,390 | 38,979 | 78,553 | 140,344 | 206,081 | 243,796 |
| Net income | 5,331 | 6,504 | 7,406 | 8,167 | 9,631 | 14,827 | 12,587 | 16,156 | 11,162 | 11,472 | 17,446 | 27,408 | 53,200 | 76,137 | 89,154 |
| EPS, diluted (NT$) | 1.82 | 2.19 | 2.34 | 2.05 | 2.83 | 4.35 | 3.69 | 4.74 | 3.84 | 3.98 | 5.99 | 8.40 | 15.61 | 22.34 | 26.15 |
| Margins / ratio | |||||||||||||||
| Gross margin | 7.8% | 4.4% | 7.4% | 5.6% | 5.2% | 5.7% | 5.3% | 4.6% | 7.1% | 8.0% | 8.0% | 6.1% | 5.1% | 5.2% | 5.4% |
| Opex ratio | -3.4% | -2.5% | -2.6% | -2.1% | -1.8% | -1.9% | -2.0% | -2.0% | -4.3% | -4.8% | -4.3% | -2.5% | -1.9% | -1.9% | -2.1% |
| Operating margin | 4.4% | 2.0% | 4.8% | 3.5% | 3.4% | 3.7% | 3.3% | 2.6% | 2.8% | 3.2% | 3.7% | 3.6% | 3.2% | 3.3% | 3.3% |
| Net margin | 1.5% | 1.2% | 1.3% | 1.1% | 1.1% | 1.7% | 1.0% | 1.1% | 1.1% | 1.3% | 1.7% | 1.3% | 1.2% | 1.2% | 1.2% |
| QoQ | |||||||||||||||
| Revenue | 17% | 59% | 3% | 27% | 17% | 6% | 38% | 17% | |||||||
| Gross profit | 13% | -10% | 72% | -3% | 9% | 15% | 29% | 1% | |||||||
| Operating income | 28% | -29% | 152% | -6% | 14% | 15% | 22% | -9% | |||||||
| Net income | 0% | 22% | 14% | 10% | 18% | 54% | -15% | 28% | |||||||
| EPS | 2% | 20% | 7% | -12% | 38% | 54% | -15% | 28% | |||||||
| YoY | |||||||||||||||
| Revenue | 45% | 130% | 108% | 143% | 144% | 62% | 117% | 99% | 14% | -12% | 21% | 108% | 102% | 42% | 17% |
| Gross profit | 57% | 22% | 85% | 69% | 63% | 107% | 56% | 63% | 36% | -1% | 22% | 59% | 69% | 44% | 21% |
| Operating income | 115% | 25% | 138% | 115% | 92% | 210% | 50% | 46% | 68% | 0% | 42% | 102% | 79% | 47% | 18% |
| Net income | 51% | 47% | 76% | 54% | 81% | 128% | 70% | 98% | 7% | 3% | 52% | 57% | 94% | 43% | 17% |
| EPS | 49% | 43% | 61% | 15% | 55% | 99% | 58% | 131% | 2% | 4% | 51% | 40% | 86% | 43% | 17% |
Source: Company data, Goldman Sachs Global Investment Research
Price Target Risks and Methodology - Wistron
Our 12-month target price of NT$295 is based on a 13.2x 2027E P/E, which is derived e92c7a75ab8b4efbba794e6b187208c8
[讀者資訊已遮蔽]
from PC/server peer EPS growth vs. P/E multiple correlation. We see EPS growth as a major factor for the stock's share price performance.
Key downside risks: 1) weaker-than-expected PC market recovery, 2) slower-than-expected AI server demand ramp-up, and 3) weaker-than-expected demand on general servers.
Gigabyte (2376.TW, Neutral): AI server racks ramp up to drive 2H26 growth; Capex commitments remain strong; Aug in line; Neutral
3-month revenues preview: We expect sequential revenue growth in Sep-Dec, driven by the rising AI server racks, and higher ASP, leading our 3Q26 / 4Q26 revenues YoY to accelerate to 81% / 79% YoY (vs. 60% / 41% YoY in 1Q26 / 2Q26). The stronger growth in 2H26 would be driven by ongoing AI spending, customers' faster AI deployment, and Gigabyte's expanding customer base and enhancing backlog visibility. Customers' infrastructure readiness and components procurement to continue to improve in 2H26, supporting the procurement on AI servers. The company maintains strong capex commitment and we expect 2H26 capex to stay at a similar high level vs. 1H26, leading 2026 capex to grow at 143% YoY to NT$2.8bn to capture the strong AI servers demand, and customers' requirement on diversifying production sites (e.g. Gigabyte is across Taiwan, US, Europe, and Southeast Asia).
Exhibit 20: Gigabyte monthly revenues
Source: Company data, Goldman Sachs Global Investment Research
Exhibit 21: We expect Gigabyte Sep/Oct revenues to grow 87%/ 87% YoY to NT$52bn/ NT$52bn
| Jul-26 | Aug-26 | Sep-26(E) | Oct-26(E) | Nov-26(E) | Dec-26(E) | 2Q26 | 3Q26E | 4Q26E | |
|---|---|---|---|---|---|---|---|---|---|
| Rev (NT$m) | 44,213 | 47,401 | 52,351 | 52,874 | 53,403 | 54,085 | 144,214 | 143,965 | 160,362 |
| Rev YoY | 60% | 98% | 87% | 87% | 74% | 78% | 41% | 81% | 79% |
| Rev MoM / QoQ | 3% | 7% | 10% | 1% | 1% | 1% | 37% | 0% | 11% |
| GS estimates (NT$m) | 37,439 | 47,750 | 128,540 | ||||||
| Act vs. GS | 18% | -1% | 12% |
Source: Company data, Goldman Sachs Global Investment Research
Price Target Risks and Methodology - Gigabyte
We are Neutral rated on Gigabyte with a 12-month target price of NT$487. Our TP is e92c7a75ab8b4efbba794e6b187208c8
[讀者資訊已遮蔽]
based on a 14.1x 2027E P/E which is based on PC/server peers' EPS growth vs. P/E multiple correlation. We see EPS growth as a major factor for the stock's share performance.
Key upside/downside risks include: 1) stronger-/weaker-than-expected PC market recovery, 2) faster-/slower-than-expected gaming PC growth, and 3) faster-/slower-than-expected AI server ramp-up.
ASUS (2357.TW, Neutral): AI server racks in expansion along with PC product mix upgrade; Aug beat; Neutral
3-month revenues preview: We expect sequential revenue growth in Sep, leading 3Q26 revenues to grow at 8% QoQ, while we expect sequential revenues decline in 4Q26 at 7%, considering the PC consumption pull-in under high memory costs along with AI servers model transition. We remain positive on the company's expansion toward AI servers and expect the upcoming new models carrying higher ASP to further drive its growth in late 2026 / early 2027. We continue to expect double digit revenues YoY in 3Q26 / 4Q26E at 39% / 27% YoY driven by PC product mix upgrade and AI server racks ramp up. The company retains strong commitments on capacity expansion and diversification, with issuance of US$0.5bn of convertible bonds and US$1bn of exchangeable bonds, supporting the expansion. Maintain Neutral on fair valuation.
Exhibit 22: ASUS 2025-26 monthly revenues and YoY change
Source: Company data, Goldman Sachs Global Investment Research
Exhibit 23: We expect ASUS Sep revenue to grow +19% YoY/+4% MoM to NT$98bn
| Jul-26 | Aug-26 | Sep-26E | Oct-26E | Nov-26E | Dec-26E | 3Q26E | 4Q26E | |
|---|---|---|---|---|---|---|---|---|
| Rev (NT$m) | 84,131 | 94,956 | 98,385 | 90,514 | 85,988 | 82,158 | 277,472 | 258,660 |
| Rev YoY | 53% | 51% | 19% | 36% | 29% | 18% | 39% | 27% |
| Rev MoM / QoQ | -21% | 13% | 4% | -8% | -5% | -4% | 8% | -7% |
| GS estimates (NT$m) | 72,325 | 88,338 | ||||||
| Act vs. GS | 16% | 7% |
Source: Company data, Goldman Sachs Global Investment Research
Price Target Risks and Methodology - Asus
We are Neutral-rated on ASUS with a 12-month target price of NT$1,115. Our target price is based on 14.8x 2027E P/E, which is derived from brand makers' average ratio of 2027E P/E to 2028E NI YoY and OPM. We see EPS growth and OPM as major factors for e92c7a75ab8b4efbba794e6b187208c8
[讀者資訊已遮蔽]
the stock's share performance.
Key upside/downside risks include: 1) stronger / weaker-than-expected PC market growth; 2) faster / slower-than-expected AI and gaming PC growth; and 3) faster / slower-than-expected AI server ramp-up.
Compal (2324.TW, Neutral): AI servers to fuel 4Q26E/1Q27E growth; Aug miss; Neutral
3-month revenues preview: We expect sequential revenue growth in Sep-Dec, considering the company's rising AI server shipments, AI server capacity expansion, and PC product mix upgrade towards high end model (e.g. AI PC). Overall, we expect Compal's 3Q / 4Q26E revenues to grow at 1% / 16% QoQ, riding on AI server racks ramp up and the company's expansion from motherboard (L6) to system (L10 / L11). We remain positive on Compal's business diversification, supported by global capacity expansion in the US, Taiwan, Vietnam and China, while consumer electronics still accounts for the majority of the company's total revenue, for which demand could be capped by rising raw material costs (e.g., memory, CPU). Maintain Neutral on fair valuation.
Exhibit 24: Compal monthly revenues and YoY change
Source: Company data, Goldman Sachs Global Investment Research
Compal's Aug revenue was up 15% YoY / down 17% MoM to NT$67bn, or 20% lower than our estimate, reflecting PC shipments decline. Aug PC shipments was down 22% MoM to 1.4m units, reflecting the impact of 1H26 demand pull-in amid the rising memory cost and weak consumer electronics demand.
Exhibit 25: Compal 3-month revenue preview
| Jul-26 | Aug-26Sep-26(E)Oct-26(E)Nov-26(E)Dec-26(E) | 3Q26E | 4Q26E | |||||
|---|---|---|---|---|---|---|---|---|
| Rev (NT$m) | 81,006 | 67,337 | 91,271 | 91,727 | 92,644 | 94,396 | 239,614 | 278,767 |
| Rev YoY | 38% | 15% | 31% | 48% | 47% | 43% | 28% | 46% |
| Rev Mom / QoQ | -15% | -17% | 36% | 1% | 1% | 2% | 1% | 16% |
| GS estimates(NT$m) | 73,467 | 84,246 | ||||||
| Act vs. GS | 10% | -20% |
Source: Company data, Goldman Sachs Global Investment Research
Price Target Risks and Methodology - Compal
We are Neutral-rated on Compal with a 12-month target price of NT$46.1. Our target e92c7a75ab8b4efbba794e6b187208c8
[讀者資訊已遮蔽]
price is based on 14.7x 2027E P/E, which is derived from PC/server peers' EPS growth vs. P/E multiple correlation. We see EPS growth and market re-rating for ODM companies as major factors for the stock's performance.
Key upside/downside risks: 1) stronger-/weaker-than-expected PC market recovery; 2) faster-/slower-than-expected AI server ramp-up; and 3) stronger/weaker-than-expected demand for tablets.
Inventec (2356.TW, Neutral): Components tight supply weighing on growth; Aug in line; Neutral
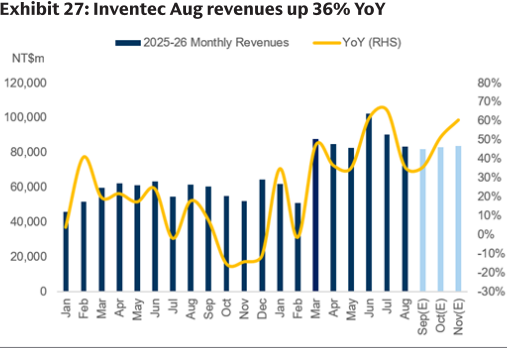
Inventec's Aug revenue was up 36% YoY / down 8% MoM, largely in line with our estimate, and we attribute the MoM decline to the short supply of key components (e.g. memory, PCB, CPU, etc.). We model sequential revenue decline in Sep, considering the impact of components short supply and sluggish PC end demand post the demand pull-in in 1H26, while expecting sequential revenue growth in Oct-Dec, considering the low base in Sep and the potential raw material supply recovery, leading our 3Q / 4Q26E revenues up 45% / 47% YoY. We remain positive on Inventec's AI server business expansion, while the component short supply may weigh on the near term growth. Maintain Neutral.
Exhibit 26: Inventec monthly revenue preview
| Jul-26 | Aug-26 | Sep-26 (E) | Oct-26 (E) | Nov-26 (E) | Dec-26 (E) | 3Q26E | 4Q26E | |
|---|---|---|---|---|---|---|---|---|
| Rev (NT$m) | 90,190 | 83,268 | 82,083 | 82,904 | 83,733 | 85,551 | 255,541 | 252,188 |
| YoY | 66% | 36% | 36% | 51% | 61% | 33% | 45% | 47% |
| MoM/QoQ | -12% | -8% | -1% | 1% | 1% | 2% | -5% | -1% |
| GS (NT$m) | 68,533 | 79,367 | ||||||
| Actual vs. GS | 32% | 5% |
Source: Company data, Goldman Sachs Global Investment Research
Source: Company data, Goldman Sachs Global Investment Research
Earnings revision: We factor in Inventec's Aug revenue and raise our 2026-28E net income by 5% / 4% / 2%, mainly on higher revenues. We raise our 2026-28E revenues by 8% / 10% / 6%, considering the rising AI server ASP on the rising component costs. Our 2026-28E GMs and opex ratios are largely unchanged.
e92c7a75ab8b4efbba794e6b187208c8
[讀者資訊已遮蔽]
Exhibit 28: Earnings revision
| NT m | 2026E - Old | 2026E - New | 2026E - Chg | 2027E - Old | 2027E - New | 2027E - Chg | 2028E - Old | 2028E - New | 2028E - Chg |
|---|---|---|---|---|---|---|---|---|---|
| Revenue | 907,258 | 977,897 | 8% | 1,009,830 | 1,106,709 | 10% | 1,068,046 | 1,135,229 | 6% |
| GP | 41,119 | 43,871 | 7% | 48,800 | 52,895 | 8% | 54,277 | 56,407 | 4% |
| OP | 15,207 | 15,910 | 5% | 21,030 | 22,460 | 7% | 23,090 | 23,599 | 2% |
| Net income | 10,769 | 11,325 | 5% | 13,833 | 14,381 | 4% | 16,045 | 16,295 | 2% |
| Margins | |||||||||
| GM | 4.5% | 4.5% | 4.8% | 4.8% | 5.1% | 5.0% | |||
| OPM | 1.7% | 1.6% | 2.1% | 2.0% | 2.2% | 2.1% | |||
| NM | 1.2% | 1.2% | 1.4% | 1.3% | 1.5% | 1.4% |
Source: Company data, Goldman Sachs Global Investment Research
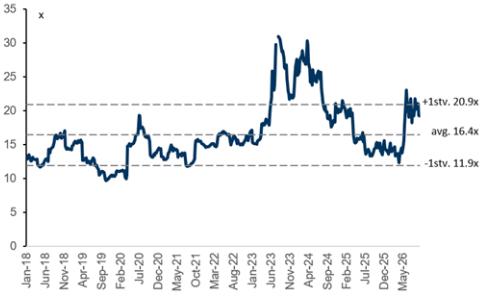
Valuation: We continue to use near-term P/E to derive our 12M TP, and our target P/E is updated to 15.3x 2027E P/E (vs. 14.6x previously), still derived from PC/server peers' correlation between forward year trading P/E and earnings growth. With our updated target P/E and earnings estimates, our 12M TP is raised to NT$61 (vs. NT$56 previously). Maintain Neutral.
Exhibit 29: Inventec: Correlation of earnings growth and P/E of its local and global peers
Exhibit 30: Inventec 12M forward P/E ratio
Source: Company data, Goldman Sachs Global Investment Research
Source: Company data, Goldman Sachs Global Investment Research
Exhibit 31: Inventec P&L summary
| (NT$ m) | 1Q25 | 2Q25 | 3Q25 | 4Q25 | 1Q26 | 2Q26 | 3Q26E | 4Q26E | 2024 | 2025 | 2026E | 2027E | 2028E |
|---|---|---|---|---|---|---|---|---|---|---|---|---|---|
| Revenue | 157,034 | 186,577 | 176,286 | 171,293 | 200,311 | 269,857 | 255,541 | 252,188 | 646,262 | 691,190 | 977,897 | 1,106,709 | 1,135,229 |
| Gross profit | 9,413 | 9,503 | 8,876 | 8,923 | 10,177 | 11,416 | 11,166 | 11,112 | 33,337 | 36,715 | 43,871 | 52,895 | 56,407 |
| Operating income | 3,473 | 3,635 | 3,067 | 2,538 | 3,615 | 4,741 | 3,755 | 3,799 | 11,817 | 12,713 | 15,910 | 22,460 | 23,599 |
| Net income | 1,703 | 2,190 | 2,729 | 2,073 | 2,428 | 3,895 | 2,489 | 2,513 | 7,267 | 8,696 | 11,325 | 14,381 | 16,295 |
| EPS, diluted (NTD) | 0.47 | 0.61 | 0.76 | 0.57 | 0.67 | 1.08 | 0.69 | 0.70 | 2.02 | 2.41 | 3.15 | 4.00 | 4.53 |
| Margins / ratio | |||||||||||||
| Gross margin | 6.0% | 5.1% | 5.0% | 5.2% | 5.1% | 4.2% | 4.4% | 4.4% | 5.2% | 5.3% | 4.5% | 4.8% | 5.0% |
| Opex ratio | -3.8% | -3.1% | -3.3% | -3.7% | -3.3% | -2.5% | -2.9% | -2.9% | -3.3% | -3.5% | -2.9% | -2.8% | -2.9% |
| Operating margin | 2.2% | 1.9% | 1.7% | 1.5% | 1.8% | 1.8% | 1.5% | 1.5% | 1.8% | 1.8% | 1.6% | 2.0% | 2.1% |
| Net margin | 1.1% | 1.2% | 1.5% | 1.2% | 1.2% | 1.4% | 1.0% | 1.0% | 1.1% | 1.3% | 1.2% | 1.3% | 1.4% |
| QoQ | |||||||||||||
| Revenue | -21% | 19% | -6% | -3% | 17% | 35% | -5% | -1% | |||||
| Gross profit | -7% | 1% | -7% | 1% | 14% | 12% | -2% | 0% | |||||
| Operating income | -11% | 5% | -16% | -17% | 42% | 31% | -21% | 1% | |||||
| Net income | -28% | 29% | 25% | -24% | 17% | 60% | -36% | 1% | |||||
| EPS, diluted | -28% | 29% | 25% | -24% | 17% | 61% | -36% | 1% | |||||
| YoY | |||||||||||||
| Revenue | 20% | 21% | 8% | -13% | 28% | 45% | 45% | 47% | 26% | 7% | 41% | 13% | 3% |
| Gross profit | 37% | 23% | 3% | -11% | 8% | 20% | 26% | 25% | 27% | 10% | 19% | 21% | 7% |
| Operating income | 62% | 40% | -3% | -35% | 4% | 30% | 22% | 50% | 58% | 8% | 25% | 41% | 5% |
| Net income | 56% | 21% | 37% | -13% | 43% | 78% | -9% | 21% | 14% | 20% | 30% | 27% | 13% |
| EPS, diluted | 56% | 21% | 36% | -12% | 42% | 78% | -9% | 22% | 14% | 20% | 30% | 27% | 13% |
Source: Company data, Goldman Sachs Global Investment Research
e92c7a75ab8b4efbba794e6b187208c8
[讀者資訊已遮蔽]
Price Target Risks and Methodology - Inventec
We are Neutral-rated on Inventec with a 12-month target price of NT$61.0. Our target price is based on 15.3x 2027E P/E, which is derived from PC/server peers' EPS growth vs. P/E multiple correlation. We see EPS growth as a major factor for the stock's performance.
Key upside/downside risks: 1) stronger-/weaker-than-expected PC market recovery; 2) faster-/slower-than-expected AI server ramp-up; and 3) stronger-/weaker-than-expected demand for general servers.
Pegatron (4938.TW, Sell): AI server racks in expansion along with PC product mix upgrade
3-month revenues preview: We expect sequential revenue growth in Sep-Dec, mainly driven by AI server racks ramp up with higher ASP and major smartphone brand customer's new model launches (report link). Overall, we project Pegatron's 3Q/4Q26E revenues to grow +18%/+25% YoY, driven by: (1) new model launches from a major smartphone customer supporting September and 4Q26 revenue growth; (2) a continuing ramp-up in AI server shipments, across rack-level and baseboard-based, riding on the growing demand in Neocloud and enterprises, (3) broadband, IoT, and game console entering peak season. We are positive on Pegatron's expansion from consumer electronics to AI servers and automotive electronics, while the high memory costs could cap PC and smartphone market growth. Maintain Sell on stretched valuation.
Exhibit 32: Pegatron monthly revenues and YoY change
Source: Company data, Goldman Sachs Global Investment Research
Pegatron's Aug revenue was up 34% YoY / 3% MoM to NT$88bn, or 12% lower than our estimate. This reflects that high memory costs continue to cap PC and smartphone growth, despite a strong ramp-up in AI servers. Aug PC shipments was down 49% YoY to 0.40-0.45m, reflecting the impact of consumption pull in under the high memory costs. Its major smartphone brand customer launched new models in Sep, supporting Pegatron's growth in Sep and 4Q26; prior to September, the company suffered from model transition (i.e. declining demand for older models while new models were in a slow shipment ramp-up phase).
e92c7a75ab8b4efbba794e6b187208c8
[讀者資訊已遮蔽]
Exhibit 33: Pegatron monthly/quarterly revenue summary
| Jul-26 | Aug-26 | Sep-26 (E) | Oct-26 (E) | Nov-26 (E) | Dec-26 (E) | 3Q26E | 4Q26E | |
|---|---|---|---|---|---|---|---|---|
| Rev (NT$m) | 86,015 | 88,305 | 131,069 | 131,724 | 132,383 | 136,129 | 305,389 | 400,236 |
| Rev YoY | 12% | 34% | 14% | 12% | 30% | 36% | 18% | 25% |
| Rev MoM / QoQ | -6% | 3% | 48% | 1% | 1% | 3% | 11% | 31% |
| GS estimates (NT$m) | 100,638 | |||||||
| Act vs. GS | -12% |
Source: Company data, Goldman Sachs Global Investment Research
Price Target Risks and Methodology - Pegatron
We are Sell rated on Pegatron with a 12-month target price of NT$76.9. Our TP is based on a 10.8x 2027E P/E, which is derived from PC/server peers' EPS growth vs. P/E multiple correlation. We see EPS growth as a major factor for the stock's share performance.
Key risks: 1) stronger-than-expected smartphone market recovery, 2) faster-than-expected AI server ramp-up, and 3) stronger-than-expected demand on consumer electronics.
e92c7a75ab8b4efbba794e6b187208c8
[讀者資訊已遮蔽]