PDF 原檔:260521_2360致茂_aletheia_ATE_original.pdf
原始內容
Chroma ATE
AI #AdvancedPackaging #SLT #CPO #Power #Photonics
Price:
TWD 2,065
Target Price:
TWD 4,000
No
Angus Lin
+852 9250 7088
angus.lin@aletheia-capital.com
Warren Lau
+852 9181 4766 warren.lau@aletheia-capital.com
Chroma ATE
Bloomberg
2360 TT
RIC
2360.TW
Market cap (USDbn) Average daily T/O (USD|m)
27.7
174.5
CNY
USD
Decades in the Making
A decade-plus of cross-domain engineering depth has positioned Chroma at the center of nearly every major tech upcycle -from NB/PCs (power) and smartphones (photonics) to EVs (power) and AI/HPC (power, photonics, SLT, AOI) -all of which Chroma presented ' dominant ' market positions. Over the next several years, we expect Chroma ' s revenue to grow at ~70% CAGR driven by AI power testers for PSU/BBU/HVDC power shelves/racks, AOI metrology for CoWoS/CoPoS/WMCM/CoWoP, SLT systems for NVDA/AMD/Google/Cisco/MSFT/MRVL/Meta, and photonic testers for 1.6T/3.2T optical transceivers and CPO OE Ins #3/#4 tests. We retain our Buy rating and up TP to NT$4,000 (from UR) on 30x FY28E PE (vs 30x FY27E PE prior). Our estimates for EPS in 2026E-28E are 13-83% above Street. Risks are demand and execution.
Inflection point starts for high-power high-site count SLT
The semiconductor industry ' s ' shifting right ' strategy, characterized by increasing adoption of SLT, has accelerated as AI compute devices transition toward higher-power, larger package and liquid-cooled architectures. We expect Chroma ' s SLT to grow at a 70-80% CAGR during CY2528E, factoring NVDA ' s SLT for Rubin/R-Ultra/Vera/LPU, AMD ' s MI450/500, Google Axion CPUs, Marvell and Cisco, via its Model 3200/3210/3160/3110/Kobra/King Cobra. In CY26E, we expect a 1H weighted delivery profile driven by NVDA, followed by 2H ramp for AMD and Google. Notably, we now forecast the SLT TAM of AMD ' s MI45X to be above NVDA ' s Blackwell due to its high-site configuration and meaningfully longer test time. Moreover, Chroma is also engaging with Cisco, MSFT, Xilinx, Meta and MRVL, all of which will grow meaningfully over the next several years.
Photonics with 10x growth potential
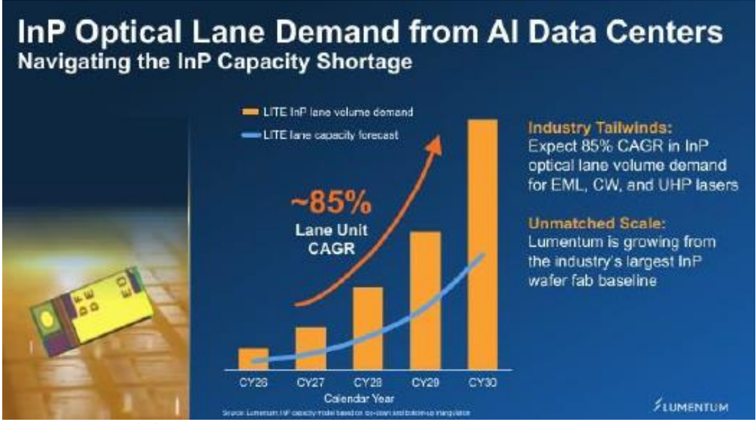
Chroma will begin pilot-run order deliveries for CPO insertion #3 OE testers in June, followed by insertion #4 optical testers by end-3Q26 for NVDA ' s 32x OE switch IC. We estimate the TAM for insertion #3 and insertion #4 to be ~NT$10bn/NT$30bn+ in 2027E/28E, where Chroma could potentially capture c70-80% of value share. Separately, for the transceiver market, we expect Chroma ' s optical tester revenue for pluggable optical modules to double YoY this year, with strong momentum extending into CY27E-28E, driven by the ramp of 1.8T/3.2T optical modules, echoing Lumentum CEO ' s outlook for InP optical lane volume demand growth of 85% CAGR (EML, CW lasers) through 2030 (or >4x in three years) and its capacity has sold out through 2028.
Multi-year power-hungry infrastructure demand driving ATS & power tester
T he growth narrative for Chroma's ATS is evolving beyond traditional general power electronics and PSU testing, toward a more structural opportunity spanning AI server power shelves/rack/ BBUs/HVDC. With TDP growing at 60-70% CAGR (CY26E-28E), rack power is growing at a similar rate as the relationship between TDP and rack power is interconnected. The deployment of new power architecture is accelerating, i.e. the pull-forward of 800HVDC at Rubin Ultra and Google ' s future adoption of a separate power rack. We expect a 60% ATS CAGR for Chroma (CY25-28E).
KEY FINANCIAL AND VALUATION MATRIX
Source: Company, Aletheia/TAG
| FYE Dec (TWD mn) | FY21A | FY22A | FY23A | FY24A | FY25A | FY26E | FY27E | FY28E |
|---|---|---|---|---|---|---|---|---|
| Revenues | 17,584 | 22,067 | 18,676 | 21,604 | 28,311 | 56,169 | 96,689 | 144,623 |
| Op. Profit | 3,075 | 5,039 | 4,673 | 5,482 | 9,198 | 23,534 | 43,141 | 69,120 |
| Net Profit | 4,179 | 5,106 | 3,979 | 5,264 | 11,692 | 19,258 | 34,972 | 56,080 |
| FD EPS (NT$) | 9.9 | 12.0 | 9.4 | 12.2 | 26.9 | 45.0 | 82.1 | 131.6 |
| Consensus EPS (NT$) | - | - | - | - | - | 39.3 | 59.2 | 71.9 |
| PER (X) | 233.2 | 192.5 | 246.9 | 188.6 | 85.9 | 51.4 | 28.1 | 17.5 |
| PBR (X) | 51.4 | 44.9 | 43.6 | 39.0 | 30.8 | 22.7 | 18.3 | 14.1 |
| Dividend Yield (%) | 0.2 | 0.3 | 0.3 | 0.3 | 0.4 | 0.8 | 1.4 | 2.5 |
| ROE (%) | 23.7 | 25.0 | 17.9 | 21.9 | 40.3 | 50.6 | 71.9 | 90.6 |
| ROA(%) | 14.5 | 16.1 | 11.8 | 14.9 | 27.7 | 36.0 | 52.4 | 66.5 |
Upside:
94%
21 May 2026 Technology Hardware Taiwan
Total return:
96%
0.089
Risk: High
0.135
FIGURE 1: CHROMA'S MODEL 3200/3160 FT & SLT TEST SYSTEMS
Advanced Package FT & SLT Test Solutions
Hopper
Blackwell
1000 - 1400W
FT & SLT Test Systems
Decades in the Making
A One Stop Shop for All the Next Big Things
Chroma is widely recognized as a quintessential Taiwanese engineering-driven enterprise, characterized by its willingness to commit substantial and persistent R&D investment across virtually every business unit to continuously expand its addressable market opportunities.
Advanced Package FT Test Hander 3160-H
High Density Testing Platform 3200-HD
As a result, more than a decade of cross-domain engineering depth has positioned Chroma at the center of nearly every major technology upcycle -from NB/PCs (power testing) and smartphones (photonics) to EVs (power) and AI/HPC (power, photonics, SLT, AOI) -where the company has established leading, and in several areas dominant, market positions.
Even in highly competitive segments such as SoC testers, Chroma has managed to retain its market position despite intensifying competition from Chinese vendors, making it one of the few Taiwanese technology companies capable of defending its franchise against the industry's increasingly aggressive price -war environment. We believe Chroma remains well positioned to continue capitalizing on the next major waves of technology innovation.
Inflection points for a more ubiquitous high-power/high-site SLT adoptions
Since the acquisition and integration of a key Taiwanese SLT company decades ago, Chroma has continuously devoted substantial engineering resources toward highly customized SLT solutions for customers. As a result, Chroma remains the clear best-in-class leader in SLT today, with even major ATE vendors such as Advantest and Teradyne finding it difficult to meaningfully penetrate the market.
In fact, discussions with test engineers across nearly all the major IC design houses -many of whom consign SLT operations to OSATs -consistently suggest that Chroma's high -power, high-site-count SLT systems are among the most highly regarded offerings in the industry.
One of Chroma's core competitive advantages in SLT stems from its foundational strength in ATS and power testing. The company has leveraged its deep expertise in power delivery and thermal control, and successfully extended these capabilities into its SLT platforms. A notable example is Chroma's win in AMD's MI450 -series SLT program, where its superior thermal control modules and CDU-related capabilities were key differentiators.
FIGURE 1: CHROMA ' S MODEL 3200/3160 FT & SLT TEST SYSTEMS
Source: Company, Aletheia/TAG
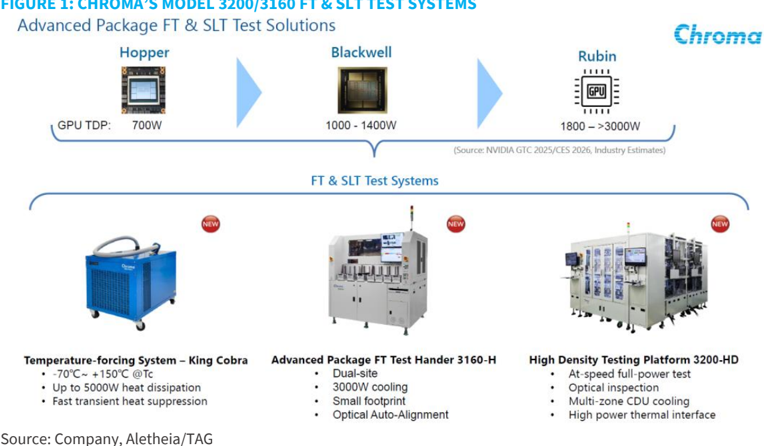
Temperature-forcing System - King Cobra
• -70°C~ +150°C @Tcl
• Up to 5000W heat dissipation
• Fast transient heat suppression
Source: Company. Aletheia/TAG
Rubin
HIIII
GPI
1800 - >3000W
(Source: NVIDIA GTC 2025/CES 2026, Industry Estimates) |
Chroma
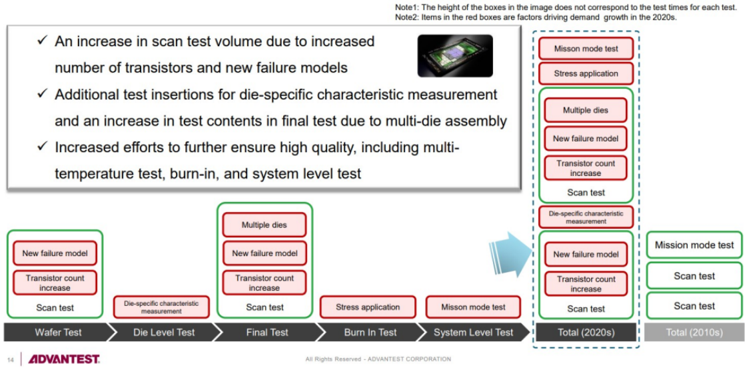
FIGURE 2: TESTING IN THE 2020S: MORE COMPLEX, LONGER TEST TIMES
Test in the 2020s: More Complex, Longer Test Time
Note1: The height of the boxes in the image does not correspond to the test times for each test.
Note2: Items in the red boxes are factors driving demand growth in the 2020s.
Misson mode test
Stress application
Multiple dies
‹ Additional test insertions for die-specific characteristic measurement and an increase in test contents in final test due to multi-die assembly
Multiple dies
New failure model
Transistor count increase
Scan test
Final Test
SLT on path to a more ubiquitous adoption : As AI accelerators move into higher-power, larger-package and liquid-cooled architectures, SLT is no longer a simple functional screen. The key challenge is to reproduce mission-mode electrical, thermal and mechanical stress conditions in production. Failure modes such as workload-induced timing marginality, localized hot spots, IR-drop/power-droop errors, package warpage, socket contact instability and cold-plate contact variation are difficult to fully capture through conventional CP (chip probing) and FT (final test). This structurally increases the value of SLT handlers with highpower thermal control, high contact force, contact leveling, warpage detection and widetemperature operation. Total (2010s)
All Rights Reserved - ADVANTEST CORPORATION
The importance of SLT for AI GPUs/ASICs lies in the fact that it is fundamentally different from traditional ATE vector-based electrical testing. Rather than simply validating electrical functionality through predefined test vectors, SLT places the chip into an environment much closer to real-world system operation and workload execution. This enables SLT to detect a range of latent defects and system-level issues that are difficult to capture during CP or FT, including:
- thermal-related instability,
- HBM and interconnect failures,
- firmware/software interaction issues,
- power transient behaviour, and
- broader system integration reliability problems.
FIGURE 2: TESTING IN THE 2020S: MORE COMPLEX, LONGER TEST TIMES
Source: Advantest, Aletheia/TAG
The table in Figure 3 represents our best efforts to estimate Chroma ' s addressable SLT TAM across major AI/HPC platforms. While the actual content value may vary, we believe the framework effectively illustrates the accelerating adoption trend of SLT beyond NVDA into other major IC design houses such as AMD and Google.
Importantly, the growth trajectory from these newer ' high-power-SLT ' adopters already appears highly meaningful -even relative to Nvidia's earlier -gen platforms -suggesting that SLT adoption may not occur incrementally. Rather, once customers adopt SLT, deployments often scale rapidly with demand for high-site-count configurations to improve yield, throughput, and system-level reliability
New failure model
Transistor count increase
Scan test
Wafer Test
Die-specific characteristic
Die Level Test
14 ADVANTEST.
Source: Advantest. Aletheia/TAG
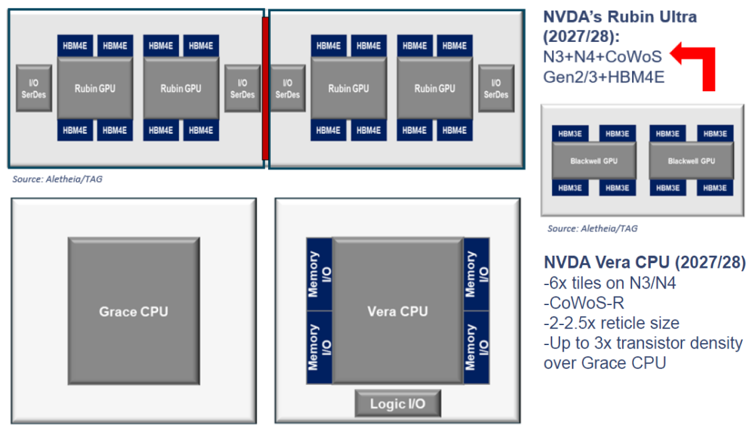
FIGURE 4: HETEROGENOUS CHIPLET ARCHITECTURE OF NVIDIA'S GPU AND CPU DEVICES
NVDA's Rubin Ultra
(2027/28):
N3+N4+CoWoS
Gen2/3+HBM4E
HBM3E
HBM3E
HBM3E
Blackwell GPU
HBM3E
Blackwell GPU
FIGURE 3: OUR ESTIMATES FOR CHROMA ' S MAJOR SLT TAM
VO
Memory
Source: Aletheia/TAG
| SLTTAM growth | Unit | Dollar content | TAM in value |
|---|---|---|---|
| Hopper SLT | 1.0x | 1.0x | 1.0x |
| Blackwell SLT | 1.4x | 1.6x | 2.2x |
| Rubin/Rubin Ultra SLT | 3.9x | 2.1x | 8.2x |
| AMD MI450/455/CPU SLT | 1.3x | 4.0x | 5.2x |
| Google Axion CPU | 1.0x | 1.0x | 1.0x |
over Grace CPU
Nvidia : Chroma has been the exclusive SLT vendor for Nvidia, and we expect the company to retain its exclusivity for the foreseeable future. We estimate that the Vera Rubin SLT opportunity could represent 8x higher market value for Chroma compared with Hopper SLT, with the first batch of SLT system deliveries expected to be concentrated in 1H26E. Moreover, we do not rule out the possibility of further upward revisions should Nvidia require incremental SLT capacity to enhance yield, similar to the Blackwell cycle where orders were expanded multiple times within a single year. We also expect a significant portion of Nvidia's incremental SLT capacity buildout to take place at KYEC's newly ramping Singapore facility.
FIGURE 4: HETEROGENOUS CHIPLET ARCHITECTURE OF NVIDIA ' S GPU AND CPU DEVICES
Source: Aletheia/TAG
AMD : As mentioned in the earlier section and highlighted in our July 2025 report -the earliest sell-side publication to identify the AMD SLT opportunity -Chroma has secured MI450/455 SLT system orders, supported by its industry-leading liquid-cooling CDU capability.
AMD has historically relied more heavily on SLT versus conventional final testing, and this strategy has resulted in MI450/500 SLT time increasing from the original four hours to over eight hours, as more test items are being shifted from FT into SLT.
We further understand that AMD plans to adopt an extremely high-site-count SLT configuration from Chroma, which should command meaningfully higher ASPs given the significantly extended SLT duration and system complexity.
Looking ahead, we believe Chroma also stands a strong chance of securing new SLT orders for AMD's next -generation MI500-series platforms, potentially driving an even larger SLT TAM opportunity for Chroma -benchmarking against, or potentially exceeding, Nvidia's Rubin/Rubin Ultra SLT scale.
Google : Google ' s next-generation Axion CPU plans to adopt both AEHR burn-in ovens and Chroma's SLT systems, with KYEC serving as the primary testing house. Based on our best -effort assessment, the Axion CPU test cycle time could benchmark closer to Nvidia's legacy GPU platforms, potentially using 16-site or higher-site-count SLT configurations.
HBM4E
HBM4E
HBM4E
Source: Aletheia/TAG
Grace CPU
Source• Aletheja/TAG
HBM4E
VO
SerDes
VO
SerDes
HBM4E
HBM4E
Rubin GPU
HBM4E
HBM4E
HEMAE
Rubin GPU
HBM4E
HIBMAE
VO
SerDes
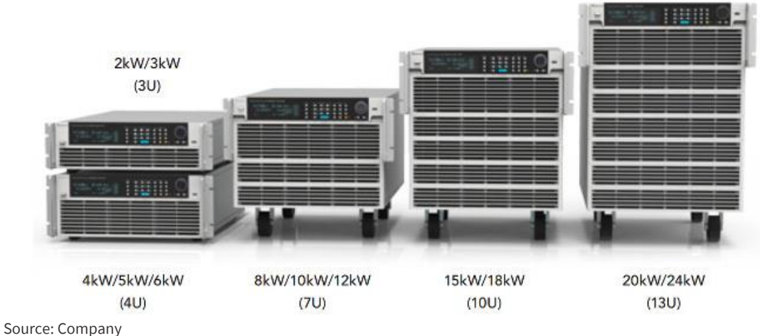
FIGURE 5: CHROMA 63200A SERIES DC ELECTRONIC LOAD
4kW/5kW/6kW
(4U)
Source: Companv
(7U)
While near-term order volumes may not initially be substantial, we do not rule out the possibility of a much larger-scale ramp over time. More importantly, this could become a reference point for broader adoption of SLT insertions across future inference-oriented CPUs, considering more CPUs will transition from flip chip package to CoWoS package and the CPUto-GPU ratio is growing with more inferencing task workflows required.
Beyond CPUs, we also believe Chroma stands a reasonable chance of securing SLT orders for future Google TPU variants (v9-v10), which we have not yet factored into our current model.
Other opportunities : Chroma also supplies its high-power, high-site-count SLT systems to customers including, but not limited to, Marvell, Meta, Microsoft, Cisco, Xilinx, and Winstek. We believe these customers could also experience a meaningful acceleration in SLT demand over the next several years as AI/HPC devices continue moving toward higher power, larger package, and increasingly complex system architectures.
Multi-year power-hungry infrastructure demand driving ATS
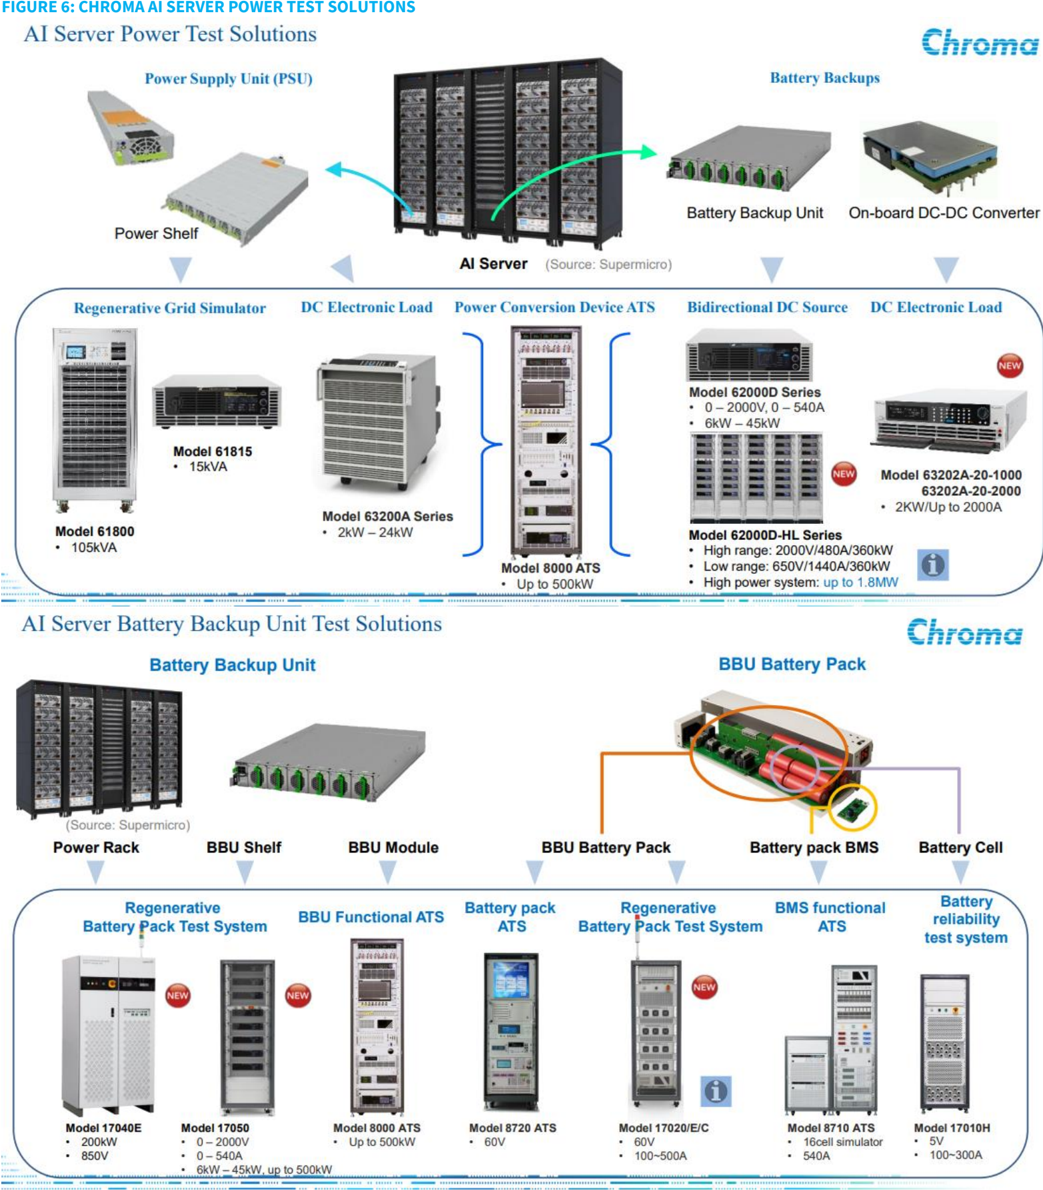
Chroma ' s dominance in ATS and power testing : According to Chroma's official HVDC AI server power testing materials (link), AI server power architectures are transitioning from traditional 12V designs toward 48V, 54V, ±400V, and eventually 800VDC architectures. The same article highlights that whether for tens-of-kW PSUs, hundreds-of-kW power shelves, or mW-level power racks, systems increasingly require stringent transient response and current slew-rate testing.
Using Chroma's 63200A DC electronic load as an example, the platform supports 2kW24kW per unit and can be paralleled across up to 60 units, enabling as much as 1.44MW testing capability. Conceptually, this implies that as PSU power density continues to increase, a proportionally larger amount of power testers will be required to support validation and production testing.
Furthermore, in another Chroma article published in December 2025 (link), the company introduced its 1.8MW bidirectional power solution, supporting both 800VDC source mode and load mode to simulate either a power source or AI server rack load, while delivering up to 94% energy regeneration efficiency. This suggests Chroma is no longer merely supplying standalone DC loads but is increasingly penetrating into HVDC power rack validation and production testing infrastructure.
FIGURE 5: CHROMA 63200A SERIES DC ELECTRONIC LOAD
As a recap of Chroma's 4Q25 earnings call , management highlighted that its Power business (ATS + Test Instruments) grew 55% in 2025 and expected AI server power demand, HVDC adoption, and ESS battery infrastructure to drive continued growth . Similarly, the company's 2Q25 earnings call indicated that growth in Testing Instruments and ATS was primarily driven by AI server power applications.
Taken together, these datapoints support a key conclusion: the growth narrative for Chroma's power tester business is evolving beyond traditional general power electronics and PSU testing, toward a more structural opportunity spanning AI server power shelves, BBUs, HVDC infrastructure, and power rack-level validation/testing.
Power hungry AI server infrastructure demand from PSU to shelve to rack : Our research indicates that AI server PSU testing time could increase by multiples versus traditional PSU testing, driven by factors including, though not limited to, significantly more demanding burn-in, transient response, and efficiency curve validation requirements. Notably, the TAM of PSU for Delta Electronics is likely to grow 80% CAGR in CY25-28E driven by stronger-thanexpected outlook for AI accelerators, general server demand upside, and dollar per watt expansion in high-density PSU. Note that, in the server PSU market, Delta leads with a market share of >50%, and Lite-On with around one-fourth of the market in second place.
At the power shelf level, the transition from 33kW (that is, Grace Blackwell) to 110kW (that is, Vera Rubin) architectures should also meaningfully extend testing time and complexity. Scaling further to the rack level, if customers require integrated testing across power racks, power shelves, and server racks , Chroma's content per production line could increase substantially.
Conceptually, a 33kW power shelf may allow one tester system to validate 1 -2 shelves simultaneously, whereas a 110kW / 800V architecture could require one tester dedicated to a single shelf, potentially with multiple DC loads and regenerative power sources connected in parallel.
±400VDC vs 800VDC : While the market is debating whether next-generation AI power rack will converge toward ±400VDC or 800VDC designs, given that 800VDC represents the highestvolume standardization path, we believe both scenarios appear structurally favorable for Chroma.
The difference between ±400VDC and 800VDC architectures is not simply whether the system 'uses 800V,' since both can reach roughly 800V line -to-line. The key distinction lies in the bus topology: ± 400VDC uses a bipolar split-bus architecture, consisting of +400V / 0V / -400V rails. 800VDC is a more direct unipolar high-voltage DC bus, typically operating between 800V and ground.
From a system perspective, ±400VDC may offer advantages in fault isolation, grounding flexibility, and compatibility with certain distributed power architectures, while 800VDC generally enables a simpler and potentially more scalable high-power delivery path for mWclass AI racks.
Importantly for Chroma, both architectures materially increase the complexity of highvoltage validation, transient response, insulation, safety, regenerative load, and dynamic power testing compared with traditional 48V/54V systems.
Under an Nvidia-led 800VDC standard architecture, Chroma would benefit from the volume ramp of mass-production 800V HVDC rack and power shelf testers. Alternatively, if CSPs adopt ±400VDC architectures, Chroma would likely benefit from demand for more customized, higher-ASP ATS and validation systems.
Importantly, both pathways are materially more favorable to Chroma versus traditional 48V/54V architectures, as the complexity of high-voltage, high-power, safety, transient response, and regenerative testing rise significantly.
Nvidia : Nvidia ' s GB200 NVL72 is a rack-scale liquid-cooled system consisting of 36 Grace CPUs and 72 Blackwell GPUs. The joint Vertiv -Nvidia GB200 reference architecture supports up to 132kW per rack, consisting of six power shelves -33kW per power shelf -with six PSUs per shelf (or 5.5kW per PSU).
Chroma ATE Decades in the Making
The GB300 NVL72 largely retains the Blackwell Ultra rack-scale architecture but introduces significantly more sophisticated power delivery and energy storage designs. Nvidia has disclosed that the GB300 incorporates PSUs with integrated energy storage, developed alongside Lite-On, to reduce peak grid demand and smooth transient loading. As a result, the testing requirement is no longer simply about PSU count, but increasingly involves validation of transient response, energy storage behaviour, load-step handling, ride-through capability, and power smoothing performance.
We believe the real inflection for Chroma's power tester content uplift begins with Rubin. Nvidia has publicly promoted an 800VDC ecosystem to support future rack scalability beyond 1MW per rack. At OCP 2025, Delta also demonstrated an 800VDC grid-to-chip solution codeveloped with Nvidia, claiming support for ~1.1MW-scale AI racks.
Nvidia has further indicated that Vera-Rubin NVL72 has entered full production, with shipments expected in 2H26. The Vera Rubin rack architecture is expected to introduce more advanced liquid cooling, liquid-cooled busbars, and ~20x greater energy storage, all of which should materially increase the complexity, testing time, and system content value of nextgeneration AI power infrastructure testing.
Other key upside drivers include:
BBU demand upside, supported by earlier-than-expected adoption of power rack architectures and improving battery cell supply;
High-wattage sidecar power systems for the Vera Rubin generation, which should begin contributing meaningfully in 2H26; and
Growing demand from Nvidia ' s LPU platforms, which are specifically optimized for AI inference and ultra-low-latency token generation for LLM/agentic AI workloads. In our framework, we assume roughly 700W chip-level power consumption and approximately 250kW system-level power consumption for LPU platforms.
While power infrastructure readiness could become a bottleneck, hyperscalers and datacenter operators are increasingly exploring alternative power deployment approaches, including SOFC (solid oxide fuel cells) and SMR (small modular reactors). Notably, Delta already has an SOFC solution in place and management has indicated strong customer interest.
Lastly, we now expect Chroma ' s revenue from ATS and power tester business to grow at a 70% CAGR during 2025-28E, driven mainly by AI server power -i.e. Delta ' s power capex is doubling YoY in CY26E and may not see deceleration over the next several years -as well as the recovery in China ' s ESS orders.
FIGURE 6: CHROMA AI SERVER POWER TEST SOLUTIONS
Al Server Power Test Solutions
Power Supply Unit (PSU)
Source• Comnanv
Battery Backups
2000000
Chroma
Source: Company
FIGURE 7: LUMENTUM SEES 85% LANE UNIT CAGR
= LITE InF lane volumo domand
Source: Companv. Aletheia/TAG
CY28
CY27
Industry Tailwinds:
Expect 85% CAGR in InP
optical lane volume demand
Photonics with 10x growth potential
Pluggable optical transceivers : We expect Chroma ' s optical tester revenue for pluggable optical modules to double YoY this year, with strong momentum extending into CY27E-28E, driven by the ramp of 1.8T/3.2T optical modules, echoing Lumentum CEO ' s outlook for InP optical lane volume demand growth of 85% CAGR (EML, CW lasers) through 2030 (or >4x in three years) and its capacity has sold out through 2028 (Figure 7).
Chroma is the near-exclusive optical tester vendor for all major transceiver module and laser source makers, such as Lumentum, Coherent, and Sumitomo. All existing vendors have announced aggressive capacity expansion plans, including Lumentum ' s +50% in CY26E, Sumitomo to grow 40% from CY26E-28E, and Coherent to grow 200% during CY26E-27E.
CPO : Our research indicates that Nvidia's CPO insertion #3 and #4 flows (the 32x OE switch IC) -currently planned to be primarily handled at SPIL -already have a defined POR (plan-ofrecord) vendor list. Within this setup, Chroma appears to be the exclusive vendor for insertion #3 optical engine (OE) die testers and insertion #4 light-in light-out optical testers.
We estimate Chroma's addressable CPO OE/optical tester TAM to be approximately NT$10bn and NT$30bn+ for insertion #3 and insertion #4 during CY26E -28E. Given its current positioning, we believe Chroma could potentially capture a 70%+ share, implying a revenue opportunity of roughly NT$8bn+ and NT$10 -20bn, respectively, over the next several years.
We also expect insertion #3 to carry higher content value for Chroma versus insertion #4. Chroma's insertion #3 solution is an automated OE die tester targeting PIC, micro -lens, and FAU inspection/testing, whereas insertion #4 is primarily a package-level optical validation step, where Chroma's automated light -in light-out tester is used to measure optical loss and channel pass/fail performance.
Moreover, we expect Chroma to continue developing potential CPO SLT systems for future adoption, which could further expand its role beyond current optical test insertions into more comprehensive system-level validation for next-generation CPO architectures.
Net-net, we expect Chroma's photonics -related revenue to grow by more than 10x during CY25 -28E, driven by accelerating adoption of CPO testing, continued ramp of 1.6T/3.2T optical modules, and expanding optical validation requirements across next-generation AI networking infrastructure.
FIGURE 7: LUMENTUM SEES 85% LANE UNIT CAGR
Source: Company, Aletheia/TAG
Earnings forecast change
We raise our FY26E -27E revenue estimates by 40% -80% and EPS estimates by 44% -90%, while also introducing our initial FY28E forecasts. Relative to consensus, our EPS estimates now stand 13% -80% above Street expectations.
In our model, we now expect Chroma's ATS revenue to more than double YoY in CY26E and sustain roughly ~60% CAGR during CY27E -28E, with the AI server power segment surpassing conventional power tester demand for the first time in CY26E.
We estimate the AI server power opportunity alone could already exceed NT$10bn of demand value for Chroma over this and next year, with potential upside remaining significant as AI rack power architectures migrate toward higher-power HVDC systems. At the same time, we also expect a recovery in China ESS-related demand, providing an additional growth driver for the ATS business.
For SLT, we expect this segment to grow at ~80% CAGR during CY25E -28E, driven by Nvidia's nextgeneration SLT opportunities, Google's Axion CPU programs, and notably AMD's MI450/455 SLT, which we believe has already surpassed the content value of Blackwell SLT.
Looking ahead, we do not rule out the possibility that AMD's future MI500 -series SLT opportunity could exceed Nvidia's comparable SLT content, given that AMD appears to allocate significantly more test items to SLT than other major IC design houses.
For the remaining segments, we expect Photonics revenue to grow by more than 10x during CY25 -28E, while AOI/metrology could scale into a high multi-billion NT-dollar business over the next several years. Meanwhile, we expect the SoC tester business to remain broadly flattish YoY, despite potential upside from increasing adoption by a European IDM.
FIGURE 8: CHROMA - ESTIMATE CHANGE
| 2Q26E | 2Q26E | 2Q26E | 3Q26E | 3Q26E | 3Q26E | 2026E | 2026E | 2026E | 2027E | 2027E | 2027E | 2028E | 2028E | 2028E | |
|---|---|---|---|---|---|---|---|---|---|---|---|---|---|---|---|
| (TWD$mn) | New | Prev | Var (%) | New | Prev | Var (%) | New | Prev | Var (%) | New | Prev | Var (%) | New | Prev | Var (%) |
| Sales | 13,412 | 10,080 | 33.1 | 14,741 | 10,172 | 44.9 | 56,169 | 40,464 | 38.8 | 96,689 | 53,758 | 79.9 | 144,623 | n.a. | |
| Gross profit | 8,436 | 6,340 | 33.1 | 9,287 | 6,408 | 44.9 | 35,406 | 25,512 | 38.8 | 62,142 | 34,551 | 79.9 | 94,609 | n.a. | |
| Operating profit | 5,553 | 3,568 | 55.6 | 6,221 | 3,611 | 72.3 | 23,534 | 14,297 | 64.6 | 43,141 | 20,332 | 112.2 | 69,120 | n.a. | |
| Net profit | 4,581 | 3,064 | 49.5 | 5,106 | 3,373 | 51.4 | 19,258 | 13,122 | 46.8 | 34,972 | 18,278 | 91.3 | 56,080 | n.a. | |
| Diluted EPS (TWD$) | 10.52 | 7.19 | 46.4 | 11.73 | 7.92 | 48.1 | 44.44 | 30.79 | 44.3 | 82.08 | 42.89 | 91.4 | 131.63 | n.a. | |
| Gross margins (%) | 62.9 | 62.9 | 0.0 | 63.0 | 63.0 | 0.0 | 63.0 | 63.0 | (0.0) | 64.3 | 64.3 | (0.0) | 65.4 | - | n.a. |
| OP margins (%) | 41.4 | 35.4 | 6.0 | 42.2 | 35.5 | 6.7 | 41.9 | 35.3 | 6.6 | 44.6 | 37.8 | 6.8 | 47.8 | - | n.a. |
| Net margins (%) | 34.2 | 30.4 | 3.8 | 34.6 | 33.2 | 1.5 | 34.3 | 32.4 | 1.9 | 36.2 | 34.0 | 2.2 | 38.8 | - | n.a. |
Source: Company, Aletheia Capital, TAG
FIGURE 9: CHROMA - ESTIMATE VERSUS CONSENSUS
| 2Q26E | 2Q26E | 2Q26E | 3Q26E | 3Q26E | 3Q26E | 2026E | 2026E | 2026E | 2027E | 2027E | 2027E | 2028E | 2028E | 2028E | |
|---|---|---|---|---|---|---|---|---|---|---|---|---|---|---|---|
| (TWD$mn) | Aletheia | Street | Var (%) | Aletheia | Street | Var (%) | Aletheia | Street | Var (%) | Aletheia | Street | Var (%) | Aletheia | Street | Var (%) |
| Sales | 13,412 | 12,128 | 10.6 | 14,741 | 12,644 | 16.6 | 56,169 | 49,925 | 12.5 | 96,689 | 68,132 | 41.9 | 144,623 | 81,165 | 78.2 |
| Gross profit | 8,436 | 7,640 | 10.4 | 9,287 | 8,025 | 15.7 | 35,406 | 31,558 | 12.2 | 62,142 | 43,872 | 41.6 | 94,609 | 52,477 | 80.3 |
| OP profit | 5,553 | 4,946 | 12.3 | 6,221 | 5,235 | 18.8 | 23,534 | 20,532 | 14.6 | 43,141 | 30,206 | 42.8 | 69,120 | 38,287 | 80.5 |
| Net profit | 4,581 | 4,265 | 7.4 | 5,106 | 4,534 | 12.6 | 19,258 | 17,019 | 13.2 | 34,972 | 25,236 | 38.6 | 56,080 | 30,630 | 83.1 |
| Diluted EPS (TWD$) | 10.52 | 9.80 | 7.4 | 11.73 | 10.42 | 12.6 | 44.44 | 39.27 | 13.2 | 82.08 | 59.23 | 38.6 | 131.63 | 71.89 | 83.1 |
| Gross margins (%) | 62.9 | 63.0 | (0.1) | 63.0 | 63.5 | (0.5) | 63.0 | 63.2 | (0.2) | 64.3 | 64.4 | (0.1) | 65.4 | 64.7 | 0.8 |
| OP margins (%) | 41.4 | 40.8 | 0.6 | 42.2 | 41.4 | 0.8 | 41.9 | 41.1 | 0.8 | 44.6 | 44.3 | 0.3 | 47.8 | 47.2 | 0.6 |
| Net margins (%) | 34.2 | 35.2 | (1.0) | 34.6 | 35.9 | (1.2) | 34.3 | 34.1 | 0.2 | 36.2 | 37.0 | (0.9) | 38.8 | 37.7 | 1.0 |
Source: Company, Aletheia Capital, TAG
Valuation and recommendation
We raise our target price to NT$4,000 (from UR), based on an unchanged PER of 30x now applied to FY28E EPS of NT$132 (vs prior based on FY27E PER). The stock has traded within a 15 -35x forward PER range over the past three years; we now assign a +1 standard deviation PER of 30x to reflect the anticipated earnings upcycle and Chroma ' s ability to ride on all major existing tech upgrade trends or future uptrends.
We apply the FY28E earnings as our valuation base because we expect most of the major technology upgrade cycles -including next-generation SLT, 800V/±400VDC power testing demand, photonics/CPO tester volume ramps, and AOI/metrology tool pull-ins -to inflect at a much larger magnitude during late-CY27E through 1H28E.
We observed that Chroma's stock price has appreciated in three major waves since 2017, and the corresponding PER has been traded to 30-35x during these time periods:
- (1) Apple 3D sensing/VCSEL saw the mix of photonics revenue in parent revenue go up from 17% to 31% from 2016 to 2017;
- (2) After the Covid outbreak in 2020-2021, the positive semi outlook and still-strong power business stimulated Chroma for another share price rally; and
- (3) With the AI demand boom in 2022-2023, a strong SLT outlook and SLT content growth driven by the AI accelerator boosted Chroma's semi business.
From an earnings modelling perspective, we expect Chroma ' s consolidated revenue to grow by 98% YoY in CY26E, 72% in CY27E, and 50% in CY28E, driven by a more ubiquitous highpower and high-site-count SLT adoption, substantial photonics revenue momentum, AOI metrology revenue ramp with TSMC and OSATs ' capacity expansion, as well as a high growth phase at ATS and power tester for both AI server and China ESS. Moreover, we foresee the company ' s consolidated gross margin benefiting from the favorable mix and growing from 59.0% in CY24 to 62%-65% in CY25-28E.
Earnings Model
| FYE Dec, Sales mix (TWD mn) | 1Q25 | 2Q25 | 3Q25 | 4Q25 | 1Q26 | 2Q26E | 3Q26E | 4Q26E | FY24A | FY25A | FY26E | FY27E | FY28E |
|---|---|---|---|---|---|---|---|---|---|---|---|---|---|
| Consolidated Testing Equipment Business | 6,456 | 6,292 | 6,155 | 8,263 | 11,543 | 13,242 | 14,475 | 15,825 | 20,418 | 27,166 | 55,085 | 95,556 | 143,440 |
| - ATS | 2,205 | 2,698 | 3,011 | 2,632 | 5,390 | 5,396 | 6,022 | 5,790 | 6,825 | 10,546 | 22,598 | 38,219 | 55,935 |
| - Semi / Photonics | 2,602 | 2,202 | 2,092 | 2,863 | 3,410 | 5,883 | 7,002 | 5,974 | 6,973 | 9,759 | 22,269 | 42,976 | 67,801 |
| - Turnkey | 150 | 123 | 55 | 116 | 53 | 123 | 55 | 116 | 685 | 444 | 347 | 347 | 347 |
| - Service & Others | 282 | 315 | 334 | 332 | 402 | 410 | 401 | 465 | 1,168 | 1,263 | 1,677 | 2,117 | 2,700 |
| - Overseas operations and subsidiaries | 1,217 | 954 | 663 | 2,320 | 2,288 | 1,431 | 995 | 3,480 | 4,767 | 5,154 | 8,194 | 11,898 | 16,657 |
| MAS | 349 | 94 | 187 | 254 | 251 | 99 | 196 | 267 | 873 | 884 | 813 | 853 | 896 |
| Other Subsidiaries | 60 | 69 | 68 | 63 | 65 | 71 | 70 | 65 | 313 | 260 | 271 | 279 | 288 |
| Total Consolidated Revenue | 6,865 | 6,455 | 6,410 | 8,580 | 11,859 | 13,412 | 14,741 | 16,157 | 21,604 | 28,310 | 56,169 | 96,689 | 144,623 |
| Consolidated Testing Equipment Business | 94% | 97% | 96% | 96% | 97% | 99% | 98% | 98% | 95% | 96% | 98% | 99% | 99% |
| - ATS | 32% | 42% | 47% | 31% | 45% | 40% | 41% | 36% | 32% | 37% | 40% | 40% | 39% |
| - Semi / Photonics | 38% | 34% | 33% | 33% | 29% | 44% | 48% | 37% | 32% | 34% | 40% | 44% | 47% |
| - Turnkey | 2% | 2% | 1% | 1% | 0% | 1% | 0% | 1% | 3% | 2% | 1% | 0% | 0% |
| - Service & Others | 4% | 5% | 5% | 4% | 3% | 3% | 3% | 3% | 5% | 4% | 3% | 2% | 2% |
| - Overseas operations and subsidiaries | 18% | 15% | 10% | 27% | 19% | 11% | 7% | 22% | 22% | 18% | 15% | 12% | 12% |
| MAS | 5% | 1% | 3% | 3% | 2% | 1% | 1% | 2% | 3% | 1% | 1% | 1% | |
| Other Subsidiaries | 1% | 1% | 1% | 1% | 1% | 1% | 0% | 0% | 4% 1% | 1% | 0% | 0% | 0% |
| Total Consolidated Revenue | 100% | 100% | 100% | 100% | 100% | 100% | 100% | 100% | 100% | 100% | 100% | 100% | 100% |
| P&L model (TWD, mn) | 1Q25 | 2Q25 | 3Q25 | 4Q25 | 1Q26 | 2Q26E | 3Q26E | 4Q26E | FY24A | FY25A | FY26E | FY27E | FY28E |
| Revenue COGS | 6,865 | 6,455 -2,231 | 6,410 | 8,580 -3,363 | 11,859 | 13,412 -4,976 | 14,741 -5,454 | 16,157 | 21,604 | 28,311 | 56,169 -20,762 | 96,689 | 144,623 |
| -2,717 | -2,575 | -4,435 | -5,897 | -8,858 | -10,886 | -34,547 | -50,015 | ||||||
| Gross profit | 4,148 | 4,224 | 3,835 | 5,217 | 7,424 | 8,436 | 9,287 | 10,259 | 12,746 | 17,425 | 35,406 | 62,142 | 94,609 |
| OPEX | -1,984 | -2,027 | -1,987 | -2,229 | -2,627 | -2,884 | -3,066 | -3,296 | -7,264 | -8,227 | -11,873 | -19,000 | -25,489 |
| Operating profit | 2,164 | 2,197 | 1,848 | 2,988 | 4,797 | 5,553 | 6,221 | 6,963 | 5,482 | 9,198 | 23,534 1,044 | 43,141 1,057 | 69,120 1,652 |
| Non-op tax | 433 | 241 2,438 | 3,626 5,475 | 420 3,408 | 297 5,094 | 246 5,799 | 241 6,462 | 260 | 1,226 | 4,720 | 24,578 | 44,199 | 70,771 |
| Profit befroe Tax | 2,597 -475 | -485 | -408 | -858 | -1,230 | -1,217 | -1,355 | 7,224 -1,517 | 6,709 -1,444 | 13,918 -2,226 | -5,320 | -9,227 | -14,692 |
| Net profit | 2,122 | 1,953 | 5,066 | 2,550 | 3,864 | 4,581 | 5,106 | 5,707 | 5,264 | 11,692 | 19,258 | 34,972 | 56,080 |
| FD EPS | 4.98 | 4.60 | 11.92 | 6.01 | 9.07 | 10.52 | 11.73 | 13.11 | 12.37 | 27.51 | 44.44 | 82.08 | 131.63 |
| Margin | 1Q25 | 2Q25 | 3Q25 | 4Q25 | 1Q26 | 2Q26E | 3Q26E | 4Q26E | FY24A | FY25A | FY26E | FY27E | FY28E |
| OPM PTM | 31.5% 37.8% | 34.0% | 28.8% | 34.8% | 40.5% 43.0% | 41.4% 43.2% | 42.2% | 43.1% | 25.4% 31.1% | 32.5% 49.2% | 41.9% 43.8% | 44.6% 45.7% | 47.8% |
| 37.8% | 85.4% | 39.7% | 43.8% | 44.7% | 38.8% | ||||||||
| 79.0% | 32.6% | 34.2% | 34.6% | 35.3% | 24.4% | 41.3% | 34.3% | 36.2% | 48.9% | ||||
| NP | 30.9% | 30.3% | 29.7% | ||||||||||
| QoQ chg (%) | 1Q25 | 2Q25 -6% | 3Q25 | 4Q25 | 1Q26 | 2Q26E | 3Q26E | 4Q26E | FY24A | FY25A | FY26E | FY27E | FY28E |
| Revenue | 14% 15% | 2% | -1% | 34% | 38% 42% | 13% 14% | 10% 10% | 10% 10% | - - | - | - - | - - | - - |
| Gross profit | -9% | 36% | 16% | 12% | 12% | - | - | - | - - | ||||
| Operating profit | 39% | 2% | -16% 159% | 62% -50% | 61% | - | - | - | - | ||||
| Net profit | 44% | -8% | 52% | 19% | 11% | 12% | - | - | |||||
| EPS | 44% | -8% | 159% | -50% | 51% | 16% | 11% | 12% | - | - | - | - | - |
| YoY chg (%) | 1Q25 | 2Q25 | 3Q25 14% | 4Q25 42% | 1Q26 73% | 2Q26E 108% | 3Q26E 130% | 4Q26E 88% | FY24A 16% | FY25A | FY26E | FY27E 72% | FY28E 50% |
| Revenue Gross profit | 55% 62% | 17% 29% | 16% | 45% | 79% | 100% | 142% | 97% | 18% | 31% 37% | 98% 103% | 76% | 52% |
| Operating profit | 140% | 45% | 23% | 92% | 122% | 153% | 237% | 133% | 17% | 68% | 156% | 83% | 60% |
| Net profit | 122% | 39% | 255% | 73% | 82% | 135% | 1% | 124% | 32% | 122% | 65% | 82% | 60% |
| EPS | 121% | 39% | 255% | 74% | 82% | 129% | -2% | 118% | 32% | 122% | 62% | 85% | 60% |
Source: Company, Aletheia/TAG
Financial statements
| INCOME STATEMENT FYE Dec. (TWD, bn) | FY23A | FY24A | FY25A | FY26F | FY27F | FY28F | BALANCE SHEET FYE Dec. (TWD, bn) | FY23A FY24A FY25A FY26F FY27F FY28F | FY23A FY24A FY25A FY26F FY27F FY28F | FY23A FY24A FY25A FY26F FY27F FY28F | FY23A FY24A FY25A FY26F FY27F FY28F | FY23A FY24A FY25A FY26F FY27F FY28F | FY23A FY24A FY25A FY26F FY27F FY28F |
|---|---|---|---|---|---|---|---|---|---|---|---|---|---|
| Revenue | 18.7 | 21.6 | 28.3 | 56.2 | 96.7 | 144.6 | Cash/ST investments | 4.8 | 5.0 | 8.3 | 10.4 | 9.3 | 11.9 |
| COGS | (7.9) | (8.9) | (10.9) | (20.8) | (34.5) | (50.0) | Inventory | 4.7 | 5.5 | 7.9 | 10.6 | 16.1 | 22.6 |
| Gross profit | 10.8 | 12.7 | 17.4 | 35.4 | 62.1 | 94.6 | Receivable | 5.3 | 6.1 | 8.9 | 16.8 | 27.5 | 42.5 |
| Operating expense | (6.1) | (7.3) | (8.2) | (11.9) | (19.0) | (25.5) | Current assets | 15.8 | 17.4 | 26.1 | 38.8 | 53.9 | 78.1 |
| EBITDA | 5.4 | 6.3 | 10.0 | 25.1 | 46.0 | 73.5 | Fixed Assets | 7.5 | 7.3 | 7.8 | 7.2 | 5.2 | 1.8 |
| Operating profit | 4.7 | 5.5 | 9.2 | 23.5 | 43.1 | 69.1 | Goodwill & intangibles | 0.3 | 0.3 | 0.3 | 0.3 | 0.3 | 0.3 |
| Net non-op income | 0.5 | 1.2 | 4.7 | 1.0 | 1.1 | 1.7 | Other LT assets | 10.0 | 12.3 | 12.9 | 13.5 | 14.2 | 14.9 |
| Profit before tax | 5.2 | 6.7 | 13.9 | 24.6 | 44.2 | 70.8 | LT assets | 17.7 | 19.9 | 21.0 | 21.0 | 19.7 | 16.9 |
| Tax | (1.1) | (1.3) | (2.0) | (4.8) | (8.4) | (13.4) | Total assets | 33.5 | 37.3 | 47.2 | 59.8 | 73.6 | 95.0 |
| Minority Interest | (0.1) | (0.1) | (0.2) | (0.5) | (0.8) | (1.2) | |||||||
| Net Profit | 4.0 | 5.3 | 11.7 | 19.3 | 35.0 | 56.1 | Payable | 2.6 | 3.1 | 4.1 | 6.6 | 10.5 | 15.5 |
| FD EPS, TWD | 9.4 | 12.2 | 26.9 | 45.0 | 82.1 | 131.6 | Other liability | 5.8 | 5.1 | 5.0 | 5.5 | 6.1 | 6.7 |
| Current liabilities | 8.4 | 8.2 | 9.2 | 12.1 | 16.6 | 22.2 | |||||||
| Change | LT liabilities | 2.5 | 3.6 | 5.4 | 4.1 | 3.3 | 2.7 | ||||||
| Revenue | -15.4% | 15.7% | 31.0% | 98.4% | 72.1% | 49.6% | Total liabilities | 11.0 | 11.9 | 14.6 | 16.3 | 19.9 | 25.0 |
| Gross profit | -5.3% | 18.5% | 36.7% | 103.2% | 75.5% | 52.2% | Common shares | 4.3 | 4.3 | 4.3 | 4.3 | 4.3 | 4.3 |
| Operating profit | -7.3% | 17.3% | 67.8% | 155.9% | 83.3% | 60.2% | Retained earnings | 9.0 | 10.9 | 18.1 | 29.0 | 39.2 | 55.6 |
| Net Profit | -22.1% | 32.3% | 122.1% | 64.7% | 81.6% | 60.4% | Equity | 22.5 | 25.4 | 32.6 | 43.5 | 53.7 | 70.0 |
| EPS | -22.1% | 30.9% | 119.6% | 67.2% | 82.6% | 60.4% | Liability&equity | 33.5 | 37.3 | 47.2 | 59.8 | 73.6 | 95.0 |
| CASH FLOW | CASH FLOW | CASH FLOW | CASH FLOW | CASH FLOW | CASH FLOW | CASH FLOW | RATIOS & PER SHARE DATA * | RATIOS & PER SHARE DATA * | RATIOS & PER SHARE DATA * | RATIOS & PER SHARE DATA * | RATIOS & PER SHARE DATA * | RATIOS & PER SHARE DATA * | RATIOS & PER SHARE DATA * |
| FYE Dec. (TWD, bn) | FY23A FY24A FY25A FY26F FY27F FY28F | FY23A FY24A FY25A FY26F FY27F FY28F | FY23A FY24A FY25A FY26F FY27F FY28F | FY23A FY24A FY25A FY26F FY27F FY28F | FY23A FY24A FY25A FY26F FY27F FY28F | FY23A FY24A FY25A FY26F FY27F FY28F | FYE Dec. (TWD) | FY23A FY24A FY25A FY26F FY27F FY28F | FY23A FY24A FY25A FY26F FY27F FY28F | FY23A FY24A FY25A FY26F FY27F FY28F | FY23A FY24A FY25A FY26F FY27F FY28F | FY23A FY24A FY25A FY26F FY27F FY28F | FY23A FY24A FY25A FY26F FY27F FY28F |
| Net profit | 4.0 | 5.3 | 11.7 | 19.3 | 35.0 | 56.1 | Gross margin | 57.6% | 59.0% | 61.5% | 63.0% | 64.3% | 65.4% |
| Dep. & amortisation | 0.7 | 0.8 | 0.8 | 1.6 | 2.9 | 4.3 | EBITDA Margin | 29.0% | 29.0% | 35.5% | 44.7% | 47.6% | 50.8% |
| Chg in WC | -1.0 | -1.0 | -4.7 | -8.0 | -12.3 | -16.5 | Op. Profit Margin | 25.0% | 25.4% | 32.5% | 41.9% | 44.6% | 47.8% |
| Others | -0.3 | -0.2 | -2.6 | 0.3 | 0.7 | 1.2 | Net Profit Margin | 21.3% | 24.4% | 41.3% | 34.3% | 36.2% | 38.8% |
| OPN cash flow | 3.4 | 4.8 | 5.3 | 13.1 | 26.3 | 45.1 | ROE (%) | 17.9% | 21.9% | 40.3% | 50.6% | 71.9% | 90.6% |
| Capex | -0.6 | -0.2 | -0.7 | -0.9 | -0.9 | -0.9 | ROA(%) | 11.8% | 14.9% | 27.7% | 36.0% | 52.4% | 66.5% |
| Chg in investment | 0.0 | -0.3 | -0.3 | -0.0 | -0.0 | -0.0 | Gross gearing | 20.6% | 18.3% | 15.4% | 8.6% | 5.4% | 3.3% |
| Others | -0.9 | -1.3 | 2.4 | -0.5 | -0.8 | -1.2 | Net gearing | 2.3% | 2.2% | -3.7% | -10.5% | -8.0% | -10.6% |
| Investing CF | -1.4 | -1.9 | 1.4 | -1.4 | -1.8 | -2.2 | Asset turn (x) | 0.6 | 0.6 | 0.7 | 1.1 | 1.4 | 1.7 |
| Chg in debt | -0.2 | 0.2 | -0.4 | -1.3 | -0.8 | -0.6 | Leverage (x) | 1.5 | 1.5 | 1.5 | 1.4 | 1.4 | 1.4 |
| Equity raised | 0.0 | 0.0 | 0.0 | 0.0 | 0.0 | 0.0 | Payable days | 127.8 | 117.9 | 121.1 | 94.6 | 90.8 | 95.2 |
| Dividends (paid) | -3.4 | -2.8 | -3.8 | -8.3 | -24.8 | -39.8 | Receivable days | 98.1 | 96.5 | 96.8 | 83.8 | 83.9 | 88.6 |
| Others | -0.2 | -0.4 | -0.3 | 0.0 | 0.0 | 0.0 | Inventory days | 217.3 | 209.4 | 224.9 | 163.1 | 141.3 | 141.6 |
| Financing CF | -3.8 | -3.0 | -4.5 | -9.6 | -25.6 | -40.3 | EPS | 9.4 | 12.2 | 26.9 | 45.0 | 82.1 | 131.6 |
| FX & other adj. | 0.0 | 0.1 | -0.0 | 0.0 | 0.0 | 0.0 | BVPS | 52.9 | 59.2 | 74.9 | 101.6 | 126.1 | 164.4 |
| Chg in cash | -1.8 | -0.0 | 2.1 | 2.1 | -1.1 | 2.6 | Net cash per share | (1.2) | (1.3) | 2.8 | 10.7 | 10.1 | 17.4 |
| Beginning cash | 5.9 | 4.1 | 4.1 | 6.2 | 8.3 | 7.2 | SPS | 43.9 | 50.3 | 65.1 | 131.1 | 226.9 | 339.4 |
| End cash | 4.1 | 4.1 | 6.2 | 8.3 | 7.2 | 9.8 | FCFPS | 6.7 | 10.6 | 10.4 | 28.3 | 59.4 | 103.6 |
| FCF | 2.8 | 4.6 | 4.5 | 12.1 | 25.3 | 44.1 | DPS | 8.0 | 6.5 | 8.8 | 19.4 | 58.2 | 93.3 |
Source: Company, Aletheia/TAG
Alētheia Research Team
Product Marketing Teams
| Macro/Strategy | LEAD ANALYST | LEAD ANALYST | Sector | LEAD ANALYST | LEAD ANALYST |
|---|---|---|---|---|---|
| Global Strategy | anto Jonathan Wilmot | Technology Hardware | Warren Lat | ||
| Asianomics | * Dr. Jim Walker | Consumer & Internet | Nirgunan Tiruchelvam | ||
| Tech Thematic Strategy | Keith Woolcock | China Technology | Eric Wen | ||
| Asia Equity Strategy | David Scott | Telecoms | Chris Hoare | ||
| China Strategy | Vincent Chan | CrossASEAN | Angus Mackintosh | ||
| Tactical Alpha Strategy | Justin Collazo | India | Maulik Patel | ||
| Global Commodities | Steven Schlegel | MENA | Jaap Meljer |
Serving 300+ clients, 8,000+ touch points, in 20+ geographies with $15tr+ AUM

| • Al Park 1201 962 0529 al. park@aletheia-capital.com AMERICAS - NEW YORK | • Linda Gustafsson 447919191349 linda@nordlinkcapital.com EUROPE - NORDICS | • Michael Chambers 65 9858 9759 michael.chambers@aletheia-capital.com ASIA - SINGAPORE | • Graeme Bateman R52 2534 7437 graeme.bateman@aletheia-capital.com ASIA - HONG KONG |
|---|---|---|---|
| • Wayne Chang 040Do ad wavne.chandqoletneia-coolal.com AMERICAS - NEW YORK | • Daren Riley 4474835y 8o9 coren.fllevcaletneid-caoital.com EUROPE - LONDON | • Richard Wallace X0w0.41474 richorc.wollacedaletheic-caoital.com ASIA / EUROPE - HONG KONG | |
| • Terrence Alford 1469 403 4936 terence.allordgaletheia-capital.com AMERICAS - DALLAS | • Dhananjay Mahurkar 44 777 55 26 870 cncnon.cy.mcnurkardlemnela-ccplal.com EUROPE - LONDON | • Augustine Chen 8869 2739 8793 augustine.chen@aletheia-capital.com ASIA - HONG KONG |
Firm Disclosures
Aletheia Capital Ltd ("Aletheia") is a limited company registered in Hong Kong, located at Unit 2407, World-Wide House, 19 Des Voeux Road, Central, Hong Kong.
Aletheia Analyst Network Ltd ('AAN') is a limited company registered in Hong Kong and is a wholly owned by Aletheia and is regulated by the Hong Kong Securities and Futures Commission, is a registered investment advisor with the U.S. Securities and Exchange Commission and is regulated by the Financial Conduct Authority, Firm Reference Number 794762.
Aletheia Capital (Singapore) Pte Ltd ('ACSG') is a limited company registered in Singapore, UEN 201823248E, and is a wholly owned by AAN and is an Exempt Financial Adviser as defined in the Financial Advisers Act.
This report was published by AAN and is distributed by AAN and ACSG. For investors in Singapore, this material is provided by ACSG pursuant to Regulation 32C of the Financial Advisers Regulations. If there are any matters arising from, or in connection with this material, please contact ACSG, Level 39, MBFC Tower 2, 10 Marina Blvd, Singapore 018983.
Additional information will be made available upon request.
圖片清單(已驗證 2026-07-02)
回補驗證:僅涵蓋已被 lib 頁嵌入的圖片,非全量驗證。
| 檔名 | size | 分類 | 親眼所見內容 |
|---|---|---|---|
260521_2360致茂_aletheia_ATE_001.png |
212KB | 真資料圖 | Figure 1: Chroma's Model 3200/3160 FT & SLT Test Systems,展示 GPU 世代(Hopper/Blackwell/Rubin)TDP 對應之測試方案,含 King Cobra 溫控系統、3160-H Advanced Package FT Test Hander、3200-HD High Density Testing Platform 三張產品照片與規格條列 |
260521_2360致茂_aletheia_ATE_002.png |
235KB | 真資料圖 | 測試流程圖:Wafer Test → Die Level Test → Final Test → Burn In Test → System Level Test,以紅框標示 2020s 新增測試項目(Mission mode test、Stress application、Multiple dies 等),並與 2010s 對照;圖上方附三點文字說明測試量增加原因 |
260521_2360致茂_aletheia_ATE_005.png |
995KB | 真資料圖 | Figure 6: Chroma AI Server Power Test Solutions,含 AI Server Power Test Solutions 與 AI Server Battery Backup Unit Test Solutions 兩組流程圖,列出對應設備型號(Model 61800/61815、63200A、8000 ATS、62000D/62000D-HL、63202A 系列;Model 17040E、17050、8720 ATS、17020/E/C、8710 ATS、17010H)與各自規格 |