PDF 原檔:260611_3037_4958_ms_optics-PCB_original.pdf
原始內容
M June 11, 2026 09:00 PM GMT
Greater China Technology Hardware | Asia Pacific
Optics Drives the Board: PCB Beneficiaries of the AI Interconnect Build-out
Although incumbent suppliers, including Unimicron and Shennan Circuits, will likely benefit from the growth in transceiver PCB demand and content expansion, we view ZDT as the most compelling beneficiary, given its potential to capture meaningful share as the industry transitions to higher speeds.
The AI investment cycle is entering a new phase in which optical connectivity is becoming as critical as compute. As hyperscalers scale AI clusters from tens of thousands to hundreds of thousands of GPUs, the number of optical transceivers required to connect these systems is growing rapidly. While investors have largely focused on beneficiaries such as GPUs, networking chips, and optical module vendors, we believe there are also opportunities further down the supply chain: printed circuit board (PCB) manufacturers . These companies provide a differentiated way to participate in the secular growth of AI infrastructure spend.
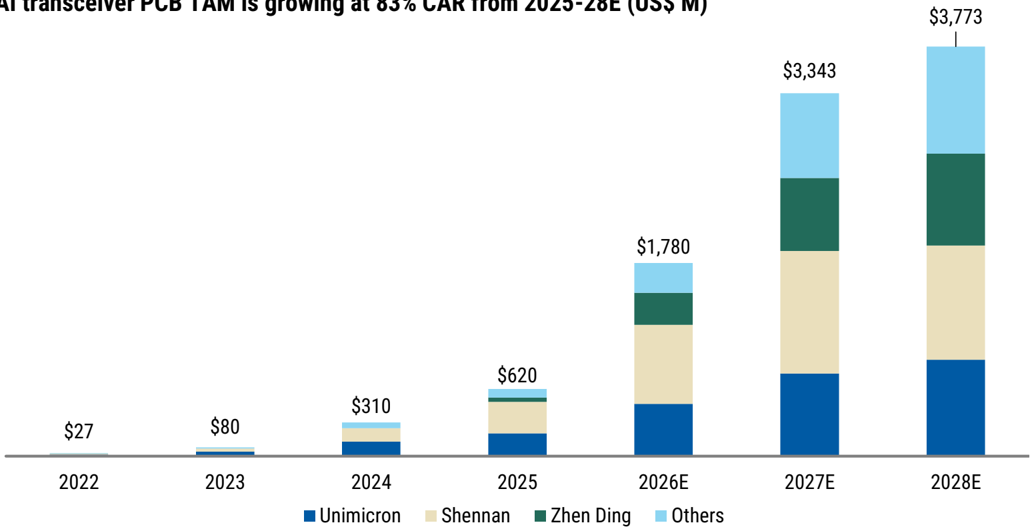
The opportunity is not solely driven by unit growth; content is also rising. As the industry migrates from 400G to 800G and eventually 1.6T optical transceivers, PCB complexity is increasing materially. Higher layer counts (10L to 16L), higher grade CCL (M6 to M8), and the adoption of advanced manufacturing technologies (HDI to mSAP) are driving a step-function increase in PCB content per module (US$10 to US $25). As a result, we expect the optical transceiver PCB market to grow substantially faster (83% CAGR) than underlying transceiver shipments (60% CAGR) from CY25-28. We are forecasting AI transceiver PCB TAM growing from ~US $620M in CY25 to ~US$3,773M by CY28, and this content-driven growth should also translate into improved profitability and expanding returns for suppliers with the requisite technological capabilities.
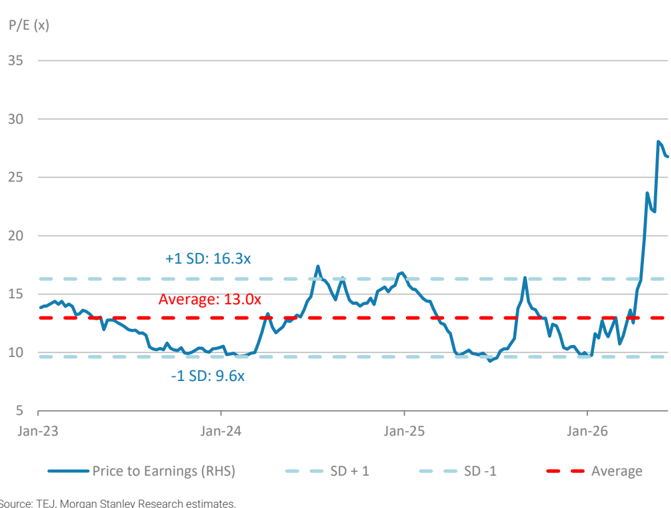
ZDT is best positioned to capture share: We expect incumbent leaders to benefit from both volume and content growth; however, we believe the most attractive investment opportunity is Zhen Ding (ZDT). The transition to 1.6T and beyond is raising qualification barriers and increasing the importance of advanced manufacturing know-how, particularly in mSAP processes. As the market expands and customers seek additional qualified suppliers, companies with proven high-end PCB capabilities are positioned to capture disproportionate growth. In our view, this combination of secular AI demand, rising content intensity, and market share gains creates a compelling angle for ZDT, hence we raise our PT to NT$666, implying 20x CY28 P/E (0.5x PEG). We reiterate our OW on Unimicron, with a raised PT of NT $1,285, implying 25x CY28 P/E (0.25x PEG), but stay EW on Shennan with a raised PT of Rmb400, implying 25x CY28 P/E (0.6x PEG). We prefer ZDT (15x CY28 P/E) and Unimicron (17x CY28 P/E) but are EW Shennan (25x CY28 P/E) on valuation.
Idea
Morgan Stanley Taiwan Limited+
Howard Kao
Equity Analyst
Howard.Kao@morganstanley.com
+886 2 2730-2989
Irene Yen
Research Associate
Irene.Yen@morganstanley.com
+886 2 2730-2869
Sharon Shih
Equity Analyst
Sharon.Shih@morganstanley.com
+886 2 2730-2865

Greater China Technology Hardware
Asia Pacific Industry View
In-Line
Exhibit 1 : What's changed?
Source: Bloomberg, Morgan Stanley Research estimates. Pricing as of the close on June 10, 2026.
Morgan Stanley does and seeks to do business with companies covered in Morgan Stanley Research. As a result, investors should be aware that the firm may have a conflict of interest that could affect the objectivity of Morgan Stanley Research. Investors should consider Morgan Stanley Research as only a single factor in making their investment decision.
For analyst certification and other important disclosures, refer to the Disclosure Section, located at the end of this report.
+= Analysts employed by non-U.S. affiliates are not registered with FINRA, may not be associated persons of the member and may not be subject to FINRA restrictions on communications with a subject company, public appearances and trading securities held by a research analyst account.
M
Idea
Contextualizing the AI Transceiver PCB Opportunity
To put the opportunity into perspective, we forecast the global AI transceiver PCB TAM to expand from approximately US$620mn in CY25 to ~US$3.8bn by CY28. For comparison, we estimate that Apple (covered by Erik Woodring) - currently the world's largest consumer of HDI PCBs - accounts for roughly US$3.0-3.5B of annual HDI PCB demand. On our estimates, the AI transceiver PCB market will grow from a niche, sub-US $1B segment today to a market comparable in size to Apple's HDI PCB demand by CY27, before surpassing it by CY28.
The significance of this comparison extends beyond the absolute market size. For years, Apple has been the primary driver of technology advancement, capacity investment, and profitability within the HDI PCB industry. We believe AI optical connectivity is emerging as the next major demand engine, creating a new growth vector for PCB suppliers and potentially reshaping the industry's competitive landscape.
Given the pace of market expansion, increasing technology requirements, and improving economics associated with next-generation transceiver PCBs, we believe AI transceiver PCBs are rapidly evolving into one of the most compelling structural growth opportunities within the global PCB sector.
Viewed from another angle, Prismark estimates the global HDI PCB market at approximately US$16.2bn. Based on our forecast of a ~US$3.8bn AI transceiver PCB market by CY28, AI optical connectivity alone could generate incremental demand equivalent to roughly 23% of the current global HDI market, underscoring the significance of this emerging growth driver for the PCB industry
In February 2026, our global team highlighted that the AI transceiver market is entering an 'exponential' growth phase, driven by scale-out, scale-up and even scaleacross in AI datacenters (report link: AI Transceivers: Growth Dominates Disruption). While CPO (co-packaged optics) remains a fundamental architectural shift and a legitimate long-term risk to pluggable transceivers, the impact on transceivers vendors and their supply chains is limited in the medium term, as large-scale adoption of CPO is unlikely before 2027-28, considering its manufacturing yield, thermal complexity, cost, ecosystem, and serviceability. Thus, our global team expects AI transceiver growth to dominate the disruption from CPO in the medium term, and that transceivers and CPO will coexist through the 3.2T transition expected in CY28.
Our Global team expects strong optical transceiver volumes in CY26-28: In May 2026, our global team raised (link) its CY26-28 AI transceiver shipments forecast from 53 / 71 / 80mn units to 73 / 141 / 158 M units, respectively, within which 29 / 79 / 87M are 1.6T optical transceivers, with 8mn 3.2T optical transceivers expected in CY28 ( Exhibit 1 ). This translates into a ~99% CAGR over CY25-28, creating a significant surge in demand for supply chain capacity. This signal a robust growth prospect not only for the optical transceivers vendors but also for the entire supply chain, including the PCB manufacturers. This is because within each optical transceiver module, there is 1 PCB, so it is a one-for-one opportunity for PCB manufacturers.
M
Exhibit 2: Our Global team raised forecasts for 800G and 1.6T optical transceiver shipments
| (mn units) New Estimates | 2026E | 2027E | 2028E |
|---|---|---|---|
| 800G | 44 | 63 | 64 |
| 1.6T | 29 | 79 | 87 |
| 3.2T | 0 | 0 | 8 |
| Total | 73 | 141 | 158 |
| Previous Estimates | 2026E | 2027E | 2028E |
| 800G | 34 | 48 | 54 |
| 1.6T | 19 | 24 | 27 |
| 3.2T | 0 | 0 | 5 |
| Total | 53 | 71 | 85 |
| Pct. of change | 2026E | 2027E | 2028E |
| 800G | 29% | 31% | 19% |
| 1.6T | 52% | 233% | 226% |
| 3.2T | -- | -- | 60% |
| Total | 38% | 98% | 86% |
Source: Company data, Morgan Stanley Research estimates.
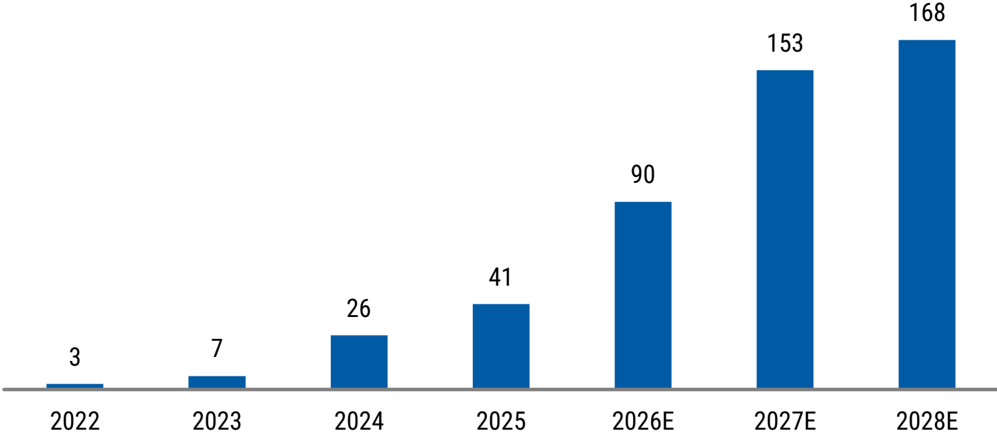
Exhibit 3: Our Global team estimates AI optical transceivers growing at ~60% CAGR from 2025-28E
We estimate AI transceivers growing at 60% CAGR from 2025-28E
Source: Morgan Stanley Research estimates.
M
Aside from volume growth, optical transceiver PCB is also seeing content growth... Our industry checks suggest optical transceiver PCBs will see content growth mainly coming from three aspects.
- Upgrades in CCL material (M6 to M8): The migration from 400G to 800G and 1.6T transceivers is driving increased adoption of higher-specification CCL materials. Whereas 400G modules generally utilized M6-grade CCL, nextgeneration transceivers increasingly require M7- or M8-grade CCL to meet more demanding signal integrity requirements, supporting higher PCB ASPs.
- Increased layer count (10L to 16L): Increasing PCB layer counts represent another tailwind for ASP growth. Layer requirements rise from 10-12 layers in 400G transceivers to 12-14 layers in 800G and 14-16 layers in 1.6T modules, reflecting greater design complexity and supporting higher PCB ASPs.
- More complex manufacturing process (HDI to mSAP): The adoption of more advanced fabrication technologies is another driver of PCB ASP expansion. While 400G transceivers typically rely on HDI (high density interconnect) processes, next-generation 800G and 1.6T modules increasingly require mSAP (modified semi-additive process), reflecting higher design complexity and supporting higher ASPs.
The combination of the three drivers mentioned above is driving a strong growth of the overall PCB market for optical transceiver modules. The reason why mSAP is required is that it saves space by allowing denser conducting path layouts, which makes it the perfect material for optical transceivers. This is commonly found in compact devices, such as smartphone mainboards and smartphone camera modules. Apple is one of the first companies to start using mSAP technology in its smartphone PCB, going back to 2017, for the iPhone 8/X generation. Which is why today, a lot of the optical transceiver modules makers are also companies that have been HDI/SLP PCB suppliers for Apple iPhone, including Unimicron, ZDT, and Compeq.
...why is why we estimate PCB ASP per transceiver module will rise from US$5-15 for a 400G transceiver to US$20-30 for a 1.6T transceiver. We expect the transition from 400G to 1.6T transceivers to drive a substantial increase in PCB content and complexity. PCB designs are likely to upgrade from 10- to 12-layer HDI structures with 2-3 lamination cycles and M6-grade CCL to 14- to 16-layer mSAP-based architectures with 6-10 mSAP layers and M8-grade CCL. Consequently, we estimate PCB ASPs could rise ~2.5x, from approximately US$10 to US$25 per unit. Moreover, the higher technical barriers and valueadd should drive gross margins from 20-30% to 40-50%+, approaching those of ABF substrates. The combination of strong volume growth and rising PCB content per transceiver is expected to drive AI transceiver PCB TAM growth well ahead of underlying module shipments. We estimate the global AI transceiver PCB market will grow at an 83% CAGR over CY25-28E, versus a 60% CAGR growth in AI transceiver unit volumes, reflecting increasing PCB complexity and higher content per module as the industry migrates to 800G and 1.6T transceivers.
Simply put, as the AI transceiver speeds migrate from 400G to 1.6T or 3.2T, the electrical signals needs to travel at much higher speeds, and the PCB traces start to make a difference, where signal loss, reflections, crosstalk, and timing variations become major challenges. To preserve signal integrity, the PCB needs to be designed with lower-loss
M
laminate materials are required (M8 grade CCL), tighter impedance control, more sophisticated routing, optimized vias, etc. As a result, each generation of faster optical transceivers increases the technical complexity and value-added content of the PCB, creating a structural tailwind for advanced PCB suppliers with expertise in mSAP capability.
Exhibit 4: Optical transceiver PCB specs
| 400G | 800G | 1.6T | |
|---|---|---|---|
| Layers | 10-12L 2-3 press HDI | 12-14L, 4-8L mSAP or HDI | 14-16L 6-10L mSAP |
| Process | HDI | HDI or mSAP | mSAP |
| CCL Spec | M6 | M7(LDK1) / M7+ (LDK2) | M7+ / M8 (LDK2) |
| ASP (US$) | $5-15 | $15-25 | $20-30 |
| GMEst. | 20-30% | 30-40% | 40-50%+ |
| Suppliers | Unmicron, Shennan, WUS, other smaller suppliers. | Unimicron, Shennan, Zhen Ding, WUS, Compeq, etc. | Unimicron, Shennan, Zhen Ding, Compeq, WUS, etc. |
Source: Morgan Stanley Research.
Exhibit 5: We estimate Global AI Transceiver PCB TAM to grow at 83% CAGR from 2025-28E
AI transceiver PCB TAM is growing at 83% CAR from 2025-28E (US$ M)
Source: Morgan Stanley Research estimates.
M
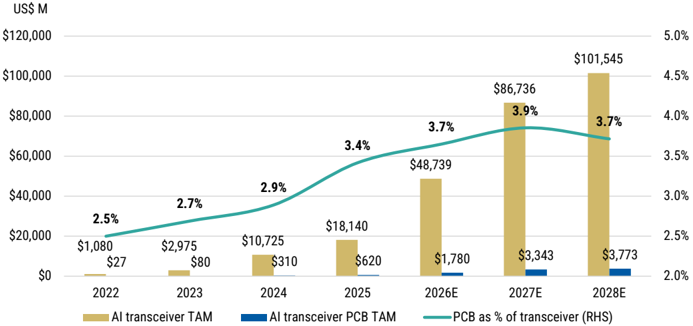
Exhibit 6: TAM comparison: AI transceiver vs. AI transceiver PCB
Source: Morgan Stanley Research estimates.
Incumbents like Unimicron and Shennan should continue to do well in the optical transceiver market, but we see ZDT as being aggressive and gaining share: We believe incumbent optical transceiver PCB suppliers, including Shennan and Unimicron, are well positioned to benefit from both volume growth and rising PCB content per transceiver over CY26-28. At the same time, the expanding addressable market is creating opportunities for new entrants, as existing industry capacity appears insufficient to meet anticipated demand.
Our channel checks indicate that ZDT and Compeq (2313.TW, not covered) are actively expanding capacity to support the ramp of 800G and 1.6T optical transceiver PCBs. We believe ZDT's share gains began with the initial ramp-up of 800G transceivers in CY25, and we estimate its supply share increased to approximately 7.5% in CY25, with the potential to reach ~20% by CY28. In the 1.6T segment, we estimate that ZDT entered the market with roughly 5% share in CY25 and could expand its position to ~25% by CY28E.
We expect ZDT's share gains to accelerate with the industry's migration toward 1.6T transceivers and beyond, where PCB technology requirements become increasingly demanding. Specifically, 1.6T+ transceiver PCBs are expected to require mSAP manufacturing processes, raising both technical barriers and qualification requirements. We believe ZDT is particularly well positioned to capitalize on this transition, given its extensive experience with mSAP technology, developed and refined through its participation in Apple's iPhone mainboard supply chain since the adoption of mSAP-based SLP architectures in 2017.
M
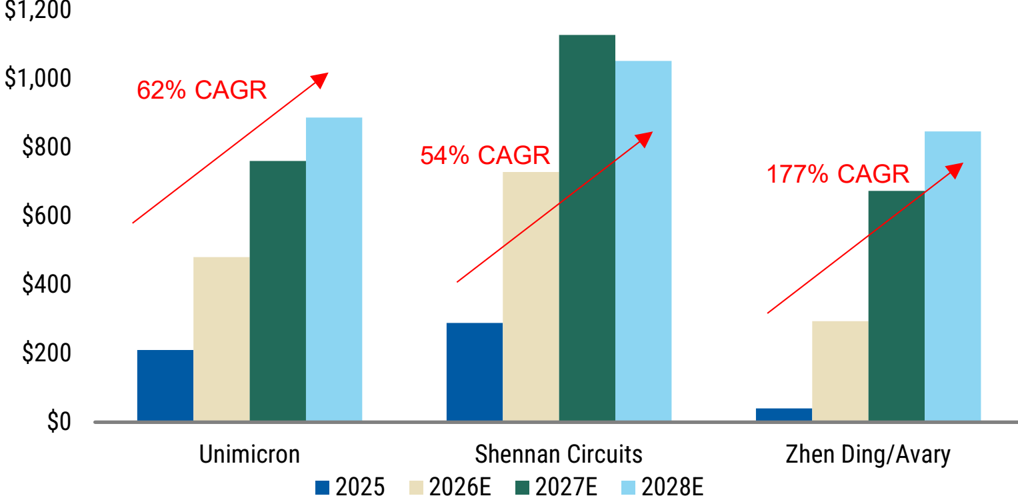
Exhibit 7: AI transceiver PCB value contribution to suppliers - we expect suppliers to see 50-176% CAGR over CY25-28E
AI Transceiver PCB value by supplier (US$M)
Source: Morgan Stanley Research estimates.
MSe vs. Consensus
Our 2026-28 revenue estimates are 1%, 2% and -3% different from Consensus, while our net income estimates are 0%, 3% and 4% higher than Consensus. We think the variance comes from our incorporation of higher AI transceiver PCB supply share assumptions for ZDT at 17%/20%/22% for 2026/2027/2028. The stock has rallied ~145% since April 1, vs. TAIEX +26% over the same period, driven primarily by the progress of its ABF substrate business and its potential share gains in the transceiver PCB market. Our global team raised its AI transceiver volume forecasts on May 15; thus, we are adjusting our model for ZDT accordingly to reflect the transceiver volume higher estimates.
Although our estimates are not materially above Street expectations, we see scope for further upward revisions as AI demand continues to exceed expectations. We believe technological leadership in mSAP processes, financial capacity to support aggressive expansion, and a willingness to invest ahead of demand will be key differentiators. On these metrics, ZDT appears well positioned to capture outsized share gains as the AI transceiver PCB market develops.
Exhibit 8: Zhen Ding: MSe vs. Consensus
| Zhen Ding | MSe | MSe | MSe | Consensus | Consensus | Consensus | Variance | Variance | Variance |
|---|---|---|---|---|---|---|---|---|---|
| Zhen Ding | 2026 | 2027 | 2028 | 2026 | 2027 | 2028 | 2026 | 2027 | 2028 |
| Revenue | 226,287 | 291,591 | 337,349 | 223,059 | 285,120 | 346,952 | 1% | 2% | -3% |
| GM | 24.4% | 26.7% | 28.8% | 23.8% | 25.6% | 26.9% | 1% | 1% | 2% |
| OpM | 11.5% | 14.9% | 17.9% | 11.2% | 14.3% | 16.2% | 0% | 1% | 2% |
| Net income | 15,470 | 25,909 | 35,713 | 15,413 | 25,150 | 34,349 | 0% | 3% | 4% |
| EPS | 14.46 | 24.21 | 33.37 | 14.40 | 23.50 | 32.10 | 0% | 3% | 4% |
Source: Visible Alpha, Morgan Stanley Research estimates.
M
Our 2026-28 revenue estimates are 2%, 4% and 8% above Consensus, while our net income estimates are 20%, 17% and 8% below Consensus. We think the variance comes from our lower price hikes assumptions for its ABF substrate business compared to the Street's, which resulted in lower margins and profits. We are still of the view that price hikes this year for ABF substrates are primarily to reflect the raw material shortages and cost increases, but heading into 2027, the pricing upsides will be driven by undersupply of substrate capacity itself.
Exhibit 9: Unimicron: MSe vs. Consensus
| Unimicron | MSe | MSe | MSe | Consensus | Consensus | Consensus | Variance | Variance | Variance |
|---|---|---|---|---|---|---|---|---|---|
| Unimicron | 2026 | 2027 | 2028 | 2026 | 2027 | 2028 | 2026 | 2027 | 2028 |
| Revenue | 184,777 | 262,464 | 354,693 | 181,665 | 252,649 | 328,690 | 2% | 4% | 8% |
| GM | 20.0% | 26.2% | 34.1% | 22.7% | 31.3% | 35.3% | -3% | -5% | -1% |
| OpM | 10.4% | 18.6% | 27.9% | 13.7% | 23.4% | 27.9% | -3% | -5% | 0% |
| Net income | 18,220 | 38,875 | 78,482 | 22,804 | 47,008 | 72,397 | -20% | -17% | 8% |
| EPS | 11.84 | 25.26 | 50.99 | 14.82 | 30.54 | 47.04 | -20% | -17% | 8% |
Source: Visible Alpha, Morgan Stanley Research estimates.
Our 2026-28 revenue estimates are 4%, 7% and 13% above Consensus, while our net income estimates are 5% below Consensus for 2026 and 5%/15% above Consensus for 2027/2028. We think the variance comes from our higher assumptions for revenue contribution and profitability from the AI transceiver business, for which Shennan is a share leader. It is primarily valuation that keeps us EW on Shennan.
Exhibit 10: Shennan Circuits: MSe vs. Consensus

| Shennan Circuits | MSe | MSe | MSe | Consensus | Consensus | Consensus | Variance | Variance | Variance |
|---|---|---|---|---|---|---|---|---|---|
| Shennan Circuits | 2026 | 2027 | 2028 | 2026 | 2027 | 2028 | 2026 | 2027 | 2028 |
| Revenue | 32,234 | 42,154 | 53,710 | 30,853 | 39,416 | 47,667 | 4% | 7% | 13% |
| GM | 29.9% | 32.1% | 33.1% | 30.9% | 32.2% | 32.9% | -3% | -1% | 1% |
| OpM | 18.0% | 20.7% | 22.3% | 18.4% | 20.2% | 21.3% | -2% | 3% | 5% |
| Net income | 4,785 | 7,493 | 10,496 | 5,020 | 7,138 | 9,150 | -5% | 5% | 15% |
| EPS | 7.18 | 11.24 | 15.74 | 7.53 | 10.71 | 13.72 | -5% | 5% | 15% |
Source: Visible Alpha, Morgan Stanley Research estimates.
Risks to our call
- Weaker demand for general and AI servers;
- Meaningful capacity expansion plans;
- Faster-than-expected adoption of CPO.
M
ZDT: Estimate Changes
We raise our CY2026, 2027 and 2028 EPS estimates by 5%, 15%, and 17%, respectively. Our earnings increases are driven by our raised demand, pricing, and margin assumptions on AI optical transceiver PCBs.
Exhibit 11: Estimate Changes
| 2026E | 2026E | 2026E | 2027E | 2027E | 2027E | 2028E | 2028E | 2028E | |
|---|---|---|---|---|---|---|---|---|---|
| NT$mn | New | Old | Variance | New | Old | Variance | New | Old | Variance |
| Net sales | 226,287 | 220,957 | 2% | 291,591 | 272,268 | 7% | 337,349 | 312,343 | 8% |
| COGS | -170,996 | -167,319 | 2% | -213,614 | -201,052 | 6% | -240,162 | -224,876 | 7% |
| Gross profit | 55,291 | 53,638 | 3% | 77,976 | 71,216 | 9% | 97,187 | 87,467 | 11% |
| Operating expenses | -29,376 | -29,024 | 1% | -34,573 | -33,545 | 3% | -36,776 | -36,126 | 2% |
| Operating income | 25,914 | 24,614 | 5% | 43,403 | 37,671 | 15% | 60,411 | 51,341 | 18% |
| Non-operating income | 1,039 | 1,039 | 0% | 1,406 | 1,406 | 0% | 1,406 | 1,406 | 0% |
| Pre-tax income | 26,953 | 25,652 | 5% | 44,809 | 39,077 | 15% | 61,817 | 52,747 | 17% |
| Net income | 15,470 | 14,729 | 5% | 25,909 | 22,596 | 15% | 35,713 | 30,487 | 17% |
| EPS (NT$) | 14.46 | 13.76 | 5% | 24.21 | 21.11 | 15% | 33.37 | 28.49 | 17% |
| Margins (%) | ppt | ppt | ppt | ||||||
| Gross margin | 24.4% | 24.3% | 0.2 | 26.7% | 26.2% | 0.6 | 28.8% | 28.0% | 0.8 |
| Operating margin | 11.5% | 11.1% | 0.3 | 14.9% | 13.8% | 1.0 | 17.9% | 16.4% | 1.5 |
| Pre-tax margin | 11.9% | 11.6% | 0.3 | 15.4% | 14.4% | 1.0 | 18.3% | 16.9% | 1.4 |
| Net margin | 6.8% | 6.7% | 0.2 | 8.9% | 8.3% | 0.6 | 10.6% | 9.8% | 0.8 |
Source: Morgan Stanley Research (E) estimates.
Price Target and Valuation Methodology
Our base-case value/price target rises ~17% to NT$666: It is derived from our multistage residual income (RI) model. We use the company's beginning equity plus the present value of all expected residual income of earnings in excess of the cost of capital.
We use the company's beginning equity plus the present value of all expected residual income of earnings in excess of the cost of capital. The RI is positive when ROAE is above the cost of capital and negative when it is below the cost of capital. We assume a cost of equity of 10%, a medium-term growth rate of 15% and a terminal growth rate of 3% (all unchanged).
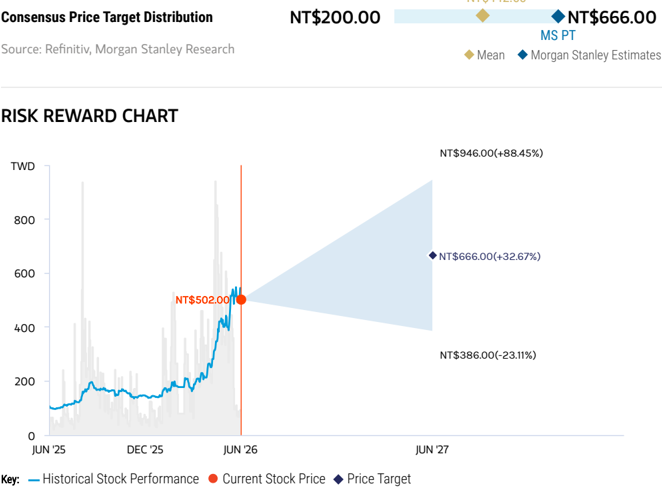
Our bull- and bear-case values also rises by similar magnitudes to NT$946 and NT $386, respectively.
Exhibit 12: Residual income (RI) model
| NT$ mn | 2026E | 2027E | 2028E | 2029E | 2030E | 2031E | 2032E | 2033E | 2034E | 2035E | 2036E | |
|---|---|---|---|---|---|---|---|---|---|---|---|---|
| Total Equity | 182,543 | 201,499 | 225,567 | 236,401 | 248,860 | 263,189 | 279,666 | 298,615 | 320,407 | 345,467 | 374,286 | |
| Core Net Profit | 15,470 | 25,909 | 35,713 | 41,070 | 47,230 | 54,315 | 62,462 | 71,831 | 82,606 | 94,997 | 109,246 | |
| Return on Equity | 9.1% | 14.2% | 17.7% | 18.2% | 20.0% | 21.8% | 23.7% | 25.7% | 27.7% | 29.6% | 31.6% | |
| Beta (Last 60 Mths) | 1.20 | |||||||||||
| Equity Risk Premium (Rm-Rf) | 6% | |||||||||||
| Risk Free Rate (Rf) | 3% | |||||||||||
| Cost of Equity | 10% | |||||||||||
| Terminal Growth Rate | 3% | |||||||||||
| Continuing Value Spread | -2% | |||||||||||
| Medium-term growth rate | 15.0% | |||||||||||
| Residual Income | -1,089 | 8,202 | 16,167 | 19,190 | 24,299 | 30,175 | 36,933 | 44,704 | 53,640 | 63,917 | 75,736 | |
| Spread | -1% | 4% | 8% | 9% | 10% | 12% | 14% | 16% | 18% | 20% | 22% | |
| Beginning Equity Capital | 182,543 | |||||||||||
| PV of Forecast Period | 165,498 | |||||||||||
| PV of Continuing Value | 364,731 | |||||||||||
| Equity Value | 712,772 | |||||||||||
| No. of Shares | 1,070 | |||||||||||
| Projected Price (EoY) | 666.0 | |||||||||||
| Implied 2027 P/E (x) | 27.5 | |||||||||||
| Implied 2028 P/E (x) | 20.0 |
Source: Morgan Stanley Research estimates.
M
Exhibit 13: ZDT P/E
Source: TEJ, Morgan Stanley Research estimates.
M
Financials
Exhibit 14: Quarterly Estimates
| NT$ mn | 1Q25 | 2Q25 | 3Q25 | 4Q25 | 1Q26 | 2Q26E | 3Q26E | 4Q26E | 2025 | 2026E | 2027E | 2028E |
|---|---|---|---|---|---|---|---|---|---|---|---|---|
| Sales | 40,082 | 38,203 | 47,366 | 56,870 | 40,728 | 48,174 | 64,781 | 72,604 | 182,522 | 226,287 | 291,591 | 337,349 |
| COGS | -34,197 | -31,193 | -36,956 | -44,040 | -31,917 | -37,150 | -48,224 | -53,706 | -146,385 | -170,996 | -213,614 | -240,162 |
| Gross profit | 5,885 | 7,011 | 10,410 | 12,830 | 8,812 | 11,024 | 16,556 | 18,899 | 36,136 | 55,291 | 77,976 | 97,187 |
| Operating expenses | -4,829 | -4,586 | -5,880 | -6,909 | -6,308 | -7,165 | -7,801 | -8,103 | -22,205 | -29,376 | -34,573 | -36,776 |
| - Promotion | -486 | -493 | -630 | -744 | -616 | -692 | -838 | -845 | -2,352 | -2,990 | -3,781 | -4,152 |
| - ADM | -1,781 | -1,483 | -2,270 | -2,512 | -2,147 | -2,489 | -2,677 | -2,791 | -8,046 | -10,104 | -12,171 | -13,367 |
| - R&D | -2,563 | -2,611 | -2,981 | -3,653 | -3,545 | -3,984 | -4,286 | -4,467 | -11,807 | -16,282 | -18,621 | -19,256 |
| Operating profit | 1,056 | 2,425 | 4,530 | 5,921 | 2,503 | 3,859 | 8,756 | 10,796 | 13,932 | 25,914 | 43,403 | 60,411 |
| Non-operating income | 401 | -153 | 131 | -248 | -103 | 314 | 414 | 414 | 131 | 1,039 | 1,406 | 1,406 |
| Interest income | 119 | 91 | 49 | 95 | 64 | 64 | 64 | 64 | 355 | 256 | 256 | 256 |
| Investment income | -97 | 203 | 242 | 53 | 2 | 100 | 200 | 200 | 401 | 502 | 550 | 550 |
| Disposal of investment | 0 | 0 | 0 | 0 | 0 | 0 | 0 | 0 | 0 | 0 | 0 | 0 |
| Disposal of fixed assets | 16 | 58 | -258 | -102 | 0 | 0 | 0 | 0 | -286 | 0 | 0 | 0 |
| Exchange gain | 103 | -103 | 0 | 0 | -930 | 0 | 0 | 0 | 0 | -930 | 0 | 0 |
| Other | 259 | -401 | 98 | -294 | 761 | 150 | 150 | 150 | -338 | 1,211 | 600 | 600 |
| Pre-tax profit | 1,457 | 2,272 | 4,661 | 5,673 | 2,400 | 4,173 | 9,170 | 11,210 | 14,063 | 26,953 | 44,809 | 61,817 |
| Income tax | -431 | -885 | -1,072 | -1,070 | -353 | -918 | -1,724 | -1,345 | -3,458 | -4,340 | -6,944 | -9,605 |
| Net profit | 632 | 605 | 2,392 | 3,161 | 1,426 | 2,121 | 4,954 | 6,970 | 6,791 | 15,470 | 25,909 | 35,713 |
| EPS (NT$) | 0.66 | 0.63 | 2.46 | 3.22 | 1.33 | 1.98 | 4.63 | 6.51 | 6.91 | 14.46 | 24.21 | 33.37 |
| Margins | ||||||||||||
| Gross margin | 15% | 18% | 22% | 23% | 22% | 23% | 26% | 26% | 20% | 24% | 27% | 29% |
| Operating margin | 3% | 6% | 10% | 10% | 6% | 8% | 14% | 15% | 8% | 11% | 15% | 18% |
| Pre-tax margin | 4% | 6% | 10% | 10% | 6% | 9% | 14% | 15% | 8% | 12% | 15% | 18% |
| Net margin | 2% | 2% | 5% | 6% | 4% | 4% | 8% | 10% | 4% | 7% | 9% | 11% |
| QoQ Growth | ||||||||||||
| Sales | -29% | -5% | 24% | 20% | -28% | 18% | 34% | 12% | ||||
| Gross profit | -49% | 19% | 48% | 23% | -31% | 25% | 50% | 14% | ||||
| Operating profit | -81% | 130% | 87% | 31% | -58% | 54% | 127% | 23% | ||||
| Pre-tax profit | -81% | 56% | 105% | 22% | -58% | 74% | 120% | 22% | ||||
| Net profit | -86% | -4% | 295% | 32% | -55% | 49% | 134% | 41% | ||||
| YoY Growth | ||||||||||||
| Sales | 23% | 18% | -6% | 1% | 2% | 26% | 37% | 28% | 6% | 24% | 29% | 16% |
| Gross profit | 10% | 65% | -9% | 12% | 50% | 57% | 59% | 47% | 11% | 53% | 41% | 25% |
| Operating profit | 42% | -477% | -24% | 7% | 137% | 59% | 93% | 82% | 20% | 86% | 67% | 39% |
| Pre-tax profit | -3% | 346% | -12% | -27% | 65% | 84% | 97% | 98% | -7% | 92% | 66% | 38% |
| Net profit | -35% | 25% | -29% | -28% | 125% | 251% | 107% | 120% | -26% | 128% | 67% | 38% |
Source: Company data, Morgan Stanley Research (E) estimates.
M
Exhibit 15: Consolidated Financial Summary
Income Statement
| NT$ mn | 2025 | 2026E | 2027E | 2028E |
|---|---|---|---|---|
| Net sales | 182,522 | 226,287 | 291,591 | 337,349 |
| COGS | -146,385 | -170,996 | -213,614 | -240,162 |
| Gross profit | 36,136 | 55,291 | 77,976 | 97,187 |
| Operating expenses | -22,205 | -29,376 | -34,573 | -36,776 |
| - Promotion | -2,352 | -2,990 | -3,781 | -4,152 |
| - ADM | -8,046 | -10,104 | -12,171 | -13,367 |
| - R&D | -11,807 | -16,282 | -18,621 | -19,256 |
| Operating income | 13,932 | 25,914 | 43,403 | 60,411 |
| Non-operating income | 131 | 1,039 | 1,406 | 1,406 |
| Interest income | 355 | 256 | 256 | 256 |
| Investment income | 401 | 502 | 550 | 550 |
| Disposal of investment | 0 | 0 | 0 | 0 |
| Disposal of fixed assets | -286 | 0 | 0 | 0 |
| Exchange gain | 0 | -930 | 0 | 0 |
| Other | -338 | 1,211 | 600 | 600 |
| Pre-tax income | 14,063 | 26,953 | 44,809 | 61,817 |
| Income tax | -7,272 | -11,483 | -18,900 | -26,104 |
| Net income | 6,791 | 15,470 | 25,909 | 35,713 |
| EPS (NT$) | 6.91 | 14.46 | 24.21 | 33.37 |
Balance Sheet
| NT$ mn | 2025 | 2026E | 2027E | 2028E |
|---|---|---|---|---|
| Cash | 71,116 | 61,840 | 73,189 | 88,287 |
| Mkt securities | 36 | 36 | 36 | 36 |
| Accounts/Notes receivables | 31,412 | 38,944 | 50,183 | 58,058 |
| Inventory | 19,616 | 22,914 | 28,625 | 32,183 |
| Other current assets | 5,460 | 5,460 | 5,460 | 5,460 |
| Current Assets | 127,641 | 129,195 | 157,494 | 184,024 |
| Long-term investments | 9,866 | 10,367 | 10,917 | 11,467 |
| Fixed assets | 123,737 | 145,693 | 148,605 | 152,383 |
| Other assets | 18,799 | 18,799 | 18,799 | 18,799 |
| Total Assets | 280,043 | 304,054 | 335,815 | 366,673 |
| S/T borrowings | 23,839 | 23,839 | 23,839 | 23,839 |
| AP/NP | 23,501 | 27,452 | 34,295 | 38,557 |
| Other ST liabilities | 25,481 | 33,710 | 39,674 | 42,202 |
| Other liabilities | 21,151 | 21,151 | 21,151 | 21,151 |
| L/T debt | 15,359 | 15,359 | 15,359 | 15,359 |
| Total Liabilities | 109,330 | 121,511 | 134,316 | 141,106 |
| Common shares | 10,706 | 10,706 | 10,706 | 10,706 |
| Capital Collection | 0 | 0 | 0 | 0 |
| APIC | 52,902 | 52,902 | 52,902 | 52,902 |
| Retained earnings | 61,549 | 73,328 | 92,283 | 116,351 |
| Treasury Stock | -52 | 0 | 0 | 0 |
| Other shareholders' equity | 45607 | 45607 | 45607 | 45607 |
| Shareholders' equity | 170,713 | 182,543 | 201,499 | 225,567 |
| Total Liab./Shrhldr's Equity | 280,043 | 304,054 | 335,815 | 366,673 |
Source: Company data, Morgan Stanley Research (E) estimates.
Cash Flow Statement
| NT$ mn | 2025 | 2026E | 2027E | 2028E |
|---|---|---|---|---|
| Cashflow from operations | 27,617 | 24,364 | 28,302 | 36,742 |
| Net Profits | 10,605 | 15,470 | 25,909 | 35,713 |
| Depreciation | 18,552 | 8,044 | 7,088 | 6,222 |
| Equity investment losses (income) | 0 | -502 | -550 | -550 |
| Other adjustments | -1,541 | 1,351 | -4,145 | -4,643 |
| Cashflow from investing | -31,960 | -30,000 | -10,000 | -10,000 |
| (Purchases) sale of FA (capex) | -32,673 | -30,000 | -10,000 | -10,000 |
| (Purchases) sale of L/T investment | 342 | 0 | 0 | 0 |
| (Purchases) sale of S/T investment | -601 | 0 | 0 | 0 |
| Other adjustments | 972 | 0 | 0 | 0 |
| Cashflow from financing | -1,865 | -3,640 | -6,953 | -11,645 |
| Increase in L/T debt | 6,344 | 0 | 0 | 0 |
| Increase in S/T debt | 2,191 | 0 | 0 | 0 |
| Issuance of stock | 730 | 0 | 0 | 0 |
| Cash dividends | -7,221 | -3,692 | -6,953 | -11,645 |
| Dir.& Emp. Bonus | 0 | 0 | 0 | 0 |
| Changes in Treasury Stocks | 288 | 52 | 0 | 0 |
| Other adjustments | -4,196 | 0 | 0 | 0 |
| Exchange rate adjustment | -2,177 | 0 | 0 | 0 |
| Net change in cash | -8,386 | -9,276 | 11,349 | 15,097 |
Financial Ratios
| 2025 | 2026E | 2027E | 2028E | |
|---|---|---|---|---|
| Margins | ||||
| Gross margin | 19.8% | 24.4% | 26.7% | 28.8% |
| Operating margin | 7.6% | 11.5% | 14.9% | 17.9% |
| Pretax margin | 7.7% | 11.9% | 15.4% | 18.3% |
| Net margin | 3.7% | 6.8% | 8.9% | 10.6% |
| YoY growth | ||||
| Sales | 6.3% | 24.0% | 28.9% | 15.7% |
| Operating profits | 20.2% | 86.0% | 67.5% | 39.2% |
| Pretax profits | -6.5% | 91.7% | 66.2% | 38.0% |
| Net profits | -26.0% | 127.8% | 67.5% | 37.8% |
| EPS | -28.6% | 109.3% | 67.5% | 37.8% |
| Net Debt/Equity (Net of mkt secs.) | -19% | -12% | -17% | -22% |
| Net Debt/Equity | -19% | -12% | -17% | -22% |
| Liabilities/Equity | 64% | 67% | 67% | 63% |
| Liabilities/Assets | 39% | 40% | 40% | 38% |
| ROAE | 4.2% | 8.8% | 13.5% | 16.7% |
| ROAA | 2.5% | 5.3% | 8.1% | 10.2% |
| AR/NR Turnover (days) | 62 | 57 | 56 | 59 |
| AP/NP Turnover (days) | 56 | 54 | 53 | 55 |
| Inventory Turnover (days) | 47 | 45 | 44 | 46 |
| Cash conversion cycle (days) | 52 | 48 | 47 | 49 |
M
Unimicron: Estimate Changes
We raise our 2026, 2027 and 2028 EPS estimates by 2%, 5% and 4%, respectively, primarily driven by higher assumptions for AI optical transceiver PCBs.
Exhibit 16: Estimate Changes
| Year to Dec. 31 (NT$m) | 2026E | 2026E | 2026E | 2027E | 2027E | 2027E | 2028E | 2028E | 2028E |
|---|---|---|---|---|---|---|---|---|---|
| New | Old | %diff | New | Old | %diff | New | Old | %diff | |
| P&L Summary | |||||||||
| Net sales | 184,777 | 186,189 | -1% | 262,464 | 260,849 | 1% | 354,693 | 352,349 | 1% |
| COGS | (147,780) | (149,522) | (193,803) | (194,590) | (233,768) | (235,051) | |||
| Gross profit | 36,997 | 36,667 | 1% | 68,660 | 66,260 | 4% | 120,924 | 117,299 | 3% |
| Operating expenses | (17,713) | (17,794) | (19,966) | (19,966) | (21,971) | (22,086) | |||
| Operating income | 19,284 | 18,872 | 2% | 48,695 | 46,293 | 5% | 98,953 | 95,212 | 4% |
| Non-operating income | 5,027 | 5,027 | 2,180 | 2,180 | 2,180 | 2,180 | |||
| Pre-tax income | 24,311 | 23,899 | 2% | 50,874 | 48,473 | 5% | 101,133 | 97,392 | 4% |
| Net income | 18,220 | 17,879 | 2% | 38,875 | 36,979 | 5% | 78,482 | 75,534 | 4% |
| Diluted EPS (NT$) | 11.84 | 11.62 | 2% | 25.26 | 24.03 | 5% | 50.99 | 49.08 | 4% |
| Margins | ppt | ppt | ppt | ||||||
| Gross margin | 20.0% | 19.7% | 0.3 | 26.2% | 25.4% | 0.8 | 34.1% | 33.3% | 0.8 |
| Operating margin | 10.4% | 10.1% | 0.3 | 18.6% | 17.7% | 0.8 | 27.9% | 27.0% | 0.9 |
| Pretax margin | 13.2% | 12.8% | 0.3 | 19.4% | 18.6% | 0.8 | 28.5% | 27.6% | 0.9 |
| Net margin | 9.9% | 9.6% | 0.3 | 14.8% | 14.2% | 0.6 | 22.1% | 21.4% | 0.7 |
Source: Morgan Stanley Research (E) estimates.
Price Target and Valuation Methodology
Our 12-month price target increases ~5% to NT$1,285 (from NT$1,225), driven by our increased earnings estimates for CY26-28e: We believe the company's earnings have returned to a growth track from 2026 onwards and will see stronger earnings growth in 2027, driven by the high-end ABF substrate market's reversion to undersupply and Unimicron's dominant supply share in AI ASICs and also server CPUs, which puts it in a favorable position to benefit from rising AI investments.
We believe the overall ABF substrate market bottomed in 2H24, and growth will accelerate from 2H26 onwards with the ramp of multiple next-generation, large body size ABF substrates for new server GPUs, CPUs, ASICs, and networking chips. New technologies, such as embedded passives and Intel's EMIB-T, will also increase the manufacturing complexity of the package substrates, which adds to the under-capacity as usable output decreases.
Similar to our analysis of other tech hardware companies within our coverage, we use a residual income (RI) valuation model to value Unimicron - we think it derives the most accurate value of the firm as it takes into account cost of equity. Key assumptions are all unchanged, including:
- Cost of equity of 9.2%;
- Risk-free rate of 1% (10-year Taiwan government note yield);
- Equity risk premium of 8.7%;
- Beta of 1.0;
- Medium-term growth rate of 15%
- Terminal growth rate of 3% (similar to the rest of the companies under our tech hardware coverage).
M
Our bull and bear case values increase by similar magnitudes, to NT$2,190 and NT $430, respectively.
Exhibit 17: Unimicron residual income (RI) model
| 2027E | 2028E | 2029E | 2030E | 2031E | 2032E | 2033E | 2034E | 2035E | 2036E | 2037E | |
|---|---|---|---|---|---|---|---|---|---|---|---|
| Total Equity | 152,160 | 212,630 | 246,731 | 285,946 | 331,044 | 382,906 | 442,548 | 511,136 | 590,012 | 680,719 | 756,223 |
| Net Profit | 38,875 | 78,482 | 90,254 | 103,792 | 119,361 | 137,265 | 157,855 | 181,533 | 208,763 | 240,077 | 247,280 |
| Return on Equity | 28.4% | 43.0% | 39.3% | 39.0% | 38.7% | 38.5% | 38.2% | 38.1% | 37.9% | 37.8% | 34.4% |
| Beta | 1.0 | 1.0 | 1.0 | 1.0 | 1.0 | 1.0 | 1.0 | 1.0 | 1.0 | 1.0 | 1.0 |
| Equity Risk Premium (Rm-Rf) | 8.7% | 8.7% | 8.7% | 8.7% | 8.7% | 8.7% | 8.7% | 8.7% | 8.7% | 8.7% | 8.7% |
| Risk Free Rate (Rf) | 1.0% | 1.0% | 1.0% | 1.0% | 1.0% | 1.0% | 1.0% | 1.0% | 1.0% | 1.0% | 1.0% |
| Cost of Equity | 9.2% | 9.2% | 9.2% | 9.2% | 9.2% | 9.2% | 9.2% | 9.2% | 9.2% | 9.2% | 9.2% |
| Residual Income | 23,387 | 51,508 | 64,040 | 73,507 | 84,394 | 96,912 | 111,308 | 127,863 | 146,900 | 168,792 | 171,813 |
| Spread | 19.2% | 33.9% | 30.1% | 29.8% | 29.5% | 29.3% | 29.1% | 28.9% | 28.7% | 28.6% | 25.2% |
| Beginning Equity Capital | 152,160 | ||||||||||
| PV of Forecast Period | 634,902 | ||||||||||
| PV of Continuing Value | 1,190,556 | ||||||||||
| Equity Value | 1,977,619 | ||||||||||
| No. of Shares | 1,539 | ||||||||||
| Projected Price | 1,285.0 |
Source: Morgan Stanley Research estimates.
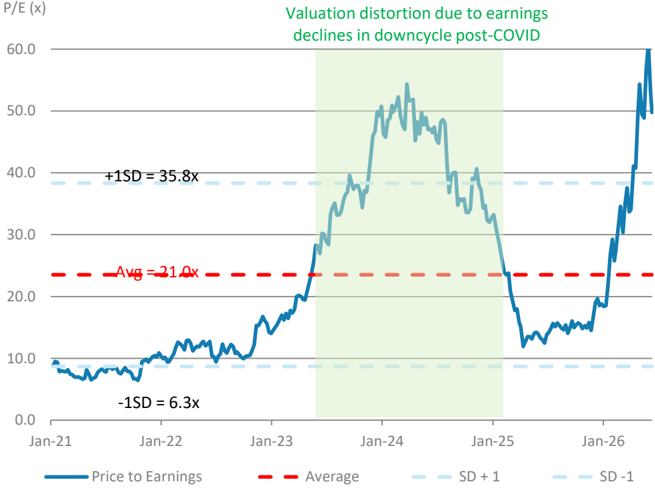
Exhibit 18: Unimicron P/E
Source: TEJ, Morgan Stanley Research estimates.
M
Financials
Exhibit 19: Quarterly Estimates
| NT$ mn | 1Q25 | 2Q25 | 3Q25 | 4Q25 | 1Q26E | 2Q26E | 3Q26E | 4Q26E | 2025 | 2026E | 2027E | 2028E |
|---|---|---|---|---|---|---|---|---|---|---|---|---|
| Sales | 30,090 | 32,466 | 33,994 | 34,691 | 37,446 | 43,621 | 51,100 | 52,609 | 131,241 | 184,777 | 262,464 | 354,693 |
| Cost of goods sold | -26,063 | -28,221 | -29,446 | -29,219 | -30,720 | -35,125 | -40,558 | -41,377 | -112,949 | -147,780 | -193,803 | -233,768 |
| Gross profit | 4,026 | 4,246 | 4,549 | 5,472 | 6,726 | 8,497 | 10,542 | 11,232 | 18,292 | 36,997 | 68,660 | 120,924 |
| Operating expenses | -2,759 | -2,736 | -3,016 | -3,106 | -3,969 | -4,331 | -4,696 | -4,717 | -11,618 | -17,713 | -19,966 | -21,971 |
| Operating profit | 1,267 | 1,509 | 1,533 | 2,366 | 2,757 | 4,166 | 5,846 | 6,516 | 6,674 | 19,284 | 48,695 | 98,953 |
| Interest income (loss) | 103 | 62 | -7 | 25 | 25 | 25 | 25 | 25 | 183 | 100 | 100 | 100 |
| Investment income (loss) | 32 | -13 | -1 | -10 | 20 | 20 | 20 | 20 | 8 | 80 | 80 | 80 |
| Gains (Losses) from investment disposal | 0 | 0 | 0 | 3 | 0 | 0 | 0 | 0 | 3 | 0 | 0 | 0 |
| Gains from FAs disposal | 3 | 337 | -29 | 507 | 0 | 0 | 0 | 0 | 817 | 0 | 0 | 0 |
| Exchange gain | 452 | -1,281 | 487 | 349 | 300 | 0 | 0 | 0 | 7 | 300 | 0 | 0 |
| Others | -483 | -257 | 964 | 910 | 3,197 | 450 | 450 | 450 | 1,134 | 4,547 | 2,000 | 2,000 |
| Pre-tax profit | 1,373 | 357 | 2,947 | 4,150 | 6,299 | 4,661 | 6,341 | 7,010 | 8,827 | 24,311 | 50,874 | 101,133 |
| Net Income for Minority | 9 | 231 | 256 | 381 | 338 | 338 | 338 | 338 | 877 | 1,351 | 1,351 | 1,351 |
| Income tax | -450 | -97 | -496 | -235 | -918 | -1,165 | -1,395 | -1,262 | -1,277 | -4,740 | -10,648 | -21,300 |
| Net profit | 915 | 30 | 2,194 | 3,535 | 5,043 | 3,158 | 4,608 | 5,411 | 6,673 | 18,220 | 38,875 | 78,482 |
| EPS (NT$) | 0.59 | 0.02 | 1.43 | 2.30 | 3.28 | 2.05 | 2.99 | 3.52 | 4.34 | 11.84 | 25.26 | 50.99 |
| Margins (%) | ||||||||||||
| Gross margin | 13.4% | 13.1% | 13.4% | 15.8% | 18.0% | 19.5% | 20.6% | 21.4% | 13.9% | 20.0% | 26.2% | 34.1% |
| Operating margin | 4.2% | 4.6% | 4.5% | 6.8% | 7.4% | 9.6% | 11.4% | 12.4% | 5.1% | 10.4% | 18.6% | 27.9% |
| Pre-tax margin | 4.6% | 1.1% | 8.7% | 12.0% | 16.8% | 10.7% | 12.4% | 13.3% | 6.7% | 13.2% | 19.4% | 28.5% |
| Net margin | 3.0% | 0.1% | 6.5% | 10.2% | 13.5% | 7.2% | 9.0% | 10.3% | 5.1% | 9.9% | 14.8% | 22.1% |
| QoQ Growth | ||||||||||||
| Sales | 2% | 8% | 5% | 2% | 8% | 16% | 17% | 3% | ||||
| Gross profit | 18% | 5% | 7% | 20% | 23% | 26% | 24% | 7% | ||||
| Operating profit | 86% | 19% | 2% | 54% | 17% | 51% | 40% | 11% | ||||
| Pre-tax profit | 331% | -74% | 726% | 41% | 52% | -26% | 36% | 11% | ||||
| Net profit | 1531% | -97% | 7310% | 61% | 43% | -37% | 46% | 17% | ||||
| YoY Growth | ||||||||||||
| Sales | 14% | 16% | 7% | 18% | 24% | 34% | 50% | 52% | 14% | 41% | 42% | 35% |
| Gross profit | -6% | 15% | -8% | 61% | 67% | 100% | 132% | 105% | 12% | 102% | 86% | 76% |
| Operating profit | -20% | 68% | -22% | 248% | 118% | 176% | 281% | 175% | 30% | 189% | 153% | 103% |
| Pre-tax profit | -59% | -83% | 95% | 1201% | 359% | 1207% | 115% | 69% | 21% | 175% | 109% | 99% |
| Net profit | -62% | -98% | 120% | 6204% | 451% | 10567% | 110% | 53% | 31% | 173% | 113% | 102% |
Source: Company data, Morgan Stanley Research (E) estimates.
M
Exhibit 20: Consolidated Financial Summary
Income Statement
| NT$ mn; FY End Dec | 2025 | 2026E | 2027E | 2028E |
|---|---|---|---|---|
| Net sales | 131,241 | 184,777 | 262,464 | 354,693 |
| Cost of goods sold | -112,949 | -147,780 | -193,803 | -233,768 |
| Gross profit | 18,292 | 36,997 | 68,660 | 120,924 |
| Operating expenses | -11,618 | -17,713 | -19,966 | -21,971 |
| Sales & Marketing | -1,607 | -2,514 | -3,249 | -3,994 |
| G&A | -5,012 | -7,806 | -8,136 | -8,550 |
| R&D | -4,999 | -7,392 | -8,581 | -9,428 |
| Operating profit | 6,674 | 19,284 | 48,695 | 98,953 |
| Interest income | 183 | 100 | 100 | 100 |
| Investment income | 8 | 80 | 80 | 80 |
| Gains from investment disposal | 3 | 0 | 0 | 0 |
| Gains from fixed assets disposal | 817 | 0 | 0 | 0 |
| Exchange gain | 7 | 300 | 0 | 0 |
| Other non-operating income | 1,134 | 4,547 | 2,000 | 2,000 |
| Net non-operating profit | 2,153 | 5,027 | 2,180 | 2,180 |
| Pre-tax profit | 8,827 | 24,311 | 50,874 | 101,133 |
| Net Income for Minority | -877 | -1,351 | -1,351 | -1,351 |
| Income tax | -1,277 | -4,740 | -10,648 | -21,300 |
| Net profit | 6,673 | 18,220 | 38,875 | 78,482 |
| Reported EPS (NT$) | 4.34 | 11.84 | 25.26 | 50.99 |
Balance Sheet
| NT$ mn; FY End Dec | 2025 | 2026E | 2027E | 2028E |
|---|---|---|---|---|
| Cash | 54,872 | 81,793 | 141,429 | 229,011 |
| Mkt Securities | 38 | 38 | 38 | 38 |
| AR/NR | 27,570 | 38,816 | 55,136 | 74,511 |
| Inventory | 17,802 | 23,292 | 30,545 | 36,844 |
| Others | 5,016 | 7,062 | 10,031 | 13,556 |
| Current Assets | 105,298 | 151,001 | 237,179 | 353,960 |
| Long-term Investments | 836 | 836 | 836 | 836 |
| Fixed Assets | 125,866 | 129,535 | 121,838 | 114,413 |
| Other Assets | 23,792 | 23,792 | 23,792 | 23,792 |
| Total Assets | 255,792 | 305,164 | 383,645 | 493,001 |
| S-t Borrowings | 10,845 | 10,845 | 10,845 | 10,845 |
| AP/NP | 17,494 | 22,889 | 30,018 | 36,208 |
| Other S-T Liabilities | 47,115 | 61,645 | 80,843 | 97,514 |
| Other LT Liabilities | 38,457 | 54,144 | 76,908 | 103,934 |
| L-t Debt | 34,873 | 33,872 | 32,871 | 31,870 |
| Total Liabilities | 148,785 | 183,395 | 231,485 | 280,371 |
| Common Shares | 15,296 | 15,296 | 15,296 | 15,296 |
| Other Shareholders' Equity | 91,711 | 106,473 | 136,864 | 197,334 |
| Total Equity | 107,007 | 121,769 | 152,160 | 212,630 |
| Total Liab./Shrhldr's Equity | 255,792 | 305,164 | 383,645 | 493,001 |
Source: Company data, Morgan Stanley Research (E) estimates.
Cash Flow Statement
| NT$ mn; FY End Dec | 2025 | 2026E | 2027E | 2028E |
|---|---|---|---|---|
| Cashflow from Operations | 14,967 | 39,169 | 58,657 | 90,949 |
| Net Profits | 6,673 | 18,220 | 38,875 | 78,482 |
| Depreciation | 18,773 | 19,887 | 20,078 | 18,885 |
| Investment losses (income) | 0 | -80 | -80 | -80 |
| Investment Disposal Loss | -3 | 0 | 0 | 0 |
| Change in Working Capital | -2,943 | 3,188 | 2,753 | -2,812 |
| Other adjustments | -7,533 | -2,046 | -2,969 | -3,525 |
| Cashflow from Investing | -23,018 | -23,556 | -12,381 | -11,460 |
| (Purchases) Sale of fixed asset | -24,307 | -23,556 | -12,381 | -11,460 |
| (Purchases) Sale of LT investment | -77 | 0 | 0 | 0 |
| Other adjustments | 1,367 | 0 | 0 | 0 |
| Cashflow from financing | 19,073 | 11,608 | 13,359 | 8,093 |
| Increase in L-T debt | 9,950 | -1,001 | -1,001 | -1,001 |
| Increase in S-T debt | 4,331 | 0 | 0 | 0 |
| Issuance of stock | 0 | 0 | 0 | 0 |
| Other adjustments | 7,087 | 15,687 | 22,764 | 27,025 |
| Exchange Rate Adjustment | 96 | -300 | 0 | 0 |
| Net change in cash | 11,118 | 26,921 | 59,636 | 87,582 |
Financial Ratios
| 2025 | 2026E | 2027E | 2028E | |
|---|---|---|---|---|
| Margins | ||||
| Gross margin | 13.9% | 20.0% | 26.2% | 34.1% |
| Operating expenses/sales | -8.9% | -9.6% | -7.6% | -6.2% |
| Operating margin | 5.1% | 10.4% | 18.6% | 27.9% |
| Tax rate | 14.5% | 19.5% | 20.9% | 21.1% |
| Pre-tax margin | 6.7% | 13.2% | 19.4% | 28.5% |
| Net Margin | 5.1% | 9.9% | 14.8% | 22.1% |
| YoY Growth | ||||
| Turnover | 13.8% | 40.8% | 42.0% | 35.1% |
| Gross Profit | 12.1% | 102.3% | 85.6% | 76.1% |
| Operating Profits | 30.4% | 188.9% | 152.5% | 103.2% |
| Pretax Profits | 20.6% | 175.4% | 109.3% | 98.8% |
| Net Profits | 31.3% | 173.0% | 113.4% | 101.9% |
| Adjusted Cash Dividend (NT$) | 2.00 | 5.46 | 11.65 | 23.52 |
| Net Debt/Equity | -8.6% | -30.5% | -64.2% | -87.6% |
| Liabilities/Equity | 139.0% | 150.6% | 152.1% | 131.9% |
| Liabilities/Assets | 58.2% | 60.1% | 60.3% | 56.9% |
| ROAE | 6.5% | 15.9% | 28.4% | 43.0% |
| ROAA | 2.7% | 6.5% | 11.3% | 17.9% |
| A/R Turnover (days) | 71.2 | 65.6 | 65.3 | 66.7 |
| A/P Turnover (days) | 52.7 | 49.9 | 49.8 | 51.7 |
| Inventory Turnover (days) | 52.8 | 50.7 | 50.7 | 52.6 |
| Cash conversion (days) | 71.3 | 66.4 | 66.2 | 67.6 |
M
Shennan Circuits: Estimate Changes
We raise our 2026, 2027 and 2028 EPS estimates by 9%, 17% and 24%, respectively, primarily driven by higher assumptions for AI optical transceiver PCBs.
Exhibit 21: Estimate Changes
| Year to Dec. 31 | 2026E | 2026E | 2026E | 2027E | 2027E | 2027E | 2028E | 2028E | 2028E |
|---|---|---|---|---|---|---|---|---|---|
| (RMB mn) | New | Old | %diff | New | Old | %diff | New | Old | %diff |
| P&L Summary | |||||||||
| Net sales | 32,234 | 30,721 | 5% | 42,154 | 37,580 | 12% | 53,710 | 44,952 | 19% |
| COGS | (22,602) | (21,691) | (28,642) | (25,773) | (35,954) | (30,356) | |||
| Gross profit | 9,632 | 9,030 | 7% | 13,512 | 11,807 | 14% | 17,756 | 14,596 | 22% |
| Operating expenses | (3,843) | (3,664) | (4,794) | (4,277) | (5,752) | (4,821) | |||
| Operating income | 5,789 | 5,366 | 8% | 8,717 | 7,530 | 16% | 12,004 | 9,775 | 23% |
| Non-operating income | (531) | (531) | (515) | (515) | (515) | (515) | |||
| Pre-tax income | 5,258 | 4,835 | 9% | 8,202 | 7,015 | 17% | 11,489 | 9,260 | 24% |
| Income tax | (472) | (435) | (710) | (606) | (993) | (799) | |||
| Minority interest | (1) | (1) | - | - | - | - | |||
| Net income | 4,785 | 4,399 | 9% | 7,493 | 6,409 | 17% | 10,496 | 8,461 | 24% |
| EPS (RMB) | 7.18 | 6.60 | 9% | 11.24 | 9.61 | 17% | 15.74 | 12.69 | 24% |
| Margins | ppt | ppt | ppt | ||||||
| Gross margin | 29.9% | 29.4% | 0.5 | 32.1% | 31.4% | 0.6 | 33.1% | 32.5% | 0.6 |
| Operating margin | 18.0% | 17.5% | 0.5 | 20.7% | 20.0% | 0.6 | 22.3% | 21.7% | 0.6 |
| Pretax margin | 16.3% | 15.7% | 0.6 | 19.5% | 18.7% | 0.8 | 21.4% | 20.6% | 0.8 |
| Net margin | 14.8% | 14.3% | 0.5 | 17.8% | 17.1% | 0.7 | 19.5% | 18.8% | 0.7 |
Source: Morgan Stanley Research (E) estimates.
Price Target and Valuation Methodology
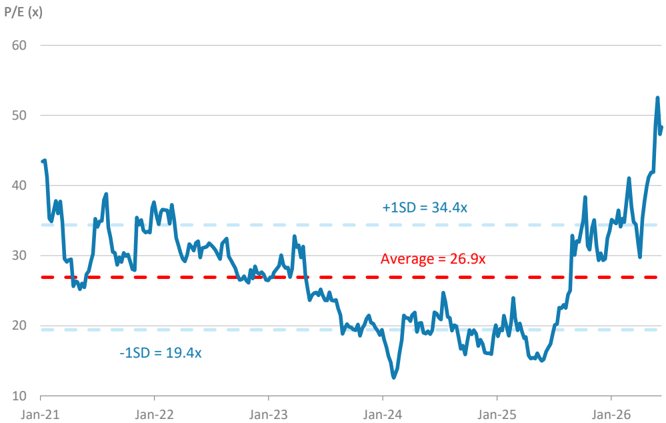
We raise our 12-month price target to Rmb400 (implies 36x 2027e EPS or 25x 2028e EPS), up from Rmb320, primarily driven by the increases in our earnings estimates for CY26, CY27 and CY28: Our base case scenario value is derived from a residual income (RI) model.
Our key assumptions are all unchanged, including a cost of equity of 6.7% (beta of 1.1, equity risk premium 5.0%, and risk-free rate of 1.3%), a medium-term growth rate of 7.0%, and a terminal growth rate of 4.0%.
Our bull and bear case values increase to Rmb555 and Rmb230 , respectively: This is in line with the magnitude of increase in our base case value.
Exhibit 22: Shennan Circuits residual income (RI) model
| RMB mn | 2026E | 2027E | 2028E | 2029E | 2030E | 2031E | 2032E | 2033E | 2034E | 2035E | 2036E |
|---|---|---|---|---|---|---|---|---|---|---|---|
| Total Equity | 20,731 | 26,645 | 34,668 | 43,604 | 53,164 | 63,394 | 74,340 | 86,053 | 98,585 | 111,994 | 126,342 |
| Net Profit | 4,785 | 7,493 | 10,496 | 11,231 | 12,017 | 12,858 | 13,758 | 14,721 | 15,752 | 16,854 | 18,034 |
| Return on Equity | 25.2% | 31.6% | 34.2% | 28.7% | 24.8% | 22.1% | 20.0% | 18.4% | 17.1% | 16.0% | 15.1% |
| Beta | 1.1 | 1.1 | 1.1 | 1.1 | 1.1 | 1.1 | 1.1 | 1.1 | 1.1 | 1.1 | 1.1 |
| Equity Risk Premium (Rm-Rf) | 5.0% | 5.0% | 5.0% | 5.0% | 5.0% | 5.0% | 5.0% | 5.0% | 5.0% | 5.0% | 5.0% |
| Risk Free Rate (Rf) | 1.3% | 1.3% | 1.3% | 1.3% | 1.3% | 1.3% | 1.3% | 1.3% | 1.3% | 1.3% | 1.3% |
| Cost of Equity | 6.7% | 6.7% | 6.7% | 6.7% | 6.7% | 6.7% | 6.7% | 6.7% | 6.7% | 6.7% | 6.7% |
| Beginning Equity Capital | 20,731 | ||||||||||
| PV of Forecast Period | 56,125 | ||||||||||
| PV of Continuing Value | 189,872 | ||||||||||
| Equity Value | 266,727 | ||||||||||
| No. of Shares | 667 | ||||||||||
| Projected Price (RMB) | 400.0 |
Source: Morgan Stanley Research estimates.
M
Exhibit 23: Shennan Circuits 5Y P/E Band
Source: TEJ, Morgan Stanley Research estimates.
M
Financials
Exhibit 24: Quarterly Estimates
| RMB mn | 1Q25 | 2Q25 | 3Q25 | 4Q25 | 1Q26 | 2Q26E | 3Q26E | 4Q26E | 2025A | 2026E | 2027E | 2028E |
|---|---|---|---|---|---|---|---|---|---|---|---|---|
| Net sales | 4,783 | 5,671 | 6,301 | 6,893 | 6,596 | 7,780 | 8,612 | 9,247 | 23,647 | 32,234 | 42,154 | 53,710 |
| COGS | (3,621) | (4,144) | (4,364) | (4,947) | (4,706) | (5,478) | (5,986) | (6,432) | (17,076) | (22,602) | (28,642) | (35,954) |
| Gross profit | 1,162 | 1,527 | 1,937 | 1,946 | 1,889 | 2,301 | 2,627 | 2,815 | 6,571 | 9,632 | 13,512 | 17,756 |
| Operating expenses | (622) | (668) | (860) | (887) | (804) | (934) | (1,033) | (1,073) | (3,038) | (3,843) | (4,794) | (5,752) |
| SG&A, R&D exp. | (622) | (668) | (860) | (887) | (804) | (934) | (1,033) | (1,073) | (3,038) | (3,843) | (4,794) | (5,752) |
| Employee bonus | 13 | 14 | 15 | 16 | 17 | 18 | 19 | 20 | 1 | 2 | 3 | 4 |
| Operating income | 540 | 858 | 1,077 | 1,058 | 1,085 | 1,368 | 1,593 | 1,743 | 3,533 | 5,789 | 8,717 | 12,004 |
| Non-operating income | (17) | 117 | (17) | 6 | (145) | (129) | (129) | (129) | 91 | (531) | (515) | (515) |
| Interest income | (131) | (93) | (116) | (82) | (179) | (179) | (179) | (179) | (422) | (715) | (715) | (715) |
| Investment income | 3 | 0 | (0) | 0 | (0) | (0) | (0) | (0) | 3 | (0) | (0) | (0) |
| Disposal of investment | 0 | 0 | 0 | 0 | 0 | 0 | 0 | 0 | 0 | 0 | 0 | 0 |
| Exchange gain | 0 | 0 | 0 | 0 | 0 | 0 | 0 | 0 | 0 | 0 | 0 | 0 |
| Other | 111 | 210 | 100 | 88 | 34 | 50 | 50 | 50 | 509 | 184 | 200 | 200 |
| Pre-tax income | 523 | 976 | 1,060 | 1,065 | 941 | 1,239 | 1,464 | 1,614 | 3,624 | 5,258 | 8,202 | 11,489 |
| Income tax | (31) | (106) | (93) | (114) | (89) | (136) | (117) | (129) | (345) | (472) | (710) | (993) |
| Minority interest | (1) | (0) | (1) | (0) | (1) | 0 | 0 | 0 | (3) | (1) | 0 | 0 |
| Net income | 491 | 869 | 966 | 950 | 850 | 1,103 | 1,347 | 1,485 | 3,276 | 4,785 | 7,493 | 10,496 |
| Adj.wtd.avg.shrs (mn) | 667 | 667 | 667 | 667 | 667 | 667 | 667 | 667 | 667 | 667 | 667 | 667 |
| EPS (RMB) | 0.74 | 1.30 | 1.45 | 1.42 | 1.28 | 1.65 | 2.02 | 2.23 | 4.91 | 7.18 | 11.24 | 15.74 |
| Fully diluted shares (mn) | 667 | 667 | 667 | 667 | 667 | 667 | 667 | 667 | 667 | 667 | 667 | 667 |
| Diluted EPS (RMB) | 0.74 | 1.30 | 1.45 | 1.42 | 1.28 | 1.65 | 2.02 | 2.23 | 4.91 | 7.18 | 11.24 | 15.74 |
| Margins (%) | ||||||||||||
| Gross Margin | 24.3 | 26.9 | 30.7 | 28.2 | 28.6 | 29.6 | 30.5 | 30.4 | 27.8 | 29.9 | 32.1 | 33.1 |
| Operating Margin | 11.3 | 15.1 | 17.1 | 15.4 | 16.5 | 17.6 | 18.5 | 18.8 | 14.9 | 18.0 | 20.7 | 22.3 |
| Pretax Margin | 10.9 | 17.2 | 16.8 | 15.4 | 14.3 | 15.9 | 17.0 | 17.5 | 15.3 | 16.3 | 19.5 | 21.4 |
| Net Margin | 10.3 | 15.3 | 15.3 | 13.8 | 12.9 | 14.2 | 15.6 | 16.1 | 13.9 | 14.8 | 17.8 | 19.5 |
| QoQ Growth (%) | ||||||||||||
| Sales | -2 | 19 | 11 | 9 | -4 | 18 | 11 | 7 | ||||
| Gross Profit | 12 | 31 | 27 | 0 | -3 | 22 | 14 | 7 | ||||
| Operating Profit | 47 | 59 | 25 | -2 | 3 | 26 | 16 | 9 | ||||
| Pretax Profit | 24 | 86 | 9 | 0 | -12 | 32 | 18 | 10 | ||||
| Net Profit | 26 | 77 | 11 | -2 | -10 | 30 | 22 | 10 | ||||
| YoY Growth (%) | ||||||||||||
| Sales | 21 | 30 | 33 | 42 | 38 | 37 | 37 | 34 | 32 | 36 | 31 | 27 |
| Gross Profit | 20 | 33 | 66 | 87 | 63 | 51 | 36 | 45 | 52 | 47 | 40 | 31 |
| Operating Profit | 30 | 41 | 73 | 188 | 101 | 59 | 48 | 65 | 75 | 64 | 51 | 38 |
| Pretax Profit | 29 | 46 | 102 | 151 | 80 | 27 | 38 | 52 | 79 | 45 | 56 | 40 |
| Net Profit | 29 | 43 | 93 | 144 | 73 | 27 | 39 | 56 | 74 | 46 | 57 | 40 |
Source: Company data, Morgan Stanley Research (E) estimates.
M
Exhibit 25: Consolidated Financial Summary
Consolidated Income Statement
| RMBmn (Year End Dec 31) | 2025A | 2026E | 2027E | 2028E |
|---|---|---|---|---|
| Net sales | 23,647 | 32,234 | 42,154 | 53,710 |
| COGS | (17,076) | (22,602) | (28,642) | (35,954) |
| Gross profit | 6,571 | 9,632 | 13,512 | 17,756 |
| Operating expenses | (3,038) | (3,843) | (4,794) | (5,752) |
| Operating income | 3,533 | 5,789 | 8,717 | 12,004 |
| Non-operating income | 91 | (531) | (515) | (515) |
| Interest income | (422) | (715) | (715) | (715) |
| Investment income | 3 | (0) | (0) | (0) |
| Disposal of investment | - | - | - | - |
| Exchange gain | - | - | - | - |
| Other | 509 | 184 | 200 | 200 |
| Pre-tax income | 3,624 | 5,258 | 8,202 | 11,489 |
| Income tax | (345) | (472) | (710) | (993) |
| Minority interests | (3) | (1) | - | - |
| Net income | 3,276 | 4,785 | 7,493 | 10,496 |
| Adj. wtd. Avg. shrs (m) | 667 | 667 | 667 | 667 |
| Reported EPS (Rmb) | 4.91 | 7.18 | 11.24 | 15.74 |
| Diluted shrs (m) | 667 | 667 | 667 | 667 |
| Diluted EPS (Rmb) | 4.91 | 7.18 | 11.24 | 15.74 |
Consolidated Balance Sheet
| RMBmn (Year End Dec 31) | 2025A | 2026E | 2027E | 2028E |
|---|---|---|---|---|
| Cash | 997 | 4,694 | 5,048 | 5,850 |
| Mkt securities | - | - | - | - |
| AR/NR | 6,669 | 3,546 | 4,637 | 5,908 |
| Inventory | 5,140 | 3,390 | 4,296 | 5,393 |
| Others | 849 | 161 | 211 | 269 |
| Current Assets | 13,654 | 11,791 | 14,192 | 17,419 |
| Long-term investments | 3 | 3 | 3 | 3 |
| Fixed assets | 15,190 | 20,315 | 27,017 | 35,556 |
| Other assets | 1,736 | 1,736 | 1,736 | 1,736 |
| Total Assets | 30,583 | 33,845 | 42,948 | 54,714 |
| S/T borrowings | 15 | 515 | 1,015 | 1,515 |
| AP/NP | 5,625 | 3,164 | 4,010 | 5,033 |
| Other ST liabilities | 4,384 | 5,803 | 7,353 | 9,230 |
| Total Current Liabilities | 10,024 | 9,482 | 12,378 | 15,779 |
| L/T debt | 2,679 | 2,679 | 2,679 | 2,679 |
| Other LT libilities | 699 | 953 | 1,246 | 1,588 |
| Total Liabilities | 13,402 | 13,114 | 16,303 | 20,046 |
| Common shares | 667 | 513 | 513 | 513 |
| Retained Earnings | 10,024 | 13,728 | 19,642 | 27,666 |
| Other SH' Equity | 6,490 | 6,490 | 6,490 | 6,490 |
| Total Shareholders' Equity | 17,181 | 20,731 | 26,645 | 34,668 |
| Total Liab./SH's Equity | 30,583 | 33,845 | 42,948 | 54,714 |
Source: Company data, Morgan Stanley Research (E) estimates.
| Consolidated Cash Flow Statement | Consolidated Cash Flow Statement | Consolidated Cash Flow Statement | Consolidated Cash Flow Statement | Consolidated Cash Flow Statement |
|---|---|---|---|---|
| RMBmn (Year End Dec 31) | 2025A | 2026E | 2027E | 2028E |
| Operating Cashflow | 3,838 | 9,303 | 7,842 | 10,971 |
| Net Profits | 3,276 | 4,785 | 7,493 | 10,496 |
| Depreciation & Amort. | 0 | 0 | 0 | 0 |
| Investment losses/(income) | (3) | 0 | 0 | 0 |
| Working capital change | (802) | 3,830 | 399 | 533 |
| Other adjustments | 1,368 | 688 | (50) | (58) |
| Investing Cashflow | (3,756) | (5,125) | (6,702) | (8,539) |
| Capex | (3,765) | (5,133) | (6,712) | (8,553) |
| Change of L/T investment | 0 | 0 | 0 | 0 |
| Change of S/T investment | 0 | 0 | 0 | 0 |
| Other adjustments | 4 | 0 | 0 | 0 |
| Financing Cashflow | (650) | (481) | (786) | (1,631) |
| Increase in L/T debt | 207 | 0 | 0 | 0 |
| Increase in S/T debt | 0 | 500 | 500 | 500 |
| Issuance of stock | 0 | (154) | 0 | 0 |
| Cash dividends | (846) | (1,081) | (1,579) | (2,473) |
| Other adjustments | (11) | 254 | 293 | 342 |
| FX adjustment | 12 | 0 | 0 | 0 |
| Net change in cash | (555) | 3,697 | 355 | 801 |
Consolidated Financial Ratios
| 2025A | 2026E | 2027E | 2028E | |
|---|---|---|---|---|
| Margins (%) | ||||
| Gross margin | 27.8 | 29.9 | 32.1 | 33.1 |
| Operating margin | 14.9 | 18.0 | 20.7 | 22.3 |
| Pretax margin | 15.3 | 16.3 | 19.5 | 21.4 |
| Net margin | 13.9 | 14.8 | 17.8 | 19.5 |
| YoY growth (%) | ||||
| Sales | 32.1 | 36.3 | 30.8 | 27.4 |
| Operating profits | 75.4 | 63.8 | 50.6 | 37.7 |
| Pretax profits | 79.1 | 45.1 | 56.0 | 40.1 |
| Net profits | 74.5 | 46.1 | 56.6 | 40.1 |
| Others | ||||
| Cash dividend payout (%) | 33 | 33 | 33 | - |
| Cash div (Rmb) | 1.6 | 2.4 | 3.7 | 5.2 |
| Yield (%) | 1 | 1 | 2 | 3 |
| Net Debt/Equity (%) | 10 | (7) | (5) | (5) |
| Liabilities/Equity (%) | 78 | 63 | 61 | 58 |
| Liabilities/Assets (%) | 44 | 39 | 38 | 37 |
| ROAE (%) | 21 | 25 | 32 | 34 |
| ROAA (%) | 12 | 15 | 20 | 21 |
| AR/NR Turnover (days) | 91 | 58 | 35 | 36 |
| Inventory Turnover (days) | 91 | 69 | 49 | 49 |
| AP/NP Turnover (days) | 107 | 71 | 46 | 46 |
| Cash conversion cycle | 75 | 56 | 39 | 39 |
M
Risk Reward - Zhen Ding (4958.TW) Risk Reward - Zhen Ding (4958.TW)
Growing China & International AI chip substrate and PCB vendor
NT$666.00 PRICE TARGET
Base case, residual income model. Key assumptions include a cost of equity of 10%, a medium-term growth rate of 15% and a terminal growth rate of 3%.
NT$442.33
Source: Refinitiv, Morgan Stanley Research
BULL CASE
37x 2027e P/E
Greater share gains and better earnings contribution from new projects in ABF and AI Server PCBs: In the bull case, we assume ZDT is able to do Google TPU substrate extremely well and uses it to approach other ASIC/GPU customers, expanding its international client base. Additionally, we also assume ZDT expands Nvidia AI PCB share to 20-30% share on good execution and yield.
NT$946.00
BASE CASE
27.5x 2027e P/E
Stable demand for F-PCB and SLP, with share gains in BT/ABF substrates, and AI server PCBs: Zhen Ding is one of the main ABF substrate suppliers for China AI chips, while growing its share for international clients, potentially starting with Google TPU. At the same time, it continues to grow its AI server PCB share with Nvidia and other hyperscalers, and grows its exposure to optical module transceivers.
NT$666.00
OVERWEIGHT THESIS
- iPhone volumes are more resilient than Android given Apple's advantages on securing memory.
- ZDT is one of the key ABF substrate suppliers for China AI chips, which is expected to grow meaningfully over the next few years.
- ZDT is growing its ABF exposure to International clients as well, including Google TPU.
- AI optical transceiver module PCB is a meaningful growth driver for ZDT, with very good margins (GM 40%+).
- Shenzhen ABF fab 1 continues to ramp and has turned profitable in 1Q26, and fab 2 is now under construction. Kaohsiung fab is on track to enter mass production in 2H26. ▪ Our PT implies 27x/20x CY27e/28e P/E.
Risk Reward Themes
Pricing Power:
Negative
View descriptions of Risk Rewards Themes here
BEAR CASE
16x 2027e P/E
Weaker iPhone demand with share loss and ZDT does not execute on Google TPU substrates: iPhone demand misses market expectations, Zhen Ding loses share in FPCB to Chinese peers, and SLP demand is also weak. We also assume here that ZDT fails to execute on TPU substrates and only continues to have exposure to China AI chips, with less than 5% share for Nvidia AI PCBs.
NT$386.00
M
Risk Reward - Zhen Ding (4958.TW)
KEY EARNINGS INPUTS
| Drivers | 2025 | 2026e | 2027e | 2028e |
|---|---|---|---|---|
| F-PCB sales y/y (%) | 5 | 1.2 | 14.6 | 7.3 |
| F-PCB GM (%) | 21.3 | 24.2 | 24.6 | 25.6 |
| F-PCB ASP per sq ft (NT$) | 59.5 | 60.4 | 63.1 | 65.3 |
INVESTMENT DRIVERS
- iPhone, MacBook, iPad demand
- F-PCB content per iPhone, MacBook, iPad
- F-PCB ASP
- Yield rate for ABF/BT substrates
GLOBAL REVENUE EXPOSURE
Source: Morgan Stanley Research Estimate View explanation of regional hierarchies here
MS ALPHA MODELS
3/5
MOST
3 Month
Horizon
Source: Refinitiv, FactSet, Morgan Stanley Research; 1 is the highest favored Quintile and 5 is the least favored Quintile
RISKS TO PT/RATING
RISKS TO UPSIDE
- Higher-than-expected F-PCB content increase for iPhones
- Better-than-expected production yield/share allocation for SLP
- Share gains on higher margin F-PCB pieces
RISKS TO DOWNSIDE
- Worse-than-expected iPhone sell-through
- Lower-than-expected F-PCB content increase for iPhones
- Worse-than-expected production yield/share allocation for SLP
- Increasing competition from Chinese peers, intensifying pricing pressure
OWNERSHIP POSITIONING
Inst. Owners, % Active
65.6%
Source: Refinitiv, Morgan Stanley Research
MS ESTIMATES VS. CONSENSUS
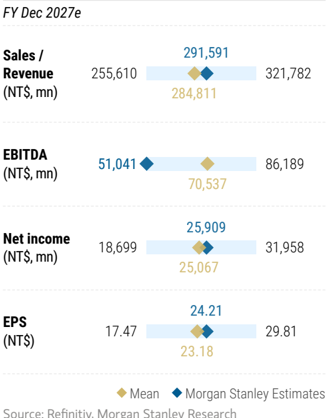
M
Risk Reward - Unimicron (3037.TW) Risk Reward - Unimicron (3037.TW)
Price hikes and spec upgrades to support higher earnings estimates; OW
NT$1,285.00 PRICE TARGET
Base case, residual income (RI) valuation model, which we think derives the most accurate value of the firm given that it takes into account cost of equity. We use a cost of equity of 9.2% [risk-free rate of 1% (10-year Taiwan government note yield), equity risk premium of 8.7%, and a beta of 1.0], a medium-term growth rate of 15%, and a terminal growth rate of 3%.
NT$926.25
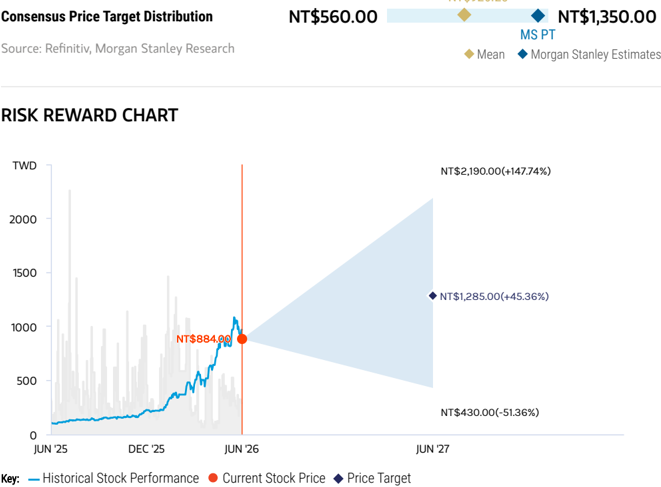
Source: Refinitiv, Morgan Stanley Research
BULL CASE
87x 2027e P/E
Demand for AI servers, general servers and PCs is much stronger than expected: Pricing
increases more than expected, 30%+ in 2026-27, driving stronger margin expansion for Unimicron.
NT$2,190.00
BASE CASE
51x 2027e P/E
Entering up-cycle driven by AI chip upgrades:
Robust demand for AI GPUs and ASICs, supported by continued data center infrastructure investments by CSPs and neo cloud, leads to undersupply in the high-end ABF market from 2027e onwards. PC demand is sluggish, while general servers still show double-digit unit growth in 2026e. ASP has bottomed and started to inflect upwards, driven by raw material price hikes and substrate spec upgrades.
NT$1,285.00
OVERWEIGHT THESIS
- We expect the ABF substrate market to revert to undersupply from 2027 onwards, with the undersupply gap reaching 5-10% by 2030.
- This is primarily driven by AI demand, with next-gen AI/networking chips adopting larger body size ABF substrates.
- In the near to medium term, the short
- supply of T-glass will be a key watch point, but we believe this will mainly affect lowend ABF and BT substrates, as suppliers prioritize supply to the AI chip vendors.
- Our price target implies 51x 2027e P/E or 25x 2028e P/E, above the 10-20x range at which it traded in the previous upcycle. We deem this fair, given AI chip substrate spec upgrades and suppliers' ability to raise prices.
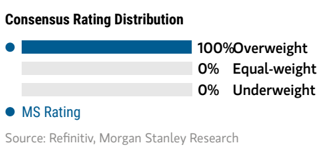
Consensus Rating Distribution
Source: Refinitiv, Morgan Stanley Research
Risk Reward Themes
Pricing Power:
Positive Positive
Secular Growth:
View descriptions of Risk Rewards Themes here
BEAR CASE
17x 2027e P/E
Demand for AI servers and general servers weakens, with PC demand weakening
further: The result is greater ABF oversupply; thus, there are pricing declines of ~15-20% in 2026-27, leading to weaker margins for Unimicron over the next two years.
NT$430.00
M
Risk Reward - Unimicron (3037.TW)
KEY EARNINGS INPUTS
| Drivers | 2025 | 2026e | 2027e | 2028e |
|---|---|---|---|---|
| IC substrate ASP YoY (%) | 7.5 | 29.7 | 33.5 | 29.3 |
| IC substrate GM (%) | 15.2 | 22.3 | 28.6 | 37.1 |
INVESTMENT DRIVERS
- 5G smartphone demand
- 5G base station demand
- Automotive demand
GLOBAL REVENUE EXPOSURE
Source: Morgan Stanley Research Estimate View explanation of regional hierarchies here
MS ALPHA MODELS
4/5 MOST
3 Month
Horizon
Source: Refinitiv, FactSet, Morgan Stanley Research; 1 is the highest favored Quintile and 5 is the least favored Quintile
RISKS TO PT/RATING
RISKS TO UPSIDE
- Better-than-expected ABF substrate demand from PC and server customers
- Capex cuts; halt to its capacity expansion plan
- Continued yield issues of alternative technology that doesn't require substrate (e.g., CoWoP)
RISKS TO DOWNSIDE
- Sudden demand shortfall
- Technological change that would not require ABF substrates
- Intensifying competition
- Yield issues or production hiccups when ramping new capacity
OWNERSHIP POSITIONING
Inst. Owners, % Active
68.8%
Source: Refinitiv, Morgan Stanley Research
MS ESTIMATES VS. CONSENSUS
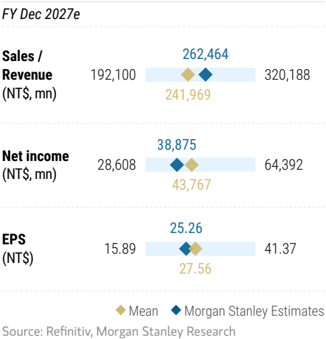
M
Risk Reward - Shennan Circuits Co Ltd (002916.SZ) Risk Reward - Shennan Circuits Co Ltd (002916.SZ)
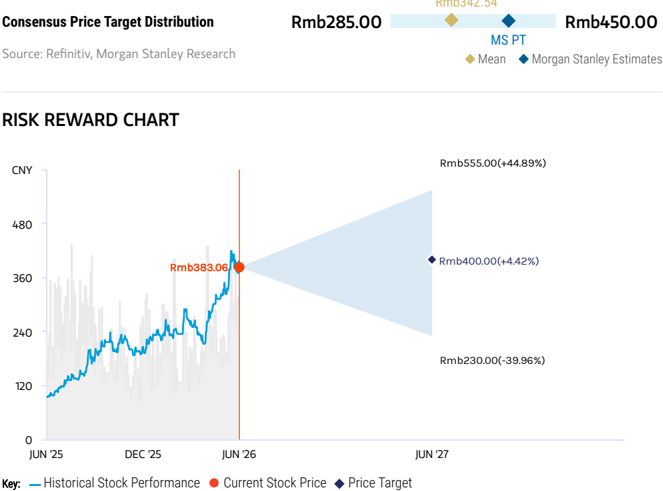
Beneficiary of supply chain localization; EW on valuation
Rmb400.00 PRICE TARGET
Base case, derived from a residual income (RI) model. Key assumptions include a cost of equity of 6.7% (beta of 1.1, equity premium of 5%, and risk-free rate of 1.3%), 7% medium-term growth rate, and 4% terminal growth rate.
Rmb342.54
BASE CASE
36x 2027e EPS
We expect Shennan's share of the 5G base station market to be stable at 15-20%, while its server and automotive PCB continues to rise steadily and its IC substrate business continues to outgrow the market in 2026e as they gain share, especially in the domestic market. This results in a 30-35% revenue CAGR in 2025-28e.
Source: Refinitiv, Morgan Stanley Research
BULL CASE
50x 2027e EPS
Shennan's share of the 5G base station market expands to 20-25% (vs. base case scenario of 15-20%), while its automotive and server PCB business doubles over the next two years and its IC substrate business grows 40-50% YoY in 2026 (vs. base case scenario of ~30%). This results in a 55-65% revenue CAGR in 2025-28e.
Rmb555.00
Rmb400.00
EQUAL-WEIGHT THESIS
- We view the stock as fairly valued based on current demand indicators, with expectations for rising automotive and data center PCB already elevated for 2026-27.
- Shennan's "China localization" story should continue to play out in the longer term for PCB and IC substrates, and it should be the main beneficiary amid China's semiconductor self-sufficiency drive.
- Demand for 5G base station PCB was slow in 2025, and has remained slow in 2026, with limited visibility on the trajectory of demand improvement (both domestic and overseas).
- Server/Optical transceiver PCB demand is improving for cloud in China, and new platform penetration rate continues to rise.
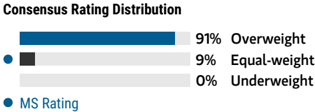
Source: Refinitiv, Morgan Stanley Research
Risk Reward Themes
Electric Vehicles:
Positive
New Data Era:
Positive
Pricing Power:
Negative
View descriptions of Risk Rewards Themes here
BEAR CASE
21x 2027e EPS
Shennan's share of the 5G base station market falls to 5-10% (vs. base case scenario of 15-20%), while its server and automotive PCB fails to continue to grow and its IC substrate business grows only slightly above the market in 2026. This results in a 0-15% revenue CAGR in 2025-28e.
Rmb230.00
M
Risk Reward - Shennan Circuits Co Ltd (002916.SZ)
KEY EARNINGS INPUTS
| Drivers | 2025 | 2026e | 2027e | 2028e |
|---|---|---|---|---|
| PCB revenue y/y (%) | 37 | 38 | 31 | 31 |
| IC substrate revenue y/y (%) | 31 | 69 | 36 | 27 |
| PCB GM (%) | 35.5 | 34.7 | 37 | 37.8 |
| IC substrate GM (%) | 22.6 | 30.7 | 33.6 | 33.6 |
INVESTMENT DRIVERS
- 5G base station deployment schedule
- Supplier share allocation
- China's data center demand
- China's semiconductor localization schedule
GLOBAL REVENUE EXPOSURE
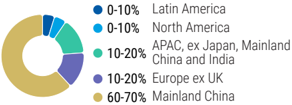
Source: Morgan Stanley Research Estimate View explanation of regional hierarchies here
MS ALPHA MODELS
3 Month Horizon
Source: Refinitiv, FactSet, Morgan Stanley Research; 1 is the highest favored Quintile and 5 is the least favored Quintile
RISKS TO PT/RATING
RISKS TO UPSIDE
- Rising demand for 5G and data center PCB.
- Further share gain for 5G and data center PCB.
- Rising IC substrate demand driven by acceleration in China's semiconductor localization.
RISKS TO DOWNSIDE
- Rising competition for 5G and data center PCB.
- Delay in 5G network deployment.
- Escalating US-China trade tensions.
OWNERSHIP POSITIONING
Inst. Owners, % Active
85.3%
Source: Refinitiv, Morgan Stanley Research
MS ESTIMATES VS. CONSENSUS
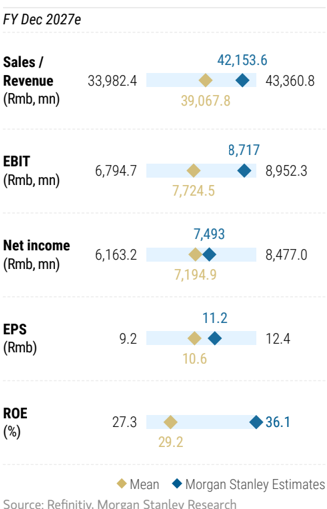
M
Risk Reward Reference links
- View explanation of Options Probabilities methodology -Options_Probabilities_Exhibit_Link.pdf
- View descriptions of Risk Rewards Themes - RR_Themes_Exhibit_Link.pdf
- View explanation of regional hierarchies - GEG_Exhibit_Link.pdf
- View explanation of Theme/Exposure methodology -ESG_Sustainable_Solutions_External_Link.pdf
- View explanation of HERS methodology - ESG_HERS_External_Link.pdf
M
Disclosure Section
The information and opinions in Morgan Stanley Research were prepared or are disseminated by Morgan Stanley Asia Limited (which accepts the responsibility for its contents) and/or Morgan Stanley Asia (Singapore) Pte. (Registration number 199206298Z) and/or Morgan Stanley Asia (Singapore) Securities Pte Ltd (Registration number 200008434H), regulated by the Monetary Authority of Singapore (which accepts legal responsibility for its contents and should be contacted with respect to any matters arising from, or in connection with, Morgan Stanley Research), and/or Morgan Stanley Taiwan Limited and/or Morgan Stanley & Co International plc, Seoul Branch, and/or Morgan Stanley Australia Limited (A.B.N. 67 003 734 576, holder of Australian financial services license No. 233742, which accepts responsibility for its contents), and/or Morgan Stanley Wealth Management Australia Pty Ltd (A.B.N. 19 009 145 555, holder of Australian financial services license No. 240813, which accepts responsibility for its contents), and/or Morgan Stanley India Company Private Limited having Corporate Identification No (CIN) U22990MH1998PTC115305, regulated by the Securities and Exchange Board of India ('SEBI') and holder of licenses as a Research Analyst (SEBI Registration No. INH000001105); Stock Broker (SEBI Stock Broker Registration No. INZ000244438), Merchant Banker (SEBI Registration No. INM000011203), and depository participant with National Securities Depository Limited (SEBI Registration No. IN-DP-NSDL-567-2021) having registered office at Altimus, Level 39 & 40, Pandurang Budhkar Marg, Worli, Mumbai 400018, India; Telephone no. +91-22-61181000; Compliance Officer Details: Mr. Tejarshi Hardas, Tel. No.: +91-22-61181000 or Email: tejarshi.hardas@morganstanley.com; Grievance officer details: Mr. Tejarshi Hardas, Tel. No.: +91-22-61181000 or Email: msic-compliance@morganstanley.com which accepts the responsibility for its contents and should be contacted with respect to any matters arising from, or in connection with, Morgan Stanley Research, and their affiliates (collectively, "Morgan Stanley"). Morgan Stanley India Company Private Limited (MSICPL) may use AI tools in providing research services. All recommendations contained herein are made by the duly qualified research analysts.
For important disclosures, stock price charts and equity rating histories regarding companies that are the subject of this report, please see the Morgan Stanley Research Disclosure Website at www.morganstanley.com/eqr/disclosures/webapp/generalresearch, or contact your investment representative or Morgan Stanley Research at 1585 Broadway, (Attention: Research Management), New York, NY, 10036 USA.
For valuation methodology and risks associated with any recommendation, rating or price target referenced in this research report, please contact the Client Support Team as follows: US/Canada +1 800 303-2495; Hong Kong +852 2848-5999; Latin America +1 718 754-5444 (U.S.); London +44 (0)20-7425-8169; Singapore +65 6834-6860; Sydney +61 (0)2-9770-1505; Tokyo +81 (0)3-6836-9000. Alternatively you may contact your investment representative or Morgan Stanley Research at 1585 Broadway, (Attention: Research Management), New York, NY 10036 USA.
圖片清單(已驗證 2026-07-02)
回補驗證:僅涵蓋已被 lib 頁嵌入的圖片,非全量驗證。
| 檔名 | size | 分類 | 親眼所見內容 |
|---|---|---|---|
260611_3037_4958_ms_optics-PCB_002.png |
16KB | 真資料圖 | 長條圖,數值標註 3/7/26/41/90/153/168,橫軸 2022-2028E |
260611_3037_4958_ms_optics-PCB_003.png |
39KB | 真資料圖 | 標題「AI transceiver PCB TAM is growing at 83% CAGR from 2025-28E (US$ M)」,疊加長條圖分項 Unimicron/Shennan/Zhen Ding/Others,2022-2028E |
260611_3037_4958_ms_optics-PCB_005.png |
54KB | 真資料圖 | 群組長條圖,Unimicron/Shennan Circuits/Zhen Ding/Avary 三廠商 2025/2026E/2027E/2028E 各年,並以紅色箭頭與文字標註 CAGR 百分比(62%/54%/177%) |