PDF 原檔:報告_MS_晶圓代工月報_台積電3Q26預覽_20261005_original.pdf
圖片清單(已驗證 2026-10-06)
僅列 ≥40KB 並逐張 Read 者;其餘 <40KB 抽圖(含 Exhibit 1-2 晶圓價格趨勢/GM 與折舊、CoWoS/CoPoS/EMIB 產能長條圖等)預設為小圖,未逐張驗證,lib 不嵌。
| 檔名 | size | 分類 | 親眼所見內容 |
|---|---|---|---|
報告_MS_晶圓代工月報_台積電3Q26預覽_20261005_003.png |
43KB | 真資料圖 | TSMC 年度 capex(US$bn,2011-2028e 長條)與 capital intensity(折線,約 2021 高點 52% 後下滑至 2028e 約 28%) |
報告_MS_晶圓代工月報_台積電3Q26預覽_20261005_005.png |
69KB | 真資料圖 | TSMC 簡報頁「N2 Family Technology Capacity Growth」:N2/A16 產能 2025→2026(F)→2027(F)→2028(F) 長條,標註 2026-2028 CAGR 70%(12 吋約當 K wafer),來源 TSMC |
報告_MS_晶圓代工月報_台積電3Q26預覽_20261005_009.png |
253KB | 真資料圖 | TSMC 簡報「CoWoS Enables AI Compute Scaling」:interposer 尺寸 roadmap,CoWoS-S 1.5/2/3.3 reticle('16-'23)、CoWoS-R 1.4、CoWoS-L/R 3.3/5.5/9.7 reticle(至 '27),附 SoC+HBM 與 SoIC 多晶粒示意,1 reticle≈830mm²,來源 TSMC |
報告_MS_晶圓代工月報_台積電3Q26預覽_20261005_010.png |
142KB | 真資料圖 | Yole 圖「Size does matter」:~5.5x reticle interposer(4,565mm²)於 300mm 晶圓僅 7 片、面積效率約 45%;300x300mm² 面板 16 片、約 81%、成本約 -10%;600x600mm² 面板 64 片、約 81%、成本約 -20% |
報告_MS_晶圓代工月報_台積電3Q26預覽_20261005_011.png |
268KB | 真資料圖 | Intel 簡報「EMIB Scalability to Support AI Demand」:2023 約 4x reticle/約 80x80 封裝/8 HBM/12 EMIB;2026 >8x/約 120x120/12 HBM/>20 EMIB;2028 >12x/>120x180/>24 HBM/>38 EMIB,附三代封裝示意 |
報告_MS_晶圓代工月報_台積電3Q26預覽_20261005_012.png |
227KB | 真資料圖 | UMC 簡報頁「TFLN pros and cons」:優勢=低損耗、高頻寬(>110 GHz)、熱穩定佳、線性度極佳;劣勢=體積大、較矽昂貴、與 SiPh 整合需異質整合或先進封裝;右側為 TFLN MZM 結構與電子顯微圖 |
報告_MS_晶圓代工月報_台積電3Q26預覽_20261005_013.png |
263KB | 真資料圖 | 簡報頁「Modulator selection 2. MRM」:微環調變器(含 heater、Ge implant、PD bias、pn-junction)立體結構;要點=體積小、驅動電壓低、電頻寬高、對溫度極敏感、製程控制要求高、消光比與速度需取捨、不適合 400Gbps/channel 以上(報告圖說標示來源 UMC) |
報告_MS_晶圓代工月報_台積電3Q26預覽_20261005_015.png |
46KB | 真資料圖 | TSMC P/B(藍線)與 ROE(黃階梯線)2011-2026,標示 P/B 平均 3.8x(估值圖) |
報告_MS_晶圓代工月報_台積電3Q26預覽_20261005_024.png |
62KB | 真資料圖 | MS 對 TSMC 的評等與目標價沿革圖(2023-10 至 2026-10,紅階梯線至 2,988,股價藍線約 2,500),揭露頁圖 |
報告_MS_晶圓代工月報_台積電3Q26預覽_20261005_025.png |
51KB | 真資料圖 | MS 對 UMC 的評等與目標價沿革圖(紅階梯線至 138),揭露頁圖 |
原始內容
| Morgan Stanley Taiwan Limited+ | Morgan Stanley Taiwan Limited+ | Morgan Stanley Taiwan Limited+ |
|---|---|---|
| Charlie Chan Equity Analyst | Charlie Chan Equity Analyst | Charlie Chan Equity Analyst |
| C arlie.C an@morganstanley.com | C arlie.C an@morganstanley.com | +886 2 2730-1725 |
| Daniel Yen, CFA Equity Analyst | Daniel Yen, CFA Equity Analyst | Daniel Yen, CFA Equity Analyst |
| Daniel.Yen@morganstanley.com | Daniel.Yen@morganstanley.com | +886 2 2730-2863 |
| Morgan Stanley Asia Limited+ | Morgan Stanley Asia Limited+ | Morgan Stanley Asia Limited+ |
| Daisy Dai, CFA Equity Analyst | Daisy Dai, CFA Equity Analyst | Daisy Dai, CFA Equity Analyst |
| Daisy.Dai@morganstanley.com Morgan Stanley Taiwan Lucas.Wang@morganstanley.com Morgan Stanley Asia | Daisy.Dai@morganstanley.com Morgan Stanley Taiwan Lucas.Wang@morganstanley.com Morgan Stanley Asia | +852 2848-7310 +886 2 2730-2875 |
| Lucas Wang | Lucas Wang | Lucas Wang |
| Researc Associate | Researc Associate | Researc Associate |
| Ethan Jia | Ethan Jia | Ethan Jia |
| Et an.Jia@morganstanley.com +852 3963-2287 | Et an.Jia@morganstanley.com +852 3963-2287 | Et an.Jia@morganstanley.com +852 3963-2287 |
| Greater China Technology Semiconductors | Greater China Technology Semiconductors | Greater China Technology Semiconductors |
| Asia Pacific | Asia Pacific | Asia Pacific |
| Industry View Attractive | Industry View Attractive | Industry View Attractive |
| What's Changed | What's Changed | What's Changed |
| Researc Associate UMC (2303.TW) | From | To |
| Price Target | NT$138.00 | NT$ 88.00 |
| TSMC (2330.TW) | From | To |
| Price Target | NT$2,988.00 | NT$3,088.00 |
Morgan Stanley does and seeks to do business with companies covered in Morgan Stanley Research. As a result, investors should be aware that the firm may have a conflict of interest that could affect the objectivity of Morgan Stanley Research. Investors should consider Morgan Stanley Research as only a single factor in making their investment decision.
For analyst certification and other important disclosures, refer to the Disclosure Section, located at the end of this report.
= Analysts employed by non-U.S. affiliates are not registered with FINRA, may not be associated persons of the member and may not be subject to FINRA restrictions on communications with a subject company, public appearances and trading securities held by a research analyst account.
M Idea October 5, 2026 08:00 PM GMT
Greater China Semiconductors | Asia Pacific
The Foundry Floorplan: TSMC 3Q26 Earnings Preview; UMC Preli inary 2027 Positives
We think the capex budget ight gradually shift to AI co pute and AI networking in 2028, as e ory usage needs to be opti ized. We see positives for TSMC and UMC.
TSMC 3Q26 earnings preview: We expect the company to raise full-year revenue gui ance to the low-to-mi -40% range (vs. above 40%) Y/Y, implying 4Q26 revenue will rise 10%-15% Q/Q ami very strong 3nm eman . 3Q26 gross margin shoul reach the high en of gui ance of 67.5% However, shoul Intel focus on internal capacity expansion, we think TSMC woul maintain 2nm capacity expansion at the same pace an its capex at US$54bn for 2026. For 2027, we see TSMC's capex reaching US$75bn to US$80bn.
In terms of 2027 wafer price hikes, we see lea ing e ge (7nm an below) up 5%-10% an mature no es up 0%-3%; hence, gross margin coul approach 70% in 2027. As a result, we raise our TSMC price target by 3% to T$3,088.
Key topics for upcoming TSMC 3Q26 earnings call on October 15:
- Woul TSMC consi er working with TereFab (Taiwan News, Oct 3 2026) an buil ing new fab sites in Texas (Bloomberg, Oct 1 2026)? Our view is that expansion in Texas coul be necessary, consi ering customer eman an limite space at the Arizona fab in five years.
- If Intel were to increase capex, woul that re uce outsourcing at TSMC? Our recent in ustry checks suggest some trimming of Intel's 3nm an 2nm; how might TSMC reallocate its resources?
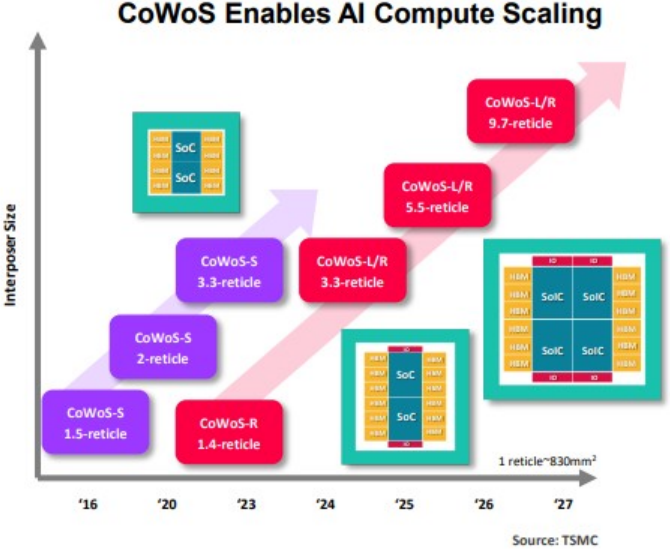
- How woul TSMC a ress large reticle size chip eman ? Our checks suggest Me iaTek han le TPU v10 IceFish reticle size initially at 14x; coul TSMC's CoWoS or CoPoS be able to support such packaging?
We raise our UMC price target by 36% to T$188 on AI networking (SiPh)
business upside: Some investors remain on the si elines ami ongoing smartphone an PC eman weakness. We have seen some or er cuts in PC semis recently, as some consumer analog IC customers (e.g., Silergy) have not been able to pass through UMC's wafer price hike. Therefore, some investors o not expect any UMC's price hike in 2027. However, two growth rivers coul help UMC raise wafer price for 8-inch in 2027: 1) Samsung DDI outsourcing, as we note in our earlier Foun ry Floorplan, an 2) growing SiPh PIC eman , in particular after UMC intro uce its 400Gb per lane solution (PIC + TFLN) solution.
M Idea
AlphaSignals Earnings Preview
| Focus KPI | Focus KPI urprise | Likely impact to consensus EP * |
|---|---|---|
| TSMC 2330.TW | ||
| 3Q26 GM and 4Q26 Revenue guidance | Likely upside surprise | Modest revision higher |
M Idea
TSMC 3Q26 earnings and 4Q26 guidance preview
Exhibit : 3Q26 earnings and 4Q26 guidance preview
| (NT$ bn) | 3Q26 - Guidance | 3Q26 - Preliminary | 3Q26 - MS Est. | 3Q26 - Consensus | 4Q26 - Guidance | 4Q26 - MS Est. | 4Q26 - Consensus |
|---|---|---|---|---|---|---|---|
| Revenue | US$44.6 - 45.8bn | 1,499 | 1,450 | 1,686 | 1,591 | ||
| Q/Q | +12% at mid-point in USD | 14.1% | 9.7% | ||||
| Y/Y | 46.5% | 52.1% | |||||
| GM (%) | 65.0% - 67.0% | 67.5% | 66.5% | 68.6% | 66.4% | ||
| OpM (%) | 56.0% - 58.0% | 60.8% | 58.2% | 62.2% | 58.4% | ||
| EPS (NT$) | 30.74 | 28.28 | 35.25 | 31.23 |
Source: Company data, FactSet, Morgan Stanley Researc estimates
TSMC's 2026-28 foundry floor lan broadly aligns with our bottom-u demand analysis
Our in ustry checks suggest ASML allocates capacity base largely on historical eman an long-term partnerships, in icating that TSMC remains the largest customer for EUV shipments. If so, TSMC shoul retain strong pricing power an coul increase lea ing-e ge wafer prices by 5%-10% in 2027, reflecting both the value it elivers to customers an the potential for margin expansion.
Exhibit 3: TSMC's GM and depreciation trends - 60% s ould be t e floor
Source: Company data, Morgan Stanley Researc (e) estimates
Exhibit 2: TSMC - Wafer pricing trend
Source: Company data, Morgan Stanley Researc (e) estimates M Idea
Exhibit 4:
TSMC's capex intensity s ould drop significantly as a result of robust revenue growt
Source: Company data, Morgan Stanley Researc (e) estimates
TSMC 2nm and 3nm ca acity growth remains robust; 5nm set to decline
Consistent with our eman forecast, TSMC in icate very strong capacity requirements for both 2nm an 3nm starting in 2026, implying a 70% capacity CAGR for N2 from 2026 to 2028. TSMC also suggeste that 5nm capacity will begin to ecline from 2027, in line with our forecast that 5nm eman will rop as Blackwell transitions to Rubin on 3nm.
Separately, a vance packaging capacity expansion shoul remain in focus for TSMC in 2027. This inclu es, but is not limite to, CoWoS an SoIC, for which we now expect capacity to reach 200kwpm an 40kwpm, respectively, by 2027.
Exhibit 5: TSMC - Our estimate of 2nm customer demand breakdown
Exhibit 6: TSMC suggested N2 capacity could see >70% CAGR from 2026-28
Source: Morgan Stanley Researc estimates
Source: TSMC
With no es below 3nm expecte to continue to see strong eman , our checks suggest TSMC's 2nm/1.6nm capacity coul approach 100kwpm by en -2026, increase to 150170kwpm in 2027, an excee 200kwpm in 2028. We expect 1.4nm to begin pulling in tools in 2027, with the bulk of capacity ramping in 2028. Looking further ahea , we expect TSMC to intro uce initial 1.0nm capacity in Tainan in 2029. We have not bake in potential M Idea capacity in Texas, which we believe is still un er iscussion.
Exhibit 7: TSMC fab roadmap (wit out potential Texas capacity )
| Node | Location | Fab | Capacity - 2025 | Capacity - 2026 | Capacity - 2027 | Capacity - 2028 | Capacity - 2029 |
|---|---|---|---|---|---|---|---|
| N3 | Tainan | F18 - P4/P5/P6/P8/P9 | 110k | 160-170k | |||
| Arizona | F21 - P2 | 20k | |||||
| Japan | F23 - P2 | 15k | |||||
| Total | 110k | 180-190k | 190k | 200-205k | |||
| N2/A16 | HsinChu | F20 - P1/P2 | 20k | 30k | |||
| Tainan | F22 - P7/P8/P9 | 40-50k | 60k | ||||
| KaoHsiung | F22 - P1/P2/P3/P4/P5/P6 | 25k | 60k | 80-90k | 100k | ||
| Arizona | F21 - P3/P4/P5/P6 | 20k | |||||
| Total | 45k | 90-100k | 150-170k | 210k | |||
| A14 | HsinChu | F20 - P3/P4 | 10-20k | 30-40k | 40k | ||
| A14/A13/A12 | Taichung | F25 - P1/P2/P3/P4 | 10-20k | 30-40k | 80k | ||
| Total | 20-40k | 60-80k | 120k | ||||
| A10 | Tainan | F26 - P1/P2/P3/P4 | 5k | ||||
| N40/28/22/12 | Japan | F23 - P1 | 25k | ||||
| N28/16 | Germany | F24 | 5k | 40k |
Source: Morgan Stanley Researc estimates
M Idea
How ight TSMC address Intel's co petition in both wafer foundry and advanced packaging?
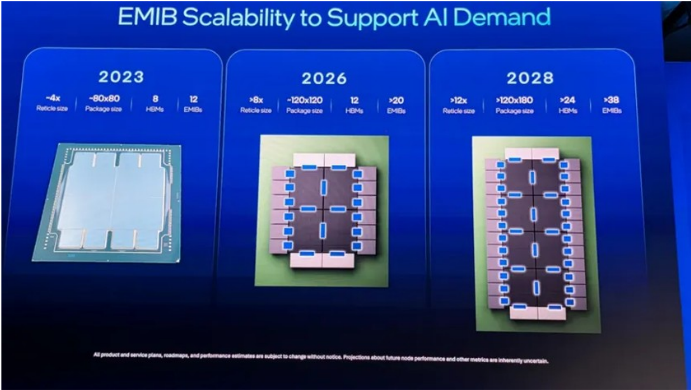
Intel EMIB-T remains com etitive in 2029; how TSMC will address?
With eman in AI continuing to boom, we expect TSMC an its OSAT partners to expe ite capacity expansion plans for CoWoS. We see TSMC's CoWoS capacity buil ing further to 260kwpm in 2028, from 130/200kwpm in 2026/2027, with 2028's expansion mainly focuse in Arizona's AP9/10 an potentially in AP7. TSMC is now con ucting trial pro uction for CoPoS in Taoyuan. If the progress goes well, we woul expect TSMC to start buil ing its CoPoS capacity, with location also likely to be in AP9/10 or AP7P3.
We expect the non-TSMC camp to expan CoWoS capacity to 110kwpm by 2028 year-en , from 80kwpm by en -2027. For ASE/SPIL, we expect FoCoS+CoWoS capacity to rise from 30kwpm at 2027-en to 50-60kwpm at 2028-en , with expansion focuse on CoWoS-L an CoWoS-R. For Amkor, we expect CoWoS capacity to increase from 30kwpm at 2027en to 55-60kwpm at 2028-en , also focuse on CoWoS-L an CoWoS-R.
Exhibit 8: We expect TSMC's CoWoS capacity to build furt er to 260kwpm in 2028, wit OSAT (ASE/SPIL/Amkor) toget er building to 110kwpm
Exhibit 9: We expect TSMC's CoPoS capacity to build furt er to 5-10kwpm in 2028 and 10-20kwpm in 2029, but t is mig t depend on results from trial production
Source: Company data, Morgan Stanley Researc (e) estimates Source: Morgan Stanley Researc (e) estimates
What about Intel EMIB capacity build?
For Intel, we see current average EMIB-M capacity of 110kwpm falling slightly to 95kwpm in 2027 as it converts some towar EMIB-T. We see the major customers of EMIB-M being Trainium3, upcoming Trainium 4 an its in-house server CPU. Average EMIB-T capacity is aroun 5kwpm in 2026, which we expect to further scale to 15-20kwpm in 2027 an 4045kwpm in 2028. All of the capacity mentione above is converte for 12-inch wafer equivalent, which we believe woul be much more easier to communicate with compare to TSMC CoWoS capacity.
Although some small projects are ongoing, we still see Me iaTek/Google Humufish consuming most of the capacity uring 2027-28. We maintain our view that Intel EMIB-T
M Idea
coul still pro uce close to 3mn units of Humufish from late 2027-28, by assuming 4-5 chips per wafer of EMIB-T.
Exhibit 0: We expect Intel's EMIB-T capacity to reac 20kwpm in 2027 and 45kwpm in 2028; EMIB-M capacity is currently at 110kwpm, w ic could fall to 95kwpm due to conversion
Intel EMIB Capacity (Average)
Source: Morgan Stanley Researc (e) estimates
In ee , we have seen some TSMC customers surveying (testing vehicles) Intel EMIB-T ue to the esign for larger chip size, lower cost, an intention to seek a secon source because TSMC's CoWoS capacity is still relatively tight. However, we believe TSMC coul still try to expan its packaging size by leveraging ifferent technologies to meet customers' nee s. We think it remains concerne about whether it is going to open its front-en computing ie pro uction/know-how to its competitor, Intel, for back-en packaging.
Our prediction of the trend after 2028 - TSMC might:
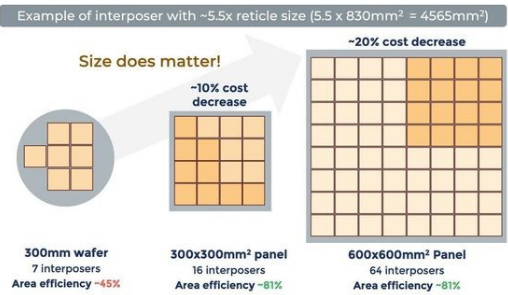
- Pull in CoPoS (panel-level process) with both 300mm an 500mm square panel size
- Intro uce 3.5D packaging with SoIC for vertical chip stacking (Meta MTIA is surveying)
- A opt glass core substrate to solve warpage for >9.7x reticle-size chips
M Idea
Exhibit : TSMC's roadmap for interposer size
Source: Winway, TSMC
Pros and cons of TSMC's CoWoS, Intel's EMIB, TSMC's CoPoS, and SoIC
TSMC's CoWoS, Intel's EMIB, TSMC's CoPoS, an TSMC's SoIC represent ifferent points along the a vance packaging spectrum, each optimizing for a ifferent balance of ban wi th, cost, scalability an integration complexity. We think future esign of the chips is likely to combine these approaches-for example, using CoWoS for lateral integration an SoIC for vertical stacking-to achieve optimal system-level performance.
Exhibit 2: Comparison between TSMC's CoWoS, CoPoS, SoIC, and Intel's EMIB-T
| CoWoS | CoPoS | SoIC | EMIB | |
|---|---|---|---|---|
| Packaging solutions | 2.5D Wafer level | 2.5D Panel level | 3D Chip/die stacking | 2.5D Substrate level |
| Performance (data bandwidth) | High | Low | Highest | Low |
| Efficiency for large chip (use of the subrate area) | Low | High | NA | High |
| Production sweet spot of the chip size | <9.7x reticle size | >9.7x reticle size | >9.7x reticle size | >9.7x reticle size |
| Cost at 9.7x retical size (including yield issue) | High | Theoretical low | Highest | Theoretical low |
| Technology maturity (opposite of execution risk) | High | Low | Medium | Low |
| Thermal challenge | Medium | Theoretical low | Highest | Theoretical low |
| Overview | CoWoS excels in high-bandwidth 2.5D integration but is costly and capacity- limited | CoPoS targets large-scale, cost- efficient integration but is still maturing | SoIC delivers the highest performance through 3D stacking at the expense of complexity and thermal constraints | EMIB offers a more cost-effective and modular alternative with some performance trade-offs |
| Strategic consideration from customers | Strategic consideration from customers | Strategic consideration from customers | Strategic consideration from customers | Strategic consideration from customers |
| Pros | Reliable and time to market | Cost efficient with larger chip size | Breakthrough the planar constraints | Cost efficient with larger chip size |
| Cons | Higher Cost | Not currently avaiable at TSMC | High cost with thermal issue | Execution Risk |
Source: Company data, Morgan Stanley Researc
In summary,
M Idea
- CoWoS excels in high-ban wi th 2.5D integration but is costly an capacity-limite
- EMIB offers a more cost-effective an mo ular alternative with some performance tra e-offs
- CoPoS targets large-scale, cost-efficient integration but is still maturing
- SoIC elivers the highest performance through 3D stacking at the expense of complexity an thermal constraints.
Exhibit 3: CoWoS, CoPoS and FoPLP comparison
COMPARISON OF WLP AND PLP FOR LARGE PACKAGE SIZE
Source: Panel Level Packaging 2025 report, Yole Group
wwwyolegroup.com | ©Yole Group 2025
Source: Yole
Exhibit 4: Intel's EMIB s ould easily support larger c ips wit more reticles (>12) if its supply c ain can execute well
Source: Intel M Idea
UMC is well positioned for Silicon Photonic IC (PIC) foundry
In our previous Foun ry Floorplan, we presente a constructive view on UMC given its AIrelate revenue. Management in icate AI revenue of US$300mn this year (3-5% of revenue), potentially more than tripling to US$1bn in three years (2029).
UMC has a capacity expansion plan to capture AI eman , inclu ing a clean room for a vance packaging for AI chips, such as wafer-on-wafer an memory-on-memory stacking.
Some investors remain on the si elines ami ongoing smartphone an PC eman weakness, an we have seen some or er cuts of PC semis recently. Some think a UMC price hike in 2027 woul n't go through, but we see two growth rivers helping it successfully hike wafer price for 8-inch in 2027: 1) Samsung DDI outsourcing, an 2) growing SiPh PIC eman , in particular after UMC intro uce its 400Gb per lane solution (PIC + TFLN) solution.
How UMC is differentiated in PIC foundry
Accor ing to UMC, InP an TFLN are the two most promising solutions, as they are much more mature than the other conten ers. InP is facing severe shortage, a ing to TFLN's momentum.
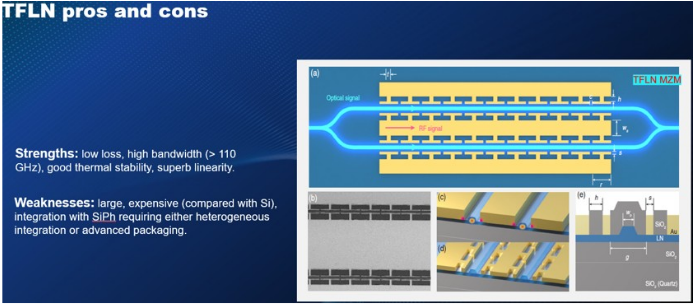
UMC Group's TFLN program starte in 2021 with 6' in mass pro uction an 8' in sampling. TFLN's strengths inclu e low loss, high ban wi th (> 110 GHz), goo thermal stability, an strong linearity.
Integrating TFLN with PIC is a challenge as well as an opportunity. A vance packaging schemes an micro transfer printing are both seen as promising can i ates. UMC is eveloping the integration technology, leveraging its expertise in PIC, TFLN, an a vance packaging.
A option of higher-performance mo ulators (TFLN/InP) an improvement in photo io es are key factors affecting eployment of plain-vanilla (non-WDM, IM/DD) DCIs with 400 Gbps/channel performance an beyon , which is very close to TSMC's mainstream PIC technology Micro Ring.
Exhibit 5: UMC differentiates in TFLN process offering for PIC
Source: UMC
M Idea
Exhibit 6: TSMC's PIC focus on Micro Ring Modulator
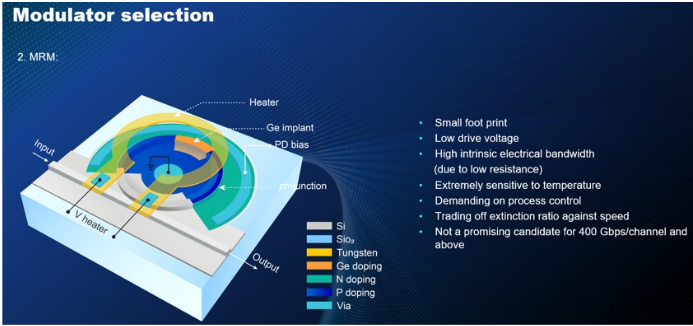
Source: UMC
M Idea
About Foundry Floorplan
In 2011, we first publishe this pro uct (Asia/Pacific Foun ry: The Foun ry Floorplan) to provi e our analysis of foun ry in ustry ynamics. We have resume this practice as global foun ry competition remains active. Foun ry supply is also a critical resource for future AI chips, whether in the global market or China's local market.
Below are prior reports from this series:
- The Foun ry Floorplan: All boats ri ing on the same ti e - mature no e up-cycle begins (19 May 2026)
- The Foun ry Floorplan: TSMC preview up ate; CoWoS vs. EMIB competition (14 Apr 2026)
- The Foun ry Floorplan: Raise TSMC's 2027e an 2028e Capex (9 Mar 2026)
- The Foun ry Floorplan: Up ate on TSMC's 2027 capex; interposer outsourcing to Vanguar ? (13 Jan 2026)
- Asia/Pacific Foun ry: The Foun ry Floorplan, April 2011
M Idea
TSMC: Esti ate and price target revisions
Our earnings forecasts increase 4% for 2026, 5% for 2027 and 3% for 2028: We raise our 2026 revenue forecast an mo estly increase our margin assumptions to reflect stronger-than-expecte 3Q26 performance, riven by robust AI eman , inclu ing sustaine Blackwell shipments. We raise our 2027-28 revenue assumptions by 3%-5%, reflecting the increase in strong lea ing-e ge eman as well as the wafer price hike.
Exhibit 7: TSMC: Estimate revisions
| (NT$ mn) | New 2026e | Old 2026e | Diff.% | New 2027e | Old 2027e | Diff.% | New 2028e | Old 2028e | Diff.% |
|---|---|---|---|---|---|---|---|---|---|
| Net sales | 5,589,451 | 5,438,831 | 3% | 7,471,986 | 7,187,423 | 4% | 9,340,906 | 9,037,662 | 3% |
| Gross profit | 3,779,639 | 3,663,403 | 3% | 5,155,084 | 4,912,038 | 5% | 6,420,040 | 6,219,699 | 3% |
| Operating profit | 3,384,759 | 3,249,517 | 4% | 4,577,529 | 4,342,910 | 5% | 5,739,313 | 5,548,069 | 3% |
| Pretax income | 3,563,509 | 3,425,902 | 4% | 4,685,707 | 4,446,359 | 5% | 5,843,492 | 5,647,518 | 3% |
| Net income | 2,990,329 | 2,880,237 | 4% | 3,960,521 | 3,758,166 | 5% | 4,924,352 | 4,759,400 | 3% |
| Diluted EPS | 115.32 | 111.08 | 4% | 152.74 | 144.93 | 5% | 189.91 | 183.55 | 3% |
| Margins | |||||||||
| Gross margin | 67.6% | 67.4% | 69.0% | 68.3% | 68.7% | 68.8% | |||
| Operating margin | 60.6% | 59.7% | 61.3% | 60.4% | 61.4% | 61.4% | |||
| Pretax margin | 63.8% | 63.0% | 62.7% | 61.9% | 62.6% | 62.5% | |||
| Net margin | 53.5% | 53.0% | 53.0% | 52.3% | 52.7% | 52.7% |
Source: Morgan Stanley Researc (e) estimates
Exhibit 8: TSMC: Quarterly financials
| (NT$ mn) | 1Q25 | 2Q25 | 3Q25 | 4Q25 | 1Q26 | 2Q26 | 3Q26e | 4Q26e | 2023 | 2024 | 2025 | 2026e | 2027e | 2028e |
|---|---|---|---|---|---|---|---|---|---|---|---|---|---|---|
| Total Revenues Sequential Change | 839,254 -3.4% | 933,792 11.3% | 989,918 6.0% | 1,046,090 5.7% | 1,134,103 8.4% | 1,270,380 12.0% | 1,499,073 18.0% | 1,685,894 12.5% | 2,161,736 | 2,894,308 | 3,809,054 | 5,589,451 | 7,471,986 | 9,340,906 |
| Change vs Year Ago | 41.6% | 38.6% | 30.3% | 20.5% | 35.1% | 36.0% | 51.4% | 61.2% | -4.5% | 33.9% | 31.6% | 46.7% | 33.7% | 25.0% |
| Cost of Sales | (345,859) | (386,423) | (401,375) | (394,104) | (382,808) | (410,070) | (486,890) | (530,044) | (986,625) 45.6% | (1,269,954) | (1,527,760) | (1,809,812) 32.4% | (2,316,902) 31.0% | (2,920,866) 31.3% |
| Percent of Revenues | 41.2% 493,395 58.8% | 41.4% 547,369 | 40.5% | 37.7% | 33.8% | 32.3% | 32.5% | 31.4% | 43.9% | 40.1% | 6,420,040 | |||
| Gross Profit Gross Margin Total Opex Percent of Revenues R&D Percent of Revenues | (86,314) 10.3% (56,547) 6.7% (29,767) 1.1% 53.6% | 58.6% (83,946) 9.0% | 588,543 59.5% (87,858) | 651,987 62.3% (87,084) 8.3% (64,858) 6.2% | 751,295 66.2% (92,329) 8.1% (67,757) 6.0% | 860,311 67.7% (93,708) 7.4% | 1,012,184 67.5% (101,410) 6.8% | 1,155,849 68.6% (107,433) 6.4% (80,146) 4.8% | 1,175,111 54.4% (253,645) 11.7% (182,370) 8.4% | 1,624,354 56.1% (302,301) 10.4% (204,182) 7.1% | 2,281,294 59.9% (345,202) 9.1% (246,427) 6.5% | 3,779,639 67.6% (394,880) 7.1% (298,195) 5.3% | 5,155,084 69.0% (577,555) 7.7% (356,300) 4.8% | 68.7% (680,727) 7.3% (400,500) 4.3% |
| SG&A Sequential Change Change vs Year Ago Operating Income | 407,081 48.5% | (61,280) 6.6% (22,666) -23.9% -3.6% 463,424 | 8.9% (63,742) 6.4% (24,116) 6.4% -6.5% 500,685 | (22,227) -7.8% -24.5% 564,902 54.0% | (24,573) 10.6% -17.4% 658,966 | (73,146) 5.8% (20,562) -16.3% -9.3% | (77,146) 5.1% (24,263) 18.0% 0.6% 910,774 | (27,287) 12.5% 22.8% 1,048,416 | (71,275) | (98,119) 1,322,053 45.7% | (98,775) 1,936,092 50.8% | (96,685) 3,384,759 60.6% | (221,255) 4,577,529 61.3% | (280,227) |
| Percent of Revenues Non-operating Income(Loss) Profit Before Taxes | 23,815 430,895 | 49.6% 29,612 | 50.6% 24,684 53.1% | 27,461 | 58.1% | 766,603 60.3% | 60.8% 27,045 | 62.2% 27,045 | 921,466 42.6% 57,706 | 83,786 | 105,571 | 178,750 | 108,179 | 5,739,313 61.4% 104,179 |
| Percent of Revenues | 51.3% | 493,035 52.8% | 525,369 | 592,363 56.6% | 28,834 687,800 | 95,827 862,430 | 937,819 62.6% | 1,075,461 63.8% | 979,171 45.3% | 1,405,839 48.6% | 2,041,663 53.6% | 3,563,509 63.8% | 4,685,707 62.7% | 5,843,492 |
| Taxes Tax Rate | (70,163) 16.3% | 19.4% | (73,614) 14.0% | (86,948) 14.7% | 60.6% | 67.9% (155,649) | (140,673) 15.0% | (161,319) 15.0% | (233,407) 16.6% | (326,266) 16.0% | (572,639) 16.1% | 15.5% | 62.6% (919,140) 15.7% | |
| (95,542) | (114,998) 16.7% | 18.0% | (141,404) 14.4% | (725,186) | ||||||||||
| Net Income, Cont Ops | 360,733 | 397,493 | 451,755 546 | 505,415 | 572,801 | 797,146 0 | 914,141 | 837,768 | 1,172,432 | 2,990,870 | 3,960,521 | |||
| Minority Interest | 831 | 780 | 329 | 706,781 | 1,715,397 | 4,924,352 | ||||||||
| (219) | 0 | 730 | 2,486 | |||||||||||
| Reported Income (TW | 361,564 43.1% | 42.7% | 452,301 45.7% | (322) | 53.2% | 54.2% | 838,498 | (541) | 0 | 52.7% | ||||
| Percent of Revenues | 398,273 | 797,146 | 914,141 | 38.8% | 836 | 1,717,883 | 2,990,329 | 0 | ||||||
| GAAP) | 505,744 | 572,480 | 706,562 | 1,173,268 40.5% | 45.1% | 53.5% | 3,960,521 53.0% | 4,924,352 | ||||||
| 60.3% | 60.7% | 39.1% | 48.3% | 50.5% 58.3% | 55.6% | 80.8% | 74.1% | |||||||
| Change vs Year Ago | 76.2% | |||||||||||||
| 35.0% | -17.5% | 46.4% | 32.4% | 24.3% | ||||||||||
| 15.36 | 22.08 | 30.74 | 35.25 | 39.9% | 189.91 | |||||||||
| Reported EPS (NT$, TW GAAP) | 13.94 | 17.44 | 19.50 | 77.4% | 32.34 | |||||||||
| 27.25 | 45.25 | 66.25 | 115.32 | 152.74 | ||||||||||
| Basic shares (mn units) | 25,927 | 25,928 | 25,929 | 25,930 | 25,931 | 25,931 | 25,931 | 25,931 | ||||||
| 25,928 | 25,931 | 25,929 | 25,928 | 25,928 | 25,930 |
Source: Company data, Morgan Stanley Researc (e) estimates Our PT increases to T$3,088 from T$2,988, riven primarily by our estimate revisions. Our PT implies a 20x P/E multiple on our new 2027 EPS forecast. TSMC currently tra es at 17x that estimate, close to its average NTM P/E of 16.5x since 2018. We fin the stock attractive at current levels.
We continue to erive our 12-month price target (base-case scenario) using a resi ual income valuation framework. Our key assumptions are unchange , inclu ing a cost of equity of 9.2% (beta of 1.2, equity risk premium of 6.0%, an risk-free rate of 2.0%), an interme iate growth rate of 10.5%, an a terminal growth rate of 4%.
Our bull an bear case scenario values increase to NT$3,720 (from NT$3,600) an NT $1,700 (from NT$1,645), respectively.
M Idea
Exhibit 9: TSMC: Residual income model
| 2026e | 2027e | 2028e | 2029e | 2030e | 2031e | 2032e | 2033e | 2034e | 2035e | 2036e | 2037e | |
|---|---|---|---|---|---|---|---|---|---|---|---|---|
| Total Equity | 7,887,536 | 11,096,019 | 15,060,873 | 18,543,374 | 22,391,538 | 26,643,760 | 31,342,464 | 36,534,533 | 42,271,769 | 48,611,415 | 55,616,723 | 63,357,589 |
| Net Profit | 2,990,329 | 3,960,521 | 4,924,352 | 5,441,409 | 6,012,757 | 6,644,096 | 7,341,726 | 8,112,607 | 8,964,431 | 9,905,696 | 10,945,794 | 12,095,103 |
| ROAE | 44.8% | 41.7% | 37.7% | 32.4% | 29.4% | 27.1% | 25.3% | 23.9% | 22.8% | 21.8% | 21.0% | 20.3% |
| Residual Income | 1,944,291 | 2,565,485 | 3,157,086 | 3,491,900 | 3,741,525 | 4,007,915 | 4,295,590 | 4,608,548 | 4,950,628 | 5,325,712 | 5,737,863 | 6,191,417 |
| Spread | 35.6% | 32.5% | 28.5% | 23.2% | 20.2% | 17.9% | 16.1% | 14.7% | 13.6% | 12.6% | 11.8% | 11.1% |
| Ending Equity Capital | 7,887,536 | |||||||||||
| PV of Forecast Period | 25,153,069 | |||||||||||
| PV of Continuing Value | 47,029,569 | |||||||||||
| Equity Value | 80,070,174 | |||||||||||
| No. of Shares | 25,930 | |||||||||||
| Projected Price (NT$) | 3,088 |
Source: Company data, Morgan Stanley Researc (e) estimates
Exhibit 20: TSMC's one-year forward P/E: Valuation does not appear stretc ed as a key AI semi enabler
2012 2013 2014 2015 2016 2017 2018 2019 2020 2021 2022 2023 2024 2025 2026
Source: Company data, FactSet, Morgan Stanley Researc
Exhibit 2 : TSMC - P/B vs. ROE
Source: Company data, Refinitiv, Morgan Stanley Researc
M Idea
Risk Reward - TSMC (2330.TW) Risk Reward - TSMC (2330.TW)
Expect 40-45% revenue growth in 2026; OW
NT$3,088.00 PRICE TARGET
Base case, residual income model. Key assumptions: a cost of equity of 9.2% (beta of 1.2, riskfree rate of 2.0% and risk premium of 6.0%), an intermediate growth rate of 10.5%, and a terminal growth rate of 4.0%.
NT$3,113.97
MS PT
Mean Morgan Stanley Estimates
Consensus Price Target Distribution
NT$2,010.00
NT$3,800.00
Source: Refinitiv, Morgan Stanley Research
RISK REWARD CHART
Key: Historical Stock Performance Current Stock Price Price Target
Source: Refinitiv, Morgan Stanley Research
BULL CASE
BASE CASE
OVERWEIGHT THESIS
- ▪Reflecting robust AI capex guidance from global CSPs, we are OW on TSMC.
- ▪Our estimates reflect TSMC' s strong profitability and another year of >40% Y/Y revenue growth seen for 2026.
- ▪Leading-edge (7nm below) demand remains robust.
- ▪Reflecting increased bargaining power, long-term margin expansion, and sustainable AI semi demand, we expect the stock to rerate to our implied 2027e target P/E of 20x.
Consensus Rating Distribution
Risk Reward Themes
| New Data Era: | Positive |
|---|---|
| Pricing Power: | Positive |
| Secular Growth: | Positive |
View descriptions of Risk Rewards Themes here
BEAR CASE
24x 2027e EPS
TSMC dominates foundry services: 1) Breakthrough in EUV tech and materials accelerates node migration to 3nm and beyond. 2) Intel outsources its server CPU production to TSMC sooner than expected. 3) Intel or Samsung exits leading-edge foundry business. 4) New tech megatrends such as 6G or AI drive global semi revenue growth and increase demand for leading edge nodes. 5) Cost per transistor decreases further along with node migration.
20x 2027e EPS
Leading position in leading-edge logic foundry services with some gross margin expansion: 1) Global semi revenue CAGR is sustained in the high single digits in 202528. 2) TSMC continues to lead in market share in 16nm, 7nm, 5nm, 3nm, and 2nm. 3) It continues to observe robust AI-related demand. 4) Cost per transistor does not decrease meaningfully in 3nm and 2nm, while capex per k is more demanding than for 7nm and 5nm.
11x 2027e EPS
TSMC's dominance in foundry business erodes: 1) Global ex-memory semi revenue growth is weaker than expected in 2025-28. 2) Declining trailing-edge market share causes revenue shortfall. 3) Intel's contribution is weaker than expected. Intel and/or Samsung successfully develop leading-edge process technology. 4) Intel's foundry business execution proves successful and weighs on TSMC with order competition. 5) Demand for 2nm is less than expected given high transistor cost for foundry customers.
NT$1,700.00
NT$3,720.00
NT$3,088.00
M Idea
Risk Reward - TSMC (2330.TW)
KEY EARNINGS INPUTS
| Drivers | Dec 2025 | Dec 2026eDec | 2027eDec | 2028e |
|---|---|---|---|---|
| Revenue from 5nm Geometry (NT$, mn) | 1,179,907 | 1,388,663 | 1,154,712 | 1,147,783 |
| Revenue from 10/7nm Geometry (NT$, mn) | 459,258 | 534,422 | 542,812 | 540,706 |
| Revenue from 16/20nm Geometry (NT$, mn) | 220,027 | 294,906 | 329,278 | 347,256 |
INVESTMENT DRIVERS
- Moore's Law migration (chip scaling) and alternative technologies
- Capex intensity - cost of building leading-edge foundry capacity
- Bargaining power with key equipment vendors
- Transistor cost for customers
- ROI for leading-edge foundry
GLOBAL REVENUE EXPOSURE
Source: Morgan Stanley Research Estimate View explanation of regional hierarchies here
MS ALPHA MODELS
| 1/5 3 Month |
|---|
| MOST Horizon |
Source: Refinitiv, FactSet, Morgan Stanley Research; 1 is the highest favored Quintile and 5 is the least favored Quintile
RISKS TO PT/RATING
RISKS TO UPSIDE
- TSMC charging large customers more to keep its gross margin above 56% in the long term
- AI semi demand growing more significantly than expected while TSMC maintains high market share in leading-edge foundry business
- Outsourcing from Intel CPU increasing over 2025-27
RISKS TO DOWNSIDE
- Inventory correction in 2026
- Weakening demand for leading edge technologies
- Costs of overseas fabs growing significantly
OWNERSHIP POSITIONING
Inst. Owners, % Active
75.9%
Source: Refinitiv, Morgan Stanley Research
MS ESTIMATES VS. CONSENSUS
Source: Refinitiv, Morgan Stanley Research M Idea
TSMC: Financial su ary
Exhibit 22: TSMC: Financial Summary
| Income Statement, 2024-2028e, Year End Dec - (NT$ mn) | Income Statement, 2024-2028e, Year End Dec - 2024 | Income Statement, 2024-2028e, Year End Dec - 2025 | Income Statement, 2024-2028e, Year End Dec - 2026e | Income Statement, 2024-2028e, Year End Dec - 2027e | Income Statement, 2024-2028e, Year End Dec - 2028e | Balance Sheet, 2024-2028e, Year End Dec (NT$ 2026e 2027e - mn) | Balance Sheet, 2024-2028e, Year End Dec (NT$ 2026e 2027e - 2024 | Balance Sheet, 2024-2028e, Year End Dec (NT$ 2026e 2027e - 2025 | Balance Sheet, 2024-2028e, Year End Dec (NT$ 2026e 2027e | Balance Sheet, 2024-2028e, Year End Dec (NT$ 2026e 2027e | Balance Sheet, 2024-2028e, Year End Dec (NT$ 2026e 2027e - 2028e |
|---|---|---|---|---|---|---|---|---|---|---|---|
| Revenue | 2,894,308 | 3,809,054 | 5,589,451 | 7,471,986 | 9,340,906 | Cash & Equivalent | 2,127,627 | 2,767,856 | 3,661,121 | 5,146,886 | 7,691,797 |
| YoY Growth | 33.9% | 31.6% | 46.7% | 33.7% | 25.0% | MarketableSecurity | 294,393 | 300,738 | 383,795 | 383,795 | 383,795 |
| Gross Profit b/f dep | 2,247,086 | 2,924,669 | 4,539,736 | 6,088,989 | 7,751,511 | A/R & N/R | 272,088 | 281,791 | 531,976 | 660,603 | 799,884 |
| Inventories | 287,869 | 288,109 | 449,213 | 530,763 | 667,572 | ||||||
| Less: COGS | (1,269,954) | (1,527,760) | (1,809,812) | (2,316,902) | (2,920,866) | Other Current Ass. | 106,376 | 178,635 | 221,240 | 221,240 | 221,240 |
| Variable costs | (647,221) | (884,385) | (1,049,715) | (1,382,996) | (1,589,394) | Total current assets | 3,088,352 | 3,817,131 | 5,247,346 | 6,943,287 | 9,764,288 |
| Depreciation & amort | (622,733) | (643,376) | (760,097) | (933,906) | (1,331,471) | Long-term Investment | 149,040 | 172,370 | 227,936 | 227,936 | 227,936 |
| Gross profit | 1,624,354 | 2,281,294 | 3,779,639 | 5,155,084 | 6,420,040 | Total fixed assets | 3,234,980 | 3,691,841 | 5,059,707 | 6,596,943 | 7,782,224 |
| % margin | 56.1% | 59.9% | 67.6% | 69.0% | 68.7% | Total other assets | 219,565 | 251,682 | 279,138 | 279,138 | 279,138 |
| YoY Growth | 38.2% | 40.4% | 65.7% | 36.4% | 24.5% | Total Assets | 6,691,938 | 7,933,024 | 10,814,126 | 14,047,303 | 18,053,586 |
| Operating Expenses: | (302,301) | (345,202) | (394,880) | (577,555) | (680,727) | A/P & N/P | 74,227 | 84,330 | 136,031 | 160,727 | 202,155 |
| R&D | (204,182) | (246,427) | (298,195) | (356,300) | (400,500) | Accrued Expenses | 0 | 0 | 0 | 0 | 0 |
| Sales and Marketing | (13,144) | (16,918) | (20,088) | (37,360) | (46,705) | Other Payable | 531,377 | 630,217 | 871,930 | 871,930 | 871,930 |
| General and Admin | (84,975) | (81,857) | (76,597) | (183,895) | (233,523) | Curr. of L-T Debt | 59,858 | 136,926 | 167,410 | 167,410 | 167,410 |
| Operating Profit | 1,322,053 | 1,936,092 | 3,384,759 | 4,577,529 | 5,739,313 | Other Curr. Liab. | 599,064 | 606,547 | 707,796 | 707,796 | 707,796 |
| % margin | 45.7% | 50.8% | 60.6% | 61.3% | 61.4% | Total Current Liab. | 1,264,525 | 1,458,019 | 1,883,167 | 1,907,863 | 1,949,291 |
| YoY Growth | 43.5% | 46.4% | 74.8% | 35.2% | 25.4% | L-T Liabilities | 926,605 | 856,228 | 815,037 | 815,037 | 815,037 |
| Non-Operating Income | 83,786 | 105,571 | 178,750 | 108,179 | Total 104,179 | Other L-T Liab Total Liabilities | 177,233 2,368,362 | 157,982 2,472,229 | 228,385 2,926,589 | 228,385 2,951,285 | 228,385 2,992,713 |
| Pretax Profit % margin | 1,405,839 48.6% | 2,041,663 53.6% | 3,563,509 63.8% | 4,685,707 62.7% | 5,843,492 62.6% | Common Stocks | 259,327 | 259,325 | 259,324 | 259,324 | 259,324 |
| Tax | (233,407) | (326,266) | (572,639) | Preferred Stocks Capital Reserve | 0 73,261 | 0 73,446 | 0 | 0 72,291 | 0 72,291 | ||
| 1,173,268 | 1,717,883 | 2,990,329 | (725,186) | (919,140) | 3,955,957 | 72,291 7,513,969 | 10,722,452 | ||||
| Reported net Income | 45.25 | 3,960,521 | 4,924,352 | Retained earnings Treasury Stock | 0 | 5,086,825 0 | 14,687,306 0 | ||||
| 66.25 | 115.32 | 152.74 | 189.91 | Minority Equity | 35,031 | 41,199 | 0 41,953 | 0 41,953 | 41,953 | ||
| Reported EPS (NT$) | 115.32 | 4,323,576 | 5,460,795 | 7,887,536 | 15,060,873 | ||||||
| EPS for consensus (NT$) | 45.25 | 66.25 | 152.74 | 189.91 Total | Total Equity Liab. & Equity | 7,933,024 | 10,814,126 | 11,096,019 14,047,303 | |||
| 2024 19% 30% | 2025 23% 35% | 2026e 45% | 2027e 42% | 2028e 38% | Depreciation | 6,691,938 Year End Dec 2024 | 2025 688,096 8,083 | 2026e 3,509 | 2027e 0 | 18,053,586 2028e | |
| Key Ratios, 2024-2028e Return (%) ROAA | 32% | 32% | Net 31% | Cash Flow Statement, 2024-2028e, (NT$ mn) Income Current | 1,173,268 662,797 | 1,717,883 | 2,990,329 816,737 | 3,960,521 983,059 | 4,924,352 1,401,549 | ||
| ROAE OP. ATO | 0.9x | Net Investment Losses (Gains) Decrease (Increase) in Working Capital | 8,205 | 0 | |||||||
| Gearing (x) | 0.7x | 0.7x | 0.8x | 1.0x | Others | 20,896 (38,988) | (17,144) (121,942) | (16,282) (277,252) | (185,482) 0 | 0 | |
| Net Debt/ Equity Current Ratio | -0.33x 2.4x | -0.38x 2.6x | -0.39x 2.8x | -0.41x | Cash -0.47x | Flow-Operating (Purchase) of FA | 1,826,177 (956,007) | 2,274,976 (1,272,411) | 3,517,042 (2,056,340) | 4,758,098 | (234,662) 6,091,239 |
| Quick Ratio | 3.6x | 5.0x | (2,520,295) | (2,586,830) | |||||||
| 1.9x | 2.1x | 2.2x | 3.0x | Sale of Fix Asset | 895 (3,739) | 797 | 1,992 | 0 | |||
| Operating Cycle | 4.4x | (Purchase)L-T Inv. Others | 94,008 (864,843) | 0 127,220 | 0 (4,892) | 0 | 0 0 | ||||
| AR/NR Turnover (days) Inventory Turnover (days) | 29 76 | 26 68 | 26 73 | 29 76 | 28 74 | Cash Flow-Inv. | (1,144,393) | (2,059,239) | 0 (2,520,295) | 0 (2,586,830) | |
| AP Turnover (days) Cash Conversion (days) | 19 | 19 | 22 78 | 23 | 22 80 | Inc(Dec)-S-T Debt Inc(Dec) L-T | 0 | 0 | 0 | 0 | 0 0 |
| Debt | 28,601 | 7,948 | 11,299 | 0 | |||||||
| 87 | 75 | Dividend Paid | (583,480) | (752,039) | (959,498) 0 | ||||||
| Dir.&Emp.Bonus | (363,055) 0 | (466,779) 0 | 0 | 0 | 0 | ||||||
| e = Morgan Stanley Research Source: Company Data, Morgan | 18,486 | (30,604) | |||||||||
| Estimates Stanley | Research | (11,847) | 0 | ||||||||
| 82 | |||||||||||
| (959,498) | |||||||||||
| (752,039) | |||||||||||
| Others | (346,301) | (440,345) | (602,786) | 1,485,764 | |||||||
| Cash Flow-Financing | 640,229 | 893,265 | 3,661,121 | 2,544,911 5,146,886 | |||||||
| Change in Cash | 662,199 | 2,767,856 | 5,146,886 | 7,691,797 | |||||||
| Net cash/(debt), b/f | 1,465,428 | 2,127,627 | |||||||||
| 2,767,856 | 3,661,121 | ||||||||||
| Net cash/(debt), c/f | 2,127,627 |
M Idea
UMC: Esti ate and price target revisions
We raise our 2026, 2027, and 2028 earnings estimates by 56%, 25%, and 31%, respectively: Our 2026e change is ue mostly to strong 2Q26 non-op gains. We increase 2027/28e revenue an EPS ue to new CPO relate business contribution from 12-inch SiPh PIC as well as 8-inch TFLN. Our 2028e increase also inclu es DDI outsource from Samsung foun ry.
Exhibit 23: UMC: Estimate revisions
| (NT$ mn) | New 2026e | Old 2026e | Diff.%New | 2027e | Old 2027e | Diff.%New | 2028e | Old 2028e | Diff.% |
|---|---|---|---|---|---|---|---|---|---|
| Net sales | 279,638 | 271,238 | 3% | 357,846 | 327,483 | 9% | 419,091 | 364,804 | 15% |
| Gross profit | 89,018 | 82,884 | 7% | 123,942 | 108,171 | 15% | 156,862 | 127,311 | 23% |
| Operating profit | 59,975 | 55,860 | 7% | 94,477 | 78,823 | 20% | 122,182 | 95,748 | 28% |
| Pretax income | 97,963 | 65,511 | 50% | 108,645 | 86,614 | 25% | 138,350 | 105,539 | 31% |
| Net income | 88,133 | 56,406 | 56% | 89,233 | 71,242 | 25% | 113,591 | 86,760 | 31% |
| Basic EPS | 7.06 | 4.52 | 56% | 7.15 | 5.70 | 25% | 9.11 | 6.95 | 31% |
| Diluted EPS | 7.02 | 4.49 | 56% | 7.11 | 5.67 | 25% | 9.05 | 6.91 | 31% |
| Margins | |||||||||
| Gross margin | 31.8% | 30.6% | 34.6% | 33.0% | 37.4% | 34.9% | |||
| Operating margin | 21.4% | 20.6% | 26.4% | 24.1% | 29.2% | 26.2% | |||
| Pretax margin | 35.0% | 24.2% | 30.4% | 26.4% | 33.0% | 28.9% | |||
| Net margin | 31.5% | 20.8% | 24.9% | 21.8% | 27.1% | 23.8% |
Source: Morgan Stanley Researc (e) estimates
Exhibit 24: UMC: Quarterly financials
| (NT$ mn) | 1Q26 | 2Q26 | 3Q26e | 4Q26e | 1Q27e | 2Q27e | 3Q27e | 4Q27e | 2024 | 2025 | 2026e | 2027e | 2028e |
|---|---|---|---|---|---|---|---|---|---|---|---|---|---|
| Total Revenues | 61,038 | 68,733 | 73,187 | 76,680 | 83,696 | 88,507 | 93,909 | 91,735 | 232,303 | 237,553 | 279,638 | 357,846 | 419,091 |
| Sequential Change | -1.2% | 12.6% | 6.5% | 4.8% | 9.1% | 5.7% | 6.1% | -2.3% | |||||
| Change vs Year Ago | 5.5% | 17.0% | 23.8% | 24.1% | 37.1% | 28.8% | 28.3% | 19.6% | 4.4% | 2.3% | 17.7% | 28.0% | 17.1% |
| Cost of Sales | (43,219) | (46,410) | (49,399) | (51,592) | (54,705) | (58,395) | (60,907) | (59,896) | (156,649) | (168,647) | (190,620) | (233,904) | (262,228) |
| Gross Profit | 17,818 | 22,323 | 23,789 | 25,088 | 28,991 | 30,111 | 33,002 | 31,838 | 75,654 | 68,906 | 89,018 | 123,942 | 156,862 |
| Gross Margin | 29.2% | 32.5% | 32.5% | 32.7% | 34.6% | 34.0% | 35.1% | 34.7% | 32.6% | 29.0% | 31.8% | 34.6% | 37.4% |
| Total Opex | (6,542) | (7,373) | (7,480) | (7,648) | (7,192) | (7,313) | (7,441) | (7,518) | (24,042) | (24,958) | (29,043) | (29,465) | (34,680) |
| Percent of Revenues | 10.7% | 10.7% | 10.2% | 10.0% | 8.6% | 8.3% | 7.9% | 8.2% | 10.3% | 10.5% | 10.4% | 8.2% | 8.3% |
| R&D | (4,575) | (4,747) | (4,757) | (4,767) | (4,650) | (4,700) | (4,750) | (4,800) | (15,616) | (17,725) | (18,847) | (18,900) | (22,380) |
| Percent of Revenues | 7.5% | 6.9% | 6.5% | 6.2% | 5.6% | 5.3% | 5.1% | 5.2% | 6.7% | 7.5% | 6.7% | 5.3% | 5.3% |
| Sales and Marketing | (689) | (733) | (780) | (817) | (892) | (943) | (1,001) | (978) | (2,701) | (2,433) | (3,020) | (3,815) | (4,610) |
| Percent of Revenues | 1.1% | 1.1% | 1.1% | 1.1% | 1.1% | 1.1% | 1.1% | 1.1% | 1.2% | 1.0% | 1.1% | 1.1% | 1.1% |
| General and Admin | (1,278) | (1,893) | (1,943) | (2,063) | (1,650) | (1,670) | (1,690) | (1,740) | (5,724) | (4,800) | (7,176) | (6,750) | (7,690) |
| Percent of Revenues | 2.1% | 2.8% | 2.7% | 2.7% | 2.0% | 1.9% | 1.8% | 1.9% | 2.5% | 2.0% | 2.6% | 1.9% | 1.8% |
| Operating Income | 11,276 | 14,950 | 16,308 | 17,441 | 21,798 | 22,798 | 25,561 | 24,320 | 51,613 | 43,949 | 59,975 | 94,477 | 122,182 |
| Percent of Revenues | 18.5% | 21.8% | 22.3% | 22.7% | 26.0% | 25.8% | 27.2% | 26.5% | 22.2% | 18.5% | 21.4% | 26.4% | 29.2% |
| Total Non-operating Income(Loss) | 5,367 | 30,236 | 1,192 | 1,192 | 3,392 | 3,492 | 3,592 | 3,692 | 4,607 | 5,699 | 37,987 | 14,168 | 16,168 |
| Profit Before Taxes | 16,644 | 45,186 | 17,500 | 18,633 | 25,190 | 26,290 | 29,152 | 28,012 | 56,220 | 49,648 | 97,963 | 108,645 | 138,350 |
| Percent of Revenues | 27.3% | 65.7% | 23.9% | 24.3% | 30.1% | 29.7% | 31.0% | 30.5% | 24.2% | 20.9% | 35.0% | 30.4% | 33.0% |
| Change vs Year Ago | 78.1% | 345.0% | 19.5% | 20.2% | 51.3% | -41.8% | 66.6% | 50.3% | (9,993) | ||||
| Taxes | (527) | (2,962) | (3,150) | (3,354) | (4,534) | (4,732) | (5,247) | (5,042) | (9,113) | (8,113) | (19,556) | (24,903) | |
| Tax Rate | 3.2% | 6.6% | 18.0% | 18.0% | 18.0% | 18.0% | 18.0% | 18.0% | 16.2% | 16.3% | 10.2% | 18.0% | 18.0% |
| Net Income, Cont Ops | 16,117 | 42,224 | 14,350 | 15,279 | 20,656 | 21,558 | 23,905 | 22,970 | 47,106 | 41,535 | 87,970 | 89,089 | 113,447 |
| Percent of Revenues | 26.4% | 61.4% | 19.6% | 19.9% | 24.7% | 24.4% | 25.5% | 25.0% | 20.3% | 17.5% | 31.5% | 24.9% | 27.1% |
| Minority Interest | 54 | 36 | 36 | 36 | 36 | 36 | 36 | 36 | 105 | 182 | 163 | 145 | 145 |
| Reported Income (TW GAAP) Percent of Revenues | 16,171 26.5% | 42,260 61.5% | 14,386 19.7% | 15,315 20.0% | 20,692 24.7% | 21,594 24.4% | 23,941 25.5% | 23,006 25.1% | 47,211 20.3% | 41,716 17.6% | 88,133 31.5% | 113,591 27.1% | |
| Change vs Year Ago | 107.9% | 374.7% | -4.0% | 52.3% | 28.0% | -48.9% | 66.4% | 50.2% | -22.6% | -11.6% | 111.3% | 89,233 24.9% | 27.3% |
| Reported diluted EPS (NT$, TW GAAP) | 1.29 | 3.37 | 1.15 | 1.22 | 1.65 | 1.72 | 1.91 | 1.83 | 3.76 | 3.32 | 7.02 | 1.2% 7.11 | 9.05 |
| 1.29 | 3.39 | 1.15 | 1.23 | 1.66 | 7.06 | 7.15 | 9.11 | ||||||
| Reported Basic EPS (NT$, GAAP) | 1.73 | 1.92 | 1.84 | 3.80 | 3.34 |
Source: Company data, Morgan Stanley Researc (e) estimates
We raise our price target to T$188 from T$138: We continue to erive our price target (base case scenario value) from a resi ual income mo el, as we believe it best represents the value of the company. Besi es our estimate increases, we raise our interme iate growth rate from 12.5% to 13.5% ue to structural changes in the in ustry's supply/ eman ynamics. Other key assumptions are unchange , inclu ing a cost of M Idea equity of 9.2% (beta of 1.2, equity risk premium of 6%, an risk-free rate of 2%), an terminal growth rate of 3%.
Our bull case scenario value increases from NT$200 to NT$270, an our bear case value rises from NT$70 to NT$95, implying 7.5x an 2.6x 2027e BVPS, respectively.
Exhibit 25: UMC: Residual income model
| (NT$ mn) | 2026e | 2027e | 2028e | 2029e | 2030e | 2031e | 2032e | 2033e | 2034e | 2035e | 2036e | 2037e |
|---|---|---|---|---|---|---|---|---|---|---|---|---|
| Total Equity | 441,934 | 464,221 | 510,031 | 569,076 | 635,797 | 711,191 | 796,387 | 892,658 | 1,001,444 | 1,124,372 | 1,263,281 | 1,420,249 |
| Net Profit | 88,133 | 89,233 | 113,591 | 128,358 | 145,045 | 163,901 | 185,208 | 209,285 | 236,492 | 267,236 | 301,976 | 341,233 |
| ROAE | 21.4% | 19.7% | 23.3% | 23.8% | 24.1% | 24.3% | 24.6% | 24.8% | 25.0% | 25.1% | 25.3% | 25.4% |
| Residual Income | 46,528 | 46,381 | 65,542 | 74,412 | 84,658 | 96,233 | 109,312 | 124,088 | 140,785 | 159,650 | 180,966 | 205,052 |
| Spread | 12.2% | 10.5% | 14.1% | 14.6% | 14.9% | 15.1% | 15.4% | 15.6% | 15.8% | 15.9% | 16.1% | 16.2% |
| Ending Equity Capital | 441,934 | |||||||||||
| PV of Forecast Period | 624,556 | |||||||||||
| PV of Continuing Value | 1,293,778 | |||||||||||
| Equity Value | 2,360,268 | |||||||||||
| No. of Shares | 12,556 | |||||||||||
| Projected Price (NT$) | 188.0 |
Source: Morgan Stanley Researc (e) estimates.
Exhibit 26: UMC's one-year forward P/B band
Source: FactSet, Morgan Stanley Researc estimates
M Idea
Risk Reward - UMC (2303.TW) Risk Reward - UMC (2303.TW)
Wafer prices on the rise; OW
NT$188.00 PRICE TARGET
Base case, residual income model. Key assumptions: 9.2% cost of equity, 13.5% medium-term growth, and 3.0% terminal growth.
NT$128.90
Consensus Price Target Distribution
Source: Refinitiv, Morgan Stanley Research
RISK REWARD CHART AND OPTIONS IMPLIED PROBABILITIES (12M)
Key: Historical Stock Performance Current Stock Price Price Target
Source: Refinitiv, Morgan Stanley Research, Morgan Stanley Institutional Equities Division. The probabilities of our Bull, Base, and Bear case scenarios playing out were estimated with implied volatility data from the options market as of 5 Oct 2026. All figures are approximate risk-neutral probabilities of the stock reaching beyond the scenario price in either three-months ' or one-years ' time. View explanation of Options Probabilities methodology here
BULL CASE
BASE CASE
OVERWEIGHT THESIS
- ▪We are OW as we see structural changes in the mature node industry's supply/demand dynamics.
- ▪Its foundry quality is comparable to TSMC's in mature nodes. Along with specialty technologies, this could help offset part of the margin downside.
- ▪Non-AI market recovery remains uncertain in 2027, yet UMC should still benefit from strong AI-related demand spillover from its foundry peers.
- ▪12nm FinFET development is strategic. It should be one of UMC's long-term strengths, notably when Chinese foundries
- cannot effectively expand FinFET capacity.
- ▪The stock now trades at 4.1x 2027e BVPS.
- That is well above its historical average since 2009, but our price target implies 5.1x.
Consensus Rating Distribution
Source: Refinitiv, Morgan Stanley Research
Risk Reward Themes
New Data Era:
Positive
Pricing Power:
Negative
Secular Growth:
Positive
View descriptions of Risk Rewards Themes here
BEAR CASE
7.5x 2027e BVPS
Stabilized semi demand; better-thanexpected 8-inch and trailing-edge 12-inch demand: 1) Global semi sales grow >15% Y/Y in 2026, and ex-TSMC foundry industry grows >10% Y/Y; 2) UMC gains share in both 8- and 12-inch wafers thanks to technology differentiation; 3) UMC receives more outsourcing from customers, which helps fill 22/28nm capacity and lifts blended wafer ASP; 4) traction increases for UMC's 12nm/14nm FinFET technologies.
5.2x 2027e BVPS
Healthy semi growth; improving demand for 8-inch and trailing-edge 12-inch: 1) Global semi sales grow ~15% in 2026 and ex-TSMC foundry industry grows 3-5% Y/Y; 2) 8-inch utilization rate is above 75% with steady 12inch demand amid semi inventory digestion; 3) UMC hikes wafer prices slightly in response to strong AI-related demand.
2.6x 2027e BVPS
Significant semi industry decline; 8-inch and trailing-edge 12-inch face weakening demand: 1) Global semi sales grow only <5% in 2026; 2) display semi and power semi demand deteriorates further; 3) significant wafer pricing erosion given low fab utilization and mature node peers' competition; 4) depreciation ramp-up of more than 30% Y/Y in 2026 without sufficient wafer order inflow to sustain UMC's gross margin.
NT$95.00
NT$270.00
NT$188.00
M Idea
Risk Reward - UMC (2303.TW)
KEY EARNINGS INPUTS
| Drivers | Dec 2025 | Dec 2026eDec | 2027eDec | 2028e |
|---|---|---|---|---|
| Wafer shipment (K, 8 inch equivalent) (NT$, mn) | 8,741 | 10,052 | 11,463 | 11,927 |
| Wafer ASP (USD) (NT$, mn) | 824 | 862 | 976 | 1,099 |
| Utilization rate (%) (%) | 75.2 | 83.4 | 92.0 | 92.8 |
INVESTMENT DRIVERS
- Semiconductor end-demand
- Outsourcing orders from IDM customers
- Ramp-up of new capacity
GLOBAL REVENUE EXPOSURE
Source: Morgan Stanley Research Estimate View explanation of regional hierarchies here
MS ALPHA MODELS
| 3/5 | 3 Month |
|---|---|
| MOST | Horizon |
Source: Refinitiv, FactSet, Morgan Stanley Research; 1 is the highest favored Quintile and 5 is the least favored Quintile
RISKS TO PT/RATING
RISKS TO UPSIDE
- Stronger-than-expected global economic and semiconductor growth
- Looser pricing competition, increasing margins and utilization rates
- Favorable customer mix changes
RISKS TO DOWNSIDE
- Softer-than-expected global economic and semiconductor growth
- Increasing pricing competition, reducing margins and utilization rates
- Unfavorable customer mix changes
OWNERSHIP POSITIONING
Inst. Owners, % Active
70.1%
Source: Refinitiv, Morgan Stanley Research
MS ESTIMATES VS. CONSENSUS
Source: Refinitiv, Morgan Stanley Research M Idea
UMC: Financial su ary
Exhibit 27: UMC: Financial Summary
| Income Statement, 2024-28e, (NT$ mn) | Year End Dec 2024 | 2025 | 2026e | 2027e | 2028e |
|---|---|---|---|---|---|
| Turnover | 232,303 | 237,553 | 279,638 | 357,846 | 419,091 |
| YoY Growth | 4.4% | 2.3% | 17.7% | 28.0% | 17.1% |
| Less: COGS | (156,649) | (168,647) | (190,620) | (233,904) | (262,228) |
| Variable costs | (111,866) | (114,015) | (128,161) | (165,143) | (193,273) |
| Depreciation & amort | (44,782) | (54,631) | (62,459) | (68,761) | (68,956) |
| Gross profit | 75,654 | 68,906 | 89,018 | 123,942 | 156,862 |
| YoY Growth | -2.7% | -8.9% | 29.2% | 39.2% | 26.6% |
| % margin | 32.6% | 29.0% | 31.8% | 34.6% | 37.4% |
| Operating Expenses: | (24,042) | (24,958) | (29,043) | (29,465) | (34,680) |
| R&D | (15,616) | (17,725) | (18,847) | (18,900) | (22,380) |
| Sales and Marketing | (2,701) | (2,433) | (3,020) | (3,815) | (4,610) |
| General and Admin | (5,724) | (4,800) | (7,176) | (6,750) | (7,690) |
| Operating Profit | 51,613 | 43,949 | 59,975 | 94,477 | 122,182 |
| YoY Growth | -10.8% | -14.8% | 36.5% | 57.5% | 29.3% |
| % margin | 22.2% | 18.5% | 21.4% | 26.4% | 29.2% |
| Total Non-op | 4,607 | 5,699 | 37,987 | 14,168 | 16,168 |
| Pretax Profit | 56,220 | 49,648 | 97,963 | 108,645 | 138,350 |
| YoY Growth | -20.7% | -11.7% | 97.3% | 10.9% | 27.3% |
| % margin | 24.2% | 20.9% | 35.0% | 30.4% | 33.0% |
| Tax | (9,113) | (8,113) | (9,993) | (19,556) | (24,903) |
| Reported Net Income | 47,211 | 41,716 | 88,133 | 89,233 | 113,591 |
| Reported EPS (NT$) | 3.76 | 3.32 | 7.02 | 7.11 | 9.05 |
| ModelWare EPS (NT$) | 3.76 | 3.32 | 7.02 | 7.11 | 9.05 |
| Key Ratios | 2024 | 2025 | 2026e | 2027e | 2028e |
| Return (%) | |||||
| ROAA | 8.4% | 7.3% | 14.2% | 13.2% | 15.9% |
| ROAE | 12.8% | 11.0% | 21.4% | 19.7% | 23.3% |
| OP. ATO | 53.3% | 54.5% | 56.2% | 69.7% | 79.3% |
| Gearing (x) | |||||
| Net Debt/ Equity | (0.1x) | (0.2x) | (0.1x) | (0.2x) | (0.2x) |
| Current Ratio | 2.5x | 2.3x | 2.1x | 2.4x | 2.8x |
| Quick Ratio | 1.8x | 1.6x | 1.4x | 1.7x | 2.1x |
| Operating Cycle | |||||
| AR/NR Turnover (days) | 49 | 49 | 48 | 48 | 48 |
| Inventory Turnover (days) | 84 | 79 | 76 | 71 | 72 |
| AP Turnover (days) | 17 | 18 | 18 | 17 | 17 |
| Cash Conversion (days) | 115 | 110 | 106 | 102 | 103 |
e = Morgan Stanley Research Estimates Source: Company Data, Morgan Stanley Research M Idea
| Balance sheet (NT$ mn) | 2024 | 2025 | 2026e | 2027e | 2028e |
|---|---|---|---|---|---|
| Assets | |||||
| Cash & Equivalent | 105,000 | 110,660 | 111,350 | 129,380 | 169,460 |
| MarketableSecurity | 606 | 569 | 550 | 550 | 550 |
| A/R & N/R | 33,343 | 31,274 | 43,117 | 51,582 | 60,478 |
| Inventories | 36,408 | 37,934 | 42,756 | 49,638 | 55,329 |
| Other Current Ass. | 11,983 | 20,850 | 24,811 | 24,811 | 24,811 |
| Total current assets | 189,678 | 204,783 | 225,667 | 259,044 | 313,710 |
| LT Investment | 72,487 | 75,373 | 148,847 | 152,847 | 156,847 |
| Total Fixed Assets | 279,059 | 271,395 | 260,798 | 247,324 | 235,805 |
| Total Other Assets | 28,976 | 27,445 | 29,654 | 29,654 | 29,654 |
| Total Assets | 570,201 | 578,996 | 664,966 | 688,869 | 736,016 |
| A/P & N/P | 7,633 | 9,170 | 10,040 | 11,656 | 12,992 |
| Accrued Expenses | 281 | 229 | 148 | 148 | 148 |
| Other Payable | 34,626 | 36,128 | 66,392 | 66,392 | 66,392 |
| Total Current Liab. | 75,260 | 87,598 | 107,289 | 108,905 | 110,242 |
| L-T Liabilities | 55,533 | 45,372 | 45,566 | 45,566 | 45,566 |
| Total Other L-T Liab | 61,222 | 66,170 | 70,177 | 70,177 | 70,177 |
| Total Liabilities | 192,016 | 199,141 | 223,032 | 224,648 | 225,985 |
| Common Stocks | 125,607 | 125,882 | 125,770 | 125,770 | 125,770 |
| Preferred Stocks | |||||
| Capital Reserve | 14,782 | 15,410 | 15,871 | 15,871 | 15,871 |
| Retained earnings | 237,539 | 238,477 | 303,384 | 325,671 | 371,482 |
| Treasury Stock | 0 | 0 | (3,096) | (3,096) | (3,096) |
| Total Equity | 378,185 | 379,855 | 441,934 | 464,221 | 510,031 |
| Cash Flow Statement (NT$ mn) | 2024 | 2025 | 2026e | 2027e | 2028e |
|---|---|---|---|---|---|
| Net Income, continued ops | 47,106 | 41,535 | 87,970 | 89,089 | 113,447 |
| Depreciation | 48,168 | 59,259 | 66,947 | 74,149 | 74,359 |
| Net Investment Losses (Gains) | (72) | (99) | (37) | 0 | 0 |
| Others | (3,426) | (2,954) | (44,667) | (17,731) | (17,250) |
| Cash Flow-Operating | 93,872 | 99,864 | 110,250 | 145,507 | 170,556 |
| (Purchase) of FA | (88,544) | (47,745) | (57,656) | (60,675) | (62,840) |
| Sale of Fix Asset | 121 | 129 | 74 | 0 | 0 |
| (Purchase)L-T Inv. | (541) | 0 | (659) | 0 | 0 |
| Sale of L-T Inv. | 1,602 | 575 | 375 | 0 | 0 |
| Sale(Pur.)S-T Inv. | 1,564 | (8,245) | (9,579) | 0 | 0 |
| Cash Flow-Investing | (85,941) | (53,154) | (65,082) | (60,675) | (62,840) |
| Inc(Dec)-S-T Debt | 13,178 | (21,689) | 669 | 0 | 0 |
| Dividend Paid | (37,586) | (35,784) | (31,620) | (66,802) | (67,636) |
| Dir.&Emp.Bonus | 0 | 0 | 0 | 0 | 0 |
| Proceed from New Issue | 0 | 0 | 0 | 0 | 0 |
| Dec/Inc-TreasureSt | 0 | 0 | (3,096) | 0 | 0 |
| Others | (14,793) | 18,270 | (12,012) | 0 | 0 |
| Cash Flow-Financing | (39,200) | (39,204) | (46,059) | (66,802) | (67,636) |
| Change in Cash | (27,553) | 5,660 | 690 | 18,030 | 40,080 |
| Net cash/(debt), b/f | 132,553 | 105,000 | 110,660 | 111,350 | 129,380 |
| Net cash/(debt), c/f | 105,000 | 110,660 | 111,350 | 129,380 | 169,459 |
Risk Reward Reference links
- View explanation of Options Probabilities metho ology -
Options_Probabilities_Exhibit_Link.p f
- View escriptions of Risk Rewar s Themes - RR_Themes_Exhibit_Link.p f
-
View explanation of regional hierarchies - GEG_Exhibit_Link.p f
-
View explanation of Theme/Exposure metho ology -
ESG_Sustainable_Solutions_External_Link.p f
- View explanation of HERS metho ology - ESG_HERS_External_Link.p f
M Idea
INDUSTRY COVERAGE: Greater Ch na Technology Sem conductors
| Company (Ticker) | Rating (As Of) | Price* (09/30/2026) |
|---|---|---|
| Charlie Chan | ||
| Advanced Wireless emiconductor Co (8086.TWO) | U (07/14/2025) | NT$129.00 |
| Alchip Technologies Ltd (3661.TW) | O (05/14/2021) | NT$3,950.00 |
| A E Technology Holding Co. Ltd. (3711.TW) | O (09/15/2024) | NT$742.00 |
| Cambricon Technology Corporation (688256. ) | O (04/27/2026) | Rmb1,009.01 |
| CXMT Corp (688825. ) | O (08/26/2026) | Rmb54.79 |
| Global Unichip Corp (3443.TW) | O (06/24/2026) | NT$8,600.00 |
| GlobalWafers Co Ltd (6488.TWO) | E (05/19/2026) | NT$1,180.00 |
| Gudeng Precision (3680.TWO) | O (11/25/2025) | NT$561.00 |
| Hua Hong emiconductor Ltd (1347.HK) | E (03/12/2026) | HK$110.00 |
| Iluvatar CoreX emiconductor Co., Ltd. (9903.HK) | O (04/27/2026) | HK$102.90 |
| King Yuan Electronics Co Ltd (2449.TW) | O (03/03/2023) | NT$294.00 |
| MediaTek (2454.TW) | O (11/28/2025) | NT$5,165.00 |
| MetaX Integrated Circuits (688802. ) | E (04/27/2026) | Rmb497.08 |
| Nanya Technology Corp. (2408.TW) | O (05/28/2026) | NT$530.00 |
| OmniVision Integrated Circuits Group Inc (603501. ) | E (11/17/2025) | Rmb82.21 |
| Phison Electronics Corp (8299.TWO) | E (02/25/2026) | NT$2,100.00 |
| G Micro Corp. (300661. Z) | E (11/03/2025) | Rmb110.21 |
| ilergy Corp. (6415.TW) | U (05/19/2026) | NT$442.00 |
| MIC (0981.HK) | O (10/21/2025) | HK$61.30 |
| T MC (2330.TW) | O (02/07/2022) | NT$2,575.00 |
| UMC (2303.TW) | O (05/19/2026) | NT$152.50 |
| Vanguard International emiconductor (5347.TWO) | E (01/14/2026) | NT$184.00 |
| WIN emiconductors Corp (3105.TWO) | U (07/14/2025) | NT$615.00 |
Daisy Dai, CFA
M Idea
| A MPT Ltd (0522.HK) | O (07/24/2025) | HK$178.60 |
|---|---|---|
| China Resources Microelectronics Limited (688396. ) | U (03/02/2026) | Rmb55.10 |
| Empyrean Technology Co Ltd (301269. Z) | E (01/17/2025) | Rmb84.66 |
| Hangzhou ilan Microelectronics Co. Ltd. (600460. ) | U (08/25/2025) | Rmb30.75 |
| Hygon Information Technology Co., Ltd. (688041. ) | O (07/03/2026) | Rmb226.80 |
| Innoscience (2577.HK) | E (10/13/2025) | HK$39.32 |
| JCET Group Co Ltd (600584. ) | O (09/16/2026) | Rmb64.28 |
| hanghai Fudan Microelectronics (1385.HK) | O (03/07/2025) | HK$25.68 |
| ICC Co Ltd (688234. ) | O (03/20/2026) | Rmb104.39 |
| J emiconductor Corp (688820. ) | E (09/16/2026) | Rmb115.78 |
| tarPower emiconductor Ltd (603290. ) | E (05/14/2026) | Rmb81.21 |
| Unigroup Guoxin Microelectronics Co Ltd (002049. Z) | U (01/10/2023) | Rmb57.88 |
| Universal cientific Ind. ( hanghai) (601231. ) | O (11/05/2025) | Rmb23.74 |
| Yangjie Technology (300373. Z) | O (06/10/2022) | Rmb84.46 |
| Daniel Yen, CFA | ||
| AP Memory Technology Corp (6531.TW) | O (07/11/2025) | NT$1,055.00 |
| A Media Technology Inc (5269.TW) | U (10/03/2025) | NT$1,475.00 |
| Aspeed Technology (5274.TWO) | O (06/09/2025) | NT$19,520.00 |
| Egis Technology Inc (6462.TWO) | E (01/28/2026) | NT$103.50 |
| Elan Microelectronics Corp (2458.TW) | O (10/03/2025) | NT$134.00 |
| eMemory Technology Inc (3529.TWO) | O (08/18/2026) | NT$3,155.00 |
| Espressif ystems (688018. ) | O (05/15/2023) | Rmb115.08 |
| GigaDevice emiconductor Beijing Inc (603986. ) | O (05/15/2025) | Rmb353.90 |
| Macronix International Co Ltd (2337.TW) | O (09/18/2025) | NT$121.50 |
| Montage Technology Co Ltd (6809.HK) | O (03/18/2026) | HK$304.80 |
| Montage Technology Co Ltd (688008. ) Novatek (3034.TW) | O (03/18/2026) U (02/04/2026) | Rmb202.31 NT$543.00 |
| Nuvoton Technology Corporation (4919.TW) | U (11/10/2025) | NT$155.50 |
| Parade Technologies Ltd (4966.TWO) | O (05/27/2026) | NT$574.00 |
| Powerchip emiconductor Manufacturing Co (6770.TW) | O (10/27/2025) | NT$75.80 |
| Realtek emiconductor (2379.TW) | E (01/30/2026) | NT$755.00 |
| henzhen Goodix Technology Co Ltd (603160. ) | U (07/14/2025) | Rmb53.19 |
| Winbond Electronics Corp (2344.TW) | O (05/28/2026) | NT$181.00 |
| WPG Holdings (3702.TW) | O (03/16/2026) | NT$119.00 |
| WT Microelectronics Co. Ltd. (3036.TW) | O (01/27/2026) | NT$213.50 |
| Duan Liu | ||
| Dosilicon Co Ltd (688110. ) | U (09/06/2024) | Rmb113.81 |
| henzhen Longsys Electronics Co Ltd (301308. Z) | E (02/25/2026) | Rmb301.93 |
| Henry Zhao | ||
| ACM Research Inc (ACMR.O) | O (03/07/2023) | U $83.38 |
| Advanced Micro-Fabrication Equipment Inc (688012. ) | O (11/06/2023) | Rmb318.55 |
| Maxscend Microelectronics Co Ltd (300782. Z) | U (01/11/2021) | Rmb70.17 |
| NAURA Technology Group Co Ltd (002371. Z) | O (11/06/2023) | Rmb615.97 |
| Tiffany Yeh | ||
| AllRing Tech Co. (6187.TWO) | O (09/23/2025) | NT$1,490.00 |
| FOCI Fiber Optic Communications Inc (3363.TWO) | O (01/15/2025) | NT$664.00 |
| Himax Technologies Inc (HIMX.O) | E (02/04/2026) | U $15.24 |
| Hon Precision (7769.TW) | O (04/17/2026) | NT$5,815.00 |
| MPI Corporation (6223.TWO) | O (04/17/2026) | NT$5,520.00 |
| ilicon Motion ( IMO.O) | O (05/06/2024) | U $280.50 |
| WinWay Technology Co Ltd (6515.TW) | O (04/17/2026) | NT$6,205.00 |
Stock Ratings are subject to c ange. Please see latest researc for eac company.
- Historical prices are not split adjusted.
M Idea
© 2026 Morgan Stanley