PDF 原檔:報告_GS_BT載板產業模型_20261015_original.pdf
圖片清單(已驗證 2026-10-16)
ingest 時建立的「眼見為憑」圖片索引,是 lib/ 嵌圖的唯一真相來源;嵌入時只從這裡挑分類為「真資料圖」的。<40KB 未 Read 者免列。
| 檔名 | size | 分類 | 親眼所見內容 |
|---|---|---|---|
報告_GS_BT載板產業模型_20261015_001.png |
43KB | 真資料圖 | BT 載板需求依終端應用堆疊柱狀圖(智慧機、PC/平板、AI 伺服器、一般伺服器、車用等,2021-2028E)疊 YoY 折線 |
報告_GS_BT載板產業模型_20261015_002.png |
56KB | 真資料圖 | BT 需求占比 100% 堆疊圖(2021-2028E;智慧機 50%→39%、一般伺服器 20%→32%、AI 伺服器 2025 約 1%→2028E 9%) |
報告_GS_BT載板產業模型_20261015_004.png |
41KB | 真資料圖 | BT 平均單價指數(1Q25=1)折線:南電、欣興、景碩、臻鼎,至 4Q28E,南電最高約 3.1 |
報告_GS_BT載板產業模型_20261015_005.png |
148KB | 真資料圖 | BT 載板全球 TAM 2004-2028E 長條圖(US$bn)疊 ROE 點,標註歷次景氣循環與驅動(2025-2028E CAGR 28%、驅動為伺服器記憶體) |
報告_GS_BT載板產業模型_20261015_006.png |
52KB | 真資料圖 | Exhibit 6 BT 市場需求依終端應用(與 001 同圖,含圖題) |
報告_GS_BT載板產業模型_20261015_007.png |
78KB | 真資料圖 | Exhibit 7 BT 需求占比依終端應用(與 002 同圖,含圖題) |
報告_GS_BT載板產業模型_20261015_010.png |
45KB | 真資料圖 | 每台伺服器 DRAM 容量(GB)2020-2028E 長條圖疊 YoY |
報告_GS_BT載板產業模型_20261015_012.png |
65KB | 真資料圖 | DRAM 出貨(百萬顆 1Gb 等效)依廠牌(三星、海力士、美光、其他)2020-2028E 疊 YoY |
報告_GS_BT載板產業模型_20261015_013.png |
47KB | 真資料圖 | NAND 出貨依廠牌(三星、海力士、美光、SanDisk、鎧俠、其他)2020-2028E 疊 YoY |
報告_GS_BT載板產業模型_20261015_018.png |
50KB | 真資料圖 | Exhibit 18 車用 BT 市場(US$mn)2021-2028E 長條圖疊 YoY |
報告_GS_BT載板產業模型_20261015_019.png |
56KB | 真資料圖 | Exhibit 19 EV 滲透率(HEV/PHEV/EV/ICE 台數堆疊)與 EV 滲透率折線至 2028E |
報告_GS_BT載板產業模型_20261015_020.png |
105KB | 真資料圖 | BT 市場規模依客戶(Broadcom、TI、Qualcomm、MTK、Micron、Hynix、Samsung memory 等)堆疊,疊 BT 占客戶營收比例(2010-2028E,2026E 起低於 1%) |
報告_GS_BT載板產業模型_20261015_021.png |
136KB | 真資料圖 | Exhibit 21 BT 與 ABF 2026E 市占圓餅:BT 為 SimmTech 14%、Shennan 11%、LG Innotek 10%、SEMCO 10%、Daeduck 9%、Kinsus 7%、NYPCB 6%、Unimicron 6%;ABF 為 Unimicron 26%、Ibiden 19%、Shinko 10%、Nanya PCB 10%、SEMCO 13% 等 |
報告_GS_BT載板產業模型_20261015_022.png |
171KB | 真資料圖 | BT 載板主要廠商市占折線 2021-2028E(Unimicron、LG Innotek、SEMCO、NYPCB、Kinsus、SimmTech、ASE Material、Daeduck、Zhen Ding、Shennan) |
報告_GS_BT載板產業模型_20261015_023.png |
60KB | 真資料圖 | BT 市場規模(NT$mn)依廠商堆疊 2021-2028E 疊產業稼動率(2028E 約 100% 以上) |
報告_GS_BT載板產業模型_20261015_024.png |
41KB | 真資料圖 | Exhibit 25 BT ASP 指數(1Q25=1)折線,與 004 同圖 |
報告_GS_BT載板產業模型_20261015_026.png |
247KB | 真資料圖 | BT 廠商營益率(Unimicron、NYPCB、Kinsus、SEMCO、LG Innotek、Shennan)2003-2028E 折線,分段標註各景氣循環背景文字 |
報告_GS_BT載板產業模型_20261015_029.png |
125KB | 真資料圖 | 光模組 mSAP 市占折線 2025-2028E(Unimicron、ZDT、Kinsus、Shennan、Compeq、AT&S、DC Precision;ZDT 2028E 約 34%) |
報告_GS_BT載板產業模型_20261015_035.png |
41KB | 真資料圖 | Exhibit 37 南電 2026E BT 營收依應用圓餅:Memory 70%、Apple 18%、Others 12% |
報告_GS_BT載板產業模型_20261015_036.png |
67KB | 真資料圖 | 臻鼎(4958)高盛評等與目標價沿革圖,最新 NT$925 |
報告_GS_BT載板產業模型_20261015_037.png |
67KB | 真資料圖 | 南電(8046)高盛評等與目標價沿革圖,最新 NT$2,500 |
報告_GS_BT載板產業模型_20261015_038.png |
69KB | 真資料圖 | 景碩(3189)高盛評等與目標價沿革圖,最新 NT$1,125 |
報告_GS_BT載板產業模型_20261015_039.png |
68KB | 真資料圖 | 欣興(3037)高盛評等與目標價沿革圖,最新 NT$1,220 |
原始內容
For the exclusive use of [讀者資訊已遮蔽]
ASIA TECHNOLOGY
BT substrates industry update: Structural changes in S/D conditions; raise ZDT/Kinsus/NYPCB/Unimicron TPs to NT$1,025/1,515/2,700/1,270
Better-than-expected BT substrate pricing outlook with more favorable supply/demand balance
We update our BT substrate industry model (last updated in 2021 - see here) to factor in: (1) Solid memory substrate demand (41% 2026-28E CAGR; accounting for 68%/74% of total BT substrate TAM in 2026/27E); and (2) a slower capacity growth rate vs. the previous upcycle in 2020-22 (6% 2026-28E CAGR vs. 9% 2020-22 CAGR) as key Asian BT substrate suppliers continue to transfer capacity from BT substrates to ABF substrates over the coming quarters/years. Our model now suggests the BT substrate industry supply/demand gap will widen to 11%/14% in 2027/28E from 1% in 2026E, while overall BT substrate TAM will expand at a 32% 2026-28E CAGR. While BT substrate pricing rose by 10% on average in 2026, we expect BT substrate suppliers ZDT/Kinsus/NYPCB/Unimicron to see BT pricing increase by 26%/41%/38%/32% in 2027E and an additional 15%/26%/28%/27% in 2028E. Consequently, these companies' BT substrate profits should grow at a 46%/73%/75%/35% CAGR in 2026-28E.
Optical transceiver mSAP demand ramp-up expands TAM for BT substrate players
We are seeing increasing adoption of mSAP technology in optical transceivers to produce connectivity PCBs. This trend continues to increase demand for substrate-related equipment, tightening supply across the broader BT & mSAP industry. Our industry checks suggest that mSAP is the most supply-constrained component in the 1.6T optical transceiver supply chain, and we expect this shortage will continue to drive mSAP product pricing up by at least 10%-20% over the next 12 months (following a 20%-30% increase YTD). Moreover, we project optical transceiver mSAP TAM will increase from US$2.0bn in 2026 to US$7.1bn in 2028, suggesting substantial revenue upside for existing suppliers and incentivizing substrate suppliers to shift capacity toward mSAP to capitalize on this solid revenue/profit outlook (GMs currently average 40%-45%, and could reach 50%+ following pricing hikes and yield improvements). We believe ZDT will become a market share leader in this segment, underpinning a more favorable revenue/profit outlook over the coming years.
Stock ideas - ZDT/Kinsus/NYPCB to be the key beneficiaries of BT pricing hikes
Goldman Sachs does and seeks to do business with companies covered in its research reports. As a result, investors should be aware that the firm may have a conflict of interest that could affect the objectivity of this report. Investors should consider this report as only a single factor in making their investment decision. For Reg AC certification and other important disclosures, see the Disclosure Appendix, or go to www.gs.com/research/hedge.html. Analysts employed by non-US affiliates are not registered/qualified as research analysts with FINRA in the U.S.
Chao Wang
+886(2)2730-4195 | kuanchao.wang@gs.com Goldman Sachs (Asia) L.L.C., Taipei Branch
Allen Chang
+852-2978-2930 | allen.k.chang@gs.com Goldman Sachs (Asia) L.L.C.
Al Wang
+886(2)2730-4081 | al.wang@gs.com Goldman Sachs (Asia) L.L.C., Taipei Branch e92c7a75ab8b4efbba794e6b187208c8
For the exclusive use of [讀者資訊已遮蔽]
Table of Contents
| BT substrate supply/demand gap at 11%/14% in 2027/28E on the back of solid memory demand | 4 |
|---|---|
| BT demand analysis: BT demand (32% 2026-28E CAGR) continues to be driven by increasing memory BT demand (41% 2026-28E CAGR) | 5 |
| BT supply analysis: Major suppliers starting to reduce capacity, leading to slower capacity growth vs. previous upcycle | 11 |
| Optical module mSAP is seeing a widening S/D gap, prompting a shift of BT capacity to meet strong demand | 16 |
| We see ZDT, Kinsus and NYPCB as key beneficiaries of improved BT pricing/profitability trends | 17 |
| Raising earnings estimates on better BT substrate pricing | 19 |
| Investment thesis, PT methodology and risks | 23 |
| Disclosure Appendix | 26 |
e92c7a75ab8b4efbba794e6b187208c8
For the exclusive use of [讀者資訊已遮蔽]
and mSAP demand expansion
While most investors have focused primarily on ABF substrate opportunities over the past 6+ months, we believe BT substrate products will also benefit from a multi-year pricing uptrend. Incorporating our revised BT substrate TAM growth and a more constructive outlook for the mSAP industry, we raise our TPs for ZDT/Kinsus/NYPCB to NT$1,025/1,515/2,700 (from NT$925/1,125/2,500), supported by 1%-8%/7%-14% upward revisions to our 2027/28E earnings forecasts. For Unimicron, as the company is gradually phasing capacity out of the BT substrate segment, we adjust our TP more modestly from NT$1,220 to NT$1,270 on the back of 2% 2027-28E earnings hike.
Maintain Buy on ZDT/Kinsus/NYPCB (on CL), and Neutral on Unimicron.
e92c7a75ab8b4efbba794e6b187208c8
For the exclusive use of [讀者資訊已遮蔽]
BT substrate supply/demand gap at 11%/14% in 2027/28E on the back of solid memory demand
We introduce our 2026-28E BT substrate TAM forecast, expanding at a 32% 2026-28E CAGR to reach US$16.8bn in 2028E (up from US$7.4bn in 2025; Exhibit 1). This growth is primarily driven by solid memory demand in general servers (general servers will account for 32% of total BT TAM in 2028E, up from 21% in 2025; Exhibit 2), with increasing memory capacity/BT content per server. We expect the memory BT substrate TAM to outpace the broader BT substrate TAM with a 41% 2026-28E CAGR, accounting for 77% of total BT substrate TAM in 2028E (was 56% in 2025).
On the other hand, we expect the capacity growth rate to decelerate vs. the previous upcycle in 2020-22 (6% 2026-28E CAGR vs. 9% 2020-22 CAGR), as key Asian substrate suppliers are placing greater focus on their ABF substrate business, and are hence scaling back their BT substrate capacity (including Unimicron, which held 8% market share in 2025).
As such, we now expect the overall BT substrate supply/demand gap to reach 1%/11%/14% in 2H26/2027/2028 (Exhibit 3), while major BT suppliers have started to reduce capacity from 2026, potentially leading to a supply shortage in 2H26. We expect BT capacity utilization rates (UTR) to trend up amid a supply-constrained environment (surpassing 100% from 2027E per GSe), providing a better BT pricing environment going forward. The BT substrate supply tightness since the start of the year has directly led to a 10% YTD increase in overall BT substrate pricing, and we believe pricing momentum for BT substrates will remain robust in 2H26-2028E.
Accordingly, we forecast overall BT substrate prices will further increase by 15%-20%/10%-15% in 2027/28E, benefiting BT substrates' profitability/pricing for Taiwanese players (GMs ranged from 15%-27% in 2Q26 and are projected to increase to 18%-34%/19%-36%+ in 2027/28E; Exhibit 4).
Exhibit 1: BT market demand by end application US$mn
Exhibit 2: BT market demand by end application - we continue to see increasing contribution from both general servers and AI servers
Source: Company data, Goldman Sachs Global Investment Research
Source: Company data, Goldman Sachs Global Investment Research e92c7a75ab8b4efbba794e6b187208c8
For the exclusive use of [讀者資訊已遮蔽]
Exhibit 3: We expect the BT substrate S/D gap to continue expanding over coming years
Supply shortage ratio
Exhibit 4: BT pricing remains favorable going forward Rebase 1Q25 as 1
Source: Company data, Goldman Sachs Global Investment Research
Source: Company data, Goldman Sachs Global Investment Research
Exhibit 5: Global BT market revenue will be driven by strong memory demand for general servers LHS: US$bn
Source: Company data, Goldman Sachs Global Investment Research
BT demand analysis: BT demand (32% 2026-28E CAGR) continues to be driven by increasing memory BT demand (41% 2026-28E CAGR)
The BT substrate demand outlook is solid thanks to strong memory demand driven by general servers, supported by: (1) Rising general server CPU demand driven by agentic e92c7a75ab8b4efbba794e6b187208c8
For the exclusive use of [讀者資訊已遮蔽]
AI; and (2) upcoming launches of new general server CPU platforms, which will drive upgrade demand. We expect the BT substrate market to deliver a 32% 2026-28E CAGR, reaching US$16.8bn by 2028E (vs. US$7.4bn in 2025). We expect the memory BT substrate market to deliver a 41% 2026-28E CAGR to reach US12.9bn by 2028E (vs. US$4.1bn in 2025), accounting for 77% of total BT demand by 2028E (vs. 56% in 2025).
In terms of key end applications (Exhibit 6), we expect smartphone BT substrate TAM to grow at a 24% 2026-28E CAGR, accounting for 39% of total BT substrate TAM in 2028E (down from 51% in 2025; Exhibit 7). We expect general server BT substrate TAM to grow at a faster 42% 2026-28E CAGR, accounting for 32% of total BT substrate TAM in 2028E (up from 21% in 2025). Meanwhile, we expect AI server BT substrate TAM to see the faster growth among all applications at a 73% 2026-28E CAGR, reaching 9% of total BT substrate TAM in 2028E (up from 2% in 2025).
Source: Company data, Goldman Sachs Global Investment Research
Source: Company data, Goldman Sachs Global Investment Research
Solid growth in general server BT substrate TAM will support mid- to long-term BT market growth
We expect general server BT substrate TAM to deliver a 42% 2026-28E CAGR and reach US$5.3bn in 2028E (up from US$1.6bn in 2025; Exhibit 8), which will account for 32% of total BT substrate TAM in 2028E (up from 21% in 2025). We expect general server memory BT substrate TAM to grow slightly faster at a 43% 2026-28E CAGR and reach US$5.0bn in 2028E (up from US$1.4bn in 2025), accounting for 39% of total memory BT substrate TAM in 2028E (up from 20% in 2025). This is driven by solid general server shipments (we expect general server shipments to register an 8% 2026-28E CAGR; see here; Exhibit 9) alongside increasing memory capacity/BT content per general server (Exhibit 10).
Our US analyst, James Schneider, expects Intel/AMD general server CPU shipment to grow at a 28%/36% 2026-28E CAGR, reaching a combined 59mn units in 2028E (vs. 26mn units in 2025). This supports our constructive view that general servers are the key driver of the current BT substrate upcycle, given the strong correlation between memory BT substrate TAM growth and general server CPU shipment growth.
e92c7a75ab8b4efbba794e6b187208c8
For the exclusive use of [讀者資訊已遮蔽]
Exhibit 8: General server BT TAM is growing faster than overall BT TAM at a 42% 2026-28E CAGR
Exhibit 9: General server shipment vs. ASP YoY in 2026-28E
Source: Company data, Goldman Sachs Global Investment Research
Exhibit 10: DRAM content per server will continue to increase
Source: Goldman Sachs Global Investment Research
Exhibit 11: CPU shipment estimates for both Intel and AMD are accelerating
Source: Company data, Goldman Sachs Global Investment Research
Source: Company data, Goldman Sachs Global Investment Research
The strong growth in memory BT substrate TAM is largely driven by memory shipments (Exhibit 12, Exhibit 13); additionally, rising demand for agentic AI continues to drive stronger volume demand for general server CPUs. Furthermore, we expect to see the next round of general server CPU upgrades throughout 2026-28 following the launch of next-generation general server CPUs (Venice server CPU was released in 2H26 while Oak Stream server CPU will be released in 2027). A key upgrade is that AMD's Venice supports higher DRAM capacity, implying a 30%+ increase in DRAM memory BT substrate content per server.
e92c7a75ab8b4efbba794e6b187208c8
For the exclusive use of [讀者資訊已遮蔽]
Exhibit 12: We believe DRAM shipments will continue to grow over coming years which will bode well for BT market growth
Units: mn chips (1Gb equiv.)
Exhibit 13: We also believe NAND shipments will continue to grow over coming years Units: mn chips (1Gb equiv.)
Source: Company data, Goldman Sachs Global Investment Research
Source: Company data, Goldman Sachs Global Investment Research
Strong AI server shipment growth in 2026-28E will also support BT TAM expansion
We expect AI server BT substrate TAM to deliver a 73% 2026-28E CAGR and reach US$1,476mn in 2028E (up from US$160mn in 2025; Exhibit 14), accounting for 9% of total BT substrate TAM in 2028E (up from 2% in 2025). We expect AI server memory BT substrate TAM to grow slightly faster at a 75% 2026-28E CAGR and reach US$1,428mn in 2028E (up from US$145mn in 2025), accounting for 9% of total memory BT substrate TAM in 2028E (up from 2% in 2025). This is driven by solid growth in AI server shipments, as we expect AI servers (8-GPU equivalent) and AI server racks (72-GPU equivalent) to register 17%/71% 2026-28E CAGRs (see here) with increasing memory capacity per server/per server rack.
We expect GPU/CPU attach rates to move from 2x to 1.1-1.4x over time as agentic AI applications become mainstream, implying that each GPU deployment will require more server CPUs (see our US analyst Jim Schneider's Intel initiation). Given that memory BT content in AI servers is primarily tied to server CPU count, if the GPU/CPU attach rate narrows from 2.0x to 1.1-1.4x, we estimate 1%/1%-2% upside to memory BT substrate TAM in 2027/28E.
For AI server racks (72-GPU equivalent), BT content per rack continues to expand mainly due to increasing demand for more memory capacity, resulting in a 50% 2026-28E CAGR in BT content per AI server rack (Exhibit 15). A key upgrade is that Nvidia's VR200 will support higher DRAM capacity, implying a 100% increase in DRAM memory BT substrate content compared to GB200/GB300. We also note Nvidia is releasing a standalone Vera CPU rack designed for agentic AI, implying further demand upside for AI CPU shipments and memory BT substrates, as each Vera CPU rack incorporates 8x more DRAM memory BT substrate content compared to VR200.
e92c7a75ab8b4efbba794e6b187208c8
For the exclusive use of [讀者資訊已遮蔽]
Exhibit 14: AI server BT TAM is growing faster than overall BT TAM at a 73% 2026-28E CAGR
Exhibit 15: BT content for AI server rack continues to increase as memory capacity continues to expand
k units
Source: Company data, Goldman Sachs Global Investment Research
Source: Company data, Goldman Sachs Global Investment Research
Smartphones remain critical to BT demand with growth going forward tracking slower than the overall BT industry
We expect overall smartphone BT substrate TAM to grow at a 24% 2026-28E CAGR (tracking slower than the overall BT industry CAGR of 32%) to reach US$6.5bn in 2028E (up from US$3.8bn in 2025), accounting for 39% of total 2028E BT TAM (down from 51% in 2025). We expect smartphone memory BT substrate TAM to grow at a faster 36% 2026-28E CAGR to reach US$2.4bn in 2028E (up from US$1.0bn in 2025), accounting for 19% of total memory BT TAM in 2028E (down from 24% in 2025).
As mentioned in our previous update on the BT substrate industry (see here), we believe the previous upcycle (in 2020-22) was mainly driven by the proliferation of SiP/AiP designs that increased BT substrate content per device, especially for smartphones. While smartphones remain critical to overall BT demand, accounting for 51% of total 2025 BT substrate TAM, we expect their contribution to moderate going forward (reaching 39% of 2028E BT TAM). This is driven by softer smartphone shipment volumes (we now forecast smartphone shipments at -10%/+2%/+2% YoY in 2026-28E; see here) and the fact that BT substrate content per smartphone will be mainly driven by higher memory BT substrate pricing (Exhibit 16) rather than other meaningful content value gains (memory will account for 46% of smartphone BT ASP in 2028E, up from 32% in 2025).
We expect 25%/26%/28% of overall smartphone shipments to be equipped with mmWave connectivity in 2026/27/28E (Exhibit 17), resulting in an 18% 2026-28E CAGR for smartphone AiP BT TAM to reach US$1,128mn in 2028 (up from US$713mn in 2025). For iPhones, mmWave connectivity is only available for models sold in the US (representing 35%-40% of total iPhone shipments per GSe). In the Android camp, Samsung's flagship smartphones that support mmWave connectivity are also only for the US market.
e92c7a75ab8b4efbba794e6b187208c8
For the exclusive use of [讀者資訊已遮蔽]
Exhibit 16: Memory will account for a higher % of total smartphone BT content going forward
LHS: USD
Exhibit 17: Smartphone mmWave penetration remains saturated going forward
LHS: mn units; RHS: US$
Source: Company data, Goldman Sachs Global Investment Research
Source: Goldman Sachs Global Investment Research
Automotive BT consumption to steadily increase in coming years
We expect automotive BT TAM to grow at a 34% 2026-28E CAGR and reach US$777mn in 2028E (up from US$317mn in 2025), which will account for 5% of total 2028E BT TAM (up from 4% in 2025). This stronger-than-industry growth is mainly driven by rising EV penetration going forward (EV penetration rate will increase from 14% in 2025 to 20% in 2028E per our Japanese auto team; Exhibit 19) and the corresponding increase in electronics content per car, which requires more BT substrates. Furthermore, we believe rising autonomous driving penetration will result in an increase in electronic components/BT consumption per car.
Source: Company data, Goldman Sachs Global Investment Research
Source: Company data, Goldman Sachs Global Investment Research
BT market revenue to grow at a 28% 2026-28E CAGR with sustainable memory demand
We project BT substrate market revenue to grow at a 28% CAGR in 2026-28E and reach US$14.6bn in 2028E (up from US$6.9bn in 2025). Despite this solid growth, total BT market revenue will account for less than 1% of customers' overall revenue in 2026-28E (down from 2%-3% in the previous upcycle in 2020-22), as customers' overall growth is tracking faster at a 34% 2026-28E CAGR. We believe this lower ratio of BT market e92c7a75ab8b4efbba794e6b187208c8
For the exclusive use of [讀者資訊已遮蔽]
revenue to customers' revenue is positive for BT suppliers, as it implies room for further BT substrate price increases.
BT market revenue as a percentage of total customers' revenue peaked during the 2020-22 upcycle (at 2.5%-2.6%), when demand was primarily driven by smartphones (smartphones accounted for ~50% of total BT substrate demand during that cycle). As customers' revenue has shifted away from consumer electronics toward AI-related applications, substrate spending has become increasingly directed toward ABF substrates for GPUs/CPUs/ASICs, while BT substrate spending is more focused on lower-end BT substrates for memory applications.
Exhibit 20: While we see strong end market revenue growth, we believe BT will remain less than 1% of customers' revenue in coming years LHS: US$mn
Source: Company data, Goldman Sachs Global Investment Research
BT supply analysis: Major suppliers starting to reduce capacity, leading to slower capacity growth vs. previous upcycle
We believe overall BT industry supply growth in this upcycle will remain modest, as key Asian BT substrate suppliers are decreasing capacity, which will partially offset capacity additions from smaller players. Thus, we expect supply to grow at a 6% 2026-28E CAGR, compared to the 9% CAGR during the 2020-22 upcycle. This is mainly due to Unimicron transferring BT substrate capacity to high-end large-body-size ABF substrates (see here), while SEMCO is focusing more on expanding its ABF substrate capacity (see here) with its BT substrate business mainly focusing on memory and e92c7a75ab8b4efbba794e6b187208c8
For the exclusive use of [讀者資訊已遮蔽]
smartphone AP (application processor).
We expect BT capacity for Taiwanese suppliers to contract at a -1% 2026-28E CAGR, mainly due to Unimicron's capacity reductions. We expect BT capacity for Korean suppliers to grow at a 3% 2026-28E CAGR, while mainland Chinese suppliers expand at an 11% 2026-28E CAGR. Overall, we expect Taiwanese/Korean/mainland Chinese BT suppliers to account for 27%/41%/16% of total revenue share in 2028E respectively (was 23%/45%/12% in 2025).
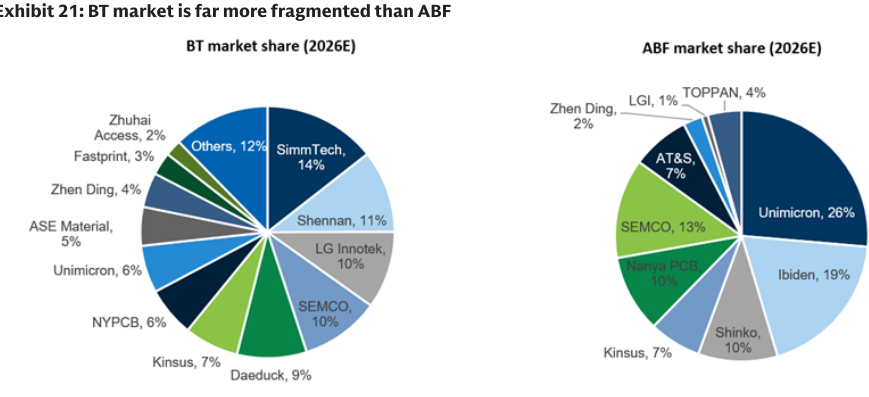
The BT substrate supply market remains fragmented, with the top 5 suppliers accounting for 53% of total industry revenue in 2025. Over the next few years, we expect a slight change in the competitive landscape as major suppliers reduce capacity against a backdrop of robust demand expanding at a 32% 2026-28E CAGR, as outlined above.
Forecasts for Not Covered names are based on BBG consensus.
Source: Bloomberg, Goldman Sachs Global Investment Research
We believe market players will increase BT substrate capacity by only 4%/3%/9% in 2026/27/28E. Taiwanese players, such as NYPCB and Kinsus, mentioned they will primarily seek de-bottlenecking instead of investing in new equipment. However, ZDT mentioned it will expand BT capacity at its Qinhuangdao plants 1 & 2 starting in 2H26, and the company expects this expansion to increase its existing BT substrate capacity by 20%.
As for major mainland Chinese players, Shennan (002916.SZ; Buy; covered by Ting Song) will continue to expand its IC substrate business; the company expects Phase 2 of its Guangzhou factory to start production in 4Q26 (see here). Fastprint (002436.SZ; Not Covered), which will hold 3% of total market share in 2026 based on BBG consensus, has announced in June an investment of Rmb1.2bn for further BT capacity expansion; this translates to an additional 25k square meter monthly capacity in the coming years (vs. its current 50k square meter monthly capacity).
Furthermore, we see Korean suppliers taking a more proactive stance toward future BT capacity additions. In June, LG Innotek (011070.KS; Neutral; covered by Guini Lee) announced plans to invest US$1bn to further expand its substrate capacity in Vietnam, mainly for RF-SiP, BT and ABF substrates. For SimmTech (222800.KQ; Not Covered), the company plans to invest KRW105bn to expand BT substrate capacity specifically for e92c7a75ab8b4efbba794e6b187208c8
For the exclusive use of [讀者資訊已遮蔽]
DRAM memory. Daeduck (353200.KS; Not Covered) announced in May an investment of KRW213bn to construct a new facility for memory BT substrates, followed by an announcement in July to invest KRW497bn to further expand its IC substrate capacity (including both ABF and BT substrates).
Exhibit 22: Korean substrate players have announced plans to invest in BT capacity in coming years
| LG Innotek | SimmTech | Daeduck | |
|---|---|---|---|
| Total investment | US$1bn | KRW105bn | KRW213bn/KRW497bn |
| Location of new plant | Vietnam | Cheongju | Siheung |
| Production timeline | Pilot run: 3Q27 Mass production: 2028 | Pilot run: 2028 Mass production: 2028-29 | Pilot run: 3Q27 Mass production: 2028 |
| Application | RF-SiP, FCCSP (BT substrate), FCBGA (ABF substrate) | BT substrate for LPDDR5x | BT substrate for memory/ IC substrate |
| % of 2028 market capacity | 7-8% | 13-14% | 11-12% |
Forecasts for Not Covered names are based on BBG consensus.
Source: Bloomberg, Company data, Goldman Sachs Global Investment Research
We view both SEMCO and LG Innotek as the largest global BT suppliers (both at 12% market share in 2025), followed by SimmTech (11%). Kinsus and NYPCB held 7% and 6% of total revenue share respectively, while Unimicron held 8% in 2025. Together, Korean and Taiwanese players accounted for 67% of global BT market share in 2025. Furthermore, we estimate that 90%+ of BT substrate demand comes from smartphones, wearables, memory, and computing markets, with Korea and Taiwan serving as the major production sites for these products. On the other hand, mainland Chinese players in total accounted for 14% of the market in 2025, which we project will slightly grow to 16% by 2028E.
Exhibit 23: BT market remains fragmented with no single supplier having a market share higher than 15%
Forecasts for Not Covered names are based on BBG consensus.
Source: Bloomberg, Company data, Goldman Sachs Global Investment Research
Solid BT pricing environment as demand continues to outpace supply e92c7a75ab8b4efbba794e6b187208c8
For the exclusive use of [讀者資訊已遮蔽]
We have seen BT substrate demand improve since the start of 2026 alongside a firmer pricing outlook, and we expect demand growth to consistently outpace supply in 2026-28E (demand CAGR of 15% vs. supply CAGR of 6%). We believe industry utilization rates (UTR) will continue to trend up over the coming years (reaching 100%+ after 2027E) due to slow supply growth going forward.
Memory predominantly requires wire bonding chip scale package (WBCSP) technology, and this production capacity is not interchangeable with flip-chip chip-scale package (FCCSP) technology (where smartphone APs represent the biggest demand driver). As such, we believe memory BT substrate supply will remain tight through at least 1H28, as new dedicated memory capacity will only come online in 2028. Overall BT pricing has already risen by 10% YTD, partially driven by higher material costs (including substrate CCL, copper foil, gold, etc., which account for 60% of total BT substrate BOM; Exhibit 26). Going forward, we believe the slow increase in BT substrate supply, especially WBCSP capacity, will be the key price hike driver rather than simply reflecting the material cost increase. Furthermore, BT substrates typically account for less than 5% of total memory BOM, providing ample room for further BT price hikes amid the rising memory pricing trend.
Exhibit 24: We expect to see BT market size exceed NT$467bn in 2028E with 100%+ industry UTR NT$mn
120%
Forecasts for Not Covered names are based on BBG consensus.
Source: Bloomberg, Company data, Goldman Sachs Global Investment Research
e92c7a75ab8b4efbba794e6b187208c8
For the exclusive use of [讀者資訊已遮蔽]
Exhibit 25: BT ASP environment remains favorable with strong demand growth in coming quarters
Rebase 1Q25 ASP at 1
Exhibit 26: We believe key material costs will continue to increase
Source: Company data, Goldman Sachs Global Investment Research
Source: Goldman Sachs Global Investment Research
With favorable BT substrate supply/demand conditions, we believe the profitability of key BT vendors will see a structural increase in the coming years. Similar to current dynamics in the ABF market, the BT substrate industry's profitability profile has navigated three upcycles and three downcycles over the past 20 years (Exhibit 27). Overall margin profiles for key BT vendors have begun improving since the start of 2026, supported by increasing memory demand amid a supply-constrained environment, especially following several years of slow capex investment. We believe this profitability enhancement will continue in 2H26-2028, supported by sustained industry demand uptrend.
Exhibit 27: We believe BT players' OPM will grow sharply with growing memory BT demand resulting from agentic AI
Source: Company data, Goldman Sachs Global Investment Research
e92c7a75ab8b4efbba794e6b187208c8
For the exclusive use of [讀者資訊已遮蔽]
Optical module mSAP is seeing a widening S/D gap, prompting a shift of BT capacity to meet strong demand
We introduce our 2026-28E 800G+ optical module mSAP TAM forecast, expanding at an 87% 2026-28E CAGR to reach US$7.1bn by 2028E (up from US$0.5bn in 2025; Exhibit 28). This is based on our 800G+ optical module shipment estimates of a 48% 2026-28E CAGR (see here). The connectivity PCB within the 800G+ optical module requires mSAP technology, where several PCB makers have exposure to and are able to leverage their extensive mSAP experience from smartphone substrate-like PCB (SLP) production.
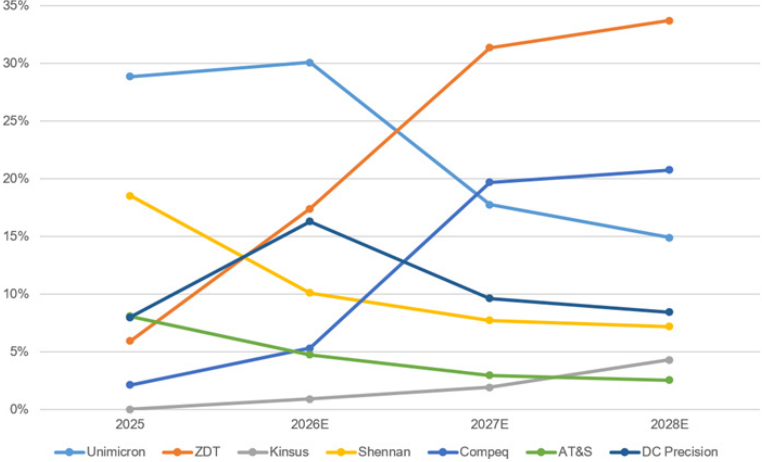
On the other hand, major PCB and substrate suppliers are placing greater focus on this emerging business and pursuing proactive capacity expansion plans, especially ZDT and Compeq (the latter aims to ramp optical module mSAP capacity to reach monthly revenue of ~NT$3bn by end 2027 vs. less than NT$100mn as of 2Q26; see here). Although Unimicron was a front-runner in the 800G+ optical module mSAP business in 2025 (29% market share in 2025 per GSe), the company is placing greater focus on its ABF substrate business, and hence leaving room for emerging peers to capture market share through aggressive expansion plans and technology leadership.
We believe ZDT will become the market share leader in the optical module mSAP industry, as we expect the company to expand mSAP capacity by 5x over the next two years, positioning it well to gain share in a supply-constrained environment (our industry checks indicate mSAP is the most supply-constrained component in the 1.6T optical transceiver supply chain). Furthermore, the company currently holds an industry-leading yield of 90%+ for its optical module mSAP products.
Overall, we expect the 800G+ optical module mSAP supply/demand gap to reach 5%/25%/38% in 2026/27/28E (Exhibit 29). Although major mSAP suppliers continue to have proactive expansion plans, this appears insufficient to keep pace with strong demand. The 800G+ optical module mSAP tightness since the start of 2026 has directly led to a 20%-30% pricing increase YTD, and we believe the pricing outlook for 800G+ optical module mSAP will remain solid in 2027/28E.
Exhibit 28: We expect optical module mSAP to register 87% 2026-28E CAGR
Exhibit 29: We expect the optical module mSAP S/D gap to continue expanding in coming years
Supply shortage ratio
Source: Company data, Goldman Sachs Global Investment Research
Source: Company data, Goldman Sachs Global Investment Research
e92c7a75ab8b4efbba794e6b187208c8
For the exclusive use of [讀者資訊已遮蔽]
Exhibit 30: We expect ZDT to hold a leading market share of 31%/34% in 2027/28E
35%
Forecasts for Not Covered names are based on BBG consensus.
Source: Bloomberg, Company data, Goldman Sachs Global Investment Research
We see ZDT, Kinsus and NYPCB as key beneficiaries of improved BT pricing/profitability trends
We revise up ZDT's 2026-29E EPS estimates by 8%-10% to reflect the favorable BT demand outlook as well as the company's 20% BT substrate capacity expansion starting from 2H26. We also raise Kinsus and NYPCB's 2027-29E EPS estimates by 6%-14%/1%-7% to factor in improved BT profitability trends. We reiterate Buy ratings on ZDT with a new TP of NT$1,025 (from NT$925), Kinsus with a new TP of NT$1,515 (from NT$1,125), and NYPCB with a new TP of NT$2,700 (from NT$2,500).
Exhibit 31: Comparison of key suppliers' BT substrate revenue and profitability
| NT$mn | ZDT - 2026E | ZDT - 2027E | ZDT - 2028E | Kinsus - 2026E | Kinsus - 2027E | Kinsus - 2028E | NYPCB - 2026E | NYPCB - 2027E | NYPCB - 2028E | Unimicron - 2026E | Unimicron - 2027E | Unimicron - 2028E |
|---|---|---|---|---|---|---|---|---|---|---|---|---|
| Total revenue | 227,975 | 372,589 | 587,634 | 54,655 | 100,580 | 171,681 | 61,253 | 127,394 | 215,270 | 190,560 | 308,240 | 435,891 |
| YoY | 25% | 63% | %89 | 39% | 84% | 71% | 52% | 108% | %69 | 45% | 62% | 41% |
| BT revenue | 13,090 | 20,383 | 24,275 | 20,103 | 30,710 | 38,616 | 17,832 | 27,344 | 37,780 | 17,629 | 20,713 | 24,221 |
| YoY | %89 | 56% | 19% | 43% | 53% | 26% | 42% | 53% | 38% | 7% | 17% | 17% |
| BT revenue mix | 6% | 5% | 4% | 37% | 31% | 22% | 29% | 21% | 18% | %6 | 7% | 6% |
| BT gross profit | 3,578 | 6,126 | 7,589 | 4,056 | 9,342 | 12,087 | 4,409 | 9,253 | 13,524 | 2,568 | 3,785 | 4,662 |
| BT GM | 27% | 30% | 31% | 20% | 30% | 31% | 25% | 34% | 36% | 15% | 18% | 19% |
Source: Goldman Sachs Global Investment Research
ZDT - continues to expand BT capacity starting in 2H26
We expect BT substrates to account for 6%/5%/4% of ZDT's total revenue in 2026/27/28E, delivering 68%/56%/19% YoY BT revenue growth. In terms of application mix, we expect smartphones to represent 50% of ZDT's 2026E BT revenue, followed by memory at a 30% share. Despite this higher smartphone weighting, ZDT stands out from peers as the company plans to further expand BT capacity starting in 2H26, targeting a e92c7a75ab8b4efbba794e6b187208c8
For the exclusive use of [讀者資訊已遮蔽]
20% expansion on top of its current BT capacity; this should enable the company to see solid YoY growth in its BT substrate business going forward. We expect ZDT to realize 22%/26%/15% pricing increases for its BT substrates while GM for its BT substrate business reaches 27%/30%/31%. Furthermore, we expect optical module mSAP contribution to increase for ZDT, accounting for 5%/11%/10% of ZDT's total revenue in 2026/27/28E and delivering 10x+/267%/41% YoY growth in 2026/27/28E.
Exhibit 32: We expect ZDT's BT revenue will grow strongly in coming years with further expansion in 2H26
Source: Company data, Goldman Sachs Global Investment Research
Exhibit 33: ZDT's BT revenue is mainly driven by
smartphones BT revenue by application (2026E)
Source: Goldman Sachs Global Investment Research
Kinsus - highest BT revenue mix among Taiwanese peers
We expect BT substrates to account for 37%/31%/22% of Kinsus's total revenue in 2026/27/28E, delivering 43%/53%/26% YoY BT revenue growth. In terms of application mix, we expect Kinsus to generate 50% of its 2026E BT revenue from memory, followed by smartphone-related products at a 29% share. Kinsus stands out from its Taiwanese peers with the highest BT revenue mix, and is positioned to benefit more from overall BT price increases going forward. We expect Kinsus to realize 40%/41%/26% increases in its BT substrate pricing, while GM for its BT substrate business reaches 20%/30%/31% in 2026/27/28E.
Exhibit 34: We expect Kinsus's BT revenue will grow strongly in coming years
Exhibit 35: 50% of Kinsus's BT revenue to come from memory BT revenue by application (2026E)
Source: Company data, Goldman Sachs Global Investment Research
Source: Goldman Sachs Global Investment Research
NYPCB - highest memory BT substrate exposure among Taiwanese peers
e92c7a75ab8b4efbba794e6b187208c8
For the exclusive use of [讀者資訊已遮蔽]
We expect BT substrates to account for 29%/21%/18% of NYPCB's total revenue in 2026/27/28E, delivering 42%/53%/38% YoY BT revenue growth. In terms of application mix, we expect NYPCB to generate 70% of its 2026E BT revenue from memory, followed by smartphone-related products at an 18% share. NYPCB stands out from its Taiwanese peers with the highest % of BT revenue derived from memory, and we believe memory BT substrates will see larger price hikes compared to other BT substrates due to tighter supply/demand conditions. As a result, we expect NYPCB to see the largest BT price increases among peers with its BT pricing rising 39%/38%/28% in 2026/27/28E, while GM for its BT substrate business reaches 25%/34%/36%.
Exhibit 36: We expect NYPCB's BT revenue will grow strongly in coming years
Source: Company data, Goldman Sachs Global Investment Research
Source: Goldman Sachs Global Investment Research
Raising earnings estimates on better BT substrate pricing
Earnings revisions
ZDT
We revise up our 2026E net income estimate by 8% to factor in 3Q26 revenue and better BT and ABF pricing assumptions. We also raise our 2027/28/29E net income estimates by 8%/10%/9% to factor in better-than-expected pricing for BT substrates and an increased optical module mSAP contribution. We revise up our 2026/27/28/29E GPM forecasts by 0.5/0.9/0.9/0.6ppt due to improved BT substrate profitability and higher contribution from the high-margin optical module mSAP business.
Exhibit 38: ZDT earnings revisions
| ZD Tech P&L (NT$ mn) - Sales | 2026E New 2026E Old - 227,975 | 2026E New 2026E Old - 222,195 | Diff. - 3% | 2027E New - 372,589 | 2027E Old - 354,197 | Diff. - 5% | 2028E New 2028E Old - 587,634 | 2028E New 2028E Old - 556,513 | Diff. - 6% | 2029E New - 787,166 | 2029E Old - 739,278 | Diff. - 6% |
|---|---|---|---|---|---|---|---|---|---|---|---|---|
| Gross Profit | 56,384 | 53,746 | 5% | 102,934 | 94,694 | %6 | 184,748 | 170,067 | %6 | 266,597 | 246,021 | %8 |
| EBIT | 24,815 | 22,921 | 8% | 61,432 | 55,267 | 11% | 123,072 | 111,676 | 10% | 188,847 | 173,010 | %6 |
| Net Income | 15,847 | 14,711 | 8% | 37,446 | 34,549 | 8% | 73,732 | 67,148 | 10% | 112,959 | 103,908 | %6 |
| EPS (NTS) | 14.56 | 13.52 | 8% | 34.35 | 31.70 | 8% | 67.64 | 61.60 | 10% | 103.63 | 95.33 | 9% |
| Ratio analysis | ||||||||||||
| Gross margin | 24.7% | 24.2% | 0.5pp | 27.6% | 26.7% | 0.9pp | 31.4% | 30.6% | 0.9pp | 33.9% | 33.3% | 0.6pp |
| EBIT margin | 10.9% | 10.3% | 0.6pp | 16.5% | 15.6% | 0.9pp | 20.9% | 20.1% | 0.9pp | 24.0% | 23.4% | 0.6pp |
| Net margin | 7.0% | 6.6% | 0.3pp | 10.1% | 9.8% | 0.3pp | 12.5% | 12.1% | 0.5pp | 14.4% | 14.1% | 0.3pp |
Source: Goldman Sachs Global Investment Research
Kinsus
We revise up our 2026/27/28/29E net income estimate by 5%/6%/14%/13% to factor e92c7a75ab8b4efbba794e6b187208c8
For the exclusive use of [讀者資訊已遮蔽]
in more favorable BT pricing going forward and an increased contribution from optical module mSAP. We revise up our 2026/27/28/29E GM forecasts by 0.8/0.3/0.7/0.9ppt and OPM forecasts by 0.8/0.4/1.2/1.1ppt due to better BT pricing.
Exhibit 39: Kinsus earnings revisions
| Kinsus P&L (NT$ mn) - Sales | 2026E New 2026E Old - 54,655 | 2026E New 2026E Old - 54,805 | Diff. - %0 | 2027E New 2027E Old - 100,580 | 2027E New 2027E Old - 96,231 | Diff. 2028E New 2028E Old - 5% | Diff. 2028E New 2028E Old - 171,681 | Diff. 2028E New 2028E Old - 158,178 | Diff. - %6 | 2029E New 2029E Old - 272,513 | 2029E New 2029E Old - 250,634 | Diff. - 9% |
|---|---|---|---|---|---|---|---|---|---|---|---|---|
| Gross Profit | 15,273 | 14,898 | 3% | 36,100 | 34,233 | 5% | 68,495 | 61,932 | 11% | 114,717 | 103,203 | 11% |
| EBIT | 8,656 | 8,263 | 5% | 24,969 | 23,523 | 6% | 50,044 | 44,172 | 13% | 84,766 | 75,156 | 13% |
| Net Income | 6,232 | 5,953 | 5% | 19,013 | 17,874 | 6% | 39,530 | 34,776 | 14% | 68,058 | 60,183 | 13% |
| EPS (NTS) | 12.33 | 11.79 | 5% | 37.34 | 35.10 | 6% | 77.63 | 68.29 | 14% | 133.65 | 118.18 | 13% |
| Ratio analysis | ||||||||||||
| Gross margin | 27.9% | 27.2% | 0.8ppt | 35.9% | 35.6% | 0.3ppt | 39.9% | 39.2% | 0.7ppt | 42.1% | 41.2% | 0.9ppt |
| EBIT margin | 15.8% | 15.1% | 0.8ppt | 24.8% | 24.4% | 0.4ppt | 29.1% | 27.9% | 1.2ppt | 31.1% | 30.0% | 1.1ppt |
| Net margin | 11.4% | 10.9% | 0.5ppt | 18.9% | 18.6% | 0.3ppt | 23.0% | 22.0% | 1.0ppt | 25.0% | 24.0% | 1.0ppt |
Source: Goldman Sachs Global Investment Research
NYPCB
We revise up our 2027/28/29E net income estimates by 1%/7%/2% to factor in a better-than-expected BT GM outlook in the coming years, reflecting increased tightness across the BT substrate industry. We revise down our 2026E revenue estimate by 4% factoring in 3Q26 actual revenue, and lower our GM assumption by 0.9ppt to account for a slower-than-expected initial ABF substrate yield ramp for high-end products at the Kunshan plant, resulting in a 6% downward revision for our 2026E net income estimate.
Exhibit 40: NYPCB earnings revisions
| NYPCB P&L (NT$ mn) | 2026E New | 2026E Old | Diff. | 2027E New | 2027E Old | Diff. | 2028E New | 2028E Old | Diff. | 2029E New | 2029E Old | Diff. |
|---|---|---|---|---|---|---|---|---|---|---|---|---|
| Sales | 61,253 | 63,497 | -4% | 127,394 | 128,352 | -1% | 215,270 | 208,110 | 3% | 339,085 | 336,653 | 1% |
| Gross Profit | 17,153 | 18,325 | %9- | 57,463 | 56,726 | 1% | 111,300 | 103,767 | 7% | 193,047 | 189,175 | 2% |
| EBIT | 15,344 | 16,445 | -7% | 54,417 | 53,725 | 1% | 106,580 | 99,563 | 7% | 185,077 | 181,906 | 2% |
| Net Income | 12,503 | 13,362 | -6% | 43,079 | 42,537 | 1% | 83,133 | 77,659 | 7% | 145,249 | 142,836 | 2% |
| EPS (NTS) | 19.35 | 20.68 | -6% | 66.67 | 65.83 | 1% | 128.66 | 120.18 | 7% | 224.79 | 221.05 | 2% |
| Ratio analysis | ||||||||||||
| Gross margin | 28.0% | 28.9% | -0.9pp | 45.1% | 44.2% | 0.9pp | 51.7% | 49.9% | 1.8pp | 56.9% | 56.2% | 0.7pp |
| EBIT margin | 25.0% | 25.9% | -0.8pp | 42.7% | 41.9% | 0.9pp | 49.5% | 47.8% | 1.7pp | 54.6% | 54.0% | 0.5pp |
| Net margin | 20.4% | 21.0% | -0.6pp | 33.8% | 33.1% | 0.7pp | 38.6% | 37.3% | 1.3pp | 42.8% | 42.4% | 0.4pp |
Source: Goldman Sachs Global Investment Research
Unimicron
We revise up our 2027/28/29E net income estimates by 2%/2%/1% after raising our BT substrate pricing assumptions. We revise down our 2029E GM estimate by 0.4ppt, reflecting higher contribution from the lower-margin BT substrate business. We revise up our 2026E GM estimate by 0.2ppt after factoring in actual 3Q26 revenue with slight changes in our product mix assumptions.
Exhibit 41: Unimicron earnings revisions
| Unimicron P&L (NT$ mn) | 2026E New | 2026E Old | Diff. | 2027E New | 2027E Old | Diff. | 2028E New | 2028E Old | Diff. | 2029E New | 2029E Old | Diff. |
|---|---|---|---|---|---|---|---|---|---|---|---|---|
| Sales | 190,560 | 191,248 | %0 | 308,240 | 302,344 | 2% | 435,891 | 427,254 | 2% | 590,587 | 576,393 | 2% |
| Gross Profit | 49,296 | 49,178 | %0 | 109,713 | 107,715 | 2% | 178,473 | 175,122 | 2% | 260,729 | 256,552 | 2% |
| EBIT | 32,647 | 32,266 | 1% | 87,324 | 85,753 | 2% | 147,803 | 145,060 | 2% | 220,292 | 217,087 | 1% |
| Net Income | 36,223 | 35,624 | 2% | 67,727 | 66,492 | 2% | 113,695 | 111,562 | 2% | 173,141 | 170,614 | 1% |
| EPS (NTS) | 23.37 | 22.98 | 2% | 44.49 | 43.68 | 2% | 73.25 | 71.88 | 2% | 113.73 | 112.07 | 1% |
| Ratio analysis | ||||||||||||
| Gross margin | 25.9% | 25.7% | 0.2pp | 35.6% | 35.6% | 0.0pp | 40.9% | 41.0% | 0.0pp | 44.1% | 44.5% | -0.4pp |
| EBIT margin | 17.1% | 16.9% | 0.3pp | 28.3% | 28.4% | 0.0pp | 33.9% | 34.0% | 0.0pp | 37.3% | 37.7% | -0.4pp |
| Net margin | 19.0% | 18.6% | 0.4pp | 22.0% | 22.0% | 0.0pp | 26.1% | 26.1% | 0.0pp | 29.3% | 29.6% | -0.3pp |
Source: Goldman Sachs Global Investment Research
Valuation
ZDT
e92c7a75ab8b4efbba794e6b187208c8
For the exclusive use of [讀者資訊已遮蔽]
Factoring in our earnings revisions, we raise our 12m TP to NT$1,025 (from NT$925), still based on our SOTP-based valuation methodology of: (1) 3.5x blended P/B for ABF & BT substrate, which is 1 STDV above early upcycle industry average; (2) 20x P/E for high-growth AI server/switch related PCB (in line with industry average); and (3) 8x P/E for low-growth consumer electronics PCB (in line with industry downcycle average valuation). We maintain our Buy rating on ZDT.
Exhibit 42: ZDT P&L summary
| NT$mn | 1Q26 | 2Q26 | 3Q26E | 4Q26E | 1Q27E | 2Q27E | 3Q27E | 4Q27E | 1Q28E | 2Q28E | 3Q28E | 4Q28E | 2025 | 2026E | 2027E | 2028E | 2029E |
|---|---|---|---|---|---|---|---|---|---|---|---|---|---|---|---|---|---|
| Revenue | 40,728 | 48,431 | 64,324 | 74,492 | 72,587 | 82,511 | 101,729 | 115,762 | 107,568 | 127,860 | 162,600 | 189,606 | 182,522 | 227,975 | 372,589 | 587,634 | 787,166 |
| Gross profit | 8,812 | 11,186 | 16,700 | 19,686 | 17,504 | 21,297 | 29,949 | 34,184 | 29,849 | 38,225 | 53,477 | 63,198 | 36,136 | 56,384 | 102,934 | 184,748 | 266,597 |
| Operating expense | (6,308) | (7,425) | (8,748) | (9,088) | (8,652) | (9,386) | (11,080) | (12,385) | (11,403) | (14,251) | (16,914) | (19.107) | (22,205) | (31,569) | (41,503) | (61,676) | (77,751) |
| Operating income | 2,503 | 3,761 | 7,952 | 10,598 | 8,852 | 11,912 | 18,869 | 21,799 | 18,445 | 23,974 | 36,562 | 44,091 | 13,932 | 24,815 | 61,432 | 123,072 | 188,847 |
| Pretax income | 2,400 | 4,931 | 8,452 | 11,598 | 9,252 | 12,262 | 18,919 | 22,299 | 18,495 | 24,024 | 36,612 | 44,391 | 14,063 | 27,382 | 62,732 | 123,522 | 189,497 |
| Taxes expense | (353) | (1,204) | (1,268) | (1,740) | (1,573) | (2,084) | (2,838) | (3,345) | (3,144) | (4,084) | (5,492) | (6,659) | (3,458) | (4,565) | (9,840) | (19,379) | (30,144) |
| Net income | 1,426 | 2,392 | 5,071 | 6,959 | 5,505 | 7,210 | 11,351 | 13,379 | 11,005 | 14,126 | 21,967 | 26,634 | 6,791 | 15,847 | 37,446 | 73,732 | 112,959 |
| EPS, NT$ | 1.33 | 2.19 | 4.65 | 6.38 | 5.05 | 6.61 | 10.41 | 12.27 | 10.10 | 12.96 | 20.15 | 24.43 | 6.91 | 14.56 | 34.35 | 67.64 | 103.63 |
| Ratio analysis and assumption | Ratio analysis and assumption | Ratio analysis and assumption | Ratio analysis and assumption | Ratio analysis and assumption | Ratio analysis and assumption | Ratio analysis and assumption | Ratio analysis and assumption | Ratio analysis and assumption | Ratio analysis and assumption | Ratio analysis and assumption | Ratio analysis and assumption | Ratio analysis and assumption | |||||
| As % of sales | As % of sales | As % of sales | As % of sales | As % of sales | As % of sales | As % of sales | As % of sales | As % of sales | As % of sales | As % of sales | As % of sales | As % of sales | |||||
| Gross margin | 21.6% | 23.1% | 26.0% | 26.4% | 24.1% | 25.8% | 29.4% | 29.5% | 27.7% | 29.9% | 32.9% | 33.3% | 19.8% | 24.7% | 27.6% | 31.4% | 33.9% |
| Operating expense ratio | 15.5% | 15.3% | 13.6% | 12.2% | 11.9% | 11.4% | 10.9% | 10.7% | 10.6% | 11.1% | 10.4% | 10.1% | 12.2% | 13.8% | 11.1% | 10.5% | %6% |
| Operating margin | 6.1% | 7.8% | 12.4% | 14.2% | 12.2% | 14.4% | 18.5% | 18.8% | 17.1% | 18.7% | 22.5% | 23.3% | 7.6% | 10.9% | 16.5% | 20.9% | 24.0% |
| Net margin | 3.5% | 4.9% | 7.9% | 9.3% | 7.6% | 8.7% | 11.2% | 11.6% | 10.2% | 11.0% | 13.5% | 14.0% | 3.7% | 7.0% | 10.1% | 12.5% | 14.4% |
| QoQ growth (%) | QoQ growth (%) | QoQ growth (%) | QoQ growth (%) | QoQ growth (%) | QoQ growth (%) | QoQ growth (%) | QoQ growth (%) | QoQ growth (%) | QoQ growth (%) | QoQ growth (%) | QoQ growth (%) | QoQ growth (%) | |||||
| Revenue | -28.4% | 18.9% | 32.8% | 15.8% | -2.6% | 13.7% | 23.3% | 13.8% | -7.1% | 18.9% | 27.2% | 16.6% | |||||
| Gross profit | -31.3% | 26.9% | 49.3% | 17.9% | -11.1% | 21.7% | 40.6% | 14.1% | -12.7% | 28.1% | 39.9% | 18.2% | |||||
| Operating income | -57.7% | 50.2% | 111.4% | 33.3% | -16.5% | 34.6% | 58.4% | 15.5% | -15.4% | 30.0% | 52.5% | 20.6% | |||||
| Net income | -54.9% | 67.8% | 112.1% | 37.2% | -20.9% | 31.0% | 57.4% | 17.9% | -17.7% | 28.4% | 55.5% | 21.2% | |||||
| Yoy growth (%) | Yoy growth (%) | Yoy growth (%) | Yoy growth (%) | Yoy growth (%) | Yoy growth (%) | Yoy growth (%) | Yoy growth (%) | Yoy growth (%) | Yoy growth (%) | Yoy growth (%) | Yoy growth (%) | Yoy growth (%) | |||||
| Revenue | 1.6% | 26.8% | 35.8% | 31.0% | 78.2% | 70.4% | 58.2% | 55.4% | 48.2% | 55.0% | 59.8% | 63.8% | 6% | 25% | 63% | 58% | 34% |
| Gross profit | 49.7% | 59.6% | 60.4% | 53.4% | %98% | 90.4% | 79.3% | 73.6% | 70.5% | 79.5% | 78.6% | 84.9% | 11% | 56% | 83% | 79% | 44% |
| Operating income | 137.1% | 55.1% | 75.5% | 79.0% | 253.6% | 216.7% | 137.3% | 105.7% | 108.4% | 101.3% | 93.8% | 102.3% | 20% | 78% | 148% | 100% | 53% |
| Net income | 125.4% | 295.3% | 112.0% | 120.1% | 286.1% | 201.5% | 123.8% | 92.3% | %9% | 95.9% | 93.5% | 99.1% | -26% | 133% | 136% | 97% | 53% |
Source: Company data, Goldman Sachs Global Investment Research
Kinsus
Factoring in our earnings revisions, we raise our 12m TP to NT$1,515 (from NT$1,125), based on a higher 2028E P/E of 19.5x (was 16.5x, now at +2.0x STDV higher than Kinsus's past upcycle average P/E of 14.2x, reflecting better BT pricing as well as increased contribution from optical module mSAP). We maintain our Buy rating on Kinsus.
e92c7a75ab8b4efbba794e6b187208c8
For the exclusive use of [讀者資訊已遮蔽]
Exhibit 43: Kinsus P&L summary
| NT$mn | 1Q26 | 2Q26 | 3Q26 | 4Q26E | 1Q27E | 2Q27E | 3Q27E | 4Q27E | 1Q28E | 2Q28E | 3Q28E | 4Q28E | 2025E | 2026E | 2027E | 2028E | 2029E |
|---|---|---|---|---|---|---|---|---|---|---|---|---|---|---|---|---|---|
| Revenue | 11,105 | 12,496 | 14,540 | 16,514 | 18,032 | 23,595 | 28,228 | 30,725 | 33,791 | 40,457 | 45,804 | 51,630 | 39,351 | 54,655 | 100,580 | 171,681 | 272,513 |
| Gross profit | 2,349 | 3,261 | 4,506 | 5,156 | 5,944 | 8,332 | 10,265 | 11,559 | 12,859 | 15,851 | 18,490 | 21,295 | 8,314 | 15,273 | 36,100 | 68,495 | 114,717 |
| Operating expense | (1,459) | (1,582) | (1,694) | (1,883) | (2,070) | (2,548) | (3,133) | (3,380) | (3,621) | (4,378) | (4,914) | (5,539) | (5,645) | (6,617) | (11,131) | (18,451) | (29,950) |
| Operating income | 890 | 1,679 | 2,812 | 3,274 | 3,874 | 5,784 | 7,132 | 8,179 | 9,238 | 11,473 | 13,577 | 15,756 | 2,670 | 8656 | 24,969 | 50,044 | 84,766 |
| Pretax income | 964 | 1,785 | 2,912 | 3,274 | 3,924 | 5,834 | 7,132 | 8,164 | 9,288 | 11,523 | 13,577 | 15,741 | 3,087 | 8,935 | 25,054 | 50,129 | 84,951 |
| Taxes expense | (89) | (101) | (495) | (557) | (706) | (1.050) | (1,284) | (1,470) | (1,672) | (2,074) | (2.444) | (2,833) | (370) | (1,241) | (4,510) | (9,023) | (15,291) |
| Net income | 549 | 1,311 | 2,006 | 2,367 | 2,896 | 4,363 | 5,444 | 6,310 | 7,322 | 9,028 | 10,692 | 12,488 | 1,596 | 6,232 | 19,013 | 39,530 | 68,058 |
| EPS, NT$ | 1.17 | 2.57 | 3.94 | 4.65 | 5.69 | 8.57 | 10.69 | 12.39 | 14.38 | 17.73 | 21.00 | 24.52 | 3.52 | 12.33 | 37.34 | 77.63 | 133.65 |
| Ratio analysis and assumption | Ratio analysis and assumption | Ratio analysis and assumption | Ratio analysis and assumption | Ratio analysis and assumption | Ratio analysis and assumption | Ratio analysis and assumption | Ratio analysis and assumption | Ratio analysis and assumption | Ratio analysis and assumption | Ratio analysis and assumption | Ratio analysis and assumption | Ratio analysis and assumption | |||||
| As % of sales | As % of sales | As % of sales | As % of sales | As % of sales | As % of sales | As % of sales | As % of sales | As % of sales | As % of sales | As % of sales | As % of sales | As % of sales | |||||
| Gross margin | 21.2% | 26.1% | 31.0% | 31.2% | 33.0% | 35.3% | 36.4% | 37.6% | 38.1% | 39.2% | 40.4% | 41.2% | 21.1% | 27.9% | 35.9% | 39.9% | 42.1% |
| Operating expense ratio | 13.1% | 12.7% | 11.7% | 11.4% | 11.5% | 10.8% | 11.1% | 11.0% | 10.7% | 10.8% | 10.7% | 10.7% | 14.3% | 12.1% | 11.1% | 10.7% | 11.0% |
| Operating margin | %0% | 13.4% | 19.3% | 19.8% | 21.5% | 24.5% | 25.3% | 26.6% | 27.3% | 28.4% | 29.6% | 30.5% | 6.8% | 15.8% | 24.8% | 29.1% | 31.1% |
| Net margin | 4.9% | 10.5% | 13.8% | 14.3% | 16.1% | 18.5% | 19.3% | 20.5% | 21.7% | 22.3% | 23.3% | 24.2% | 4.1% | 11.4% | 18.9% | 23.0% | 25.0% |
| QoQ growth (%) | QoQ growth (%) | QoQ growth (%) | QoQ growth (%) | QoQ growth (%) | QoQ growth (%) | QoQ growth (%) | QoQ growth (%) | QoQ growth (%) | QoQ growth (%) | QoQ growth (%) | QoQ growth (%) | QoQ growth (%) | |||||
| Revenue | 2.7% | 12.5% | 16.4% | 13.6% | 9.2% | 30.9% | 19.6% | 8.8% | 10.0% | 19.7% | 13.2% | 12.7% | |||||
| Gross profit | -1.8% | 38.8% | 38.2% | 14.4% | 15.3% | 40.2% | 23.2% | 12.6% | 11.2% | 23.3% | 16.6% | 15.2% | |||||
| Operating income | -3.3% | 88.6% | 67.5% | 16.4% | 18.3% | 49.3% | 23.3% | 14.7% | 12.9% | 24.2% | 18.3% | 16.1% | |||||
| Net income | -14.5% | 138.8% | 53.0% | 18.0% | 22.4% | 50.6% | 24.8% | 15.9% | 16.0% | 23.3% | 18.4% | 16.8% | |||||
| Revenue | 28.8% | 30.7% | 40.4% | 52.7% | 62.4% | 88.8% | 94.1% | 86.1% | 87.4% | 71.5% | 62.3% | 68.0% | 29% | 39% | 84% | 71% | %9% |
| Gross profit | 21.0% | 61.8% | 129.5% | 115.4% | 153.0% | 155.5% | 127.8% | 124.2% | 116.3% | 90.2% | 80.1% | 84.2% | -4% | 84% | 136% | 90% | 67% |
| Operating income | 77.7% | 170.8% | 347.9% | 255.6% | 335.1% | 244.5% | 153.6% | 149.8% | 138.4% | 98.4% | 90.4% | 92.6% | 144% | 224% | 188% | 100% | %69 |
| Net income | 9%9% | 287.6% | 491.2% | 268.4% | 427.5% | 232.8% | 171.4% | 166.6% | 152.8% | 106.9% | 96.4% | 97.9% | 3164% | 291% | 205% | 108% | 72% |
Source: Company data, Goldman Sachs Global Investment Research
NYPCB
Factoring in our earnings revisions, we raise our 12m TP to NT$2,700 (from NT$2,500), still based on 21x 2028E P/E (+1.5x STDV above the past upcycle average P/E of 13.3x as we expect a better pricing outlook in the spot price market this time vs. the previous upcycle in 2020-22). We maintain our Buy rating on NYPCB (on CL).
Exhibit 44: NYPCB P&L summary
| NTSmn | 1Q26 | 2Q26 | 3Q26E | 4Q26E | 1Q27E | 2Q27E | 3Q27E | 4Q27E | 1Q28E | 2Q28E | 3Q28E | 4Q28E | 2025 | 2026E | 2027E | 2028E | 2029E |
|---|---|---|---|---|---|---|---|---|---|---|---|---|---|---|---|---|---|
| Revenue | 11,177 | 13,575 | 16,378 | 20,122 | 23,605 | 28,615 | 34,474 | 40,700 | 45,020 | 51,136 | 57,127 | 61,988 | 40,173 | 61,253 | 127,394 | 215,270 | 339,085 |
| Gross profit | 1,771 | 3,360 | 4,877 | 7,146 | 9,370 | 12,631 | 15,964 | 19,498 | 22,542 | 26,096 | 29,698 | 32,963 | 3,647 | 17,153 | 57,463 | 111,300 | 193,047 |
| Operating expense | (419) | (460) | (428) | (502) | (594) | (682) | (817) | (953) | (1,005) | (1.125) | (1,200) | (1,390) | (1,665) | (1,810) | (3,046) | (4,720) | (7,971) |
| Operating income | 1,352 | 2,899 | 4,449 | 6,643 | 8,776 | 11,949 | 15,147 | 18,545 | 21,537 | 24,971 | 28,499 | 31,573 | 1,982 | 15,344 | 54,417 | 106,580 | 185,077 |
| Pretax income | 1,598 | 2,976 | 4,629 | 6,823 | 8,776 | 11,949 | 15,147 | 18,545 | 21,537 | 24,971 | 28,499 | 31,573 | 2,346 | 16,026 | 54,417 | 106,580 | 185,797 |
| Taxes expense | (290) | (714) | (1,018) | (1,501) | (1,667) | (2,629) | (3,332) | (3,709) | (4,738) | (5,494) | (6,270) | (6,946) | (399) | (3,523) | (11,338) | (23,448) | (40,548) |
| Net income | 1,309 | 2,262 | 3,610 | 5,322 | 7,108 | 9,320 | 11,815 | 14,836 | 16,799 | 19,478 | 22,229 | 24,627 | 1,947 | 12,503 | 43,079 | 83,133 | 145,249 |
| EPS, NT$ | 2.03 | 3.50 | 5.59 | 8.24 | 11.00 | 14.42 | 18.28 | 22.96 | 26.00 | 30.14 | 34.40 | 38.11 | 3.01 | 19.35 | 66.67 | 128.66 | 224.79 |
| Ratio analysis and assumption | Ratio analysis and assumption | Ratio analysis and assumption | Ratio analysis and assumption | Ratio analysis and assumption | Ratio analysis and assumption | Ratio analysis and assumption | Ratio analysis and assumption | Ratio analysis and assumption | Ratio analysis and assumption | Ratio analysis and assumption | Ratio analysis and assumption | Ratio analysis and assumption | |||||
| As % of sales | As % of sales | As % of sales | As % of sales | As % of sales | As % of sales | As % of sales | As % of sales | As % of sales | As % of sales | As % of sales | As % of sales | As % of sales | |||||
| Gross margin | 15.8% | 24.7% | 29.8% | 35.5% | 39.7% | 44.1% | 46.3% | 47.9% | 50.1% | 51.0% | 52.0% | 53.2% | 9.1% | 28.0% | 45.1% | 51.7% | 56.9% |
| Operating expense ratio | 3.8% | 3.4% | 2.6% | 2.5% | 2.5% | 2.4% | 2.4% | 2.3% | 2.2% | 2.2% | 2.1% | 2.2% | 4.1% | 3.0% | 2.4% | 2.2% | 2.4% |
| Operating margin | 12.1% | 21.4% | 27.2% | 33.0% | 37.2% | 41.8% | 43.9% | 45.6% | 47.8% | 48.8% | 49.9% | 50.9% | 4.9% | 25.0% | 42.7% | 49.5% | 54.6% |
| Net margin | 11.7% | 16.7% | 22.0% | 26.5% | 30.1% | 32.6% | 34.3% | 36.5% | 37.3% | 38.1% | 38.9% | 39.7% | 4.8% | 20.4% | 33.8% | 38.6% | 42.8% |
| QoQ growth (%) | QoQ growth (%) | QoQ growth (%) | QoQ growth (%) | QoQ growth (%) | QoQ growth (%) | QoQ growth (%) | QoQ growth (%) | QoQ growth (%) | QoQ growth (%) | QoQ growth (%) | QoQ growth (%) | QoQ growth (%) | QoQ growth (%) | QoQ growth (%) | QoQ growth (%) | QoQ growth (%) | QoQ growth (%) |
| Revenue | 0.1% | 21.5% | 20.6% | 22.9% | 17.3% | 21.2% | 20.5% | 18.1% | 10.6% | 13.6% | 11.7% | 8.5% | |||||
| Gross profit | 26.7% | 89.7% | 45.2% | 46.5% | 31.1% | 34.8% | 26.4% | 22.1% | 15.6% | 15.8% | 13.8% | 11.0% | |||||
| Operating income | 40.4% | 114.4% | 53.4% | 49.3% | 32.1% | 36.2% | 26.8% | 22.4% | 16.1% | 15.9% | 14.1% | 10.8% | |||||
| Net income | 8.9% | 72.8% | 59.6% | 47.4% | 33.6% | 31.1% | 26.8% | 25.6% | 13.2% | 15.9% | 14.1% | 10.8% | |||||
| YoY growth (%) | YoY growth (%) | YoY growth (%) | YoY growth (%) | YoY growth (%) | YoY growth (%) | YoY growth (%) | YoY growth (%) | YoY growth (%) | YoY growth (%) | YoY growth (%) | YoY growth (%) | YoY growth (%) | YoY growth (%) | YoY growth (%) | YoY growth (%) | YoY growth (%) | YoY growth (%) |
| Revenue | 32.1% | 41.7% | 49.3% | 80.2% | 111.2% | 110.8% | 110.5% | 102.3% | 90.7% | 78.7% | 65.7% | 52.3% | 24% | 52% | 108% | 69% | 58% |
| Gross profit | 311.7% | 337.0% | 364.5% | 411.1% | 428.9% | 276.0% | 227.4% | 172.9% | 140.6% | 106.6% | 86.0% | 69.1% | 920% | 370% | 235% | 94% | 73% |
| Operating income | 3986.2% | 692.0% | 617.2% | 589.9% | 549.0% | 312.1% | 240.5% | 179.2% | 145.4% | 109.0% | 88.1% | 70.3% | -257% | 674% | 255% | 96% | 74% |
| Net income | 530.8% | NA | 398.1% | 342.8% | 443.2% | 312.1% | 227.2% | 178.8% | 136.3% | 109.0% | 88.1% | 66.0% | 856% | 542% | 245% | 93% | 75% |
Source: Company data, Goldman Sachs Global Investment Research
Unimicron
Factoring in our earnings revisions, we raise our 12m TP to NT$1,270 (from NT$1,220), still based on 17.4x 2028E P/E. We believe the company could trade at 2.7x STDV higher than past upcycle average P/E of 10.3x. We maintain our Neutral rating on Unimicron.
e92c7a75ab8b4efbba794e6b187208c8
For the exclusive use of [讀者資訊已遮蔽]
Exhibit 45: Unimicron P&L summary
| NT$mn | 1Q26 | 2Q26 | 3Q26E | 4Q26E | 1Q27E | 2Q27E | 3Q27E | 4Q27E | 1Q28E | 2Q28E | 3Q28E | 4Q28E | 2025 | 2026E | 2027E | 2028E | 2029E |
|---|---|---|---|---|---|---|---|---|---|---|---|---|---|---|---|---|---|
| Revenue | 37,446 | 42,890 | 51,240 | 58,984 | 63,490 | 71,389 | 81,223 | 92,138 | 96,734 | 102,139 | 113,371 | 123,647 | 131,241 | 190,560 | 308,240 | 435,891 | 590,587 |
| Gross profit | 6,726 | 10,638 | 14,351 | 17,580 | 20,266 | 24,453 | 29,566 | 35,428 | 37,955 | 41,427 | 47,092 | 51,999 | 18,292 | 49,296 | 109,713 | 178,473 | 260,729 |
| Operating expense | (3,969) | (3,987) | (4,150) | (4,542) | (4,726) | (5,222) | (5,866) | (6,574) | (6,905) | (7,193) | (7,983) | (8,589) | (11,618) | (16,649) | (22,388) | (30,670) | (40,437) |
| Operating income | 2,757 | 6,651 | 10,201 | 13,039 | 15,540 | 19,231 | 23,700 | 28,854 | 31,049 | 34,235 | 39,109 | 43,410 | 6,674 | 32,647 | 87,324 | 147,803 | 220,292 |
| Pretax income | 6,299 | 15,576 | 10,201 | 13,039 | 15,540 | 19,231 | 23,700 | 28,854 | 31,049 | 34,235 | 39,109 | 43,410 | 8,827 | 45,114 | 87,324 | 147,803 | 220,292 |
| Taxes expense | (918) | (2,233) | (2,040) | (2,534) | (3.108) | (4,231) | (5,451) | (5,608) | (6,831) | (7,532) | (8,995) | (9,550) | (1,277) | (7.726) | (18,398) | (32,908) | (46,581) |
| Net income | 5,043 | 13,115 | 7,861 | 10,204 | 12,132 | 14,700 | 17,949 | 22,946 | 23,919 | 26,403 | 29,814 | 33,560 | 6,673 | 36,223 | 67,727 | 113,695 | 173,141 |
| EPS, NT$ | 3.28 | 8.45 | 5.06 | 6.57 | 7.97 | 9.66 | 11.79 | 15.07 | 15.41 | 17.01 | 19.21 | 21.62 | 4.38 | 23.37 | 44.49 | 73.25 | 113.73 |
| Ratio analysis and assumption | Ratio analysis and assumption | Ratio analysis and assumption | Ratio analysis and assumption | Ratio analysis and assumption | Ratio analysis and assumption | Ratio analysis and assumption | Ratio analysis and assumption | Ratio analysis and assumption | Ratio analysis and assumption | Ratio analysis and assumption | Ratio analysis and assumption | Ratio analysis and assumption | |||||
| As % of sales | As % of sales | As % of sales | As % of sales | As % of sales | As % of sales | As % of sales | As % of sales | As % of sales | As % of sales | As % of sales | As % of sales | As % of sales | |||||
| Gross margin | 18.0% | 24.8% | 28.0% | 29.8% | 31.9% | 34.3% | 36.4% | 38.5% | 39.2% | 40.6% | 41.5% | 42.1% | 13.9% | 25.9% | 35.6% | 40.9% | 44.1% |
| Operating expense ratio | 10.6% | 9.3% | 8.1% | 7.7% | 7.4% | 7.3% | 7.2% | 7.1% | 7.1% | 7.0% | 7.0% | 6.9% | 8.9% | 8.7% | 7.3% | 7.0% | 6.8% |
| Operating margin | 7.4% | 15.5% | 19.9% | 22.1% | 24.5% | 26.9% | 29.2% | 31.3% | 32.1% | 33.5% | 34.5% | 35.1% | 5.1% | 17.1% | 28.3% | 33.9% | 37.3% |
| Net margin | 13.5% | 30.6% | 15.3% | 17.3% | 19.1% | 20.6% | 22.1% | 24.9% | 24.7% | 25.9% | 26.3% | 27.1% | 5.1% | 19.0% | 22.0% | 26.1% | 29.3% |
| QoQ growth (%) | QoQ growth (%) | QoQ growth (%) | QoQ growth (%) | QoQ growth (%) | QoQ growth (%) | QoQ growth (%) | QoQ growth (%) | QoQ growth (%) | QoQ growth (%) | QoQ growth (%) | QoQ growth (%) | QoQ growth (%) | |||||
| Revenue | 7.9% | 14.5% | 19.5% | 15.1% | 83.0% | 12.4% | 13.8% | 13.4% | 64.0% | 5.6% | 11.0% | 9.1% | |||||
| Gross profit | 22.9% | 58.2% | 34.9% | 22.5% | 270.4% | 20.7% | 20.9% | 19.8% | 115.9% | 9.1% | 13.7% | 10.4% | |||||
| Operating income | 16.5% | 141.3% | 53.4% | 27.8% | 556.9% | 23.8% | 23.2% | 21.7% | 138.1% | 10.3% | 14.2% | 11.0% | |||||
| Net income | 42.7% | 160.1% | -40.1% | 29.8% | 243.2% | 21.2% | 22.1% | 27.8% | 134.4% | 10.4% | 12.9% | 12.6% | |||||
| YoY growth (%) | YoY growth (%) | YoY growth (%) | YoY growth (%) | YoY growth (%) | YoY growth (%) | YoY growth (%) | YoY growth (%) | YoY growth (%) | YoY growth (%) | YoY growth (%) | YoY growth (%) | YoY growth (%) | |||||
| Revenue | 24.4% | 32.1% | 50.7% | 70.0% | 111.0% | 119.9% | 138.9% | 165.6% | 158.3% | 138.1% | 121.3% | 109.6% | 14% | 45% | 62% | 41% | 35% |
| Gross profit | 67.1% | 150.6% | 215.5% | 221.3% | 403.4% | 476.0% | 550.0% | 547.4% | 464.3% | 289.4% | 228.1% | 195.8% | 12% | 169% | 123% | 63% | 46% |
| Operating income | 117.6% | 340.7% | 56566% | 451.2% | 1126.7% | 1174.1% | 1446.4% | 1119.7% | 1026.3% | 414.7% | 283.4% | 232.9% | 30% | 389% | 167% | 69% | 49% |
| Net income | 451.4% | NA | 258.2% | 188.7% | 1226.6% | NA | 717.9% | 549.2% | 374.3% | 101.3% | 279.3% | 228.9% | 31% | 443% | 87% | 68% | 52% |
Source: Company data, Goldman Sachs Global Investment Research
Investment thesis, PT methodology and risks
Investment Thesis - Zhen Ding Technology
Zhen Ding Technology (ZDT) is the global leading PCB supplier (top 1 in market share in sales) with 7-10% market share, and started its ABF substrate business from 2023 in Shenzhen, China; it has the highest ABF revenue exposure to the China market compared to all other ABF substrate suppliers. We believe ZDT will hold more than 40% ABF substrate market share in China by 2027E (up from 31% in 2024) and benefit the most from the strong and growing China ABF substrate market (53% 2025-27E CAGR) due to the increasing in-sourcing ratio for the AI computing ASIC/GPU market in China. We also expect the increasing foldable smartphone penetration rate in the long term to drive ZDT's FPC TAM, and account for 39% of the company's total revenue in 2027E. We see further revenue upside potential from foldable phones. We are Buy rated mainly due to our positive view on the company's China ABF substrate business opportunity, which should not only drive ZDT's revenue growth, but also improve its OPM level in the long term. We see upside for the stock price considering the company's solid growth opportunity, and our TP implied P/E multiple is still lower than the company's past 10+ year P/E average, which we believe is fair considering the potential upside from China ABF substrate market and increasing foldable phone penetration rate.
Valuation: Our 12-month TP of NT$1,025 is based on a SOTP valuation methodology, including (1) 3.5x blended 2028E P/B for ABF & BT substrate, (2) 20x 2028E P/E for high-growth AI server/switch related PCB (in line with industry average), and (3) 8x 2028E P/E for low-growth consumer electronics PCB (in line with industry downcycle average valuation).
Key downside risks include: (1) weaker-than-expected iPhone demand or slower content upgrade, (2) delay in new substrate capacity or slower-than-expected yield rate ramp up progress, and (3) fiercer competition in China ABF market.
e92c7a75ab8b4efbba794e6b187208c8
For the exclusive use of [讀者資訊已遮蔽]
Investment Thesis - Kinsus
Kinsus is one of the key IC substrates suppliers globally with ~10% ABF/BT substrates market share in 2024, with ~18% of total 2025 revenue contributed by its contact lens subsidiary, Pegavision (6941.TW, Not Covered). With our view that the ABF substrate shortage started from 2Q26 (ABF substrate return to supply demand balance from late 2025), we believe Kinsus' performance will continue to improve compared with high-end ABF peers considering the company's increasing market share in the high-end ABF substrate market; however, ~36% of the company's revenue was contributed by BT substrates in 2025 and 30% of the company's ABF revenue is from non-LTA customers, which we believe will continue to enjoy a better pricing outlook. As a result, we believe Kinsus' earnings outlook should continue to be strong (~118% 2026-29E CAGR), mainly driven by better BT substrate and non-LTA ABF substrate pricing outlook, despite the unfavorable demand outlook before 1H26. We believe Kinsus is an experienced substrate supplier with a clear capacity expansion plan that can also upgrade its product portfolio in the long term. We believe we are at the beginning of an industry upcycle, making us positive on Kinsus' stock performance over the next 12 months.
Price Target Risks and Methodology - Kinsus
Valuation methodology: Our 12-month target price of NT$1,515 for Kinsus is based on 19.5x 2028E P/E, which is +2.0x STDV higher than Kinsus' past upcycle average P/E (14.2x).
Key downside risks: (1) Slower-than-expected PC demand recovery, (2) Slower-than-expected ABF substrates pricing upgrading outlook, (3) Slower/Less-than-expected AI server orders from 2H26.
Investment Thesis - NYPCB
NYPCB manufactures and markets printed circuit boards (PCBs) and integrated circuit (IC) substrates (including ABF and BT substrates). We are Buy rated on NYPCB considering the company's high exposure to BT substrates and non-LTA ABF substrate (70%+ of total revenue), where we expect GM/OPM to increase significantly in the coming quarters (from breakeven in OPM in 1H25 to 26/42% in 2026/27E) due to the favorable substrate pricing outlook. Despite the company's low exposure to high-end ABF substrate industry (<20% of total revenue in 2025), we believe the expanding demand from ASIC AI server and high-end switch IC demand will drive the company's high-end ABF revenue exposure to 40%+ by 2027E, suggesting better GM/OPM outlook in the long term. In 2H25-2H26, we believe NYPCB will continue to benefit from stronger ABF/BT pricing and should be a key beneficiary of the pricing uptrend considering the company's key focus on BT and non-LTA ABF substrate industries. Moreover, in the long term (after 2026), we expect the ABF industry to return to supply tightness, and NYPCB's expanding high-end exposure will lead to a long-term earnings growth outlook (148% 2026-28E earnings CAGR). As a result, we see solid upside potential for NYPCB's earnings and stock performance.
Price Target Risks and Methodology - NYPCB
Valuation methodology: Our 12-month target price of NT$2,700 for NYPCB is based on 21x 2028E P/E, which is +1.5x STDV higher than the past upcycle average P/E (13.3x).
Key downside risks: (1) Slower-than-expected PC demand recovery, (2)
e92c7a75ab8b4efbba794e6b187208c8
For the exclusive use of [讀者資訊已遮蔽]
Slower-than-expected ABF substrates pricing upgrading outlook, and (3) Slower-than-expected NYPCB new high-end capacity qualification progress.
Investment Thesis - Unimicron Technology
Unimicron is a key supplier of ABF substrates (25% market share in 2025) and BT substrates and also produces FPC/HDI/PCB products. We are Neutral rated on the shares given long-term growth opportunity prospects: (1) over 70% of ABF shipments are covered by long-term agreements (LTA), which limits pricing flexibility and makes price hike less likely; (2) the company's execution track record has been weaker than peers; (3) capacity expansion plan remains slower than peers, constraining its ability to capture incremental AI demand. The current ABF substrates market is seeing more favorable supply demand outlook, and Unimicron is likely to see better pricing outlook to reflect rising material costs in the coming quarters. AI ABF account for 10% of the company's total revenue, but the growth is likely to be slower than peers due to the company continuing to lose market share to peers given its less favourable production yield and slow capacity expansion. Overall, we are Neutral rated on Unimicron given our outlook for limited upside potential, barring ASIC AI servers, despite our generally positive view in the long term on its profitability trajectory.
Price Target Risks and Methodology - Unimicron Technology
Valuation methodology: Our 12-month target price of NT$1,270 for Unimicron is based on 17.4x 2028E P/E, which is 2.7x STDV higher than the past upcycle average P/E (10.3x).
Key upside/downside risks: (1) Slower/faster-than-expected PC demand recovery, (2) Slower/faster-than-expected ABF substrates upgrading pace, and (3) Slower/faster than-expected AI server PCB market share loss progress.
e92c7a75ab8b4efbba794e6b187208c8
For the exclusive use of [讀者資訊已遮蔽]