PDF 原檔:報告_Daiwa_亞洲晶圓代工_20261009_original.pdf
圖片清單(已驗證 2026-10-12)
ingest 時建立的「眼見為憑」圖片索引,是 lib/ 嵌圖的唯一真相來源。015–034 與世界先進首次覆蓋報告 001–020 逐檔 cmp 位元相同、008–010 與聯電報告 001–003 相同;<40KB 未 Read 者免列(預設小圖/logo)。
| 檔名 | size | 分類 | 親眼所見內容 |
|---|---|---|---|
報告_Daiwa_亞洲晶圓代工_20261009_001.png |
47KB | 裝飾·logo·banner | 評等標籤「Positive (unchanged)」+分析師照片與聯絡資訊 |
報告_Daiwa_亞洲晶圓代工_20261009_002.png |
173KB | 真資料圖 | 「A broad-based AI ecosystem and key supply-chain players」供應鏈總圖:Cloud AI(Data training/inference)、Edge AI、AI peripherals 對應 GPU/CPU、ASIC、Memory、Thermal/power 各廠商清單,下接 CMOS foundry(TSMC、SEC、Intel)、Compound foundry(WinSemi、Broadcom、Sumitomo、GCS/San'an)、OSAT(ASE、JCET、Amkor、TFME、KYEC、PTI),再到 Materials/SPE、Semiconductor、Component、ODM/OEM vendor;右側標 Compute/Connectivity/Memory/Power,部分廠商以紅圈標示 |
報告_Daiwa_亞洲晶圓代工_20261009_003.png |
49KB | 真資料圖 | 產能利用率折線:TSMC、UMC、SMIC、HHG Semi、VIS,1Q20–4Q28E;2022 後 UMC/VIS 落到 55–60%,3Q26E 起以紅圈標示各家回到約 90–100% |
報告_Daiwa_亞洲晶圓代工_20261009_004.png |
44KB | 真資料圖 | Blended ASP 折線:UMC、SMIC、HHG Semi、VIS(左軸 300–1,100)與 TSMC(右軸 1,000–4,500),1Q20–4Q28E |
報告_Daiwa_亞洲晶圓代工_20261009_006.png |
41KB | 真資料圖 | 台積電月營收長條(TWDbn,Jan-16 至 Dec-26)與 YoY 折線 |
報告_Daiwa_亞洲晶圓代工_20261009_007.png |
44KB | 真資料圖 | 「TSMC: PBR trend」1995–2027 折線,標註 10.0、11.9、5.5、2.2、2.0、4.8、7.8、6.8、8.0 及 mean/mean±s 線 |
報告_Daiwa_亞洲晶圓代工_20261009_010.png |
44KB | 真資料圖 | 「UMC: PBR trend」1990–2027 折線,標註 Avg=c.3x、0.6–1.1x、Avg=? |
報告_Daiwa_亞洲晶圓代工_20261009_012.png |
43KB | 真資料圖 | Capex(USDm 長條)與 capital intensity(折線)2005–2028E,2020–2026E 區段以綠圈標示(圖上無公司名;報告該頁為 SMIC 段) |
報告_Daiwa_亞洲晶圓代工_20261009_013.png |
41KB | 真資料圖 | P/BV 折線 Jan-09–Jan-27,標註 1.4x、0.4x、1.2x、0.3x、2x 及 mean/mean±s 線(圖上無公司名;報告該頁為 SMIC 段) |
報告_Daiwa_亞洲晶圓代工_20261009_017.png |
42KB | 裝飾·logo·banner | 世界先進評等標籤「Outperform (initiation)」+Growth outlook/Valuation/Earnings revisions 勾選評分(與世界先進首次覆蓋 003 相同) |
報告_Daiwa_亞洲晶圓代工_20261009_018.png |
43KB | 真資料圖 | VIS 季度 FD EPS 長條(TWD)與 YoY 折線,1Q15–3Q28E |
報告_Daiwa_亞洲晶圓代工_20261009_021.png |
40KB | 真資料圖 | 「VIS: revenue mix by product」堆疊長條 1Q15–1Q26:D/D(large)、D/D(small)、PMIC、Others |
報告_Daiwa_亞洲晶圓代工_20261009_024.png |
42KB | 真資料圖 | VIS 折舊與攤銷(TWDm 長條)與 YoY 折線,2010–2028E |
報告_Daiwa_亞洲晶圓代工_20261009_026.png |
42KB | 真資料圖 | 「VIS: quarterly ASP trend」1Q10–4Q28E 折線,紅圈標「inflated by COVID」、紅箭頭標 2025 後上升 |
報告_Daiwa_亞洲晶圓代工_20261009_030.png |
45KB | 真資料圖 | 「VIS: PBR trend」Mar-98–Mar-27 折線與 mean、mean+s 線 |
報告_Daiwa_亞洲晶圓代工_20261009_032.png |
47KB | 真資料圖 | 「Revenue growth: VIS vs. foundry market ex-TSMC」2010–2028E 兩條 YoY 折線 |
原始內容
Asia Foundry
A paradigm shift in specialty nodes
- A ripple effect in demand from advanced to specialty foundries spurred by AI scaling from compute to power/connectivity
- Likely paradigm shift in the foundry industry driven by TSMC's fab optimisation augmenting demand for specialty nodes
- Reaffirming our Positive stance on the sector and initiating coverage of VIS, which we expect to benefit from this paradigm shift
What's new: TSMC at its series of results calls delivered not only escalated business guidance but its effort of fab optimisation to address supply constraints driven by accelerated AI HPC demand. This, together with a ripple effect from advanced to specialty foundry demand spurred by AI scaling from compute to power and connectivity, will likely shift the paradigm in the industry, unlocking demand for specialty nodes which we expect to structurally benefit peers from 2H26. Among TSMC's peers we cover offering specialty foundry works, we initiate coverage of Vanguard International Semiconductor (VIS) with an Outperform (2) rating and 12M TP of TWD210, as we believe VIS is benefiting from this paradigm shift.
What's the impact: AI scaling spurring specialty foundry demand. Flagged in our series of AI thematic reports since 2023, we envision the AI buildout a multi-year cycle scaling from generative to agentic to physical, and from cloud to edge to ubiquitous. The scaling is not only spurring demand for core chips benefiting advanced foundries but companion chips benefiting specialty foundries, in order to facilitate the entire ecosystem of compute, connectivity, and power. Since many AI companion chips do not require advanced nodes, second-tier foundries have followed TSMC as the second-wave beneficiary on the AI ramp, seeing improved capacity utilisation with improved pricing power, per our market research, thanks to a ripple effect in the specialty foundry demand which should help push utilisation higher into 2027 to reach full levels.
Augmented by TSMC's fab optimisation. We expect such a ripple effect to be further augmented by TSMC's fab optimisation, in order to address a supply shortfall in the advanced foundries caused by the strong AI HPC demand. This looks set to shift the paradigm in the foundry industry, structurally benefiting peers' operating specialty nodes. We expect the fab optimisation to unlock business worth of c.USD3bn pa, or c.40% of UMC's 2025 revenue, with spillover taking effect from this year and ramping into 2027-28E, considering different timings of TSMC's fab closures and associated lead times for customer qualifications of alternative fabs.
What we recommend: Among the specialty foundries under our coverage in Asia, we initiate on VIS with an Outperform (2) rating and expect it to benefit from this paradigm shift, in addition to UMC (Hold [3]). HHGrace (Buy [1]) and SMIC (Sell [5]) should also benefit, yet to a lesser extent for the latter due to geopolitical issues.
How we differ: We believe we are one of few brokers quantifying business potential from TSMC's fab optimisation to the second-tier foundries.
Key stock calls
| New | Prev. | |
|---|---|---|
| Taiwan Semiconductor Manufacturing (2330 TT) | Taiwan Semiconductor Manufacturing (2330 TT) | Taiwan Semiconductor Manufacturing (2330 TT) |
| Rating | Buy | Buy |
| Target | 3,000.00 | 3,000.00 |
| Upside | 16.1% | |
| United Microelectronics (2303 TT) | United Microelectronics (2303 TT) | United Microelectronics (2303 TT) |
| Rating | Hold | Hold |
| Target | 145.00 | 108.00 |
| Downside | 2.4% | |
| Semiconductor Manufacturing Int'l Corp (981 HK) | Semiconductor Manufacturing Int'l Corp (981 HK) | Semiconductor Manufacturing Int'l Corp (981 HK) |
| Rating | Sell | Sell |
| Target | 40.00 | 40.00 |
| Downside | 34.3% | |
| Hua Hong Grace Semiconductor (1347 HK) | Hua Hong Grace Semiconductor (1347 HK) | Hua Hong Grace Semiconductor (1347 HK) |
| Rating | Buy | Buy |
| Target | 139.00 | 139.00 |
| Upside | 32% | |
| Vanguard International Semiconductor (5347 TT) | Vanguard International Semiconductor (5347 TT) | Vanguard International Semiconductor (5347 TT) |
| Rating | Outperform | |
| Target | 210.00 | |
| Upside | 10.5% |
Source: Daiwa forecasts
Sector stocks: key indicators
| Company Name | Stock code | Share - Price | Rating - New | Rating - Prev. | Target price (local curr.) - New | Target price (local curr.) - Prev. | Target price (local curr.) - %chg | EPS (local curr.) - FY1 - New | EPS (local curr.) - FY1 - Prev. | EPS (local curr.) - FY1 - %chg | EPS (local curr.) - FY2 - New | EPS (local curr.) - FY2 - Prev. | EPS (local curr.) - FY2 - %chg |
|---|---|---|---|---|---|---|---|---|---|---|---|---|---|
| Hua Hong Grace Semiconductor | 1347 HK | 105.30 | Buy | Buy | 139.00 | 139.00 | 0.0% | 0.106 | 0.106 | 0.0% | 0.154 | 0.154 | 0.0% |
| Semiconductor Manufacturing Int'l Corp | 981 HK | 60.90 | Sell | Sell | 40.00 | 40.00 | 0.0% | 0.175 | 0.175 | 0.0% | 0.204 | 0.204 | 0.0% |
| Taiwan Semiconductor Manufacturing | 2330 TT | 2,585.00 | Buy | Buy | 3,000.00 | 3,000.00 | 0.0% | 109.608 | 109.612 | (0.0%) | 134.693 | 134.687 | 0.0% |
| United Microelectronics | 2303 TT | 148.50 | Hold | Hold | 145.00 | 108.00 | 34.3% | 7.222 | 7.112 | 1.5% | 7.099 | 5.826 | 21.9% |
| Vanguard International Semiconductor | 5347 TT | 190.00 | Outperform | 210.00 | 5.896 | 7.919 |
Source: Bloomberg, Daiwa forecasts; note: share prices in local currency as of close on 7 October 2026
Table of contents
| A paradigm shift in specialty nodes .........................................................................4 |
|---|
| AI scaling spurring specialty foundry demand .....................................................................4 |
| Augmented by TSMC's fab optimisation ..............................................................................5 |
| Stock recommendations ......................................................................................................6 |
| Company Section |
| Taiwan Semiconductor Manufacturing .................................................................................8 |
| United Microelectronics ......................................................................................................13 |
| Semiconductor Manufacturing Int'l Corp ............................................................................18 |
| Hua Hong Grace Semiconductor .......................................................................................23 |
| Vanguard International Semiconductor ..............................................................................28 |
AI scaling augmented by fab optimisation for a paradigm shift in the foundry industry benefiting specialty nodes
Initiating coverage of VIS with an Outperform (2) call in this report
CUR at second-tier foundries are improving as many AI companion chips don't require advanced nodes
A paradigm shift in specialty nodes
TSMC at its series of quarterly results calls this year (Too good to be true? (II), 16 April; Yes, it's good and it's true, 16 July) delivered not only escalated business guidance but its strategy of fab optimisation, in order to address supply constraints driven by rapidly growing demand for AI high-performance compute (HPC) chips that require advanced technology nodes. We view its fab optimisation as likely shifting the paradigm in the foundry industry, unlocking demand for specialty process nodes structurally benefiting peers from this year. TSMC's fab optimisation should help augment a ripple effect in demand being spurred by AI scaling from compute to power and connectivity, ever since this multi-year AI buildout cycle began from 2023 after OpenAI's ChatGPT dropped from the air.
Among TSMC's peers we cover offering specialty foundry works, we see Vanguard International Semiconductor (VIS) as benefiting from this paradigm shift, thus initiating our coverage of the stock with an Outperform (2) rating and 12M TP of TWD210. Elsewhere, we believe UMC will benefit from this shift, thus raising our forecasts in this report, though we are comfortable with our Hold (3) rating on valuation grounds. While Huahong Grace Semiconductor (HHGrace; rated Buy [1]) stands to benefit from China's AI developments, we see SMIC (rated Sell [5]) also benefiting, but to a lesser extent, due to geopolitical issues such as the US's export controls prolonging its advanced technology developments.
AI scaling spurring specialty foundry demand
As flagged in our series of AI thematic reports since 2023 (Let's talk about AI or … bubble? 11 July 2023, Let's talk about AI, not bubble, 25 October 2024, and Let's talk more about AI, ASIC AI this time, 1 July 2025), we have envisioned the AI buildout a multi-year cycle scaling vertically by language from generative (data training) to agentic (data inference) to ultimately physical AI, and scaling horizontally by application from cloud to edge to ultimately ubiquitous AI (ie, AI everywhere).
Ever since late-2022 when OpenAI's ChatGPT dropped from the air, followed by Nvidia kicking off the AI build from 2023, this multi-year AI scaling has not only spurred demand for core chips such as GPU and application specific IC (ASIC) as accelerators benefiting advanced foundries, but for companion chips such as optical engines, drivers, super transimpedance amplifier (TIA), digital signal processor (DSP), and power semiconductors benefiting specialty foundries, in order to facilitate the entire AI ecosystem of compute, connectivity, and power, as well as memory, illustrated in a chart next page.
Many AI companion chips do not require advanced process nodes but specialty technologies such as silicon-germanium (SiGe), silicon-on-insulator (SoI), and bipolarCMOS-DMOS (BCD) with a variety of heavily doped wafer materials such as galliumnitride (GaN), GaN-on-silicon and GaN-on-silicon-carbide (SiC) handling a variety of different voltage currents ranging from a few volts to over 1,000v. Therefore, we have seen improved capacity utilisation rates (CUR) across the second-tier foundries since the start of the year which offer these specialty technologies, following TSMC as the second-wave beneficiary on the AI ramps, thanks to a ripple effect in the specialty foundry demand which should help push the second-tier CUR higher through 2027 to reach full levels, according to our market research.
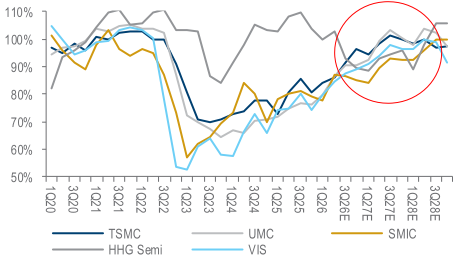
As illustrated in a chart next page, we expect the CUR among the second-tier foundries of UMC, HHGrace, and VIS, following the trough in 1Q23 on the post-COVID inventory correction, to follow TSMC's trajectory, accelerating in 2H26E to 90% or above and reaching the 100% level through most time of 2027-28E, resulting in improved pricing power for the like-to-like price hikes varied in different timings.
A broad-based AI ecosystem and key supply-chain players
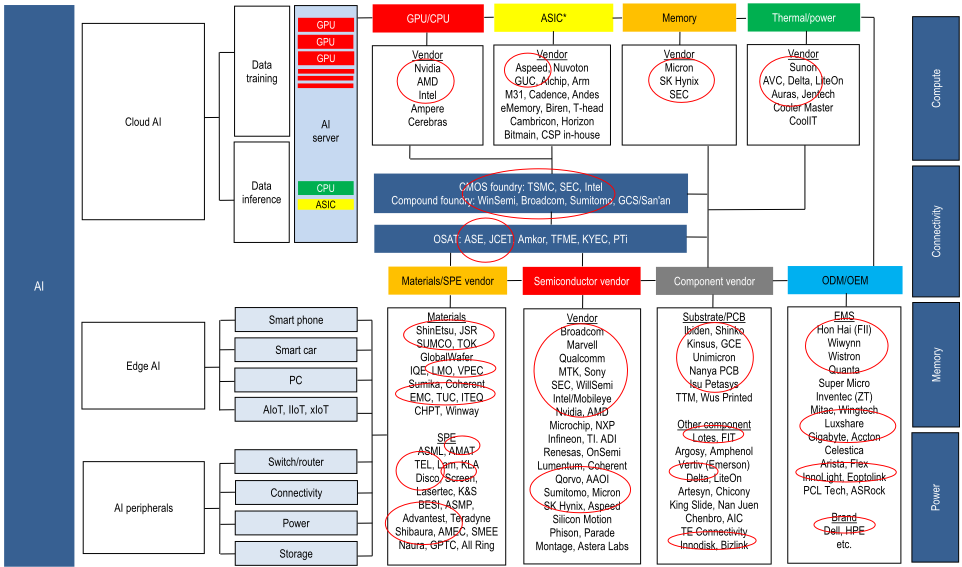
Source: Daiwa
Note: * ASIC includes a variety of customized chips such as xPU, BMC and HSI controller (PCIe, SATA); CSP = cloud service provider
Asia Foundry: capacity utilisation trends among foundry majors*
Asia Foundry: blended ASP trends among foundry majors*
Source: Companies, Daiwa estimates and forecasts
Note: * wafer shipment divided by installed capacity, not wafer output
Source: Companies, Daiwa estimates and forecasts Note: * in USD terms on 8' equivalent basis for the like-to-like comparison
Augmented by TSMC's fab optimisation
We expect such a ripple effect in the specialty foundry demand to be further augmented by TSMC's fab optimisation, in which the foundry leader aims to address a supply shortfall in the advanced foundry works caused by the strong AI HPC demand, including AI CPU, all types of xPU as accelerators and base dies for high bandwidth memory (HBM), by TSMC's definition. We expect its optimisation strategy to likely shift the paradigm in the foundry industry structurally to benefit peers operating specialty process nodes.
TSMC's fab optimisation looks set to further augment the AI demand ripple effect
TSMC: expected schedule of mature fab closures
| Wafer fab | Location | Wafer size | Process node | Capacity (wpm*) | Note |
|---|---|---|---|---|---|
| Fab 2 | Hsinchu Science Park | 6" | 0.5-0.8u | 85,000 | 40%+ of VIS revenue |
| Fab 5 | Hsinchu Science Park | 8" | 0.15-0.35u | 50,000 | 40%+ of VIS revenue |
| Subtotal (8" equivalent) | 97,813 | ||||
| Fab 15/P3 | Taichung Science Park | 12" | 28/22/20nm | 50,000 | c.30% of UMC revenue |
| Total (12" equivalent) | 93,472 |
Source: Company, Daiwa estimates
Note: * wpm = wafers per month
TSMC's fab optimisation may unlock c.USD3bn in business pa
Among the specialty foundries under our coverage, our preference goes to VIS and HHGrace According to our market research, in order to accommodate more advanced packaging capacity such as chip-on-wafer-on-substrate (CoWoS), TSMC is shutting down one 6' fab (Fab 2) and one 8' fab (Fab 5) this year with a combined capacity of c.98k wafers per month (wpm) in 8' equivalent size (ie, 200mm in wafer diameter). Covering process nodes ranging from 0.8u to 0.15u, closures of the 2 mature fabs will likely unlock business ranging from USD700m to USD800m pa, depending on the average selling prices (ASP) for different nodes ranging from USD250 for 0.8u to more than USD700 for 0.15u, on our estimates, or more than 40% of VIS's 2025 revenue. We see VIS as the key beneficiary from this fab optimisation, given its strategic ties with TSMC.
We further expect TSMC to close one 12' mega-fab in Taichung Science Park named Fab 15/P3 and convert it to accommodate more advanced capacity of N3, in order to meet the strong AI HPC demand. This mega-fab consists 2 phases thus operating a combined capacity of c.50k wpm in 300mm size, on our estimates, with process nodes mainly focused on 28/22/20nm for ASP ranging from USD3,800 to USD4,000. Therefore, the closure will likely unlock business of USD2.3bn pa on average, or c.30% of UMC's 2025 revenue. UMC and GlobalFoundries (GF) look well positioned to benefit here as both operate the 28/22nm process nodes. All together, we reckon the foundry leader's fab optimisation will likely unlock extra business worth of USD3bn pa, or nearly 40% of UMC's 2025 revenue, with likely an order spillover taking effect from this year and ramping into 2027-28, considering TSMC's different timings of fab closures and associated lead times for customers to qualify alternative fabs which should typically take 9-12 months.
Stock recommendations
Among the specialty foundries under our coverage, we expect VIS to benefit from this likely paradigm shift thanks to its historical ties with TSMC which has strategically helped transform VIS's business from memory to mixed-signal processes and further advance it to value-add power semiconductors capitalising on the multi-year AI scaling. UMC stands to benefit from this scaling with its specialty foundry offerings and active 28/22nm ramps, though we view investors largely pricing in this potential. We expect HHGrace and SMIC to benefit from this AI scaling, but less than their Taiwan counterparts especially for SMIC, due to the geopolitical issues such as export controls and AI regulations from the US diluting the scaling benefit as the world appears to be divided into 'China for China' and 'non-China for non-China', in terms of the semiconductor supply chain.
Key downside risks to our Positive stance on the sector are 'silicon inflation' in the supply chain and geopolitical overhangs (war, tariff, interest rate) leading to global inflation and AI capex cuts. Please refer to the company section for more company-specific details.
We initiate coverage of Vanguard International Semiconductor (VIS) with an
Outperform (2) rating and 12M TP of TWD210 by applying our ROE-adjusted PBR target of 5.2x one-year forward BVPS forecast. Key downside risks: 1) current chip upcycle ends earlier than expected; and 2) the 12' fab ramp/execution turns out below expectation.
We reaffirm our Buy (1) rating for TSMC and 12M TP of TWD3,000, based on an unchanged ROE-adjusted PBR target of 7.7x on our one-year forward BVPS. Key downside risks are silicon inflation and geopolitical overhangs leading to global inflation and AI capex cuts.
Asian foundry: valuation panel
| Stock | Ticker | Price - (LC)* | Daiwa - rating | PER (x) - 2025 | PER (x) - 2026E | PER (x) - 2027E | PBR (x) - 2025 | PBR (x) - 2026E | PBR (x) - 2027E | ROE (%) - 2025 | ROE (%) - 2026E | ROE (%) - 2027E | Earnings growth (%) - 2025 | Earnings growth (%) - 2026E | Earnings growth (%) - 2027E |
|---|---|---|---|---|---|---|---|---|---|---|---|---|---|---|---|
| TSMC | 2330 TT | 2,585.0 | Buy (1) | 39.0 | 23.6 | 19.2 | 12.4 | 8.5 | 6.3 | 35.4 | 42.8 | 37.6 | 46.4 | 65.5 | 22.9 |
| HHGrace | 1347 HK | 105.3 | Buy (1) | n.m. | 126.5 | 87.2 | 3.5 | 3.4 | 3.3 | 0.9 | 2.7 | 3.9 | -5.6 | 235.5 | 45.2 |
| VIS | 5347 TT | 190.0 | Outperform (2) | 44.9 | 32.2 | 24.0 | 5.6 | 5.3 | 4.7 | 12.4 | 16.8 | 20.8 | 12.2 | 40.1 | 34.3 |
| UMC | 2303 TT | 148.5 | Hold (3) | 44.8 | 20.6 | 20.9 | 4.9 | 4.8 | 4.4 | 11.0 | 23.6 | 21.8 | -11.6 | 117.7 | -1.7 |
| SMIC | 981 HK | 60.90 | Sell (5) | 75.5 | 44.4 | 38.1 | 1.8 | 1.7 | 1.6 | 4.0 | 6.6 | 7.1 | 115.3 | 71.9 | 16.6 |
| GlobalFoundries | GFS US | 48.07 | Not rated | 21.9 | 24.6 | 18.6 | 1.6 | 2.2 | 2.0 | 7.8 | 8.3 | 10.9 | 10.3 | 13.5 | 32.8 |
| Average | 45.2 | 45.3 | 34.7 | 5.0 | 4.3 | 3.8 | 11.9 | 16.8 | 16.9 | 26.2 | 89.7 | 20.4 |
Source: Companies, Bloomberg, Daiwa forecasts
Note: * Local currency based on closing prices as of 7 October 2026
When a report covers six or more subject companies please access important disclosures for Daiwa Capital Markets Hong Kong Limited at http://www.hk.daiwacm.com/research_disclaimer.html or contact your investment representative or Daiwa Capital Markets Hong Kong Limited at Level 26, One Pacific Place, 88 Queensway, Hong Kong
We reaffirm our Buy (1) rating for HHGrace and SOTP-based 12M TP of HKD139. Key downside risk: changes in asset-injection plans.
We maintain our Hold (3) call for UMC but raise our 12M TP to TWD145 (previous: TWD108), based on our higher ROE-adjusted PBR target of 4.2x (previous: 3.3x). Upside/ downside risks: price hikes above our expectations/geopolitical overhangs (war, FX, interest rate) weighing on end-demand.
We maintain our Sell (5) rating for SMIC and 12M TP of HKD40, based on our ROEadjusted PBR target of 1.1x applied to our one-year forward BVPS forecast. Key upside risk to our call would be any positive breakthrough on geopolitics and export controls.
Taiwan Semiconductor Manufacturing (2330 TT)
Taiwan Semiconductor Manufacturing
Target price: TWD3,000.00 (from TWD3,000.00)
Shareprice(7Oct):TWD2,585.00 | Up/downside:+16.1%
The man who cares about the supply chain
- AI scaling is benefiting peers on AI spillover demand
- Fab optimisation looks set to augment the benefit
- Maintain our Buy (1) call and 12M TP of TWD3,000
What's new: We concur what the chairman said on the 2Q26 results call that TSMC doesn't sell milk (ie, a commodity), which one can buy at another convenience store. Yet when AI demand is deriving from its leading advanced services vs. the 'milk' one can buy from other convenience stores, peers stand to benefit from a ripple effect in demand on the AI scaling (ie, AI spillover), from core compute to memory to connectivity to power, augmented by TSMC's fab optimisation addressed in the main section of this sector report. That said, as TSMC still under-ships demand in the advanced foundry and backend services, we see a good chance for it to exercise pricing power in 2027, striking a balance between profitability and supply-chain interests. We haven't embedded price hikes in our model, thus keep our forecasts and TP, reaffirming our Buy (1) call.
What's the impact: 3Q26 preview and 4Q26 outlook. We estimate TSMC to have earned 3Q26 EPS of c.TWD28.5, varying not much from the consensus estimate. Monthly revenue came in at TWD982bn (+49% YoY) QTD, reaching 67% of our 3Q26E revenue which we consider as tracking inline. We expect TSMC's 4Q26 revenue to advance 10% QoQ (+54% YoY) to USD50.4bn for an EPS of TWD31.8, also varying not much from the consensus. While we keep our 2027-28 forecasts unchanged, we see upside from a possibility that TSMC would raise wafer prices to mitigate cost pressure from its Arizona operation and materials cost hike across the supply chain. TSMC is scheduled to report on 15 October; we will offer our updates in due course.
Optimisation benefiting supply chain. As addressed in the main sector section of this report, TSMC is closing some of its legacy fabs over 2026-27 to address the supply constraint caused by the strong AI demand for advanced frontend wafer manufacturing and backend packaging & testing technologies. We expect its fab optimisation to unlock businesses worth c.USD3bn pa and benefit peers who offer specialty foundry services. We expect the optimisation to augment a ripple effect in the AI demand on scaling from compute to connectivity to power (AI spillover). We believe TSMC is happy to let go such spillover businesses given its limited bandwidth to handle the advanced foundry and backend demand.
What we recommend: We stick with our 12M TP of TWD3,000 for TSMC, based on an unchanged ROE-adjusted PBR target of 7.7x on our one-year forward BVPS. We maintain Buy (1) with downside risks of silicon inflation and geopolitical overhangs leading to global inflation and AI capex cuts.
How we differ: Our 2028E EPS looks 15% below Bloomberg consensus likely due to our view calling for a soft-landing in the chip cycle.
3
2
1
(unchanged)
Rick Hsu (886) 2 8758 6261 rick.hsu@daiwacm-cathay.com.tw
Sam Weng (886) 2 8758 6255 sam.weng@daiwacm-cathay.com.tw
Forecast revisions (%)
| Year to 31 Dec | 26E | 27E | 28E |
|---|---|---|---|
| Revenue change | - | - | - |
| Net profit change | - | - | - |
| Core EPS (FD) change | - | - | - |
Source: Daiwa forecasts
Share price performance
| 12-month range | 1,375.00-2,585.00 |
|---|---|
| Market cap (USDbn) | 2,107.13 |
| 3m avg daily turnover (USDm) | 1,977.91 |
| Shares outstanding (m) | 25,932 |
| Major shareholder | National Development Fund (6.4%) |
Financial summary (TWD)
| Year to 31 Dec | 26E | 27E | 28E |
|---|---|---|---|
| Revenue (m) | 5,482,671 | 6,896,580 | 7,707,441 |
| Operating profit (m) | 3,235,950 | 4,030,657 | 4,425,491 |
| Net profit (m) | 2,842,354 | 3,492,859 | 3,883,975 |
| Core EPS (fully-diluted) | 109.608 | 134.693 | 149.775 |
| EPS change (%) | 65.5 | 22.9 | 11.2 |
| Daiwa vs Cons. EPS (%) | 2.9 | (4.5) | (15.0) |
| PER (x) | 23.6 | 19.2 | 17.3 |
| Dividend yield (%) | 1.0 | 1.1 | 1.2 |
| DPS | 26.0 | 28.0 | 30.0 |
| PBR (x) | 8.5 | 6.3 | 4.8 |
| EV/EBITDA (x) | 15.9 | 12.2 | 10.3 |
| ROE (%) | 42.8 | 37.6 | 31.7 |
Source: FactSet, Daiwa forecasts
Financial summary
Key assumptions
| Year to 31 Dec | 2021 | 2022 | 2023 | 2024 | 2025 | 2026E | 2027E | 2028E |
|---|---|---|---|---|---|---|---|---|
| Capacity utilization (%) | 102 | 98 | 73 | 76 | 80 | 90 | 99 | 98 |
| Blended ASP (USD) | 1,642 | 1,933 | 2,101 | 2,546 | 2,930 | 3,439 | 3,764 | 3,950 |
| Wafer shipment (8" equ., '000) | 31,902 | 34,320 | 27,005 | 29,051 | 33,802 | 40,868 | 47,076 | 50,155 |
Profit and loss (TWDm)
| Year to 31 Dec | 2021 | 2022 | 2023 | 2024 | 2025 | 2026E | 2027E | 2028E |
|---|---|---|---|---|---|---|---|---|
| Wafer Foundry Revenue | 1,463,157 | 1,979,286 | 1,770,430 | 2,378,253 | 3,079,347 | 4,473,682 | 5,670,880 | 6,337,629 |
| Sub & Other Revenue | 124,258 | 284,605 | 391,305 | 516,054 | 729,707 | 1,008,988 | 1,225,702 | 1,369,813 |
| Other Revenue | 0 | 0 | 0 | 0 | 0 | 1 | (1) | (0) |
| Total Revenue | 1,587,415 | 2,263,891 | 2,161,736 | 2,894,308 | 3,809,054 | 5,482,671 | 6,896,580 | 7,707,441 |
| Other income | 0 | 0 | 0 | 0 | 0 | 0 | 0 | 0 |
| COGS | (767,878) | (915,536) | (986,625) | (1,269,954) | (1,527,760) | (1,799,646) | (2,297,170) | (2,649,940) |
| SG&A | (44,822) | (63,813) | (71,275) | (98,119) | (98,775) | (117,396) | (154,960) | (169,564) |
| Other op.expenses | (124,735) | (163,262) | (182,370) | (204,182) | (246,427) | (329,678) | (413,795) | (462,446) |
| Operating profit | 649,981 | 1,121,279 | 921,466 | 1,322,053 | 1,936,092 | 3,235,950 | 4,030,657 | 4,425,491 |
| Net-interest inc./(exp.) | 488 | 10,672 | 48,295 | 76,718 | 93,369 | 121,900 | 162,500 | 237,920 |
| Assoc/forex/extraord./others | 12,657 | 12,239 | 9,411 | 7,068 | 12,202 | 73,622 | 10,043 | 10,446 |
| Pre-tax profit | 663,126 | 1,144,190 | 979,171 | 1,405,839 | 2,041,663 | 3,431,472 | 4,203,200 | 4,673,856 |
| Tax | (66,053) | (127,290) | (141,404) | (233,407) | (326,266) | (590,459) | (714,544) | (794,556) |
| Min. int./pref. div./others | (533) | (370) | 730 | 836 | 2,486 | 1,341 | 4,203 | 4,674 |
| Net profit (reported) | 596,540 | 1,016,530 | 838,498 | 1,173,268 | 1,717,883 | 2,842,354 | 3,492,859 | 3,883,975 |
| Net profit (adjusted) | 596,540 | 1,016,530 | 838,498 | 1,173,268 | 1,717,883 | 2,842,354 | 3,492,859 | 3,883,975 |
| EPS (reported)(TWD) | 23.005 | 39.204 | 32.334 | 45.252 | 66.255 | 109.608 | 134.693 | 149.775 |
| EPS (adjusted)(TWD) | 23.005 | 39.204 | 32.334 | 45.252 | 66.255 | 109.608 | 134.693 | 149.775 |
| EPS (adjusted fully-diluted)(TWD) | 23.006 | 39.203 | 32.334 | 45.242 | 66.243 | 109.608 | 134.693 | 149.775 |
| DPS (TWD) | 10.250 | 11.001 | 11.249 | 14.003 | 18.003 | 26.000 | 28.000 | 30.000 |
| EBIT | 649,981 | 1,121,279 | 921,466 | 1,322,053 | 1,936,092 | 3,235,950 | 4,030,657 | 4,425,491 |
| EBITDA | 1,072,375 | 1,558,533 | 1,453,657 | 1,984,848 | 2,624,188 | 4,050,803 | 5,133,818 | 5,827,702 |
Cash flow (TWDm)
| Year to 31 Dec | 2021 | 2022 | 2023 | 2024 | 2025 | 2026E | 2027E | 2028E |
|---|---|---|---|---|---|---|---|---|
| Profit before tax | 663,126 | 1,144,190 | 979,171 | 1,405,839 | 2,041,663 | 3,431,472 | 4,203,200 | 4,673,856 |
| Depreciation and amortisation | 422,395 | 437,254 | 532,191 | 662,795 | 688,096 | 814,853 | 1,103,162 | 1,402,211 |
| Tax paid | (66,053) | (127,290) | (141,404) | (233,407) | (326,266) | (590,459) | (714,544) | (794,556) |
| Change in working capital | (100,384) | (53,286) | 324 | (90,088) | 160 | (270,000) | (35,000) | (175,000) |
| Other operational CF items | 193,077 | 209,731 | (128,316) | 81,038 | (128,677) | (5,171) | (2,634) | (2,505) |
| Cash flow from operations | 1,112,161 | 1,610,599 | 1,241,967 | 1,826,177 | 2,274,976 | 3,380,696 | 4,554,184 | 5,104,007 |
| Capex | (839,196) | (1,082,672) | (949,817) | (956,008) | (1,272,411) | (1,964,013) | (1,960,003) | (2,161,145) |
| Net (acquisitions)/disposals | 4,676 | (128,712) | (55,781) | (57,882) | (37,079) | 738 | 0 | 0 |
| Other investing CF items | (1,847) | 20,456 | 99,477 | 149,047 | 165,097 | 0 | 0 | 0 |
| Cash flow from investing | (836,366) | (1,190,928) | (906,121) | (864,843) | (1,144,393) | (1,963,274) | (1,960,003) | (2,161,145) |
| Change in debt | (1,090) | (1,730) | (17,407) | 21,601 | (46,362) | (136,926) | (128,434) | (109,169) |
| Net share issues/(repurchases) | 0 | 0 | 0 | 0 | 0 | 0 | 0 | 0 |
| Dividends paid | (265,786) | (285,234) | (291,722) | (363,055) | (466,779) | (674,232) | (726,096) | (777,960) |
| Other financing CF items | (3,622) | 59,198 | 10,284 | 8,054 | (64,022) | 0 | 0 | 0 |
| Cash flow from financing | (270,499) | (227,766) | (298,844) | (333,399) | (577,163) | (811,158) | (854,530) | (887,129) |
| Forex effect/others | 0 | 0 | 0 | 0 | 0 | 0 | 0 | 0 |
| Change in cash | 5,296 | 191,905 | 37,002 | 627,935 | 553,420 | 606,264 | 1,739,651 | 2,055,732 |
| Free cash flow | 272,965 | 527,927 | 292,151 | 870,169 | 1,002,565 | 1,416,683 | 2,594,181 | 2,942,861 |
Source: FactSet, Daiwa forecasts
Financial summary continued …
Balance sheet (TWDm)
| Year to 31 Dec | 2021 | 2022 | 2023 | 2024 | 2025 | 2026E | 2027E | 2028E |
|---|---|---|---|---|---|---|---|---|
| Cash & short-term investment | 1,188,442 | 1,561,483 | 1,687,644 | 2,422,009 | 3,068,595 | 3,674,120 | 5,413,771 | 7,469,504 |
| Inventory | 193,102 | 221,149 | 250,997 | 287,869 | 288,109 | 398,109 | 458,109 | 508,109 |
| Accounts receivable | 207,637 | 231,409 | 201,938 | 272,088 | 281,791 | 461,791 | 466,791 | 596,791 |
| Other current assets | 17,892 | 38,856 | 53,453 | 106,387 | 178,635 | 180,000 | 30,000 | 30,000 |
| Total current assets | 1,607,073 | 2,052,897 | 2,194,033 | 3,088,352 | 3,817,131 | 4,714,021 | 6,368,672 | 8,604,404 |
| Fixed assets | 1,975,119 | 2,693,837 | 3,064,475 | 3,234,980 | 3,691,841 | 5,187,203 | 6,400,151 | 7,379,748 |
| Goodwill & intangibles | 113,927 | 149,117 | 144,421 | 219,565 | 251,682 | 179,500 | 189,200 | 194,000 |
| Other non-current assets | 29,385 | 68,928 | 129,442 | 149,040 | 172,370 | 172,370 | 172,370 | 172,370 |
| Total assets | 3,725,503 | 4,964,779 | 5,532,371 | 6,691,938 | 7,933,024 | 10,253,094 | 13,130,393 | 16,350,523 |
| Short-term debt | 127,171 | 19,314 | 9,293 | 59,858 | 136,926 | 128,434 | 109,169 | 92,794 |
| Accounts payable | 48,911 | 56,522 | 57,293 | 74,227 | 84,330 | 104,330 | 134,330 | 139,330 |
| Other current liabilities | 563,421 | 868,391 | 846,997 | 1,130,441 | 1,236,763 | 1,220,430 | 1,363,338 | 1,522,250 |
| Total current liabilities | 739,503 | 944,227 | 913,583 | 1,264,525 | 1,458,019 | 1,453,194 | 1,606,838 | 1,754,374 |
| Long-term debt | 610,071 | 834,336 | 913,900 | 926,605 | 856,228 | 727,793 | 618,624 | 525,831 |
| Other non-current liabilities | 205,196 | 225,727 | 221,625 | 177,233 | 157,982 | 160,000 | 165,000 | 170,000 |
| Total liabilities | 1,554,770 | 2,004,290 | 2,049,108 | 2,368,362 | 2,472,229 | 2,340,987 | 2,390,460 | 2,450,204 |
| Share capital | 259,304 | 259,304 | 259,321 | 259,327 | 259,325 | 259,325 | 259,325 | 259,325 |
| Reserves/R.E./others | 1,908,983 | 2,686,349 | 3,199,593 | 4,029,218 | 5,160,271 | 7,610,241 | 10,433,862 | 13,589,576 |
| Shareholders' equity | 2,168,287 | 2,945,653 | 3,458,914 | 4,288,545 | 5,419,596 | 7,869,567 | 10,693,187 | 13,848,902 |
| Minority interests | 2,447 | 14,836 | 24,349 | 35,031 | 41,199 | 42,540 | 46,743 | 51,417 |
| Total equity & liabilities | 3,725,503 | 4,964,779 | 5,532,371 | 6,691,938 | 7,933,024 | 10,253,094 | 13,130,393 | 16,350,523 |
| EV | 66,585,466 | 66,341,223 | 66,294,118 | 65,633,704 | 64,999,978 | 64,258,867 | 62,394,985 | 60,234,758 |
| Net debt/(cash) | (451,200) | (707,833) | (764,451) | (1,435,546) | (2,075,442) | (2,817,893) | (4,685,978) | (6,850,879) |
| BVPS (TWD) | 83.621 | 113.600 | 133.384 | 165.370 | 208.985 | 303.469 | 412.355 | 534.047 |
Key ratios (%)
| Year to 31 Dec | 2021 | 2022 | 2023 | 2024 | 2025 | 2026E | 2027E | 2028E |
|---|---|---|---|---|---|---|---|---|
| Sales (YoY) | 18.5 | 42.6 | (4.5) | 33.9 | 31.6 | 43.9 | 25.8 | 11.8 |
| EBITDA (YoY) | 19.4 | 45.3 | (6.7) | 36.5 | 32.2 | 54.4 | 26.7 | 13.5 |
| Operating profit (YoY) | 14.7 | 72.5 | (17.8) | 43.5 | 46.4 | 67.1 | 24.6 | 9.8 |
| Net profit (YoY) | 15.2 | 70.4 | (17.5) | 39.9 | 46.4 | 65.5 | 22.9 | 11.2 |
| Core EPS (fully-diluted) (YoY) | 15.2 | 70.4 | (17.5) | 39.9 | 46.4 | 65.5 | 22.9 | 11.2 |
| Gross-profit margin | 51.6 | 59.6 | 54.4 | 56.1 | 59.9 | 67.2 | 66.7 | 65.6 |
| EBITDA margin | 67.6 | 68.8 | 67.2 | 68.6 | 68.9 | 73.9 | 74.4 | 75.6 |
| Operating-profit margin | 40.9 | 49.5 | 42.6 | 45.7 | 50.8 | 59.0 | 58.4 | 57.4 |
| Net profit margin | 37.6 | 44.9 | 38.8 | 40.5 | 45.1 | 51.8 | 50.6 | 50.4 |
| ROAE | 29.7 | 39.8 | 26.2 | 30.3 | 35.4 | 42.8 | 37.6 | 31.7 |
| ROAA | 18.4 | 23.4 | 16.0 | 19.2 | 23.5 | 31.3 | 29.9 | 26.3 |
| ROCE | 25.5 | 33.4 | 22.4 | 27.2 | 32.9 | 42.5 | 39.8 | 34.1 |
| ROIC | 37.5 | 50.2 | 31.7 | 39.3 | 51.9 | 63.2 | 60.0 | 56.1 |
| Net debt to equity | n.a. | n.a. | n.a. | n.a. | n.a. | n.a. | n.a. | n.a. |
| Effective tax rate | 10.0 | 11.1 | 14.4 | 16.6 | 16.0 | 17.2 | 17.0 | 17.0 |
| Accounts receivable (days) | 41.7 | 35.4 | 36.6 | 29.9 | 26.5 | 24.8 | 24.6 | 25.2 |
| Current ratio (x) | 2.2 | 2.2 | 2.4 | 2.4 | 2.6 | 3.2 | 4.0 | 4.9 |
| Net interest cover (x) | n.a. | n.a. | n.a. | n.a. | n.a. | n.a. | n.a. | n.a. |
| Net dividend payout | 55.1 | 47.8 | 34.8 | 30.9 | 27.2 | 23.7 | 20.8 | 20.0 |
| Free cash flow yield | 0.4 | 0.8 | 0.4 | 1.3 | 1.5 | 2.1 | 3.9 | 4.4 |
Source: FactSet, Daiwa forecasts
Company profile
Incorporated in Taiwan in 1987, Taiwan Semiconductor Manufacturing Co. (TSMC) is the world's largest complementary metal oxide semiconductor (CMOS) foundry in revenue terms. TSMC offers foundry services such as wafer masking, fabrication, probing, packaging and testing, to a high variety of customers including fabless chipmakers and IDMs. Its manufacturing fabs are located in Taiwan, China, the US and Singapore.
TSMC: key operating assumptions, quarterly P&L estimates and forecasts
| TWDbn | 1Q26 | 2Q26 | 3Q26E | 4Q26E | 1Q27E | 2Q27E | 3Q27E | 4Q27E | 2025 | 2026E | 2027E | 2028E |
|---|---|---|---|---|---|---|---|---|---|---|---|---|
| Wafer shipment (12" equ) ('000 units) | 4,174 | 4,336 | 4,691 | 4,963 | 4,856 | 5,147 | 5,459 | 5,460 | 15,023 | 18,164 | 20,923 | 22,291 |
| Capacity utilisation* | 84% | 86% | 92% | 97% | 95% | 98% | 101% | 100% | 80% | 90% | 99% | 98% |
| Blended ASP (USD) | 6,937 | 7,500 | 8,014 | 8,358 | 8,211 | 8,399 | 8,608 | 8,630 | 6,592 | 7,738 | 8,470 | 8,887 |
| Foundry revenue | 915 | 1,028 | 1,203 | 1,328 | 1,277 | 1,383 | 1,503 | 1,508 | 3,079 | 4,474 | 5,671 | 6,338 |
| Sub & other revenue | 219 | 243 | 260 | 287 | 276 | 299 | 325 | 326 | 730 | 1,009 | 1,226 | 1,370 |
| Total revenue | 1,134 | 1,270 | 1,463 | 1,615 | 1,553 | 1,682 | 1,828 | 1,833 | 3,809 | 5,483 | 6,897 | 7,707 |
| Total revenue (USDbn) | 35.9 | 40.2 | 45.7 | 50.4 | 48.5 | 52.6 | 57.1 | 57.3 | 122.5 | 172.2 | 215.5 | 240.9 |
| COGS | -383 | -410 | -477 | -529 | -528 | -553 | -605 | -612 | -1,528 | -1,800 | -2,297 | -2,650 |
| Gross profit | 751 | 860 | 985 | 1,086 | 1,025 | 1,129 | 1,224 | 1,222 | 2,281 | 3,683 | 4,599 | 5,058 |
| Opex | -92 | -94 | -130 | -131 | -129 | -140 | -150 | -150 | -345 | -447 | -569 | -632 |
| Operating profit | 659 | 767 | 855 | 955 | 896 | 989 | 1,074 | 1,071 | 1,936 | 3,236 | 4,031 | 4,425 |
| EBITDA | 824 | 965 | 1,065 | 1,196 | 1,151 | 1,249 | 1,363 | 1,370 | 2,624 | 4,051 | 5,134 | 5,828 |
| Pre-tax profit | 688 | 862 | 888 | 993 | 936 | 1,034 | 1,117 | 1,117 | 2,042 | 3,431 | 4,203 | 4,674 |
| Income taxes | -115 | -156 | -151 | -169 | -159 | -176 | -190 | -190 | -326 | -590 | -715 | -795 |
| Net profit | 572 | 707 | 738 | 825 | 778 | 859 | 928 | 928 | 1,718 | 2,842 | 3,493 | 3,884 |
| FD O/S (bn) | 26 | 26 | 26 | 26 | 26 | 26 | 26 | 26 | 26 | 26 | 26 | 26 |
| FD EPS (TWD) | 22.08 | 27.25 | 28.47 | 31.81 | 30.01 | 33.12 | 35.78 | 35.78 | 66.24 | 109.61 | 134.69 | 149.78 |
| Margins | ||||||||||||
| Gross | 66% | 68% | 67% | 67% | 66% | 67% | 67% | 67% | 60% | 67% | 67% | 66% |
| Operating | 58% | 60% | 58% | 59% | 58% | 59% | 59% | 58% | 51% | 59% | 58% | 57% |
| EBITDA | 73% | 76% | 73% | 74% | 74% | 74% | 75% | 75% | 69% | 74% | 74% | 76% |
| Net | 50% | 56% | 50% | 51% | 50% | 51% | 51% | 51% | 45% | 52% | 51% | 50% |
| Growth (QoQ) | ||||||||||||
| Total revenue | 8% | 12% | 15% | 10% | -4% | 8% | 9% | 0% | ||||
| Gross profit | 15% | 15% | 15% | 10% | -6% | 10% | 8% | 0% | ||||
| Operating profit | 17% | 16% | 12% | 12% | -6% | 10% | 9% | 0% | ||||
| EBITDA | 13% | 17% | 10% | 12% | -4% | 9% | 9% | 1% | ||||
| Net profit | 13% | 23% | 4% | 12% | -6% | 10% | 8% | 0% | ||||
| FD EPS | 13% | 23% | 4% | 12% | -6% | 10% | 8% | 0% | ||||
| Growth (YoY) | ||||||||||||
| Total revenue | 35% | 36% | 48% | 54% | 37% | 32% | 25% | 14% | 32% | 44% | 26% | 12% |
| Gross profit | 52% | 57% | 67% | 67% | 36% | 31% | 24% | 12% | 40% | 61% | 25% | 10% |
| Operating profit | 62% | 65% | 71% | 69% | 36% | 29% | 26% | 12% | 46% | 67% | 25% | 10% |
| EBITDA | 42% | 48% | 61% | 65% | 40% | 29% | 28% | 15% | 32% | 54% | 27% | 14% |
| Net profit | 58% | 77% | 63% | 63% | 36% | 22% | 26% | 12% | 46% | 65% | 23% | 11% |
| FD EPS | 58% | 77% | 63% | 63% | 36% | 22% | 26% | 12% | 46% | 65% | 23% | 11% |
Source: Company, Daiwa estimates and forecasts
Note: * Calculated as wafer shipment divided by capacity estimated by Daiwa
TSMC: 3Q26 results preview and 4Q26 business outlook
| TWDm | 3Q26E - Daiwa | 3Q26E - Consensus | 3Q26E - Variance | 4Q26E - Daiwa | 4Q26E - Consensus | 4Q26E - Variance |
|---|---|---|---|---|---|---|
| Revenue | 1,462,926 | 1,454,000 | 1% | 1,615,260 | 1,594,000 | 1% |
| Gross profit | 985,471 | 1,085,946 | ||||
| Operating profit | 855,271 | 955,110 | ||||
| Pretax profit | 888,480 | 992,762 | ||||
| Net profit | 738,327 | 726,000 | 2% | 824,985 | 793,000 | 4% |
| Adjusted EPS (TWD) | 28.47 | 28.00 | 2% | 31.81 | 30.58 | 4% |
| Margins | ||||||
| Gross | 67.4% | 67.2% | ||||
| Operating | 58.5% | 59.1% | ||||
| Net | 50.5% | 51.1% | ||||
| Operation | ||||||
| Shipment (12" equ.wafers) ('000 units) | 4,691 | 4,963 | ||||
| Utilisation* | 92% | 97% | ||||
| <=3nm sales contribution | 38% | 42% |
Source: Bloomberg, Daiwa estimates and forecasts
Note: * Calculated as wafer shipment divided by capacity
TSMC: monthly revenue run-rate*
Source: Company, Daiwa estimates and forecasts
Note: * Figures over September-December 2026 are estimated by Daiwa
Source: Company, TEJ, Daiwa forecasts
ESG analysis
ESG risks
| Risks | Management | Analystcomments |
|---|---|---|
| Executive/board quality | 1 | TSMC's board of directors (BoD) has 10 members, including 6 independent directors representing 60% of total directors. The background of TSMC's BoD is diversified, with members from industries, academia, and law. Also, its board members include representatives from not only Taiwan but also Europe and the US, bringing their experience in operating international businesses to the board. We believe the high percentage of independent directors and a diverse mix of expertise from the board members strengthen the functionality of its BoD, as evidenced by TSMC's leading position in the foundry market. |
| G | Capital management 1 | TSMC pays its dividend on a quarterly basis. In the past 5 years, it has managed its dividend payout well, as evidenced by its dividend in dollar terms, where it has never lowered its dividend. As the leader in advanced technology nodes, TSMC has kept expanding its capacity for advanced nodes; as such, we expect its capital intensity to increase to the level near or above 40% over 2025-26 (vs. its long-term target of mid-30%). However, we believe TSMC will at least sustain its cash dividend payout in dollar terms over 2025-26E. We see its balance between investment and dividend as appropriate. |
| Related party & transaction | 1 | TSMC's sales to related parties remained insignificant, accounting for less than 1% of total revenue in recent years. Purchases from related parties also represented less than 1% of total cost of goods sold. Given the limited contribution of related-party transactions to TSMC's revenue and procurement base, we continue to view related-party exposure and concentration risk as minimal |
| S Supplychain management | 1 | TSMC continues to strengthen its supply chain management through sustainability risk management and supply chain resilience initiatives. In 2024, 100% of tier-1 suppliers completed sustainability self-assessments, while 100% of targeted critical suppliers completed third-party RBA audits. The Company also maintained its responsible mineral sourcing program and enhanced human rights oversight across its supply chain. We believe these efforts help reduce supply chain and ESG-related risks |
| E Water&wastewater management | 2 | TSMC continues to invest in water reclamation and conservation technologies to enhance water security. The Company has integrated reclaimed water into its manufacturing process and is expanding alternative water sourcing through partnerships with local governments. Together with ongoing investments in water recycling and efficiency improvement, we believe TSMC is well positioned to mitigate water supply risks and strengthen the sustainability of its operations |
| E materials | Waste & hazardous management 1 | TSMC has maintained a waste recycling rate above 95% and kept landfill disposal at below 1% for many years. The Company continues to reduce waste intensity through process improvements and resource recovery initiatives. In 2024, TSMC established the semiconductor industry's first Zero Waste Manufacturing Center to further enhance circular economy practices and maximize resource utilization. We view TSMC's waste management performance as best-in- class and see limited environmental risk from waste disposal. |
| E | GHGemissions 1 | TSMC continues to advance its net-zero strategy through renewable energy procurement and carbon reduction initiatives. All overseas fabs and offices achieved net zero emissions in 2024, while the Company expanded its contracted renewable energy capacity to 4 GW. TSMC maintains its commitment to achieve net zero emissions by 2050, with intermediate targets of 60% renewable electricity usage by 2030 and 100% by 2040. We view TSMC's climate strategy as best-in-class among global semiconductor manufacturers |
Note: Management score represents a company's ability to manage/benefit from certain ESG topics. The scores range from 1 to 3, with 1 being the strongest.
Update Date: 8 Oct 2026
Source: Daiwa, Company
United Microelectronics (2303 TT)
United Microelectronics
Target price: TWD145.00 (from TWD108.00)
Shareprice(7Oct):TWD148.50 | Up/downside:-2.4%
A beneficiary of the AI ripple effect, but …
- UMC looks set to benefit from AI demand spillover
- Yet we believe the AI ripple effect is being priced in
- Maintain our Hold (3) call, with a higher 12M TP of TWD145
What's new: Given its longstanding position in the global foundry industry, ever challenging TSMC's leadership during the late 1990s, we believe UMC stands well to benefit from a ripple effect in demand spurred by AI scaling, as detailed in the main section of this report. We expect UMC's wafer loadings to reach 100% from 1Q27, with price hikes to go through (see Price hike to go through? Still likely, 31 July). That said, we believe the equity market has priced in this AI strength on extra volume and pricing power for UMC. Hence, we stick with our Hold (3) rating on the counter.
What's the impact: 3Q26 preview and 4Q26 outlook. We expect UMC to report 3Q26 net profit of TWD16.4bn (+9% YoY), varying not much from the Bloomberg consensus. Its monthly revenue finished at c.TWD49bn QTD, reaching 65% of our/consensus 3Q26 estimates, which we consider tracking inline. For 4Q26, we expect UMC to earn net profit of TWD16bn, 13% below consensus, as the street seems to be assuming higher nonoperating gains. UMC is scheduled to report results on 28 October; we will be offering updates in due course.
<=28nm ramp on AI scaling and fab optimisation. UMC's 28/22nm-andbelow revenue contribution has hovered around the high-30% range over the past 2 years, after meaningful ramp during the COVID period on broadened demand applications from display drivers and TV SoCs to power management. With AI scaling creating a ripple effect in companion chip demand for connectivity (ie, silicon photonics) and power (ie, server PMICs), we believe UMC is well positioned to benefit from any spillover demand, with the strength augmented by TSMC's fab optimisation, which could strengthen UMC's pricing power. Given that UMC's wafer loadings are likely to reach 100% from 1Q27, we expect its price hikes to go through and model increases of 2-5%, effective from 1Q27, across nodes related to AI applications. This should resume its <=28nm ramp to exceed a half of revenue in 2028. All in, we raise our 2027-28E EPS by 22%.
What we recommend: Despite our forecast revisions, we remain comfortable with our Hold (3) rating for UMC, as we believe its AI strength is already priced in. We raise our 12M TP to TWD145 (previous: TWD108), based on our higher ROE-adjusted PBR target of 4.2x (previous: 3.3x) applied to 1-year-forward BVPS on a higher ROE trajectory. Upside/ downside risks would be any price hikes above our expectations/ geopolitical overhangs (war, FX, interest rate) weighing on end-demand.
How we differ: Our 2026-28E EPS do not vary much from consensus, indicating that UMC's AI strength is already reflected in its valuation.
5
4
2
Rick Hsu (886) 2 8758 6261 rick.hsu@daiwacm-cathay.com.tw
Sam Weng (886) 2 8758 6255 sam.weng@daiwacm-cathay.com.tw
Forecast revisions (%)
| Year to 31 Dec | 26E | 27E | 28E |
|---|---|---|---|
| Revenue change | 0.9 | 7.5 | 7.9 |
| Net profit change | 1.5 | 21.9 | 21.6 |
| Core EPS (FD) change | 1.5 | 21.9 | 21.6 |
Source: Daiwa forecasts
Share price performance
| 12-month range | 12-month range | 43.85-178.50 |
|---|---|---|
| Market cap (USDbn) | Market cap (USDbn) | 58.71 |
| 3m avg daily turnover (USDm) | 3m avg daily turnover (USDm) | 726.45 |
| Shares outstanding (m) | Shares outstanding (m) | 12,577 |
| Major shareholder | United Microelectronics Corp (5.8%) | United Microelectronics Corp (5.8%) |
Financial summary (TWD)
| Year to 31 Dec | 26E | 27E | 28E |
|---|---|---|---|
| Revenue (m) | 281,729 | 358,798 | 393,029 |
| Operating profit (m) | 63,045 | 99,484 | 115,376 |
| Net profit (m) | 90,829 | 89,289 | 103,534 |
| Core EPS (fully-diluted) | 7.222 | 7.099 | 8.232 |
| EPS change (%) | 117.9 | (1.7) | 16.0 |
| Daiwa vs Cons. EPS (%) | 2.4 | (1.6) | (3.5) |
| PER (x) | 20.6 | 20.9 | 18.0 |
| Dividend yield (%) | 1.8 | 2.7 | 2.7 |
| DPS | 2.6 | 4.0 | 4.0 |
| PBR (x) | 4.8 | 4.4 | 3.9 |
| EV/EBITDA (x) | 13.8 | 10.1 | 9.1 |
| ROE (%) | 23.6 | 21.8 | 22.8 |
Source: FactSet, Daiwa forecasts
Financial summary
Key assumptions
| Year to 31 Dec | 2021 | 2022 | 2023 | 2024 | 2025 | 2026E | 2027E | 2028E |
|---|---|---|---|---|---|---|---|---|
| Capacity utilisation (%) | 104 | 99 | 68 | 69 | 75 | 87 | 99 | 100 |
| Blended ASP (USD) | 774 | 941 | 994 | 933 | 876 | 862 | 914 | 916 |
| Wafer shipment (8" equ., '000) | 9,860 | 9,946 | 7,190 | 7,754 | 8,712 | 10,270 | 12,266 | 13,406 |
Profit and loss (TWDm)
| Year to 31 Dec | 2021 | 2022 | 2023 | 2024 | 2025 | 2026E | 2027E | 2028E |
|---|---|---|---|---|---|---|---|---|
| Wafer Foundry Revenue | 213,011 | 278,705 | 222,533 | 232,303 | 237,553 | 281,729 | 358,798 | 393,029 |
| New Business Revenue | 0 | 0 | 0 | 0 | 0 | 0 | 0 | 0 |
| Other Revenue | 0 | 0 | 0 | 0 | 0 | 0 | 0 | 0 |
| Total Revenue | 213,011 | 278,705 | 222,533 | 232,303 | 237,553 | 281,729 | 358,798 | 393,029 |
| Other income | 0 | 0 | 0 | 0 | 0 | 0 | 0 | 0 |
| COGS | (140,961) | (152,941) | (144,789) | (156,649) | (168,647) | (188,965) | (224,020) | (239,340) |
| SG&A | (7,429) | (8,518) | (6,569) | (8,425) | (7,233) | (10,215) | (13,024) | (14,368) |
| Other op.expenses | (12,935) | (12,954) | (13,284) | (15,616) | (17,725) | (19,504) | (22,271) | (23,945) |
| Operating profit | 51,686 | 104,293 | 57,891 | 51,613 | 43,949 | 63,045 | 99,484 | 115,376 |
| Net-interest inc./(exp.) | (1,387) | 156 | 3,283 | 1,914 | 676 | 1,110 | 2,095 | 3,270 |
| Assoc/forex/extraord./others | 11,504 | 1,649 | 9,739 | 2,693 | 5,023 | 36,244 | 4,403 | 4,608 |
| Pre-tax profit | 61,803 | 106,097 | 70,912 | 56,220 | 49,648 | 100,399 | 105,981 | 123,255 |
| Tax | (6,691) | (18,079) | (9,472) | (9,113) | (8,113) | (9,660) | (16,692) | (19,721) |
| Min. int./pref. div./others | 668 | (820) | (450) | 105 | 182 | 91 | 0 | 0 |
| Net profit (reported) | 55,780 | 87,198 | 60,990 | 47,211 | 41,716 | 90,829 | 89,289 | 103,534 |
| Net profit (adjusted) | 55,780 | 87,198 | 60,990 | 47,211 | 41,716 | 90,829 | 89,289 | 103,534 |
| EPS (reported)(TWD) | 4.552 | 7.086 | 4.930 | 3.796 | 3.341 | 7.222 | 7.099 | 8.232 |
| EPS (adjusted)(TWD) | 4.552 | 7.086 | 4.930 | 3.796 | 3.341 | 7.222 | 7.099 | 8.232 |
| EPS (adjusted fully-diluted)(TWD) | 4.468 | 6.973 | 4.868 | 3.759 | 3.314 | 7.222 | 7.099 | 8.232 |
| DPS (TWD) | 1.622 | 3.043 | 3.639 | 3.022 | 2.866 | 2.602 | 4.004 | 4.004 |
| EBIT | 51,686 | 104,293 | 57,891 | 51,613 | 43,949 | 63,045 | 99,484 | 115,376 |
| EBITDA | 98,762 | 148,462 | 98,374 | 99,780 | 103,206 | 129,845 | 173,179 | 185,068 |
Cash flow (TWDm)
| Year to 31 Dec | 2021 | 2022 | 2023 | 2024 | 2025 | 2026E | 2027E | 2028E |
|---|---|---|---|---|---|---|---|---|
| Profit before tax | 61,803 | 106,097 | 70,912 | 56,220 | 49,648 | 100,399 | 105,981 | 123,255 |
| Depreciation and amortisation | 47,075 | 44,169 | 40,484 | 48,168 | 59,257 | 66,800 | 73,695 | 69,692 |
| Tax paid | (6,691) | (18,079) | (9,472) | (9,113) | (8,113) | (9,660) | (16,692) | (19,721) |
| Change in working capital | (10,151) | (8,262) | 916 | (2,889) | 1,617 | (10,600) | (10,000) | (400) |
| Other operational CF items | (1,685) | 21,935 | (16,840) | 1,488 | (2,545) | (27,454) | (3,803) | (4,008) |
| Cash flow from operations | 90,352 | 145,861 | 86,000 | 93,872 | 99,864 | 119,484 | 149,182 | 168,817 |
| Capex | (48,035) | (80,128) | (91,474) | (88,545) | (47,744) | (63,647) | (51,200) | (52,801) |
| Net (acquisitions)/disposals | (14,290) | 28,229 | (4,678) | 2,625 | (7,670) | 8,411 | 0 | 0 |
| Other investing CF items | 162 | (2,528) | (1,635) | (21) | 2,259 | 0 | 0 | 0 |
| Cash flow from investing | (62,163) | (54,427) | (97,787) | (85,941) | (53,154) | (55,237) | (51,200) | (52,801) |
| Change in debt | 18,818 | (34,087) | 27,377 | (337) | (1,812) | (4,188) | (18,843) | (19,757) |
| Net share issues/(repurchases) | 0 | 0 | 0 | 0 | 0 | 0 | 0 | 0 |
| Dividends paid | (19,871) | (37,445) | (45,015) | (37,586) | (35,784) | (32,729) | (50,353) | (50,353) |
| Other financing CF items | 11,439 | 21,296 | (11,840) | 2,438 | (3,454) | 0 | 0 | 0 |
| Cash flow from financing | 10,386 | (50,237) | (29,478) | (35,484) | (41,050) | (36,917) | (69,196) | (70,110) |
| Forex effect/others | 0 | 0 | 0 | 0 | 0 | 0 | 0 | 0 |
| Change in cash | 38,574 | 41,197 | (41,265) | (27,553) | 5,660 | 27,330 | 28,786 | 45,907 |
| Free cash flow | 42,317 | 65,732 | (5,474) | 5,327 | 52,120 | 55,837 | 97,982 | 116,016 |
Source: FactSet, Daiwa forecasts
Financial summary continued …
Balance sheet (TWDm)
| Year to 31 Dec | 2021 | 2022 | 2023 | 2024 | 2025 | 2026E | 2027E | 2028E |
|---|---|---|---|---|---|---|---|---|
| Cash & short-term investment | 171,224 | 178,973 | 145,621 | 115,865 | 129,071 | 147,990 | 176,776 | 222,683 |
| Inventory | 23,011 | 31,070 | 35,713 | 35,782 | 37,228 | 38,228 | 41,728 | 41,228 |
| Accounts receivable | 35,190 | 36,975 | 29,586 | 33,343 | 31,274 | 40,774 | 50,774 | 50,674 |
| Other current assets | 3,848 | 5,353 | 5,878 | 4,688 | 7,211 | 5,000 | 5,500 | 5,500 |
| Total current assets | 233,273 | 252,371 | 216,797 | 189,678 | 204,783 | 231,992 | 274,778 | 320,085 |
| Fixed assets | 129,942 | 170,982 | 237,377 | 277,344 | 271,395 | 247,287 | 231,137 | 220,390 |
| Goodwill & intangibles | 28,665 | 44,852 | 30,758 | 30,691 | 27,445 | 24,500 | 27,400 | 27,300 |
| Other non-current assets | 72,547 | 64,847 | 74,255 | 72,487 | 75,373 | 102,917 | 106,720 | 110,728 |
| Total assets | 464,427 | 533,052 | 559,187 | 570,201 | 578,996 | 606,697 | 640,036 | 678,503 |
| Short-term debt | 39,256 | 7,587 | 29,537 | 19,510 | 27,597 | 19,751 | 20,666 | 15,726 |
| Accounts payable | 8,364 | 8,982 | 7,526 | 7,633 | 9,170 | 9,070 | 12,570 | 11,570 |
| Other current liabilities | 57,833 | 91,996 | 61,952 | 48,117 | 50,832 | 73,412 | 81,958 | 92,119 |
| Total current liabilities | 105,454 | 108,565 | 99,015 | 75,260 | 87,598 | 102,234 | 115,194 | 119,415 |
| Long-term debt | 39,830 | 39,877 | 45,236 | 55,533 | 45,372 | 49,029 | 29,272 | 14,454 |
| Other non-current liabilities | 37,941 | 49,159 | 55,358 | 61,222 | 66,170 | 66,000 | 66,000 | 66,000 |
| Total liabilities | 183,224 | 197,601 | 199,608 | 192,016 | 199,141 | 217,263 | 210,466 | 199,869 |
| Share capital | 124,832 | 125,047 | 125,298 | 125,607 | 125,882 | 125,882 | 125,882 | 125,882 |
| Reserves/R.E./others | 156,147 | 210,060 | 233,939 | 252,321 | 253,887 | 263,366 | 303,401 | 352,366 |
| Shareholders' equity | 280,980 | 335,107 | 359,238 | 377,928 | 379,768 | 389,247 | 429,283 | 478,247 |
| Minority interests | 223 | 344 | 341 | 257 | 87 | 187 | 287 | 387 |
| Total equity & liabilities | 464,427 | 533,052 | 559,187 | 570,201 | 578,996 | 606,697 | 640,036 | 678,503 |
| EV | 1,775,767 | 1,736,517 | 1,797,175 | 1,827,118 | 1,811,667 | 1,788,660 | 1,741,130 | 1,675,567 |
| Net debt/(cash) | (92,138) | (131,509) | (70,849) | (40,821) | (56,102) | (79,210) | (126,839) | (192,503) |
| BVPS (TWD) | 22.508 | 26.798 | 28.671 | 30.090 | 30.169 | 30.949 | 34.132 | 38.026 |
Key ratios (%)
| Year to 31 Dec | 2021 | 2022 | 2023 | 2024 | 2025 | 2026E | 2027E | 2028E |
|---|---|---|---|---|---|---|---|---|
| Sales (YoY) | 20.5 | 30.8 | (20.2) | 4.4 | 2.3 | 18.6 | 27.4 | 9.5 |
| EBITDA (YoY) | 39.3 | 50.3 | (33.7) | 1.4 | 3.4 | 25.8 | 33.4 | 6.9 |
| Operating profit (YoY) | 134.9 | 101.8 | (44.5) | (10.8) | (14.8) | 43.5 | 57.8 | 16.0 |
| Net profit (YoY) | 91.1 | 56.3 | (30.1) | (22.6) | (11.6) | 117.7 | (1.7) | 16.0 |
| Core EPS (fully-diluted) (YoY) | 93.7 | 56.0 | (30.2) | (22.8) | (11.8) | 117.9 | (1.7) | 16.0 |
| Gross-profit margin | 33.8 | 45.1 | 34.9 | 32.6 | 29.0 | 32.9 | 37.6 | 39.1 |
| EBITDA margin | 46.4 | 53.3 | 44.2 | 43.0 | 43.4 | 46.1 | 48.3 | 47.1 |
| Operating-profit margin | 24.3 | 37.4 | 26.0 | 22.2 | 18.5 | 22.4 | 27.7 | 29.4 |
| Net profit margin | 26.2 | 31.3 | 27.4 | 20.3 | 17.6 | 32.2 | 24.9 | 26.3 |
| ROAE | 21.6 | 28.3 | 17.6 | 12.8 | 11.0 | 23.6 | 21.8 | 22.8 |
| ROAA | 13.3 | 17.5 | 11.2 | 8.4 | 7.3 | 15.3 | 14.3 | 15.7 |
| ROCE | 15.7 | 28.1 | 14.2 | 11.6 | 9.7 | 13.8 | 21.2 | 23.3 |
| ROIC | 23.5 | 44.0 | 20.4 | 13.8 | 11.1 | 18.0 | 27.3 | 32.9 |
| Net debt to equity | n.a. | n.a. | n.a. | n.a. | n.a. | n.a. | n.a. | n.a. |
| Effective tax rate | 10.8 | 17.0 | 13.4 | 16.2 | 16.3 | 9.6 | 15.7 | 16.0 |
| Accounts receivable (days) | 53.5 | 47.3 | 54.6 | 49.4 | 49.6 | 46.7 | 46.6 | 47.1 |
| Current ratio (x) | 2.2 | 2.3 | 2.2 | 2.5 | 2.3 | 2.3 | 2.4 | 2.7 |
| Net interest cover (x) | 37.3 | n.a. | n.a. | n.a. | n.a. | n.a. | n.a. | n.a. |
| Net dividend payout | 68.1 | 67.1 | 51.6 | 61.6 | 75.8 | 78.5 | 55.4 | 56.3 |
| Free cash flow yield | 2.3 | 3.5 | n.a. | 0.3 | 2.8 | 3.0 | 5.2 | 6.2 |
Source: FactSet, Daiwa forecasts
Company profile
Incorporated in Taiwan, United Microelectronics Corp (UMC) is one of the leading semiconductor foundries in the world and second largest in Taiwan. UMC offers a series of foundry services from photo-mask, wafer fabrication to wafer probe & test. Its wafer fabs are spread over Taiwan, China and Singapore, with technology offerings ranging from 0.25u and above, 0.18/0.15u, 0.13u, 90nm, 65nm, 45/40nm, 28/22nm to 14nm FF.
UMC: key operating assumptions, quarterly P&L estimates and forecasts
| TWDm | 1Q26 | 2Q26 | 3Q26E | 4Q26E | 1Q27E | 2Q27E | 3Q27E | 4Q27E | 2025 | 2026E | 2027E | 2028E |
|---|---|---|---|---|---|---|---|---|---|---|---|---|
| Wafer shipment (12" equ) ('000 units) | 1,021 | 1,129 | 1,201 | 1,213 | 1,213 | 1,359 | 1,454 | 1,425 | 3,872 | 4,564 | 5,451 | 5,958 |
| Capacity utilisation | 80% | 86% | 91% | 91% | 92% | 100% | 103% | 100% | 75% | 87% | 99% | 100% |
| Blended ASP (USD) | 1,890 | 1,926 | 1,967 | 1,966 | 2,017 | 2,056 | 2,081 | 2,067 | 1,970 | 1,940 | 2,057 | 2,061 |
| Total revenue | 61,038 | 68,733 | 75,612 | 76,347 | 78,296 | 89,428 | 96,841 | 94,232 | 237,553 | 281,729 | 358,798 | 393,029 |
| Total revenue (USDm) | 1,930 | 2,174 | 2,363 | 2,386 | 2,447 | 2,795 | 3,026 | 2,945 | 7,629 | 8,853 | 11,212 | 12,282 |
| COGS | -43,219 | -46,410 | -49,163 | -50,173 | -51,247 | -55,577 | -59,216 | -57,980 | -168,647 | -188,965 | -224,020 | -239,340 |
| Gross profit | 17,818 | 22,323 | 26,449 | 26,174 | 27,049 | 33,852 | 37,625 | 36,252 | 68,906 | 92,764 | 134,778 | 153,690 |
| Opex | -6,542 | -7,373 | -7,864 | -7,940 | -8,143 | -8,764 | -9,200 | -9,188 | -24,958 | -29,719 | -35,294 | -38,313 |
| Operating profit | 11,276 | 14,950 | 18,585 | 18,234 | 18,907 | 25,088 | 28,425 | 27,065 | 43,949 | 63,045 | 99,484 | 115,376 |
| EBITDA | 27,263 | 31,188 | 35,485 | 35,909 | 36,607 | 43,288 | 47,125 | 46,160 | 103,206 | 129,845 | 173,179 | 185,068 |
| Non-op gain/loss | 5,367 | 30,236 | 900 | 850 | 900 | 1,420 | 2,135 | 2,043 | 5,699 | 37,354 | 6,498 | 7,878 |
| Pre-tax profit | 16,644 | 45,186 | 19,485 | 19,084 | 19,807 | 26,508 | 30,560 | 29,107 | 49,648 | 100,399 | 105,981 | 123,255 |
| Income taxes | -527 | -2,962 | -3,118 | -3,053 | -3,169 | -3,976 | -4,890 | -4,657 | -8,113 | -9,660 | -16,692 | -19,721 |
| Net profit | 16,171 | 42,260 | 16,367 | 16,031 | 16,637 | 22,532 | 25,670 | 24,450 | 41,716 | 90,829 | 89,289 | 103,534 |
| FD O/S (m) | 12,579 | 12,577 | 12,577 | 12,577 | 12,577 | 12,577 | 12,577 | 12,577 | 12,588 | 12,577 | 12,577 | 12,577 |
| FD EPS (TWD) | 1.29 | 3.36 | 1.30 | 1.27 | 1.32 | 1.79 | 2.04 | 1.94 | 3.31 | 7.22 | 7.10 | 8.23 |
| Margin | ||||||||||||
| Gross | 29% | 32% | 35% | 34% | 35% | 38% | 39% | 38% | 29% | 33% | 38% | 39% |
| Operating | 18% | 22% | 25% | 24% | 24% | 28% | 29% | 29% | 19% | 22% | 28% | 29% |
| EBITDA | 45% | 45% | 47% | 47% | 47% | 48% | 49% | 49% | 43% | 46% | 48% | 47% |
| Net | 26% | 61% | 22% | 21% | 21% | 25% | 27% | 26% | 18% | 32% | 25% | 26% |
| Growth (QoQ) | ||||||||||||
| Total revenue | -1% | 13% | 10% | 1% | 3% | 14% | 8% | -3% | ||||
| Gross profit | -6% | 25% | 18% | -1% | 3% | 25% | 11% | -4% | ||||
| Operating profit | -8% | 33% | 24% | -2% | 4% | 33% | 13% | -5% | ||||
| EBITDA | -2% | 14% | 14% | 1% | 2% | 18% | 9% | -2% | ||||
| Net profit | 61% | 161% | -61% | -2% | 4% | 35% | 14% | -5% | ||||
| FD EPS | 61% | 161% | -61% | -2% | 4% | 35% | 14% | -5% | ||||
| Growth (YoY) | ||||||||||||
| Total revenue | 5% | 17% | 28% | 24% | 28% | 30% | 28% | 23% | 2% | 19% | 27% | 10% |
| Gross profit | 15% | 32% | 50% | 38% | 52% | 52% | 42% | 39% | -9% | 35% | 45% | 14% |
| Operating profit | 15% | 38% | 67% | 49% | 68% | 68% | 53% | 48% | -15% | 43% | 58% | 16% |
| EBITDA | 14% | 23% | 36% | 29% | 34% | 39% | 33% | 29% | 3% | 26% | 33% | 7% |
| Net profit | 108% | 375% | 9% | 59% | 3% | -47% | 57% | 53% | -12% | 118% | -2% | 16% |
| FD EPS | 108% | 374% | 9% | 60% | 3% | -47% | 57% | 53% | -12% | 118% | -2% | 16% |
Source: Company, Daiwa estimates and forecasts
UMC: 3Q26 results preview and 4Q26 business outlook
| TWDm | 3Q26E - Daiwa | 3Q26E - Consensus | 3Q26E - Variance | 4Q26E - Daiwa | 4Q26E - Consensus | 4Q26E - Variance |
|---|---|---|---|---|---|---|
| Revenue | 75,612 | 75,517 | 0% | 76,347 | 78,272 | -2% |
| Gross profit | 26,449 | 26,392 | 0% | 26,174 | 27,621 | -5% |
| Operating profit | 18,585 | 18,234 | ||||
| Pretax profit | 19,485 | 19,084 | ||||
| Net profit | 16,367 | 17,018 | -4% | 16,031 | 18,371 | -13% |
| Adjusted EPS (TWD) | 1.30 | 1.35 | -4% | 1.27 | 1.46 | -13% |
| Margin | ||||||
| Gross | 35.0% | 34.9% | 34.3% | 35.3% | ||
| Operating | 24.6% | 23.9% | ||||
| Net | 21.6% | 21.0% | ||||
| Operation | ||||||
| Shipments (12" equ. wafers) ('000 units) | 1,201 | 1,213 | ||||
| Utilization* | 91% | 91% | ||||
| <=28nm sales contribution | 40% | 40% |
Source: Bloomberg, Daiwa estimates and forecasts
Note: * Calculated as wafer shipment divided installed capacity
UMC: 28/22nm-and-below revenue contribution*
Source: Company, Daiwa estimates and forecasts
Note: * Including 14nm FF
Source: Company, TEJ, Daiwa forecasts
ESG analysis
ESG risks
| Risks | Management | Analystcomments |
|---|---|---|
| G Executive/board quality | 1 | UMC's Board of Directors consists of nine members whose expertise covers industry, academia, finance, accounting, and management. Among these directors, six are independent directors, representing 67% of total directors in 2024. The percentage of independent directors is high relative to the regulatory requirement of at least 20% or at least 2 independent directors. Although some of UMC's executive management are also directors, UMC's Chairman and President are not the same person. Considering this and its relative-high percentage of independent directors, we believe the board can perform its functionalities well |
| Capital management | 2 | It kept its dividend payout ratios above 50% in 2017-25, which is at a healthy, sustainable level. Overall, we see the balance between investment and dividend as appropriate. |
| Related party & transaction | 1 | Sales to related parties were around 1-2% of its total revenue each year. The percentage is insignificant and thus we see limited risk for UMC. |
| S Supplychain management | 2 | UMC has constructed an evaluation framework for reviewing the sustainable development of its supply chains based on UMC's GG-026-004-C sustainable supply-chain management review guidelines to ensure its suppliers fulfil environmental protection, social responsibility, labour and human rights, safety & health and sustainable development guidelines. We believe these efforts could reduce its supply-chain risk. |
| E Water&wastewater management | 2 | UMC developed its 'Water Management Policy and Commitment' in 2015 to promote more effective utilisation of water resources. In line with this policy, UMC continues to enhance recycling through increased use of reclaimed and desalinated water, ongoing wastewater treatment R&D, and optimised discharge management. In 2024, the company achieved a 30.3% reduction in water withdrawal per unit product, surpassing its 14% goal and meeting its 2030 target ahead of schedule, which demonstrates UMC's strong commitment to water conservation. |
| E Waste & hazardous materials management | 2 | To achieve the goal of zero pollution, UMC has established a comprehensive new material evaluation process to effectively screen and control new materials introduced into the development of new processes. Through this effort, it can avoid or reduce the use of raw materials and the associated environmental impact. UMC was the first semiconductor manufacturer company in the world to obtain QC-080000 IECQ Hazardous Substance Process Management (HSPM) certification for all its fabs by leading global semiconductor manufacturers in completing the third-party verification and audit of its HSPM system in 2006. |
| E GHGemissions | 2 | UMC was the first semiconductor company in Taiwan to pass integrated environmental protection, safety and health management system certifications in 2001. UMC has established the UMC Low Carbon Commitment as a guide for future carbon reduction projects. Its GHG emission reduction goals include: 1) to reduce fluorinated greenhouse gas emissions intensity by 65% over 2013-25 vs. 2010, and 2) to reduce electricity consumption intensity by 15% in 10 years over 2016-25 vs. 2015. |
Note: Management score represents a company's ability to manage/benefit from certain ESG topics. The scores range from 1 to 3, with 1 being the strongest.
Update Date: 8 Oct 2026
Source: Daiwa, Company
Semiconductor Manufacturing Int'l Corp (981 HK)
Semiconductor Manufacturing Int'l Corp
Target price: HKD40.00 (from HKD40.00)
Shareprice(7Oct):HKD60.90 | Up/downside:-34.3%
Yes, AI, yet constrained by geopolitics
- A foundry leader in China set to benefit from AI innovations
- Yet likely seeing suboptimal operations due to 'national mission'
- Reaffirming our Sell (5) rating and 12-month TP of HKD40
What's new: As China's foundry leader, SMIC should benefit, among local peers, from China's AI innovations to cope with geopolitical pressures, such as multiple lithography patterning, time scaling in advanced packaging technology and logic folding. Yet, to serve what we view as China's 'national mission' to catch up with the West in AI, SMIC has to suboptimise its operations for suboptimal profitability, as evidenced by its abnormal capex cycle and resulting depreciation burden. As such, we remain comfortable with our Sell (5) rating on the stock, though we view such a rating in capital markets may not be fair and truly reflecting its authentic fundamentals.
What's the impact: 3Q26 preview and 4Q26 outlook. We expect SMIC to report 3Q26 net profit of USD399m, 7% below consensus, as the street appears to be assuming higher non-operating gains. For 4Q26, we forecast net profit of USD364m, down 9% QoQ but up 40% YoY, on flat top-line of USD3.1bn (+25% YoY), due to seasonality, as customers tend to manage inventory towards year-end.
Geopolitical concerns lingering despite AI. As China's foundry leader, SMIC should benefit, among local peers, from China's innovative AI developments, such as multiple lithography patterning, time scaling in advanced packaging technology and logic folding. Yet, to serve what we view as China's 'national mission' to catch up with the West in AI, SMIC has to suboptimise its operations for suboptimal profitability, as evidenced by its abnormal capex cycle over 2020-26 and the resulting depreciation burden. This, combined with lingering geopolitical uncertainty, prevents us from turning positive on the stock. President Xi and President Trump met in the US last month; we hope that any constructive breakthroughs in the future will help reset SMIC's competitiveness for normalised profitability.
What we recommend: We rate SMIC Sell (5), with a 12M TP of HKD40 (unchanged), based on our ROE-adjusted PBR target of 1.1x applied to our one-year-forward BVPS forecast. Though our rating may not truly reflect SMIC's fundamentals due to geopolitical issues, we await any breakthrough between the 2 power nations on trade conflicts to normalise SMIC's operations. Key upside risk to our call would be any positive breakthrough on geopolitics and export controls.
How we differ: Our 2028E EPS is 4% below Bloomberg consensus, likely due to our view calling for a soft-landing in the chip cycle.
4
3
2
Rick Hsu (886) 2 8758 6261 rick.hsu@daiwacm-cathay.com.tw
John Hetherington, CFA (852) 2773 8787 john.hetherington@hk.daiwacm.com
Forecast revisions (%)
| Year to 31 Dec | 26E | 27E | 28E |
|---|---|---|---|
| Revenue change | - | - | - |
| Net profit change | - | - | - |
| Core EPS (FD) change | - | - | - |
Source: Daiwa forecasts
Share price performance
| 12-month range | 50.70-89.40 |
|---|---|
| Market cap (USDbn) | 60.19 |
| 3m avg daily turnover (USDm) | 706.70 |
| Shares outstanding (m) | 8,316 |
| Major shareholder | Datang Investment Holdings (19.9%) |
Financial summary (USD)
| Year to 31 Dec | 26E | 27E | 28E |
|---|---|---|---|
| Revenue (m) | 11,748 | 14,045 | 15,540 |
| Operating profit (m) | 1,927 | 2,416 | 2,633 |
| Net profit (m) | 1,453 | 1,694 | 1,951 |
| Core EPS (fully- diluted)(USD cents) | 17.477 | 20.375 | 23.464 |
| EPS change (%) | 71.9 | 16.6 | 15.2 |
| Daiwa vs Cons. EPS (%) | 1.8 | (10.0) | (18.4) |
| PER (x) | 44.4 | 38.1 | 33.1 |
| Dividend yield (%) | 0.0 | 0.0 | 0.0 |
| DPS | 0.000 | 0.000 | 0.000 |
| PBR (x) | 1.7 | 1.6 | 1.5 |
| EV/EBITDA (x) | 12.1 | 9.8 | 8.5 |
| ROE (%) | 6.6 | 7.1 | 7.6 |
Source: FactSet, Daiwa forecasts
Financial summary
Key assumptions
| Year to 31 Dec | 2021 | 2022 | 2023 | 2024 | 2025 | 2026E | 2027E | 2028E |
|---|---|---|---|---|---|---|---|---|
| Capacity utilisation (%) | 98 | 88 | 63 | 77 | 80 | 84 | 90 | 97 |
| Blended ASP (USD) | 738 | 949 | 981 | 937 | 907 | 982 | 1,021 | 1,007 |
| Wafer shipment ('000, 8" equ.) | 6,747 | 7,099 | 5,867 | 8,021 | 9,696 | 11,316 | 13,115 | 14,692 |
Profit and loss (USDm)
| Year to 31 Dec | 2021 | 2022 | 2023 | 2024 | 2025 | 2026E | 2027E | 2028E |
|---|---|---|---|---|---|---|---|---|
| Foundry Revenue | 4,982 | 6,736 | 5,757 | 7,516 | 8,796 | 11,113 | 13,395 | 14,790 |
| Other Revenue | 461 | 538 | 565 | 514 | 531 | 635 | 650 | 750 |
| Other Revenue | 0 | 0 | 0 | 0 | 0 | 0 | 0 | 0 |
| Total Revenue | 5,443 | 7,273 | 6,322 | 8,030 | 9,327 | 11,748 | 14,045 | 15,540 |
| Other income | 0 | 0 | 0 | 0 | 0 | 0 | 0 | 0 |
| COGS | (3,767) | (4,512) | (5,104) | (6,582) | (7,370) | (8,806) | (10,324) | (11,336) |
| SG&A | (303) | (528) | (517) | (620) | (569) | (552) | (663) | (777) |
| Other op.expenses | 20 | (398) | (343) | (353) | (277) | (463) | (642) | (794) |
| Operating profit | 1,392 | 1,836 | 358 | 475 | 1,110 | 1,927 | 2,416 | 2,633 |
| Net-interest inc./(exp.) | 113 | 224 | 527 | 249 | 25 | (70) | (45) | 115 |
| Assoc/forex/extraord./others | 383 | 101 | 187 | 36 | 99 | 344 | 0 | 0 |
| Pre-tax profit | 1,888 | 2,160 | 1,072 | 760 | 1,234 | 2,201 | 2,371 | 2,748 |
| Tax | (65) | (16) | (63) | (130) | (84) | (180) | (203) | (247) |
| Min. int./pref. div./others | (73) | (380) | (222) | (237) | (304) | (568) | (474) | (550) |
| Net profit (reported) | 1,750 | 1,764 | 787 | 393 | 845 | 1,453 | 1,694 | 1,951 |
| Net profit (adjusted) | 1,750 | 1,764 | 787 | 393 | 845 | 1,453 | 1,694 | 1,951 |
| EPS (reported)(USD cents) | 22.139 | 22.287 | 9.835 | 4.789 | 10.167 | 17.477 | 20.375 | 23.464 |
| EPS (adjusted)(USD cents) | 22.139 | 22.287 | 9.835 | 4.789 | 10.167 | 17.477 | 20.375 | 23.464 |
| EPS (adjusted fully-diluted)(USD cents) | 21.042 | 21.212 | 9.462 | 4.722 | 10.167 | 17.477 | 20.375 | 23.464 |
| DPS (USD) | 0.000 | 0.000 | 0.000 | 0.000 | 0.000 | 0.000 | 0.000 | 0.000 |
| EBIT | 1,392 | 1,836 | 358 | 475 | 1,110 | 1,927 | 2,416 | 2,633 |
| EBITDA | 3,262 | 4,107 | 3,025 | 3,698 | 4,920 | 6,729 | 8,065 | 8,769 |
Cash flow (USDm)
| Year to 31 Dec | 2021 | 2022 | 2023 | 2024 | 2025 | 2026E | 2027E | 2028E |
|---|---|---|---|---|---|---|---|---|
| Profit before tax | 1,888 | 2,160 | 1,072 | 760 | 1,234 | 2,201 | 2,371 | 2,748 |
| Depreciation and amortisation | 1,869 | 2,271 | 2,667 | 3,223 | 3,810 | 4,802 | 5,649 | 6,136 |
| Tax paid | (65) | (16) | (63) | (130) | (84) | (180) | (203) | (247) |
| Change in working capital | (537) | (1) | (579) | (62) | (1,518) | 300 | (470) | 300 |
| Other operational CF items | (135) | 940 | (42) | (665) | (247) | (568) | (474) | (550) |
| Cash flow from operations | 3,020 | 5,354 | 3,056 | 3,126 | 3,194 | 6,555 | 6,873 | 8,387 |
| Capex | (4,120) | (6,172) | (7,630) | (7,664) | (8,400) | (8,100) | (5,300) | (4,500) |
| Net (acquisitions)/disposals | (2,669) | (4,314) | 1,240 | 3,033 | 1,853 | 0 | 0 | 0 |
| Other investing CF items | 134 | 94 | 183 | 112 | 52 | 0 | 0 | 0 |
| Cash flow from investing | (6,655) | (10,392) | (6,208) | (4,518) | (6,495) | (8,100) | (5,300) | (4,500) |
| Change in debt | 385 | 2,691 | 1,738 | 1,539 | 754 | 0 | (999) | (999) |
| Net share issues/(repurchases) | 0 | 0 | 0 | 0 | 0 | 0 | 0 | 0 |
| Dividends paid | 0 | 0 | 0 | 0 | 0 | 0 | 0 | 0 |
| Other financing CF items | 1,973 | 924 | 728 | 70 | 1,922 | 1,000 | 1,000 | 1,000 |
| Cash flow from financing | 2,357 | 3,614 | 2,466 | 1,608 | 2,676 | 1,000 | 1 | 1 |
| Forex effect/others | 0 | 0 | 0 | 0 | 0 | 0 | 0 | 0 |
| Change in cash | (1,279) | (1,423) | (686) | 216 | (625) | (545) | 1,574 | 3,888 |
| Free cash flow | (1,100) | (818) | (4,574) | (4,538) | (5,206) | (1,545) | 1,573 | 3,887 |
Source: FactSet, Daiwa forecasts
Financial summary continued …
Balance sheet (USDm)
| Year to 31 Dec | 2021 | 2022 | 2023 | 2024 | 2025 | 2026E | 2027E | 2028E |
|---|---|---|---|---|---|---|---|---|
| Cash & short-term investment | 12,529 | 12,578 | 9,422 | 10,909 | 10,491 | 9,946 | 11,520 | 15,408 |
| Inventory | 1,194 | 1,911 | 2,736 | 2,958 | 3,630 | 3,830 | 4,030 | 4,230 |
| Accounts receivable | 1,215 | 1,303 | 1,170 | 840 | 1,433 | 1,383 | 1,983 | 1,733 |
| Other current assets | 279 | 802 | 286 | 76 | 71 | 75 | 75 | 75 |
| Total current assets | 15,218 | 16,594 | 13,613 | 14,784 | 15,625 | 15,234 | 17,607 | 21,445 |
| Fixed assets | 14,815 | 19,385 | 24,419 | 28,524 | 32,933 | 36,471 | 36,348 | 36,348 |
| Goodwill & intangibles | 68 | 45 | 34 | 24 | 20 | 20 | 20 | 20 |
| Other non-current assets | 6,011 | 7,783 | 9,722 | 5,829 | 3,693 | 4,310 | 4,310 | 2,810 |
| Total assets | 36,111 | 43,808 | 47,787 | 49,161 | 52,271 | 56,034 | 58,285 | 60,623 |
| Short-term debt | 789 | 1,268 | 1,216 | 2,926 | 2,593 | 2,593 | 2,593 | 2,593 |
| Accounts payable | 2,066 | 3,217 | 3,728 | 3,280 | 2,966 | 3,416 | 3,746 | 3,996 |
| Other current liabilities | 1,598 | 2,540 | 2,657 | 2,553 | 1,258 | 2,549 | 3,199 | 3,400 |
| Total current liabilities | 4,454 | 7,025 | 7,602 | 8,760 | 6,817 | 8,559 | 9,539 | 9,989 |
| Long-term debt | 5,535 | 7,317 | 8,934 | 8,038 | 9,995 | 9,995 | 8,995 | 7,996 |
| Other non-current liabilities | 684 | 505 | 406 | 494 | 439 | 449 | 551 | 937 |
| Total liabilities | 10,673 | 14,846 | 16,942 | 17,292 | 17,251 | 19,002 | 19,085 | 18,921 |
| Share capital | 32 | 32 | 32 | 32 | 32 | 32 | 32 | 32 |
| Reserves/R.E./others | 17,118 | 19,118 | 20,084 | 20,582 | 21,408 | 22,851 | 24,546 | 26,497 |
| Shareholders' equity | 17,150 | 19,150 | 20,116 | 20,614 | 21,440 | 22,883 | 24,578 | 26,529 |
| Minority interests | 8,288 | 9,811 | 10,730 | 11,256 | 13,581 | 14,149 | 14,623 | 15,173 |
| Total equity & liabilities | 36,111 | 43,808 | 47,787 | 49,161 | 52,271 | 56,034 | 58,285 | 60,623 |
| EV | 66,613 | 70,348 | 75,988 | 75,840 | 80,207 | 81,320 | 79,221 | 74,884 |
| Net debt/(cash) | (6,205) | (3,993) | 729 | 55 | 2,097 | 2,642 | 68 | (4,819) |
| BVPS (USD cents) | 321.854 | 365.907 | 385.570 | 388.654 | 421.122 | 445.311 | 471.389 | 501.462 |
Key ratios (%)
| Year to 31 Dec | 2021 | 2022 | 2023 | 2024 | 2025 | 2026E | 2027E | 2028E |
|---|---|---|---|---|---|---|---|---|
| Sales (YoY) | 39.3 | 33.6 | (13.1) | 27.0 | 16.2 | 26.0 | 19.5 | 10.6 |
| EBITDA (YoY) | 100.8 | 25.9 | (26.3) | 22.2 | 33.0 | 36.8 | 19.9 | 8.7 |
| Operating profit (YoY) | 346.4 | 31.8 | (80.5) | 32.7 | 133.7 | 73.6 | 25.4 | 9.0 |
| Net profit (YoY) | 130.2 | 0.8 | (55.4) | (50.1) | 115.3 | 71.9 | 16.6 | 15.2 |
| Core EPS (fully-diluted) (YoY) | 130.2 | 0.8 | (55.4) | (50.1) | 115.3 | 71.9 | 16.6 | 15.2 |
| Gross-profit margin | 30.8 | 38.0 | 19.3 | 18.0 | 21.0 | 25.0 | 26.5 | 27.1 |
| EBITDA margin | 59.9 | 56.5 | 47.9 | 46.1 | 52.8 | 57.3 | 57.4 | 56.4 |
| Operating-profit margin | 25.6 | 25.2 | 5.7 | 5.9 | 11.9 | 16.4 | 17.2 | 16.9 |
| Net profit margin | 32.1 | 24.3 | 12.4 | 4.9 | 9.1 | 12.4 | 12.1 | 12.6 |
| ROAE | 10.8 | 9.7 | 4.0 | 1.9 | 4.0 | 6.6 | 7.1 | 7.6 |
| ROAA | 5.2 | 4.4 | 1.7 | 0.8 | 1.7 | 2.7 | 3.0 | 3.3 |
| ROCE | 4.7 | 5.3 | 0.9 | 1.1 | 2.5 | 4.0 | 4.8 | 5.1 |
| ROIC | 7.8 | 8.2 | 1.2 | 1.2 | 3.0 | 4.6 | 5.6 | 6.3 |
| Net debt to equity | n.a. | n.a. | 3.6 | 0.3 | 9.8 | 11.5 | 0.3 | n.a. |
| Effective tax rate | 3.5 | 0.7 | 5.8 | 17.1 | 6.8 | 8.2 | 8.5 | 9.0 |
| Accounts receivable (days) | 73.5 | 63.2 | 71.4 | 45.7 | 44.5 | 43.7 | 43.7 | 43.6 |
| Current ratio (x) | 3.4 | 2.4 | 1.8 | 1.7 | 2.3 | 1.8 | 1.8 | 2.1 |
| Net interest cover (x) | n.a. | n.a. | n.a. | n.a. | n.a. | 27.5 | 53.7 | n.a. |
| Net dividend payout | 0.0 | 0.0 | 0.0 | 0.0 | 0.0 | 0.0 | 0.0 | 0.0 |
| Free cash flow yield | n.a. | n.a. | n.a. | n.a. | n.a. | n.a. | 2.4 | 6.0 |
Source: FactSet, Daiwa forecasts
Company profile
Incorporated in China in 2000, Semiconductor Manufacturing International Corp (SMIC) is the largest dedicated semiconductor foundry in China. It offers product services, such as wafer fabrication, masking, packaging and testing. Its fab operations spread over major cities of China, including Shanghai (8", 12"), Beijing (12"), Tianjin (8') and Shenzhen (8", 12"). It has also set up JV fabs with the governments and teamed up with Jiangsu Changjiang Electronics Technology (JCET, 江蘇長電).
SMIC: key operating assumptions, quarterly P&L estimates and forecasts
| USDm | 1Q26 | 2Q26 | 3Q26E | 4Q26E | 1Q27E | 2Q27E | 3Q27E | 4Q27E | 2025 | 2026E | 2027E | 2028E |
|---|---|---|---|---|---|---|---|---|---|---|---|---|
| Wafer shipments (12" equ) ('000 units) | 1,115 | 1,275 | 1,313 | 1,326 | 1,299 | 1,442 | 1,543 | 1,543 | 4,309 | 5,029 | 5,829 | 6,530 |
| Capacity utilisation | 78% | 87% | 87% | 85% | 84% | 90% | 93% | 93% | 80% | 84% | 90% | 97% |
| Blended ASP (USD) | 2,110 | 2,230 | 2,252 | 2,233 | 2,219 | 2,287 | 2,337 | 2,336 | 2,041 | 2,210 | 2,298 | 2,265 |
| Total revenue | 2,505 | 3,006 | 3,116 | 3,121 | 3,034 | 3,459 | 3,777 | 3,775 | 9,327 | 11,748 | 14,045 | 15,540 |
| COGS | -2,002 | -2,245 | -2,258 | -2,301 | -2,304 | -2,497 | -2,731 | -2,792 | -7,370 | -8,806 | -10,324 | -11,336 |
| Gross profit | 504 | 761 | 858 | 820 | 730 | 962 | 1,046 | 983 | 1,957 | 2,942 | 3,721 | 4,204 |
| Opex | -256 | -226 | -258 | -275 | -286 | -308 | -344 | -367 | -847 | -1,015 | -1,305 | -1,571 |
| Operating profit | 248 | 534 | 600 | 545 | 444 | 654 | 702 | 616 | 1,110 | 1,927 | 2,416 | 2,633 |
| EBITDA | 1,336 | 1,746 | 1,840 | 1,807 | 1,724 | 2,004 | 2,172 | 2,165 | 4,920 | 6,729 | 8,065 | 8,769 |
| Non-op gain/loss | -11 | 309 | -13 | -10 | -10 | -6 | 0 | -29 | 124 | 274 | -45 | 115 |
| Pretax profit | 236 | 843 | 587 | 535 | 434 | 648 | 702 | 587 | 1,234 | 2,201 | 2,371 | 2,748 |
| Income taxes & MI | -58 | -331 | -188 | -171 | -122 | -181 | -204 | -170 | -388.1 | -747.8 | -676.8 | -797.0 |
| Net profit | 178 | 512 | 399 | 364 | 312 | 467 | 498 | 417 | 845 | 1,453 | 1,694 | 1,951 |
| FD O/S (bn) | 8.32 | 8.32 | 8.32 | 8.32 | 8.32 | 8.32 | 8.32 | 8.32 | 8.32 | 8.32 | 8.32 | 8.32 |
| FD EPS (US¢) | 2.15 | 6.16 | 4.80 | 4.38 | 3.76 | 5.61 | 5.99 | 5.01 | 10.17 | 17.48 | 20.38 | 23.46 |
| FD EPS/ADS (USD) | 1.07 | 3.08 | 2.40 | 2.19 | 1.88 | 2.81 | 3.00 | 2.51 | 5.08 | 8.74 | 10.19 | 11.73 |
| Margin | ||||||||||||
| Gross | 20% | 25% | 28% | 26% | 24% | 28% | 28% | 26% | 21% | 25% | 26% | 27% |
| Operating | 10% | 18% | 19% | 17% | 15% | 19% | 19% | 16% | 12% | 16% | 17% | 17% |
| EBITDA | 53% | 58% | 59% | 58% | 57% | 58% | 58% | 57% | 53% | 57% | 57% | 56% |
| Net | 7% | 17% | 13% | 12% | 10% | 13% | 13% | 11% | 9% | 12% | 12% | 13% |
| Growth (QoQ) | ||||||||||||
| Total revenue | 1% | 20% | 4% | 0% | -3% | 14% | 9% | 0% | ||||
| Gross profit | 5% | 51% | 13% | -4% | -11% | 32% | 9% | -6% | ||||
| Operating profit | -17% | 116% | 12% | -9% | -19% | 47% | 7% | -12% | ||||
| EBITDA | -2% | 31% | 5% | -2% | -5% | 16% | 8% | 0% | ||||
| Net profit | -31% | 187% | -22% | -9% | -14% | 49% | 7% | -16% | ||||
| FD EPS | -31% | 187% | -22% | -9% | -14% | 49% | 7% | -16% | ||||
| Growth (YoY) | ||||||||||||
| Total revenue | 11% | 36% | 31% | 25% | 21% | 15% | 21% | 21% | 16% | 26% | 20% | 11% |
| Gross profit | 0% | 69% | 64% | 71% | 45% | 26% | 22% | 20% | 35% | 50% | 26% | 13% |
| Operating profit | -20% | 255% | 71% | 83% | 79% | 22% | 17% | 13% | 134% | 74% | 25% | 9% |
| EBITDA | 14% | 70% | 37% | 32% | 29% | 15% | 18% | 20% | 33% | 37% | 20% | 9% |
| Net profit | -13% | 148% | 131% | 40% | 75% | -9% | 25% | 14% | 116% | 72% | 17% | 15% |
| FD EPS | -13% | 148% | 131% | 40% | 75% | -9% | 25% | 14% | 116% | 72% | 17% | 15% |
Source: Company, Daiwa estimates and forecasts
SMIC: 3Q26 results preview and 4Q26 business outlook
| (in USDm) | 3Q26E - Daiwa | 3Q26E - Consensus | 3Q26E - Variance | 4Q26E - Daiwa | 4Q26E - Consensus | 4Q26E - Variance |
|---|---|---|---|---|---|---|
| Revenue | 3,116.41 | 3,109.00 | 0% | 3,120.97 | 3,232.00 | -3% |
| Gross profit | 858.03 | 805.20 | 7% | 819.90 | 811.75 | 1% |
| Operating profit | 599.64 | 541.77 | 11% | 545.38 | 495.92 | 10% |
| EBITDA | 1,839.64 | 1,807.39 | ||||
| Pretax profit | 586.64 | 535.38 | ||||
| Net profit | 398.91 | 427.00 | -7% | 364.06 | 421.00 | -14% |
| FD EPS (US¢) | 4.80 | 5.13 | -7% | 4.38 | 5.06 | -14% |
| Margins | ||||||
| Gross | 27.5% | 25.9% | 26.3% | 25.1% | ||
| Operating | 19.2% | 17.4% | 17.5% | 15.3% | ||
| Net | 12.8% | 13.7% | 11.7% | 13.0% | ||
| Operation | ||||||
| Shipment (8" equ.wafers) ('000 units) | 2,954 | 2,984 | ||||
| Utilisation* | 87% | 85% | ||||
| <=28nm sales contribution | 49% | 49% |
Source: Bloomberg, Daiwa estimates and forecasts
Note: * Calculated as wafer shipment divided by capacity
SMIC: capex and capital intensity*
SMIC: PBR trend*
Source: Company, Daiwa forecasts
Note: * Capital intensity = capex / revenue
Source: Company, Bloomberg, Daiwa forecasts
Note: * PBR calculations do not include the A-share-listed market cap, thus deflating multiples
ESG analysis
ESG risks
| Risks | Management | Analystcomments | |
|---|---|---|---|
| G | Executive/board quality | 2 | SMIC's Board of Directors (BoD) has 9 members in 2025, including 1 executive director, 4 non- executive directors and 4 independent directors. Its BoD members have a diverse background, and SMIC's chairman and CEO are not the same person. |
| Capital management | 3 | SMIC's capex in 2025 was approximately USD8.4bn. Management expects capex in 2026 to maintain roughly flat to slightly down compared to 2025, which exceeded 10% of the Company's latest audited net assets, with large capital needs. | |
| Related party transaction | & | 1 | SMIC has established a comprehensive supplier management framework covering supplier onboarding, periodic evaluation, quality audits and ESG compliance, which helps mitigate potential related-party transaction and procurement risks. Suppliers are assessed through a cross-functional process covering quality, cost, delivery, service, environmental and compliance factors, while higher-risk suppliers are subject to enhanced monitoring and corrective actions. SMIC also emphasizes supplier diversification to reduce geographic and concentration risks, with raw material suppliers distributed across China (71.3%), Eurasia (22.9%) and the Americas (5.8%) in 2025. Overall, the Company's structured supplier evaluation and geographic diversification mechanisms provide a reasonable level of control over supply-chain and related- party transaction risks. |
| S | Supplychain management | 2 | SMIC continuously improves the specification of layered management for suppliers. The specification covers the whole life cycle of the supply chain and refines specific requirements for access, evaluation and management. Incorporating multiple aspects including strategic supply chain management, and raw materials and spare parts procurement, SMIC has established global supplychain management and planning, to ensure product quality and service capabilities of supply chain. The company supports the development of the local supply chain and aims to increase the proportion of its raw material suppliers based in mainland China annually. By increasing local supply, it can reduce its procurement cost and thus increase its operational efficiency and also partially mitigate the geopolitical risks, in our view. |
| E | Water&wastewater management | 2 | The company has implemented water-saving projects to improve water usage and reduce external water source consumption. These projects include reducing water consumption in the facility system, increasing wastewater reclamation, improving its water production rate and lowering water draining losses. |
| E | Waste & hazardous materials management | 2 | It has implemented cleaner production projects to optimise its raw materials usage, reduce resource consumption, and minimise waste generation at the source of production. |
| E | GHGemissions | 1 | SMIC is continuously implementing energy conservation and emission reduction projects. Every year, SMIC promotes energy-saving and emission reduction projects in an orderly manner so as to improve energy efficiency, reduce GHG emissions, and address climate change. |
Note: Management score represents a company's ability to manage/benefit from certain ESG topics. The scores range from 1 to 3, with 1 being the strongest.
Update Date: 7 Oct 2026
Source: Daiwa, Company
HuaHongGraceSemiconductor (1347HK)
Hua Hong Grace Semiconductor
Target price: HKD139.00 (from HKD139.00)
Shareprice(7Oct):HKD105.30 | Up/downside:+32.0%
3Q26 preview: steady ASP growth outlook
- Positive earnings growth momentum in 3Q26E and 4Q26E
- Favourable supply-demand environment, thanks to AI investment
- Reaffirming our Buy (1) rating and 12-month TP of HKD139.0
What's new: We expect HHGrace to continue to post positive earnings growth momentum in 3Q26E and 4Q26E, on the back of both volume and ASP strength. We believe HHGrace will continue to inject Huali's (HLMC) assets into the listed company, thereby expanding HHGrace's business portfolio and manufacturing footprint.
What's the impact: 3Q26 preview and 4Q26 outlook. We forecast HHgrace to report revenue of USD775m in 3Q26E, up 22% YoY and 8% QoQ, driven by 15% YoY volume growth and a 6% YoY hike in ASPs. On a QoQ basis, we estimate a 3% improvement in ASPs. As a result, we expect net profit of USD58m in 3Q26E, up 124% YoY and 49% QoQ. We forecast the growth momentum to sustain into 4Q26, with 22% YoY expansion in revenue to USD804m, and 282% YoY growth in net profit to USD67m.
Mainstream business to benefit from AI ripple effects and TSMC's fab optimisation. HHGrace focuses on the production of Nor Flash, MCUs, power discretes, analog and RF products, covering 55nm and above process-node technology platforms. HHGrace began raising ASPs in 4Q25, thanks to demand tailwinds from AI investment. Also, we expect TSMC's capacity optimisation to cause short-term supply disruptions, resulting in sustained strength in pricing power for legacy-node foundry players.
Steady manufacturing footprint expansion. Despite wafer supply tightness, HHgrace maintains its Fab 9 expansion timeline, with wafer loading at Fab 9A (83,000wpm capacity) in 3Q26, reaching full utilisation in 2H27. Furthermore, Fab 9B (55,000wpm) is set to kick-start small-volume production in 2027, per HHgrace. We believe the expansion focus will be on the 55/40/28nm process nodes. HHGrace plans to complete HLMC's Fab 5 asset acquisition in 2H26. We expect more asset injections in 2027.
What we recommend: We maintain our SOTP-based 12-month TP of HKD139. We believe HHGrace will inject HLMC's assets into the listed company by 2030. We factor in the future asset value of HLMC through to 2030 by applying 2.5-4.0x PBRs to the fabs in Kangqiao, Zhangjiang and Chengdu, as well as HHSemi's assets, and then discounting back by 3.5 years at a 10% rate. We then apply a 70% discount due to the potential dilution from share issuance related to the acquisition of HLMC's assets. We reaffirm our Buy (1) rating. Key downside risk: changes in assetinjection plans.
How we differ: Our 2026-28E EPS are 9-30% below the Bloomberg consensus, likely as we are more cautious about its ASP and gross margin outlook.
3
2
1
(unchanged)
Bintuo Ni (86) 21 6841 3228 bintuo.ni@daiwacm.cn
Rick Hsu (886) 2 8758 6261 rick.hsu@daiwacm-cathay.com.tw
Forecast revisions (%)
| Year to 31 Dec | 26E | 27E | 28E |
|---|---|---|---|
| Revenue change | - | - | - |
| Net profit change | - | - | - |
| Core EPS (FD) change | - | - | - |
Source: Daiwa forecasts
Share price performance
| 12-month range | 66.30-215.20 |
|---|---|
| Market cap (USDbn) | 17.84 |
| 3m avg daily turnover (USDm) | 564.46 |
| Shares outstanding (m) | 1,330 |
| Major shareholder | HuaHongInternational (26.2%) |
Financial summary (USD)
| Year to 31 Dec | 26E | 27E | 28E |
|---|---|---|---|
| Revenue (m) | 2,957 | 3,386 | 3,860 |
| Operating profit (m) | 48 | 120 | 145 |
| Net profit (m) | 184 | 267 | 290 |
| Core EPS (fully-diluted) | 0.106 | 0.154 | 0.167 |
| EPS change (%) | 235.5 | 45.2 | 8.3 |
| Daiwa vs Cons. EPS (%) | (9.4) | (15.9) | (30.2) |
| PER (x) | 126.5 | 87.2 | 80.5 |
| Dividend yield (%) | 0.0 | 0.0 | 0.0 |
| DPS | 0.000 | 0.000 | 0.000 |
| PBR (x) | 3.4 | 3.3 | 3.2 |
| EV/EBITDA (x) | 21.0 | 18.3 | 16.8 |
| ROE (%) | 2.7 | 3.9 | 4.0 |
Source: FactSet, Daiwa forecasts
Financial summary
Key assumptions
| Year to 31 Dec | 2021 | 2022 | 2023 | 2024 | 2025 | 2026E | 2027E | 2028E |
|---|---|---|---|---|---|---|---|---|
| 55nm & 65nm shipment (k units) | 255 | 593 | 527 | 904 | 1,268 | 1,800 | 2,130 | 2,750 |
| 90nm & 95nm shipment (k units) | 747 | 1,100 | 960 | 1,181 | 1,610 | 1,840 | 2,180 | 2,400 |
| ≤0.13μm shipment (k units) | 370 | 521 | 540 | 407 | 338 | 365 | 410 | 450 |
| 0.15μm & 0.18μm shipment (k units) | 263 | 298 | 236 | 228 | 232 | 265 | 260 | 285 |
| 0.25μm shipment (k units) | 43 | 26 | 50 | 39 | 28 | 40 | 37 | 38 |
| ≥0.35μm shipment (k units) | 1,650 | 1,549 | 1,790 | 1,785 | 1,908 | 1,971 | 2,070 | 2,070 |
Profit and loss (USDm)
| Year to 31 Dec | 2021 | 2022 | 2023 | 2024 | 2025 | 2026E | 2027E | 2028E |
|---|---|---|---|---|---|---|---|---|
| Wafer revenue | 1,562 | 2,377 | 2,182 | 1,901 | 2,302 | 2,849 | 3,275 | 3,746 |
| Non-wafer revenue | 69 | 99 | 105 | 103 | 100 | 109 | 111 | 114 |
| Other Revenue | 0 | 0 | 0 | 0 | 0 | 0 | 0 | 0 |
| Total Revenue | 1,631 | 2,475 | 2,286 | 2,004 | 2,402 | 2,957 | 3,386 | 3,860 |
| Other income | 318 | 457 | 500 | 556 | 735 | 858 | 959 | 1,079 |
| COGS | (1,196) | (1,632) | (1,799) | (1,799) | (2,119) | (2,464) | (2,788) | (3,143) |
| SG&A | (256) | (279) | (333) | (361) | (426) | (445) | (478) | (572) |
| Other op.expenses | (318) | (457) | (500) | (556) | (735) | (858) | (959) | (1,079) |
| Operating profit | 179 | 565 | 154 | (156) | (142) | 48 | 120 | 145 |
| Net-interest inc./(exp.) | 0 | (13) | (39) | 5 | (24) | (71) | (72) | (72) |
| Assoc/forex/extraord./others | 118 | (55) | 59 | 17 | 77 | 77 | 103 | 103 |
| Pre-tax profit | 296 | 496 | 174 | (134) | (89) | 54 | 151 | 176 |
| Tax | (65) | (89) | (47) | (7) | (22) | (12) | (24) | (27) |
| Min. int./pref. div./others | 31 | 43 | 154 | 198 | 166 | 143 | 140 | 140 |
| Net profit (reported) | 261 | 450 | 280 | 58 | 55 | 184 | 267 | 290 |
| Net profit (adjusted) | 261 | 450 | 280 | 58 | 55 | 184 | 267 | 290 |
| EPS (reported)(USD) | 0.201 | 0.345 | 0.189 | 0.034 | 0.032 | 0.106 | 0.154 | 0.167 |
| EPS (adjusted)(USD) | 0.201 | 0.345 | 0.189 | 0.034 | 0.032 | 0.106 | 0.154 | 0.167 |
| EPS (adjusted fully-diluted)(USD) | 0.198 | 0.342 | 0.188 | 0.034 | 0.032 | 0.106 | 0.154 | 0.167 |
| DPS (USD) | 0.000 | 0.000 | 0.000 | 0.000 | 0.000 | 0.000 | 0.000 | 0.000 |
| EBIT | 179 | 565 | 154 | (156) | (142) | 48 | 120 | 145 |
| EBITDA | 497 | 1,021 | 654 | 400 | 593 | 906 | 1,079 | 1,224 |
Cash flow (USDm)
| Year to 31 Dec | 2021 | 2022 | 2023 | 2024 | 2025 | 2026E | 2027E | 2028E |
|---|---|---|---|---|---|---|---|---|
| Profit before tax | 296 | 496 | 174 | (134) | (89) | 54 | 151 | 176 |
| Depreciation and amortisation | 318 | 457 | 500 | 556 | 735 | 858 | 959 | 1,079 |
| Tax paid | (13) | (27) | (61) | 0 | 0 | 0 | 0 | 0 |
| Change in working capital | (73) | (174) | (109) | 103 | 8 | (169) | 48 | (210) |
| Other operational CF items | (10) | (1) | 138 | (66) | (4) | 202 | 188 | 185 |
| Cash flow from operations | 518 | 751 | 642 | 460 | 650 | 944 | 1,347 | 1,231 |
| Capex | (939) | (996) | (907) | (2,780) | (1,814) | (1,300) | (2,000) | (2,000) |
| Net (acquisitions)/disposals | 0 | 0 | 0 | 0 | 0 | 0 | 0 | 0 |
| Other investing CF items | 76 | 66 | 73 | 108 | 95 | 0 | 0 | 0 |
| Cash flow from investing | (863) | (930) | (833) | (2,672) | (1,719) | (1,300) | (2,000) | (2,000) |
| Change in debt | 1,071 | 515 | 615 | 289 | 2,018 | 0 | 0 | 0 |
| Net share issues/(repurchases) | (4) | (42) | 2,833 | (138) | 34 | 0 | 0 | 0 |
| Dividends paid | 0 | 0 | 0 | 0 | 0 | 0 | 0 | 0 |
| Other financing CF items | (52) | 199 | 333 | 999 | (553) | (71) | (72) | (72) |
| Cash flow from financing | 1,015 | 672 | 3,782 | 1,150 | 1,499 | (71) | (72) | (72) |
| Forex effect/others | 17 | (94) | (14) | (64) | 71 | 0 | 0 | 0 |
| Change in cash | 687 | 399 | 3,576 | (1,126) | 502 | (427) | (725) | (841) |
| Free cash flow | (420) | (245) | (265) | (2,320) | (1,164) | (356) | (653) | (769) |
Source: FactSet, Daiwa forecasts
Financial summary continued …
Balance sheet (USDm)
| Year to 31 Dec | 2021 | 2022 | 2023 | 2024 | 2025 | 2026E | 2027E | 2028E |
|---|---|---|---|---|---|---|---|---|
| Cash & short-term investment | 1,610 | 2,009 | 5,585 | 4,459 | 4,961 | 4,534 | 3,809 | 2,968 |
| Inventory | 433 | 578 | 450 | 467 | 544 | 698 | 677 | 873 |
| Accounts receivable | 181 | 292 | 279 | 270 | 282 | 447 | 388 | 564 |
| Other current assets | 167 | 197 | 256 | 636 | 819 | 819 | 819 | 819 |
| Total current assets | 2,391 | 3,076 | 6,570 | 5,833 | 6,607 | 6,499 | 5,693 | 5,223 |
| Fixed assets | 3,117 | 3,368 | 3,519 | 5,859 | 6,676 | 7,118 | 8,159 | 9,080 |
| Goodwill & intangibles | 35 | 33 | 50 | 31 | 36 | 36 | 36 | 36 |
| Other non-current assets | 659 | 579 | 805 | 692 | 1,135 | 1,135 | 1,135 | 1,135 |
| Total assets | 6,202 | 7,055 | 10,943 | 12,415 | 14,454 | 14,787 | 15,023 | 15,474 |
| Short-term debt | 195 | 427 | 193 | 281 | 404 | 404 | 404 | 404 |
| Accounts payable | 194 | 237 | 235 | 298 | 330 | 480 | 448 | 610 |
| Other current liabilities | 691 | 719 | 544 | 983 | 1,122 | 1,122 | 1,122 | 1,122 |
| Total current liabilities | 1,080 | 1,382 | 972 | 1,562 | 1,856 | 2,006 | 1,974 | 2,135 |
| Long-term debt | 1,395 | 1,482 | 1,907 | 1,917 | 2,787 | 2,787 | 2,787 | 2,787 |
| Other non-current liabilities | 42 | 56 | 50 | 29 | 646 | 646 | 646 | 646 |
| Total liabilities | 2,518 | 2,920 | 2,929 | 3,508 | 5,290 | 5,439 | 5,407 | 5,569 |
| Share capital | 1,986 | 1,994 | 4,934 | 4,938 | 4,987 | 4,987 | 4,987 | 4,987 |
| Reserves/R.E./others | 884 | 1,036 | 1,367 | 1,309 | 1,625 | 1,809 | 2,077 | 2,366 |
| Shareholders' equity | 2,870 | 3,030 | 6,301 | 6,247 | 6,613 | 6,797 | 7,064 | 7,354 |
| Minority interests | 814 | 1,105 | 1,714 | 2,660 | 2,552 | 2,552 | 2,552 | 2,552 |
| Total equity & liabilities | 6,202 | 7,055 | 10,943 | 12,415 | 14,454 | 14,787 | 15,023 | 15,474 |
| EV | 18,639 | 18,849 | 16,072 | 18,243 | 18,626 | 19,053 | 19,778 | 20,619 |
| Net debt/(cash) | (20) | (100) | (3,486) | (2,261) | (1,770) | (1,343) | (618) | 223 |
| BVPS (USD) | 2.208 | 2.325 | 4.263 | 3.638 | 3.809 | 3.915 | 4.069 | 4.236 |
Key ratios (%)
| Year to 31 Dec | 2021 | 2022 | 2023 | 2024 | 2025 | 2026E | 2027E | 2028E |
|---|---|---|---|---|---|---|---|---|
| Sales (YoY) | 69.6 | 51.8 | (7.7) | (12.3) | 19.9 | 23.1 | 14.5 | 14.0 |
| EBITDA (YoY) | 189.1 | 105.6 | (35.9) | (38.8) | 48.1 | 52.9 | 19.1 | 13.4 |
| Operating profit (YoY) | n.a. | 215.8 | (72.7) | n.a. | n.a. | n.a. | 150.2 | 21.0 |
| Net profit (YoY) | 162.9 | 72.1 | (37.8) | (79.2) | (5.6) | 235.5 | 45.2 | 8.3 |
| Core EPS (fully-diluted) (YoY) | 161.0 | 72.9 | (45.0) | (82.1) | (6.4) | 235.5 | 45.2 | 8.3 |
| Gross-profit margin | 26.7 | 34.1 | 21.3 | 10.2 | 11.8 | 16.7 | 17.7 | 18.6 |
| EBITDA margin | 30.5 | 41.3 | 28.6 | 20.0 | 24.7 | 30.6 | 31.9 | 31.7 |
| Operating-profit margin | 11.0 | 22.8 | 6.7 | n.a. | n.a. | 1.6 | 3.5 | 3.8 |
| Net profit margin | 16.0 | 18.2 | 12.2 | 2.9 | 2.3 | 6.2 | 7.9 | 7.5 |
| ROAE | 9.7 | 15.2 | 6.0 | 0.9 | 0.9 | 2.7 | 3.9 | 4.0 |
| ROAA | 4.9 | 6.8 | 3.1 | 0.5 | 0.4 | 1.3 | 1.8 | 1.9 |
| ROCE | 3.9 | 10.0 | 1.9 | n.a. | n.a. | 0.4 | 0.9 | 1.1 |
| ROIC | 4.2 | 12.0 | 2.6 | n.a. | n.a. | 0.7 | 1.5 | 1.6 |
| Net debt to equity | net cash | net cash | net cash | net cash | net cash | net cash | net cash | 3.0 |
| Effective tax rate | 22.1 | 18.0 | 27.2 | (5.2) | (5.2) | (5.2) | (5.2) | (5.2) |
| Accounts receivable (days) | 33.8 | 34.9 | 45.5 | 50.0 | 42.0 | 45.0 | 45.0 | 45.0 |
| Current ratio (x) | 2.2 | 2.2 | 6.8 | 3.7 | 3.6 | 3.2 | 2.9 | 2.4 |
| Net interest cover (x) | n.a. | 42.2 | 3.9 | n.a. | n.a. | 0.7 | 1.7 | 2.0 |
| Net dividend payout | 0.0 | 0.0 | 0.0 | 0.0 | 0.0 | 0.0 | 0.0 | 0.0 |
| Free cash flow yield | n.a. | n.a. | n.a. | n.a. | n.a. | n.a. | n.a. | n.a. |
Source: FactSet, Daiwa forecasts
Company profile
Hua Hong Grace Semiconductor Limited manufactures semiconductors wafer foundry services. The Company produces embedded non-volatile memory, power discrete, analog, power management, and logic RF products. Hua Hong Semiconductor provides products for consumer electronics, communications, computing, industrial, and automotive fields.
HHGrace: financial forecasts
| (in USDm) | 1Q26 | 2Q26 | 3Q26E | 4Q26E | 1Q27E | 2Q27E | 3Q27E | 4Q27E | 2025 | 2026E | 2027E | 2028E |
|---|---|---|---|---|---|---|---|---|---|---|---|---|
| Revenue | 661 | 718 | 775 | 804 | 789 | 830 | 870 | 898 | 2,402 | 2,957 | 3,386 | 3,860 |
| COGS | (575) | (599) | (637) | (654) | (662) | (684) | (709) | (733) | (2,119) | (2,464) | (2,788) | (3,143) |
| Gross profit | 86 | 118 | 138 | 150 | 128 | 145 | 160 | 165 | 283 | 493 | 598 | 717 |
| Opex | (106) | (107) | (107) | (125) | (114) | (114) | (114) | (136) | (426) | (445) | (478) | (572) |
| Operating profit | (20) | 11 | 31 | 25 | 14 | 31 | 46 | 29 | (142) | 48 | 120 | 145 |
| Pretax profit | (22) | 12 | 27 | 37 | 17 | 34 | 49 | 51 | (89) | 54 | 151 | 176 |
| Income taxes | 5 | (8) | (4) | (6) | (4) | (5) | (7) | (8) | (22) | (12) | (24) | (27) |
| Net profit | 21 | 39 | 58 | 67 | 48 | 64 | 77 | 78 | 55 | 184 | 267 | 290 |
| Margin | ||||||||||||
| Gross | 13.0% | 16.5% | 17.8% | 18.7% | 16% | 18% | 18% | 18% | 11.8% | 16.7% | 17.7% | 18.6% |
| Opex | -16% | -15% | -14% | -16% | -14% | -14% | -13% | -15% | -17.7% | -15.0% | -14.1% | -14.8% |
| Operating | -3% | 2% | 4% | 3% | 2% | 4% | 5% | 3% | -5.9% | 1.6% | 3.5% | 3.8% |
| Net | 3% | 5% | 7% | 8% | 6% | 8% | 9% | 9% | 2.3% | 6.2% | 7.9% | 7.5% |
| Growth (QoQ) | ||||||||||||
| Revenue | 0% | 9% | 8% | 4% | -2% | 5% | 5% | 3% | ||||
| Gross profit | 0% | 38% | 17% | 9% | -15% | 14% | 10% | 3% | ||||
| Operating profit | nm | nm | 181% | nm | -45% | 128% | 47% | -37% | ||||
| Net profit | 20% | 85% | 49% | 15% | -28% | 33% | 19% | 2% | ||||
| Growth (YoY) | ||||||||||||
| Revenue | 22% | 27% | 22% | 22% | 19% | 16% | 12% | 12% | 20% | 23% | 15% | 14% |
| Gross profit | 72% | 92% | 61% | 75% | 48% | 23% | 16% | 10% | 38% | 74% | 21% | 20% |
| Operating profit | nm | nm | nm | nm | nm | 184% | 48% | 15% | nm | nm | 150% | 21% |
| Net profit | 458% | 386% | 124% | 282% | 130% | 66% | 33% | 18% | -6% | 235% | 45% | 8% |
Source: Company, Daiwa forecasts
HHGrace: SOTP valuation
| SOTP-based valuation (HHGrace) - Fab | Asset (USDm) | NAV (USDm) | PBR (x) | Equity (USDm) |
|---|---|---|---|---|
| Fab 5 | 1,163 | 427 | 4.0x | 1,710 |
| Fab 6 | 4,000 | 2,600 | 2.5x | 6,500 |
| Fab X | 5,600 | 3,640 | 3.0x | 10,920 |
| Fab Y | 6,400 | 4,160 | 3.0x | 12,480 |
| Fab 10 | 3,200 | 2,080 | 2.5x | 5,200 |
| HLMC | 20,363 | 12,907 | 2.9 | 36,810 |
| HHSEMI | 15,474 | 9,905 | 2.5 | 24,763 |
| HH Group | 35,837 | 22,813 | 2.7 | 61,573 |
| HKD/USD | 7.80 | |||
| Discount factor (from end-2030E to mid-2027E @ 10%) | Discount factor (from end-2030E to mid-2027E @ 10%) | 0.72 | ||
| Share issue dilutive effect (30% share dilution to purchase assets) | Share issue dilutive effect (30% share dilution to purchase assets) | 70% | ||
| Shares outstanding (m) | Shares outstanding (m) | 1,736 | ||
| 12M TP (HKD) | 139.0 |
Source: Daiwa estimates and forecasts
ESG analysis
ESG risks
| Risks | Risks | Management | Analystcomments |
|---|---|---|---|
| G | Executive/board quality | 2 | Hua Hong Grace Semiconductor (HH Grace) has established various regulations and systems related to corporate governance, in accordance with local laws and regulations. In 2025, the Board of the Company consists of 9 members, including 1 female director. |
| Capital management | 1 | The Group manages its capital structure and makes adjustments to it in light of changes in economic conditions. To maintain or adjust the capital structure, the Group may adjust the dividendpayment toshareholders, returncapital toshareholdersor issuenewshares. | |
| Related party & transaction | 1 | In 2025, HHGrace's connected transaction was minimal. | |
| G | Supplychain management | 2 | HH Grace strategically forms medium- and long-term agreements with suppliers. The company also regularly reviews its inventory to maintain it at a rational level. |
| G | Water&wastewater management | 2 | In 2025, the company was 100% compliant in terms of its wasterwater discharge. |
| G | Waste & hazardous materials management | 2 | Under the philosophy of lean manufacturing management, the company continuously reduces its generation of hazardous waste. |
Note: Management score represents a company's ability to manage/benefit from certain ESG topics. The scores range from 1 to 3, with 1 being the strongest.
Update Date: 19 Aug 2026
Source: Daiwa, Company
Vanguard International Semiconductor (5347 TT)
Vanguard International Semiconductor
Target price: TWD210.00
Shareprice(7Oct):TWD190.00 | Up/downside:+10.5%
Initiation: fast ramp to capture the AI ripple effect
- Fully loaded through 2027 on AI scaling and fab optimisation
- Fast expansion to capture a paradigm shift in the foundry sector
- Initiating with an Outperform (2) rating and 12M TP of TWD210
Investment case: We initiate coverage of Vanguard International Semiconductor (VIS), a leading specialty foundry, with an Outperform (2) rating and 12-month TP of TWD210. We expect VIS to enjoy fully loaded operations (in terms of wafer-in) through 2027 with pricing power, thanks to a ripple effect as AI demand scales from compute to power, further augmented by TSMC's fab optimisation. Given VIS's historical ties with TSMC, which have strategically helped it advance its business transformation towards value-added specialty foundry offerings, it looks well positioned to benefit from this multi-year AI scaling, cemented by the fast expansion of its first 12' fab in Singapore to capitalise on what we observe as a paradigm shift in the foundry industry.
Fully loaded operations on AI ripple effect. We expect VIS's wafer loadings to approach full levels in terms of wafer-in through 2027, thanks to the AI scaling out and across creating a ripple effect for demand spillover and benefitting specialty foundries. Given its strategic partnership with TSMC, VIS stands to benefit from this multi-year AI build. Despite its pull-in of the 12' ramp, we do not expect such fast expansion to dwarf utilisations since all the planned capacity is sold out, thanks to long-term agreements (LTA) signed with customers amid the supply constraint, which should help VIS manage surging depreciation and minimise margin dilution.
Fast expansion to capture the paradigm shift. To capitalise on the likely paradigm shift in the specialty foundry segment, as detailed in the sector section, driven by TSMC's fab optimisation, VIS is pulling its 12' fab construction in Singapore nearly half a year ahead of schedule. VIS aims to start mass production from 1Q27 after hosting an opening ceremony on 28 September. We expect this fab to reach its first-phase designed capacity of 44,000 wafers per month (wpm) by end-2028, with c.30% of it dedicated to TSMC's wafer interposers and the rest for customers' power semiconductor and embedded flash chips, mainly for AI applications. We forecast VIS to enjoy counter-seasonal quarters through 2027, delivering revenue CAGR of c.30% over 2026-28 for an EPS CAGR of 26%.
Catalysts: 1) Record-breaking monthly revenue run rates through 2027; 2) upbeat guidance for the coming quarters; and 3) margin resilience to ease investors' concerns about depreciation amid the 12' ramp.
Valuation: We derive our 12M TP of TWD210 for VIS by applying our ROE-adjusted PBR target of 5.2x to our one-year-forward BVPS forecast.
Risks: 1) Current chip upcycle ends earlier than expected; and 2) the 12' fab ramp/execution turns out below expectation.
Rick Hsu (886) 2 8758 6261 rick.hsu@daiwacm-cathay.com.tw
Sam Weng (886) 2 8758 6255 sam.weng@daiwacm-cathay.com.tw
| 12-month range | 88.00-220.00 |
|---|---|
| Market cap (USDbn) | 11.22 |
| 3m avg daily turnover (USDm) | 104.83 |
| Shares outstanding (m) | 1,878 |
| Major shareholder | TSMC (18.9%) |
Financial summary (TWD)
| Year to 31 Dec | 26E | 27E | 28E |
|---|---|---|---|
| Revenue (m) | 57,494 | 76,662 | 95,017 |
| Operating profit (m) | 11,742 | 16,893 | 22,282 |
| Net profit (m) | 11,076 | 14,875 | 17,637 |
| Core EPS (fully-diluted) | 5.896 | 7.919 | 9.389 |
| EPS change (%) | 39.2 | 34.3 | 18.6 |
| Daiwa vs Cons. EPS (%) | (1.9) | 5.1 | (2.4) |
| PER (x) | 32.2 | 24.0 | 20.2 |
| Dividend yield (%) | 2.4 | 2.6 | 2.9 |
| DPS | 4.5 | 5.0 | 5.5 |
| PBR (x) | 5.3 | 4.7 | 4.4 |
| EV/EBITDA (x) | 19.0 | 13.1 | 9.7 |
| ROE (%) | 16.8 | 20.8 | 22.6 |
Source: FactSet, Daiwa forecasts
Growth outlook
VIS: quarterly EPS growth trend
VIS's earnings have been volatile due to the cyclical nature of the semiconductor industry in which it operates. That said, barring its hefty growth during 2021-22 as an outlier due to the COVID-inflated chip demand, VIS will enjoy 3070% YoY EPS growth over 2Q26E-4Q27E, according to our forecasts, with strength similar to that in 2016 and 2018. On an annual EPS basis, we forecast a 30% CAGR over 2025-28.
Valuation
Source: Company, Daiwa estimates and forecasts
VIS: 4-quarter-forward PER bands
Trading at 24x on our 4-quarter-forward EPS, the VIS stock is priced at the high end of its post-2009 GFC range of 530x, suggesting a not-so-compelling valuation vs. history. Yet, considering our forecast of a robust 30% EPS CAGR over 2025-28, 24x does not look demanding from a PEG point of view. Valued by our ROE-adjusted PBR target of 5.2x, our 12M TP of TWD210 for VIS translates into a 26x 4-quarter forward PER, which looks reasonable in combination of both PBR and PER methodologies.
Earnings revision
Source: Company, TEJ, Daiwa estimates and forecasts
VIS: consensus EPS forecast revisions
Bloomberg consensus 2026-27 EPS forecasts for VIS have been trending up since February 2026, indicating positive investor sentiment. Our 2027E EPS is 5% above consensus, implying room for further upward revisions from the market to act as an upside catalyst for the stock, in our opinion.
Source: Bloomberg
Financial summary
Key assumptions
| Year to 31 Dec | 2021 | 2022 | 2023 | 2024 | 2025 | 2026E | 2027E | 2028E |
|---|---|---|---|---|---|---|---|---|
| Capacity utilization (%) | 101 | 83 | 59 | 66 | 76 | 85 | 95 | 97 |
| Blended ASP (USD) | 543 | 670 | 629 | 624 | 616 | 637 | 686 | 723 |
| Wafer shipment (8" equ., '000) | 2,901 | 2,605 | 1,952 | 2,194 | 2,533 | 2,838 | 3,492 | 4,109 |
Profit and loss (TWDm)
| Year to 31 Dec | 2021 | 2022 | 2023 | 2024 | 2025 | 2026E | 2027E | 2028E |
|---|---|---|---|---|---|---|---|---|
| Wafer Foundry Revenue | 43,952 | 51,694 | 38,273 | 44,056 | 48,591 | 57,495 | 76,662 | 95,017 |
| Sub & Other Revenue | 0 | 0 | 0 | 0 | 0 | 0 | 0 | 0 |
| Other Revenue | (1) | 1 | (0) | (1) | 0 | (0) | 0 | 0 |
| Total Revenue | 43,951 | 51,694 | 38,273 | 44,055 | 48,591 | 57,494 | 76,662 | 95,017 |
| Other income | 0 | 0 | 0 | 0 | 0 | 0 | 0 | 0 |
| COGS | (24,799) | (27,771) | (27,827) | (32,122) | (34,937) | (38,893) | (51,107) | (62,341) |
| SG&A | (2,899) | (3,375) | (2,521) | (2,740) | (3,691) | (4,164) | (5,197) | (6,170) |
| Other op.expenses | (2,151) | (2,742) | (2,151) | (2,081) | (2,190) | (2,696) | (3,466) | (4,224) |
| Operating profit | 14,102 | 17,807 | 5,774 | 7,111 | 7,773 | 11,742 | 16,893 | 22,282 |
| Net-interest inc./(exp.) | 159 | 588 | 1,536 | 1,754 | 1,554 | 900 | 295 | 445 |
| Assoc/forex/extraord./others | 28 | 457 | 1,524 | (113) | (76) | 206 | 28 | 31 |
| Pre-tax profit | 14,290 | 18,851 | 8,834 | 8,752 | 9,251 | 12,848 | 17,216 | 22,758 |
| Tax | (2,470) | (3,571) | (1,464) | (1,705) | (1,480) | (2,112) | (2,909) | (3,669) |
| Min. int./pref. div./others | 0 | 0 | 0 | 0 | 137 | 341 | 568 | (1,452) |
| Net profit (reported) | 11,820 | 15,280 | 7,370 | 7,047 | 7,908 | 11,076 | 14,875 | 17,637 |
| Net profit (adjusted) | 11,820 | 15,280 | 7,370 | 7,047 | 7,908 | 11,076 | 14,875 | 17,637 |
| EPS (reported)(TWD) | 7.212 | 9.323 | 4.497 | 4.209 | 4.300 | 5.897 | 7.919 | 9.390 |
| EPS (adjusted)(TWD) | 7.212 | 9.323 | 4.497 | 4.209 | 4.300 | 5.897 | 7.919 | 9.390 |
| EPS (adjusted fully-diluted)(TWD) | 7.212 | 9.323 | 4.497 | 3.795 | 4.235 | 5.896 | 7.919 | 9.389 |
| DPS (TWD) | 3.500 | 4.500 | 4.500 | 4.405 | 4.568 | 4.500 | 5.000 | 5.510 |
| EBIT | 14,102 | 17,807 | 5,774 | 7,111 | 7,773 | 11,742 | 16,893 | 22,282 |
| EBITDA | 18,086 | 23,349 | 13,626 | 15,733 | 16,325 | 21,006 | 31,121 | 41,235 |
Cash flow (TWDm)
| Year to 31 Dec | 2021 | 2022 | 2023 | 2024 | 2025 | 2026E | 2027E | 2028E |
|---|---|---|---|---|---|---|---|---|
| Profit before tax | 14,290 | 18,851 | 8,834 | 8,752 | 9,251 | 12,848 | 17,216 | 22,758 |
| Depreciation and amortisation | 3,984 | 5,542 | 7,852 | 8,622 | 8,552 | 9,264 | 14,228 | 18,953 |
| Tax paid | (2,470) | (3,571) | (1,464) | (1,705) | (1,480) | (2,112) | (2,909) | (3,669) |
| Change in working capital | (4,449) | 2,285 | (1,385) | (1,958) | (2,465) | (2,250) | (5,500) | (1,300) |
| Other operational CF items | 9,883 | 10,819 | (5,205) | 11,020 | 11,581 | 9,341 | 5,568 | 3,548 |
| Cash flow from operations | 21,237 | 33,927 | 8,632 | 24,731 | 25,439 | 27,091 | 28,603 | 40,290 |
| Capex | (13,280) | (18,723) | (6,779) | (15,922) | (63,265) | (65,177) | (33,920) | (17,920) |
| Net (acquisitions)/disposals | (113) | (4,709) | (1,626) | 4,357 | 1,183 | 82 | 0 | 0 |
| Other investing CF items | (28) | (771) | 46 | (133) | 2,372 | 0 | 0 | 0 |
| Cash flow from investing | (13,420) | (24,204) | (8,360) | (11,699) | (59,711) | (65,095) | (33,920) | (17,920) |
| Change in debt | 2,718 | 6,991 | 5,993 | 2,996 | 7,519 | 5,961 | 2,982 | (5,155) |
| Net share issues/(repurchases) | 0 | 0 | 0 | 17,593 | 0 | 0 | 0 | 0 |
| Dividends paid | (5,736) | (7,375) | (7,375) | (7,375) | (8,400) | (8,453) | (9,393) | (10,351) |
| Other financing CF items | 2,232 | 4,557 | 24 | 4,316 | 14,341 | 17,598 | 10,176 | 0 |
| Cash flow from financing | (786) | 4,173 | (1,359) | 17,530 | 13,460 | 15,106 | 3,766 | (15,506) |
| Forex effect/others | (63) | 575 | 72 | 291 | (249) | 0 | 0 | 0 |
| Change in cash | 6,968 | 14,471 | (1,015) | 30,853 | (21,060) | (22,899) | (1,551) | 6,864 |
| Free cash flow | 7,958 | 15,203 | 1,852 | 8,809 | (37,826) | (38,086) | (5,317) | 22,370 |
Source: FactSet, Daiwa forecasts
Financial summary continued …
Balance sheet (TWDm)
| Year to 31 Dec | 2021 | 2022 | 2023 | 2024 | 2025 | 2026E | 2027E | 2028E |
|---|---|---|---|---|---|---|---|---|
| Cash & short-term investment | 20,173 | 34,843 | 38,050 | 66,749 | 41,716 | 18,736 | 17,185 | 24,049 |
| Inventory | 4,030 | 5,880 | 5,672 | 6,221 | 6,937 | 6,937 | 10,437 | 9,937 |
| Accounts receivable | 9,452 | 4,962 | 5,523 | 6,235 | 6,748 | 8,948 | 11,948 | 13,948 |
| Other current assets | 533 | 570 | 834 | 7,007 | 11,496 | 10,000 | 10,000 | 11,000 |
| Total current assets | 34,188 | 46,255 | 50,079 | 86,211 | 66,897 | 44,621 | 49,570 | 58,934 |
| Fixed assets | 23,541 | 38,504 | 36,604 | 44,141 | 113,869 | 156,754 | 166,580 | 157,390 |
| Goodwill & intangibles | 3,361 | 6,382 | 6,771 | 10,905 | 10,282 | 7,000 | 7,500 | 8,000 |
| Other non-current assets | 4,458 | 9,798 | 8,997 | 7,448 | 9,420 | 9,420 | 9,420 | 9,420 |
| Total assets | 65,548 | 100,940 | 102,450 | 148,706 | 200,469 | 217,795 | 233,070 | 233,744 |
| Short-term debt | 0 | 0 | 0 | 0 | 10,520 | 9,039 | 17,176 | 16,042 |
| Accounts payable | 1,437 | 1,376 | 972 | 1,416 | 1,724 | 1,674 | 2,674 | 2,874 |
| Other current liabilities | 13,539 | 19,717 | 19,135 | 19,959 | 39,361 | 37,828 | 36,619 | 31,986 |
| Total current liabilities | 14,976 | 21,093 | 20,107 | 21,375 | 51,604 | 48,541 | 56,469 | 50,902 |
| Long-term debt | 4,993 | 11,987 | 17,983 | 20,984 | 15,990 | 23,432 | 18,277 | 14,256 |
| Other non-current liabilities | 10,413 | 22,509 | 18,646 | 37,679 | 49,285 | 49,285 | 49,285 | 49,285 |
| Total liabilities | 30,382 | 55,589 | 56,737 | 80,039 | 116,879 | 121,258 | 124,031 | 114,443 |
| Share capital | 16,390 | 16,390 | 16,390 | 18,666 | 18,671 | 18,783 | 18,783 | 18,783 |
| Reserves/R.E./others | 18,776 | 28,961 | 29,323 | 45,438 | 45,206 | 49,042 | 56,544 | 61,806 |
| Shareholders' equity | 35,165 | 45,351 | 45,713 | 64,104 | 63,877 | 67,825 | 75,327 | 80,589 |
| Minority interests | 0 | 0 | 0 | 4,563 | 19,713 | 28,713 | 33,713 | 38,713 |
| Total equity & liabilities | 65,548 | 100,940 | 102,450 | 148,706 | 200,469 | 217,795 | 233,070 | 233,744 |
| EV | 341,705 | 334,029 | 336,818 | 315,682 | 361,390 | 399,332 | 408,866 | 401,846 |
| Net debt/(cash) | (15,180) | (22,855) | (20,066) | (45,765) | (15,207) | 13,735 | 18,268 | 6,249 |
| BVPS (TWD) | 21.456 | 27.670 | 27.891 | 34.342 | 34.212 | 36.109 | 40.103 | 42.904 |
Key ratios (%)
| Year to 31 Dec | 2021 | 2022 | 2023 | 2024 | 2025 | 2026E | 2027E | 2028E |
|---|---|---|---|---|---|---|---|---|
| Sales (YoY) | 32.7 | 17.6 | (26.0) | 15.1 | 10.3 | 18.3 | 33.3 | 23.9 |
| EBITDA (YoY) | 65.7 | 29.1 | (41.6) | 15.5 | 3.8 | 28.7 | 48.2 | 32.5 |
| Operating profit (YoY) | 90.1 | 26.3 | (67.6) | 23.2 | 9.3 | 51.1 | 43.9 | 31.9 |
| Net profit (YoY) | 87.4 | 29.3 | (51.8) | (4.4) | 12.2 | 40.1 | 34.3 | 18.6 |
| Core EPS (fully-diluted) (YoY) | 87.4 | 29.3 | (51.8) | (15.6) | 11.6 | 39.2 | 34.3 | 18.6 |
| Gross-profit margin | 43.6 | 46.3 | 27.3 | 27.1 | 28.1 | 32.4 | 33.3 | 34.4 |
| EBITDA margin | 41.2 | 45.2 | 35.6 | 35.7 | 33.6 | 36.5 | 40.6 | 43.4 |
| Operating-profit margin | 32.1 | 34.4 | 15.1 | 16.1 | 16.0 | 20.4 | 22.0 | 23.5 |
| Net profit margin | 26.9 | 29.6 | 19.3 | 16.0 | 16.3 | 19.3 | 19.4 | 18.6 |
| ROAE | 36.5 | 38.0 | 16.2 | 12.8 | 12.4 | 16.8 | 20.8 | 22.6 |
| ROAA | 21.6 | 18.4 | 7.2 | 5.6 | 4.5 | 5.3 | 6.6 | 7.6 |
| ROCE | 39.2 | 36.5 | 9.5 | 9.3 | 7.8 | 9.8 | 12.4 | 15.2 |
| ROIC | 60.1 | 68.0 | 20.0 | 23.6 | 14.3 | 11.0 | 11.8 | 14.8 |
| Net debt to equity | n.a. | n.a. | n.a. | n.a. | n.a. | 20.3 | 24.3 | 7.8 |
| Effective tax rate | 17.3 | 18.9 | 16.6 | 19.5 | 16.0 | 16.4 | 16.9 | 16.1 |
| Accounts receivable (days) | 63.1 | 50.9 | 50.0 | 48.7 | 48.8 | 49.8 | 49.7 | 49.7 |
| Current ratio (x) | 2.3 | 2.2 | 2.5 | 4.0 | 1.3 | 0.9 | 0.9 | 1.2 |
| Net interest cover (x) | n.a. | n.a. | n.a. | n.a. | n.a. | n.a. | n.a. | n.a. |
| Net dividend payout | 91.0 | 62.4 | 48.3 | 100.1 | 119.2 | 106.9 | 84.8 | 69.6 |
| Free cash flow yield | 2.2 | 4.3 | 0.5 | 2.5 | n.a. | n.a. | n.a. | 6.3 |
Source: FactSet, Daiwa forecasts
Company profile
Founded in December 1994 and listed in March 1998, Vanguard International Semiconductor Corp. (VIS) successfully transformed its business model from memory to a complementary metal-oxidesemiconductor (CMOS) logic foundry focused on specialty technologies such as mixed-signal, power analog and embedded memory, becoming one of the world's leading specialty foundries. Leveraging its strategic relationship with major shareholder TSMC, VIS operates wafer fabs in Taiwan and Singapore, serving a wide variety of customers, including fabless chipmakers and IDMs globally.
Initiating on VIS with an Outperform (2) rating and 12M TP of TWD210
Despite suffering from the post-COVID inventory correction …
… VIS has benefitted from AI scaling and is further …
Fast ramp to capture AI ripple effect
We initiate coverage of VIS with an Outperform (2) rating and 12M TP of TWD210. Founded in December 1994, headquartered in Hsinchu Science Park and listed in March 1998 (see Appendix 1 for more details on the company), VIS looks set to enjoy fully loaded operations (in terms of wafer-in) through 2027, with sustained pricing power, thanks to the ripple effect of AI demand scaling from compute to connectivity and power, further augmented by TSMC's fab optimisation.
Given its longstanding ties with TSMC, which currently holds a c.19% stake in VIS and has strategically helped it advance its business transformation by moving up value verticals of specialty-foundry offerings to differentiate itself in the competitive specialty foundry market, VIS looks set to benefit from this multi-year AI scaling, among peers. The fast expansion of its first 12' fab in Singapore should help cement the AI business and capitalise on what we observe as a paradigm shift in the foundry industry, as mentioned in the main section of this report.
Fully loaded operations on AI ripple effect
Like many other semiconductor foundries, VIS enjoyed unusual pricing power during the COVID period as the virus, together with geopolitical tensions between China and the US, inflated chip demand across virtually all product applications to an unprecedented level. Consequently, the industry suffered from an unprecedented 2-year downturn on a prolonged inventory correction, if excluding the AI build that has helped rescue the advanced foundry segment, save the village (ie, the chip industry) and bring the global chip cycle back on its historical track of an average of a one-year downturn. This downturn caused choppy operations for many second-tier foundries which focused initially on the non-AI space over 2022-25, including VIS (see our series of Technology Outlook reports: 2023: V-shape, U-shape or double dip?, 2024: The dragon is ready to soar, 2025: likely longer and stronger).
Starting from 2H25, after the AI builds scaled out and across from compute into memory to connectivity and power, creating a ripple effect in demand that benefits not only advanced but also specialty foundries, we expect VIS's wafer loadings to approach full levels through 2027 (in terms of wafer-in), despite its fast 12' expansion. With its parent company TSMC's strategic partnership, VIS stands at a strong position to benefit from this multi-year AI scaling, in our view. To maximise the AI business potential, VIS is accelerating its first 12' fab in Singapore via a JV named VisionPower Semiconductor Manufacturing Corp (VSMC), with phase-one investment of USD6.8bn where, in terms of registered capital of USD4bn, VIS assumes USD2.4bn for a 60% stake, while NXP assumes USD1.6bn for a 40% stake.
In terms of the total investment on a cash basis, VIS will chip in only USD1.0bn, with USD2.8bn coming from NXP and USD1.1bn from TSMC with some equipment consignment, while the rest will come from other customer prepayments, loans and a subsidy from the Singapore government. Upon VSMC's completion, this will bring VIS a total of 6 fabs, with combined capacity reaching up to c.380,000 8'-equivalent wafers per month (wpm) by end-2028, based on our forecasts (see table on next page for details of our key business assumptions).
VIS: key business assumptions and cost analysis
| ('000 wpm*) | 1Q26 | 2Q26 | 3Q26E | 4Q26E | 1Q27E | 2Q27E | 3Q27E | 4Q27E | 1Q28E | 2Q28E | 3Q28E | 4Q28E |
|---|---|---|---|---|---|---|---|---|---|---|---|---|
| Capacity | ||||||||||||
| Fab 1 (8") | 77 | 80 | 80 | 80 | 78 | 80 | 80 | 80 | 78 | 80 | 80 | 80 |
| Fab 2 (8") | 67 | 70 | 70 | 70 | 68 | 70 | 70 | 70 | 68 | 70 | 70 | 70 |
| Fab 3 (8") | 48 | 50 | 50 | 50 | 48 | 50 | 50 | 50 | 48 | 50 | 50 | 50 |
| Fab VS1 (8") | 38 | 40 | 40 | 40 | 39 | 40 | 40 | 40 | 39 | 40 | 40 | 40 |
| Fab 5 (8") | 38 | 40 | 40 | 40 | 39 | 40 | 40 | 40 | 39 | 40 | 40 | 40 |
| Fab VSMC (12") | 0 | 0 | 0 | 0 | 2 | 10 | 18 | 20 | 22 | 30 | 40 | 44 |
| Total capacity (8" equ) | 268 | 280 | 280 | 280 | 278 | 303 | 320 | 325 | 322 | 348 | 369 | 379 |
| Shipment | ||||||||||||
| Quarterly shipment (8" equ) | 642 | 713 | 734 | 749 | 757 | 855 | 940 | 940 | 931 | 1,043 | 1,095 | 1,040 |
| Capacity utilisation** | 80% | 85% | 87% | 89% | 91% | 94% | 98% | 96% | 96% | 100% | 99% | 91% |
| Blended ASP (USD) | 618 | 632 | 645 | 649 | 650 | 685 | 697 | 704 | 704 | 719 | 739 | 726 |
| Revenue | ||||||||||||
| Revenue (USDm) | 397 | 451 | 474 | 486 | 492 | 586 | 656 | 662 | 655 | 750 | 809 | 755 |
| Revenue (TWDm) | 12,532 | 14,245 | 15,160 | 15,558 | 15,737 | 18,753 | 20,983 | 21,189 | 20,975 | 24,003 | 25,876 | 24,164 |
| Mix by node | ||||||||||||
| 0.5u+ | 12% | 12% | 12% | 12% | 12% | 11% | 11% | 11% | 11% | 11% | 10% | 10% |
| 0.35u | 13% | 12% | 12% | 12% | 12% | 11% | 11% | 10% | 11% | 10% | 9% | 9% |
| 0.25u | 15% | 16% | 16% | 16% | 16% | 14% | 12% | 12% | 12% | 11% | 10% | 10% |
| 0.18/0.15u | 15% | 15% | 15% | 15% | 15% | 14% | 13% | 12% | 12% | 11% | 10% | 10% |
| 0.13/0.11u | 45% | 46% | 45% | 44% | 45% | 41% | 38% | 37% | 36% | 33% | 30% | 30% |
| <=90nm | 0% | 0% | 0% | 0% | 0% | 9% | 15% | 18% | 18% | 25% | 32% | 32% |
| Cost structure | ||||||||||||
| Direct materials | 1,724 | 1,916 | 1,998 | 2,037 | 2,058 | 2,325 | 2,558 | 2,558 | 2,532 | 2,836 | 2,978 | 2,829 |
| Direct labour | 1,136 | 1,240 | 1,293 | 1,318 | 1,332 | 1,505 | 1,655 | 1,655 | 1,639 | 1,835 | 1,927 | 1,831 |
| Depreciation & amortisation | 2,192 | 2,227 | 2,340 | 2,505 | 2,600 | 3,300 | 4,000 | 4,328 | 4,400 | 4,600 | 5,000 | 4,953 |
| Other overheads | 3,810 | 4,258 | 4,418 | 4,482 | 4,600 | 5,198 | 5,718 | 5,718 | 5,661 | 6,340 | 6,657 | 6,324 |
| Total COGS (TWDm) | 8,861 | 9,640 | 10,048 | 10,344 | 10,589 | 12,328 | 13,931 | 14,259 | 14,231 | 15,611 | 16,562 | 15,937 |
| Mix by element | ||||||||||||
| Direct materials | 19% | 20% | 20% | 20% | 19% | 19% | 18% | 18% | 18% | 18% | 18% | 18% |
| Direct labour | 13% | 13% | 13% | 13% | 13% | 12% | 12% | 12% | 12% | 12% | 12% | 11% |
| Depreciation & amortisation | 25% | 23% | 23% | 24% | 25% | 27% | 29% | 30% | 31% | 29% | 30% | 31% |
| Other overheads | 43% | 44% | 44% | 43% | 43% | 42% | 41% | 40% | 40% | 41% | 40% | 40% |
| Gross profit (TWDm) | 3,671 | 4,604 | 5,112 | 5,214 | 5,148 | 6,425 | 7,052 | 6,930 | 6,743 | 8,391 | 9,314 | 8,227 |
| Gross margin | 29% | 32% | 34% | 34% | 33% | 34% | 34% | 33% | 32% | 35% | 36% | 34% |
Source: Company, Daiwa estimates and forecasts
Note: * wpm = wafers per month on average; ** based on shipment divided by installed capacity, not wafer-in
Fast expansion to capture the paradigm shift
On top of the AI scaling creating a ripple effect for demand spillover, such strength looks to be further augmented by TSMC's fab optimisation, as assessed in the main section of this report. To capitalise on the likely paradigm shift in the specialty foundry segment by TSMC's fab optimisation, VIS is pulling in its first 12' fab construction around half a year ahead of schedule, aiming to start mass production from 1Q27 after it hosted an opening ceremony on 28 September.
Registered under VSMC, we expect this fab to reach its first-phase designed capacity of 44,000 wpm by end-2028, subject to market dynamics. c.30% of the fab's capacity will be dedicated to TSMC's wafer production of silicon interposers handling chip-on-wafer-onsubstrate (CoWoS) advanced packaging, which has seen meaningful supply constraint due to strong AI high-performance compute (HPC) demand. The rest of the capacity is for other customers' power semiconductors (such as mixed-signal, analog and PMIC) and embedded flash, focusing on AI scaling and automotive and industrial (A&I) applications.
Despite the 12' expansion pull-in, we do not expect the ramp to dwarf capacity utilisations since all the planned capacity is already sold out, thanks to the long-term agreements (LTA) signed with customers amid the supply constraints, which should help VIS manage surging depreciation and minimise margin dilution for financial resilience. Although this 12' fab has little to do with TSMC's 28/22/20nm fab optimisation addressed in the main section, since it covers only process nodes ranging from 0.13u to 40nm and thus enjoys only the 65/55nm wafer interposer spillover from TSMC, on our market research, we see possibilities for TSMC to shut down more legacy 12' fabs in the future. We believe this may incentivise VIS to speed up its second 12' fab construction in Singapore, namely the phase-two, or VSMC Fab 2, for 40,000-50,000 wpm capacity beyond 2028 and is scalable to 28nm-and-below and even the finFET (FF) process nodes.
… speeding up its 12' expansion to maximise the AI potential
VIS could speed up phase-two 12' expansion under TSMC's continued effort of fab optimisation
77% of revenue was from PMIC in 2Q26, with customers across Taiwan, China, Japan, Europe, and the US
High variety of customer base across D/D and PMIC
Financial forecasts
In the near term, we expect VIS to enjoy counter-seasonal quarters through 2027, thanks to the ripple effect of AI scaling on wafer loadings and pricing power. We estimate that VIS earned 3Q26 EPS of TWD1.57, in line with the Bloomberg consensus estimate. For 4Q26, we are behind consensus since 1) we expect a diminished effect of price hikes after our estimated 2-3% QoQ EPS increases in 3Q26; and 2) we do not expect the 12' contribution to ramp that soon. In the long term, we forecast VIS to deliver a revenue CAGR of nearly 30% over 2026-28 for an EPS CAGR of 26%.
Revenue and customers
As of 2Q26, power management IC (PMIC) accounted for the majority of revenue (77%; see chart on next page), on a rising trend from 40% a decade ago thanks to the co-efforts between VIS and TSMC strategically transforming the former's business up the value verticals from logic commodity display drivers (D/D) for consumer electronics devices to power discrete, analog, and PMIC for not only consumer but A&I applications. Riding on the escalating trend of demand for advanced high-V PMIC accommodating AI servers and power infrastructure under the AI cycle, we expect the PMIC revenue contribution to rise further over our forecast period, while the D/D contribution will drop to c.10%-plus for baseline customer demand support.
As of 2Q26, VIS found 16%, 16%, and 46% of revenue from major process nodes of 0.25u, 0.18u, and 0.13u-and-below, respectively, on our estimates. Since the VSMC fab will focus on 0.13u all the way to 40nm, and TSMC's wafer interposers will take c.30% of the capacity ramp on our estimates focusing on 65/55nm, we expect the 0.13u-and-below to increase to more than 60% of revenue over our forecast period. Both the PMIC and node advances should be blended ASP and margin accretive, helping mitigate the depreciation burden associated with the VSMC fab ramp. Illustrated in a chart on the next page, we expect VIS's blended ASP to trend upward from c.USD630 in 2Q26, rising by 15% QoQ through our forecast period to exceed USD700 by 2028.
VIS services a high variety of customers around the world, including most fabless chipmakers in Taiwan and mainland China focusing on the D/D, power MOSFET and PMIC, and most integrated device manufacturers (IDM) across Japan, Europe and the US focusing on power semiconductor foundry works.
VIS: 3Q26 results preview and 4Q26 business outlook
| (in TWDm) | 3Q26E 4Q26E - Daiwa | 3Q26E 4Q26E - Consensus | 3Q26E 4Q26E - Variance | 3Q26E 4Q26E - Daiwa | 3Q26E 4Q26E - Consensus | 3Q26E 4Q26E - Variance |
|---|---|---|---|---|---|---|
| Revenue | 15,160 | 15,369 | -1% | 15,558 | 16,302 | -5% |
| Gross profit | 5,112 | 5,214 | ||||
| Operating profit | 3,369 | 3,386 | ||||
| Pretax profit | 3,569 | 3,529 | ||||
| Net profit | 2,944 | 2,983 | -1% | 2,911 | 3,255 | -11% |
| Adjusted EPS (TWD) | 1.57 | 1.59 | -1% | 1.55 | 1.73 | -11% |
| Margins | ||||||
| Gross | 33.7% | 33.5% | ||||
| Operating | 22.2% | 21.8% | ||||
| Net | 19.4% | 18.7% | ||||
| Operation | ||||||
| Shipment (12" equ. wafers) ('000 units) | 734 | 749 | ||||
| Utilisation* | 87% | 89% | ||||
| <=0.13u sales contribution | 45% | 44% |
Source: Bloomberg, Daiwa estimates and forecasts
Note: * Calculated as wafer shipment divided by capacity
VIS: key operating assumptions, quarterly P&L estimates and forecasts
| TWDm | 1Q26 | 2Q26 | 3Q26E | 4Q26E | 1Q27E | 2Q27E | 3Q27E | 4Q27E | 2025 | 2026E | 2027E | 2028E |
|---|---|---|---|---|---|---|---|---|---|---|---|---|
| Wafer shipment (8" equ) ('000 units) | 642 | 713 | 734 | 749 | 757 | 855 | 940 | 940 | 2,533 | 2,838 | 3,492 | 4,109 |
| Capacity utilisation | 80% | 85% | 87% | 89% | 91% | 94% | 98% | 96% | 76% | 85% | 95% | 97% |
| Blended ASP (USD) | 618 | 632 | 645 | 649 | 650 | 685 | 697 | 704 | 616 | 637 | 686 | 723 |
| Foundry revenue (USDm) | 397 | 451 | 474 | 486 | 492 | 586 | 656 | 662 | 1,560 | 1,807 | 2,396 | 2,969 |
| Total revenue | 12,532 | 14,245 | 15,160 | 15,558 | 15,737 | 18,753 | 20,983 | 21,189 | 48,591 | 57,494 | 76,662 | 95,017 |
| COGS | -8,861 | -9,640 | -10,048 | -10,344 | -10,589 | -12,328 | -13,931 | -14,259 | -34,937 | -38,893 | -51,107 | -62,341 |
| Gross profit | 3,671 | 4,604 | 5,112 | 5,214 | 5,148 | 6,425 | 7,052 | 6,930 | 13,654 | 18,602 | 25,555 | 32,676 |
| Opex | -1,584 | -1,704 | -1,743 | -1,828 | -1,857 | -2,082 | -2,329 | -2,394 | -5,880 | -6,859 | -8,662 | -10,394 |
| Operating profit | 2,087 | 2,901 | 3,369 | 3,386 | 3,291 | 4,343 | 4,723 | 4,536 | 7,773 | 11,742 | 16,893 | 22,282 |
| EBITDA | 4,278 | 5,128 | 5,709 | 5,891 | 5,891 | 7,643 | 8,723 | 8,864 | 16,325 | 21,006 | 31,121 | 41,235 |
| Non-op gain/loss | 350 | 412 | 200 | 143 | 120 | 118 | 30 | 35 | 1,477 | 1,106 | 303 | 521 |
| Pretax profit | 2,437 | 3,313 | 3,569 | 3,529 | 3,411 | 4,461 | 4,753 | 4,571 | 9,251 | 12,848 | 17,196 | 22,803 |
| Income taxes & MI | -190 | -339 | -625 | -618 | -324 | -618 | -686 | -692 | -1,343 | -1,771 | -2,320 | -5,167 |
| Net profit | 2,246 | 2,975 | 2,944 | 2,911 | 3,087 | 3,843 | 4,067 | 3,879 | 7,908 | 11,076 | 14,876 | 17,636 |
| FD O/S (m) | 1,880 | 1,879 | 1,879 | 1,879 | 1,879 | 1,879 | 1,879 | 1,879 | 1,867 | 1,879 | 1,879 | 1,879 |
| FD EPS (TWD) | 1.19 | 1.58 | 1.57 | 1.55 | 1.64 | 2.05 | 2.16 | 2.06 | 4.24 | 5.90 | 7.92 | 9.39 |
| Margins | ||||||||||||
| Gross | 29% | 32% | 34% | 34% | 33% | 34% | 34% | 33% | 28% | 32% | 33% | 34% |
| Operating | 17% | 20% | 22% | 22% | 21% | 23% | 23% | 21% | 16% | 20% | 22% | 23% |
| EBITDA | 34% | 36% | 38% | 38% | 37% | 41% | 42% | 42% | 34% | 37% | 41% | 43% |
| Net | 18% | 21% | 19% | 19% | 20% | 20% | 19% | 18% | 16% | 19% | 19% | 19% |
| Growth (QoQ) | ||||||||||||
| Total revenue | 0% | 14% | 6% | 3% | 1% | 19% | 12% | 1% | ||||
| Gross profit | 6% | 25% | 11% | 2% | -1% | 25% | 10% | -2% | ||||
| Operating profit | 15% | 39% | 16% | 1% | -3% | 32% | 9% | -4% | ||||
| EBITDA | 6% | 20% | 11% | 3% | 0% | 30% | 14% | 2% | ||||
| Net profit | 29% | 32% | -1% | -1% | 6% | 24% | 6% | -5% | ||||
| FD EPS | 28% | 33% | -1% | -1% | 6% | 24% | 6% | -5% | ||||
| Growth (YoY) | ||||||||||||
| Total revenue | 5% | 22% | 23% | 24% | 26% | 32% | 38% | 36% | 10% | 18% | 33% | 24% |
| Gross profit | 2% | 40% | 54% | 50% | 40% | 40% | 38% | 33% | 14% | 36% | 37% | 28% |
| Operating profit | -7% | 53% | 84% | 87% | 58% | 50% | 40% | 34% | 9% | 51% | 44% | 32% |
| EBITDA | 0% | 29% | 41% | 46% | 38% | 49% | 53% | 50% | 4% | 29% | 48% | 32% |
| Net profit | -7% | 46% | 73% | 67% | 37% | 29% | 38% | 33% | 12% | 40% | 34% | 19% |
| FD EPS | -8% | 44% | 71% | 66% | 38% | 29% | 38% | 33% | 12% | 39% | 34% | 19% |
Source: Company, Daiwa estimates and forecasts
Source: Company
Note: * D/D = display driver, PMIC = power management IC, others include LED driver, embedded memory, CMOS image sensor, etc.
VIS: capex and capital intensity trend*
Source: Company
Note: * <=0.18u including 0.18u, 0.15u, 0.13u and 0.11u
VIS: depreciation and amortisation trend
Source: Company, Daiwa forecasts
Note: * Capital intensity = capex divided by revenue
Source: Company, Daiwa forecasts
We forecast GM to stall at 32-34% over 2Q261Q28 and then pick up afterwards
We forecast MI expense to begin to dilute parent income from 2Q28
Cost analysis
Over the past decades, VIS's cost structure has fluctuated in fixed overheads (mainly D&A) from time to time, depending on its fab acquisitions, varying from 10% to 30% of COGS (refer back to the key assumption table). Given VSMC is about to ramp in production with a total capex of USD6.8bn for phase one, or roughly 2x VIS's 2025-26E aggregate revenue, we expect the D&A portion to return to the 30% level over our forecast period, acting as a margin dilutor. Yet with VIS's capex budget of TWD60-70bn (c.USD2bn) this year, we expect the capex to largely subside from 2027 for the depreciation cycle to peak in 2029. As a result, we forecast its D&A in absolute terms to rise by 54% YoY in 2027 to TWD14bn and 33% YoY in 2028 to nearly TWD19bn, with gross margin (GM) stalling at 32-34% over 2Q26-1Q28, then picking up to 35% or higher in 2H28 and likely rising further after the depreciation comes off the cycle into 2029.
Minority interest
Minority interest (MI), or non-controlling interest as stated by VIS, kicked in from 1Q25 and rose to 2.4% of pretax income in 2Q26 due to preparation for the VSMC investment. We forecast the MI to rise to TWD341m this year (TWD137m in 2025), TWD568m in 2027 and TWD1.45bn in 2028, mainly from the 40% MI owned by NXP as VIS ramps the 12' fab investment in Singapore. As illustrated in a table below, we forecast VSMC to record revenue of nearly TWD9bn in 2027 and TWD26bn in 2028 for operating loss of TWD1.4bn and operating profit of TWD3.6bn, respectively, on the basis of a standalone operating entity.
Dividend policy
We expect c.80% payout ratio subject to capex requirement Over the past decade, VIS has stepped up its dividend payout ratios from 50% in 2011 to more than 100% this year. We expect the company to keep the ratios at c.80% over our forecast period, subject to the AI development which should determine the capex requirement for the VSMC investment, affecting its FCF generating power. VIS paid a TWD4.5/share cash dividend this year (against last year's earnings), and we forecast it to pay TWD5.0/share for 2027 with a payout ratio of 85% against this year's earnings for a 2.7% yield based on the closing price as of 5 October.
VIS: dividend trend and payout ratio*
Source: Company, Daiwa estimates and forecasts
Note: * against previous year's P&L
VSMC: standalone P&L at core operation
| 1Q27E | 2Q27E | 3Q27E | 4Q27E | 1Q28E | 2Q28E | 3Q28E | 4Q28E | |
|---|---|---|---|---|---|---|---|---|
| Wafer shipments (8" equ) ('000 units) | 2 | 55 | 100 | 120 | 121 | 188 | 255 | 245 |
| Blended ASP (USD; 8" equ) | 1,000 | 1,000 | 1,000 | 1,000 | 1,000 | 1,000 | 1,000 | 980 |
| Revenue (USDm) | 2 | 55 | 100 | 120 | 121 | 188 | 255 | 240 |
| Revenue (TWDm) | 50 | 1,758 | 3,213 | 3,853 | 3,872 | 6,007 | 8,156 | 7,687 |
| COGS (TWDm) | (497) | (1,540) | (2,820) | (3,373) | (3,518) | (4,702) | (5,699) | (5,725) |
| Opex (TWDm) | (450) | (457) | (578) | (578) | (581) | (601) | (652) | (615) |
| Operating profit (TWDm) | (896) | (239) | (185) | (98) | (226) | 704 | 1,804 | 1,347 |
| MI against parent P&L (TWDm) | (359) | (96) | (74) | (39) | (91) | 282 | 722 | 539 |
| MI as % of VIS's pre-tax profit | 11% | 2% | 2% | 1% | 2% | -5% | -11% | -10% |
Source: Daiwa estimates and forecasts
Source: Daiwa estimates and forecasts
Note: * Blended basis in 8' equivalent
Source: Company, Daiwa forecasts
We set our 12M TP for VIS at TWD210, based on an ROE-adjusted PBR target of 5.2x
ROE comparison: VIS vs. TSMC
Source: Company, Daiwa forecasts
Asian foundry: valuation panel
| Stock | Ticker | Price - (LC)* | Daiwa - rating | PER (x) - 2025 | PER (x) - 2026E | PER (x) - 2027E | PBR (x) - 2025 | PBR (x) - 2026E | PBR (x) - 2027E | ROE (%) - 2025 | ROE (%) - 2026E | ROE (%) - 2027E | Earnings growth (%) - 2025 | Earnings growth (%) - 2026E | Earnings growth (%) - 2027E |
|---|---|---|---|---|---|---|---|---|---|---|---|---|---|---|---|
| TSMC | 2330 TT | 2,585.0 | Buy (1) | 39.0 | 23.6 | 19.2 | 12.4 | 8.5 | 6.3 | 35.4 | 42.8 | 37.6 | 46.4 | 65.5 | 22.9 |
| HHGrace | 1347 HK | 105.3 | Buy (1) | n.m. | 126.5 | 87.2 | 3.5 | 3.4 | 3.3 | 0.9 | 2.7 | 3.9 | -5.6 | 235.5 | 45.2 |
| VIS | 5347 TT | 190.0 | Outperform (2) | 44.9 | 32.2 | 24.0 | 5.6 | 5.3 | 4.7 | 12.4 | 16.8 | 20.8 | 12.2 | 40.1 | 34.3 |
| UMC | 2303 TT | 148.5 | Hold (3) | 44.8 | 20.6 | 20.9 | 4.9 | 4.8 | 4.4 | 11.0 | 23.6 | 21.8 | -11.6 | 117.7 | -1.7 |
| SMIC | 981 HK | 60.90 | Sell (5) | 75.5 | 44.4 | 38.1 | 1.8 | 1.7 | 1.6 | 4.0 | 6.6 | 7.1 | 115.3 | 71.9 | 16.6 |
| GlobalFoundries | GFS US | 48.07 | Not rated | 21.9 | 24.6 | 18.6 | 1.6 | 2.2 | 2.0 | 7.8 | 8.3 | 10.9 | 10.3 | 13.5 | 32.8 |
| Average | 45.2 | 45.3 | 34.7 | 5.0 | 4.3 | 3.8 | 11.9 | 16.8 | 16.9 | 26.2 | 89.7 | 20.4 |
Source: Companies, Bloomberg, Daiwa forecasts
Note: * Local currency based on closing prices as of 7 October 2026
Source: Company, Daiwa forecasts
Cashflow and gearing
Given its hefty capex over 2025-27E, we expect VIS's free cashflow (FCF) to turn negative during the same period. Foreseeing the cash gap, VIS issued new shares of 228m in 2024 for a 12% per-share dilution and collected TWD17.6bn. It further issued ECBs in February this year to collect nearly TWD11bn; therefore, we forecast its debt-to-equity (D/E) ratio to approach 170% in 2026. Yet with the VSMC ramp in profitability for operating cash inflow, we forecast the FCF to turn positive in 2028, helping lower the gearing to c.140%.
Valuation and risk
We employ an ROE-adjusted PBR methodology to value the foundry stocks under our coverage, where we compare a foundry's projected ROE with its historical ROE average, work out a premium or discount, and apply it to the foundry's historical average PBR for our ROE-adjusted PBR target. Given TSMC is VIS's strategic partner, we tweak our methodology a bit by anchoring VIS's ROE-adjusted PBR to TSMC's, where we compare their long-term ROE projections (2004-28E), work out a discount of 33% and then apply the discount to our 7.7x target PBR for TSMC, resulting in our target PBR of 5.2x and 12M TP of TWD210 for VIS on our one-year forward BVPS forecast.
Key downside risks to our call would be: 1) the current chip upcycle ends earlier than expected; and 2) VSMC's 12' fab ramp/execution comes in below expectation.
Commanding 1.1% market share, VIS is a leading specialty foundry in the world
We expect VIS to outgrow the global foundry market (exTSMC) over 2026-28
VIS has 5 fabs in operations, with its first 12' fab slated for massproduction from 1Q27
Appendix: company profile
Founded in December 1994 with headquarters located in Hsinchu Science Park and shares listed in March 1998, Vanguard International Semiconductor (VIS) is a leading specialty foundry in the world focusing on mix signal, power semiconductor and embedded memory chip manufacturing for value-added differentiation against competition in the mature foundry market. With strategic help from its parent company TSMC on business transformation and technology transfer, VIS commanded a 1.1% share in the global foundry market by 2025 revenue on our estimates (total size c.USD140bn), or nearly 4% in the global mature foundry market (ex-TSMC as a proxy), behind SMIC, UMC, GlobalFoundries (GF) and Huahong Grace Semiconductor (HHGrace; see chart on the next page). Note: our foundry market calculation is for dedicated foundry works only, different from TSMC's revised definition of the Foundry 2.0 that includes not only the dedicated foundry but packaging, testing and other non-memory semiconductor manufacturing services.
The foundry market
Ever since TSMC's founder innovated the semiconductor foundry service model, the foundry market has been in operation for more than 3 decades. Thanks to a rise in the global AI buildout, the global foundry revenue, after a dip in 2023 on the post-COVID inventory correction, recovered by more than 20% YoY pa over 2024-25. We forecast the growth to accelerate to more than 30% YoY this year, with revenue reaching USD186bn and exceeding USD255bn in 2028 for a robust 23% CAGR over 2025-28. If excluding TSMC, we forecast the market to grow by 14% YoY this year and approach USD60bn in 2028 for a CAGR of 13%, where we expect VIS to outgrow the market growth over our forecast period as illustrated in a chart below, thanks to its fast capacity expansion to capitalise on the AI scaling and paradigm shift in the specialty foundry segment.
Operation and customer
VIS currently operates 5 wafer fabs with 4 in Taiwan, including Fab 1 which commenced operations in 1994 as a memory setup and then converted to mixed signal, power metal oxide semiconductor field effect transistor (MOSFET) and logic foundry fab; Fab 2 which was acquired in 2007 from Winbond; Fab 3 which was acquired from Nanya Tech in 2014; and Fab 5 which was acquired from AUO in 2021, plus 1 in Singapore, Fab VS1, acquired from GF in 2019 and previously named 3E. The 5 fabs currently operate a total of 280,000 wpm capacity all in 8' wafer size, in which the Fab VS1 and 5 are scalable for an extra 10,000 wpm capacity each, though VIS doesn't seem to be keen in exercising the scalability since VSMC apparently is the focus for expansion. Following its opening ceremony on 28 September this year, VIS's first 12' fab via VSMC is slated for massproduction from 1Q27, aimed to bring up total capacity to c.380,000 wpm in 8' equivalent wafer by end-2028.
Global foundry market forecasts
Source: Company, Daiwa estimates and forecasts
Note: * Dedicated foundries only, not TSMC's definition of the Foundry 2.0
Source: Company, Daiwa estimates and forecasts
Note: * As a proxy of the mature foundry market
2025 global foundry market share*
VIS: major shareholder structure
Source: Company, Daiwa estimates
Note: * GF = GlobalFoundries, SF = Samsung Foundry
VIS covers a variety of fabless and IDM customers across Taiwan, China, Japan, Europe and the US
Source: Bloomberg
VIS doesn't disclose its key customers due to confidentiality issues, but we believe its key customers cover most of the fabless chipmakers in Taiwan and mainland China focusing on display driver (D/D), power MOSFET and power management IC (PMIC), as well as integrated device manufacturers (IDM) across Japan, Europe and the US. According to our industry survey, key D/D vendors in the greater China region are Novatek (3034 TT, TWD529, Hold [3]), Himax (HIMX US, not rated), Raydium (3592 TT, not rated), Ilitek (6962 TT, not rated), Sitronix Technology (8016 TT, not rated), FocalTech (3545 TT, not rated), Chipone Technology (not listed), OmniVision (603501 CH, CNY82.21, Hold [3]) and GalaxyCore (688728 CH, not rated), while key power semiconductor vendors in the world include Qualcomm (QCOM US, USD177.12, Outperform [2]; covered by Louis Miscioscia), Renesas (6723 JP, JPY3,924, Outperform [2]; covered by Junji Okawa), Monolithic Power Systems (MPS; MPWR US, not rated), NXP (NXPI US, not rated), STMicro (STM US, not rated), Infineon (IFX GR, not rated), Microchip (MCHP US, not rated), TI (TXN US, not rated), MediaTek (2454 TT, TWD4,835, Buy [1], via Richtek), Global Mixed-mode Technology (GMT; 8081 TT, not rated) and Niko Semiconductor (3317 TT, not rated).
Shareholder structure
VIS's major shareholders were TSMC and the Taiwan government's Development Funds, with c.19% and c.16% of holdings, respectively, as of August 2026 under total share outstanding of 1.88bn. With management in aggregate holding an insignificant stake and the rest being held by institutional investors (QFII holding was 32.7% as of 5 October), we estimate a healthy free float of more than 60% for the stock, with decent cap of c.USD11bn and 3-month daily turnover of more than USD100m.
TSMC reduced its holding in VIS this year by 8pp, raising investor concerns on whether the move would jeopardise the former's strategic support to the latter. We see no direct link between the stake reduction and strategic support, and believe TSMC will continue the support, evidenced by its licence of gallium-nitride (GaN) and interposer technologies and equipment consignment to VSMC.
Major shareholders are TSMC and Taiwan government
ESG analysis
ESG risks
| Risks | Management Analystcomments |
|---|---|
| G Executive/board quality 1 | VIS's board of directors (BoD) consists of 9 members, including 5 independent directors, representing 56% of the total board seats. The board comprises members with diverse backgrounds in business management, finance, industry, and academia, providing a broad range of expertise and perspectives. We believe the majority-independent board structure and the directors' collective experience in leadership, corporate governance, industry expertise, financial management, risk management, and sustainability strengthen the effectiveness of the BoD and support VIS's long-term growth and corporate governance practices. |
| Capital management 1 | VIS pays its dividend on a quarterly basis. In the past 5 years, it has managed its dividend payout well, as evidenced by its dividend in dollar terms, where it has never lowered its dividend. |
| Related party & transaction 1 | Sales to related parties were around 1-2% of its total revenue each year. The percentage is insignificant and thus we see limited risk for VIS. |
| S Supplychain management 1 | VIS has established a comprehensive sustainable supply chain management framework to ensure suppliers comply with its sustainability requirements covering environmental protection, labor and human rights, occupational health and safety, business ethics, and responsible sourcing. The company requires suppliers to adhere to its "VIS Supplier Code of Conduct" and "Corporate Sustainability Policy", and conducts supplier sustainability assessments and audits as part of its supplier management process. We believe these efforts strengthen VIS's supply chain resilience and help mitigate supply chain risks. |
| E Water&wastewater management 2 | VIS is committed to improving water efficiency and sustainable water management. In 2022, the company implemented the ISO 46001 Water Efficiency Management System to analyze water consumption patterns, identify significant water-use equipment, evaluate water-saving opportunities, and establish improvement measures. VIS also provides annual water management training at its Taiwan facilities to promote continuous improvement in water-use efficiency. We believe these efforts demonstrate the company's commitment to responsible water stewardship and help reduce operational risks associated with water resources. |
| E Waste & hazardous materials management 1 | VIS adopts a comprehensive resource management approach to waste management and has established waste management procedures in accordance with ISO 14001 standards. Through dedicated waste management personnel and regular employee training, the company promotes effective waste reduction, classification, collection, storage, and treatment practices across its operations. |
| E GHGemissions 1 | VIS adopts a source-segregation and multi-stage treatment approach, supported by high- efficiency air pollution control systems, to effectively manage VOC and acidic/alkaline gas emissions from semiconductor manufacturing processes. The company's emission levels remain well below regulatory limits, reflecting its commitment to environmental compliance and sustainable operations. |
Note: Management score represents a company's ability to manage/benefit from certain ESG topics. The scores range from 1 to 3, with 1 being the strongest.
Update Date: 8 Oct 2026
Source: Daiwa, Company
Daiwa's Asia Pacific Research Directory
| HONG KONG | ||
|---|---|---|
| Hiroyuki GOTO Regional Head of Equity, Regional Head | (852) 2773 8870 Asia & Oceania; | hiroyuki.goto@hk.daiwacm.com of Asia Pacific Research |
| John HETHERINGTON | (852) 2773 8787 | john.hetherington@hk.daiwacm.com |
| Co-Head of Asia Pacific Research and Head of Research Publications | ||
| Li XIONG Strategy (Hong | (852) 2773 8878 Kong/China) | li.xiong@hk.daiwacm.com |
| Kelvin LAU | (852) 2848 4467 | kelvin.lau@hk.daiwacm.com |
| Regional Head of Automobiles, Industrials and Transportation | ||
| Evelyn ZHANG | (852) 2848 4970 | evelyn.zhang@hk.daiwacm.com |
| Automobiles and Components (Hong Kong/China) | ||
| Carol XIA | (852) 2532 4349 | carol.xia@hk.daiwacm.com |
| Head of China Consumer; Consumer (Hong Kong/China) | ||
| Steven NIE | (852) 2848 4464 | steven.nie@hk.daiwacm.com |
| Consumer (Hong Kong/China); Global Cryptocurrency | ||
| Siman CHEN | (852) 2532 4350 | siman.chen@hk.daiwacm.com |
| Consumer (Hong Kong/China) | ||
| Jing YANG | (852) 2532 4308 | jing.yang@hk.daiwacm.com |
| Head of China Healthcare | ||
| John CHOI Head of China Internet; of Emerging | (852) 2773 8730 Regional Head | john.choi@hk.daiwacm.com Opportunities |
| Lily LIU | (852) 2848 4435 | lily.liu@hk.daiwacm.com |
| Internet (Hong Kong/China) | ||
| Dennis IP | (852) 2848 4068 | dennis.ip@hk.daiwacm.com |
| Head of Asia ex-Japan Power, Utilities, Renewables & ESS (PURE) Research; US & China Power Equipment (Gas, Nuclear, Solar, Grid, Battery & Rare Earth Materials); | ||
| Derek | ||
| Power, Utilities, Renewables and ESS (PURE) - Gas & Gas Equipment, Rare Earth | ||
| Materials | 2848 | |
| Power, Utilities, Renewables and ESS (PURE) - US Power, PCB (China) | ||
| (852) | ||
| Marco ZENG | ||
| 4430 | ||
| marco.zeng@hk.daiwacm.com | ||
| (China), | ||
| Equipment (US) | ||
| ZHANG | ||
| (852) 2532 4341 derek.zhang@hk.daiwacm.com | ||
| Utilities (Hong | ||
| Kong), Power | ||
| (China) | ||
| Tech Hardware - AIDC Power, PCB, Optical Fiber |
| CHINA | CHINA | CHINA |
|---|---|---|
| Louis LUO | (86) 21 6841 3282 | louis.luo@daiwacm.cn |
| Automobiles and Components, Industrials (China) | Automobiles and Components, Industrials (China) | Automobiles and Components, Industrials (China) |
| William WU Banking, Property | (86) 21 6841 3200 (China/Hong Kong) | william.wu@daiwacm.cn |
| Mavis MA Battery Components; | (86) 21 6841 3288 Industrials (China) | mavis.ma@daiwacm.cn |
| Leo LU Power, Utilities, | (86) 21 6841 3286 Renewables and ESS (PURE) | leo.lu@daiwacm.cn - Solar, ESS, Lithium, AIDC Power (China) |
| Skye LIANG Power, Utilities, | (86) 21 6841 3207 Renewables and ESS (PURE) | skye.liang@daiwacm.cn - Grid, Wind and Optical Fibre (China) |
| Bintuo NI Tech Hardware and | (86) 21 6841 3228 Semiconductors (China) | bintuo.ni@daiwacm.cn |
| SOUTH KOREA | SOUTH KOREA | SOUTH KOREA |
|---|---|---|
| Yoonki BAE Automobile Components, | (82) 2 787 9168 Healthcare | yoonki.bae@kr.daiwacm.com |
| Mike OH Banking, Capital Goods | (82) 2 787 9179 - Defence, Construction | mike.oh@kr.daiwacm.com and Shipbuilding, and Utilities |
| Youngho JANG Consumer, Healthcare | (82) 2 787 9838 | youngho.jang@kr.daiwacm.com |
| Henny JUNG EV Batteries and Battery Components | (82) 2 787 9182 Materials, IT/Electronics | henny.jung@kr.daiwacm.com (Small/Mid Cap), Automobiles and |
| Daeho SON Industrials - Robotics | (82) 2 787 9176 | dh.son@kr.daiwacm.com |
| Joon LEE Media, Software and IT | (82) 2 787 9151 Services | hj.lee@kr.daiwacm.com |
| Thomas Y KWON Pan-Asia Head of Internet | (82) 2 787 9181 & Telecommunications; | yskwon@kr.daiwacm.com Online Games |
| SK KIM Head of Global Memory; | (82) 2 787 9173 IT/Electronics - | sk.kim@kr.daiwacm.com Semiconductors/Displays and Tech Hardware |
| TAIWAN | TAIWAN | TAIWAN |
|---|---|---|
| Rick HSU | (886) 2 8758 6261 | rick.hsu@daiwacm-cathay.com.tw |
| Head of Regional Technology; Head of Taiwan Research; Semiconductors (Regional) | Head of Regional Technology; Head of Taiwan Research; Semiconductors (Regional) | Head of Regional Technology; Head of Taiwan Research; Semiconductors (Regional) |
| Sheng CHENG IT/Technology Hardware | (886) 2 8758 6253 (Automation, Datacentre | sheng.cheng@daiwacm-cathay.com.tw Components and PCB/CCL) (Greater |
| China) Leon CHEN | (886) 2 8758 6247 | leon.chen@daiwacm-cathay.com.tw |
| IT/Technology - Semiconductors Supply Chain (Taiwan) | IT/Technology - Semiconductors Supply Chain (Taiwan) | IT/Technology - Semiconductors Supply Chain (Taiwan) |
| Stacy LIN | (886) 2 8758 6252 | stacy.lin@daiwacm-cathay.com.tw |
| IT/Technology - Semiconductors Supply Chain (Taiwan) | IT/Technology - Semiconductors Supply Chain (Taiwan) | IT/Technology - Semiconductors Supply Chain (Taiwan) |
| Helen CHIEN Small/Mid Cap | (886) 2 8758 6254 | helen.chien@daiwacm-cathay.com.tw |
Daiwa's Offices
| Office / Branch / Affiliate | Address | Tel | Fax |
|---|---|---|---|
| DAIWA SECURITIES GROUP INC | |||
| HEAD OFFICE | Gran Tokyo North Tower, 1-9-1, Marunouchi, Chiyoda-ku, Tokyo, 100-6753 | (81) 3 5555 3111 | (81) 3 5555 0661 |
| Daiwa Securities Trust Company | One Evertrust Plaza, Jersey City, NJ 07302, U.S.A. | (1) 201 333 7300 | (1) 201 333 7726 |
| Daiwa Securities Trust and Banking (Europe) PLC (Head Office) | 5 King William Street, London EC4N 7JB, United Kingdom | (44) 207 320 8000 | (44) 207 410 0129 |
| Daiwa Europe Trustees (Ireland) Ltd | Level 3, Block 5, Harcourt Centre, Harcourt Road, Dublin 2, Ireland | (353) 1 603 9900 | (353) 1 478 3469 |
| Daiwa Capital Markets America Inc. New York Head Office | 1251 Avenue of the Americas, 49th Floor, New York, NY 10020 | (1) 212 612 7000 | (1) 212 612 7100 |
| Daiwa Capital Markets America Inc. San Francisco Branch | 1 California St, Suite 200, San Francisco, CA 94111, U.S.A. | (1) 415 955 8100 | (1) 415 956 1935 |
| Daiwa Capital Markets Europe Limited, London Head Office | 5 King William Street, London EC4N 7AX, United Kingdom | (44) 20 7597 8000 | (44) 20 7597 8600 |
| Daiwa Capital Markets Deutschland GmbH | Tower 185, 26 O.G., Friedrich-Ebert-Anlage 35-37, 60327 Frankfurt am Main, Germany | (49) 69 27139 8100 | (49) 69 27139 8190 |
| Daiwa Capital Markets Europe Limited, Paris Representative Office | 40 rue du Colisée, 75008 Paris, France | (33) 1 56 262 200 | (33) 1 47 550 808 |
| Daiwa Capital Markets Europe Limited, Bahrain Branch | Office 3503, 35th Floor, United Tower, Bahrain Bay, P.O. Box 30069, Manama, Bahrain | (973) 17 534 452 | (973) 17 535 113 |
| Daiwa Capital Markets Hong Kong Limited | Level 26, One Pacific Place, 88 Queensway, Hong Kong | (852) 2525 0121 | (852) 2845 1621 |
| Daiwa Capital Markets Singapore Limited | 7 Straits View, Marina One East Tower, #16-05 & #16-06, Singapore 018936, Republic of Singapore | (65) 6387 8888 | (65) 6282 8030 |
| Daiwa Capital Markets Australia Limited | Level 34, Rialto North Tower, 525 Collins Street, Melbourne, Victoria 3000, Australia | (61) 3 9916 1300 | (61) 3 9916 1330 |
| Daiwa-Cathay Capital Markets Co Ltd | 14/F, 200, Keelung Road, Sec 1, Taipei, Taiwan, R.O.C. | (886) 2 2723 9698 | (886) 2 2345 3638 |
| Daiwa Securities Capital Markets Korea Co., Ltd. | 20 Fl.& 21Fl. One IFC, 10 Gukjegeumyung-Ro, Yeongdeungpo-gu, Seoul, Korea | (82) 2 787 9100 | (82) 2 787 9191 |
| Daiwa Securities Co. Ltd., Beijing Representative Office | Room 301/302,Kerry Center,1 Guanghua Road,Chaoyang District, Beijing 100020, People's Republic of China | (86) 10 6500 6688 | (86) 10 6500 3594 |
| Daiwa (Shanghai) Corporate Strategic Advisory Co. Ltd. | 7th Floor, Hang Seng Bank Tower, 1000 Lujiazui Ring Road, Pudong, Shanghai, People's Republic of China | (86) 21 3858 2000 | (86) 21 3858 2111 |
| Daiwa Securities Co. Ltd., Bangkok Representative Office | 18 th Floor, M Thai Tower, All Seasons Place, 87 Wireless Road, Lumpini, Pathumwan, Bangkok 10330, Thailand | (66) 2 252 5650 | (66) 2 252 5665 |
| Daiwa Securities Co. Ltd., Hanoi Representative Office | Suite 1101, Tower 2, Capital Place Building, 29 Lieu Giai, Ba Dinh District, Hanoi, Vietnam | (84) 4 3946 0460 | (84) 4 3946 0461 |
| DAIWA INSTITUTE OF RESEARCH LTD | |||
| HEAD OFFICE | 15-6, Fuyuki, Koto-ku, Tokyo, 135-8460, Japan | (81) 3 5620 5100 | (81) 3 5620 5603 |
| MARUNOUCHI OFFICE | Gran Tokyo North Tower, 1-9-1, Marunouchi, Chiyoda-ku, Tokyo, 100-6756 | (81) 3 5555 7011 | (81) 3 5202 2021 |
| New York Research Center | 11th Floor, Financial Square, 32 Old Slip, NY, NY 10005-3504, U.S.A. | (1) 212 612 6100 | (1) 212 612 8417 |
| London Research Centre | 3/F, 5 King William Street, London, EC4N 7AX, United Kingdom | (44) 207 597 8000 | (44) 207 597 8550 |