本頁用完整解析檔,未用 trimmed
pdf_trim.py 把 2,789 行削到 47 行(削掉 98%),因為本報告圖表密度極高、正文散在圖說之間。本頁保留 pdf_parse.py 的完整輸出。
報告_MS_MLCC產業_20260915
PDF 原檔:報告_MS_MLCC產業_20260915_original.pdf
圖片清單(已驗證 2026-09-16)
| 檔名 | size | 分類 | 親眼所見內容 |
|---|---|---|---|
報告_MS_MLCC產業_20260915_005.png |
200KB | 真資料圖 | Exhibit 7「AI ecosystem capital flows」:OpenAI/Nvidia/Microsoft/Oracle/Coreweave/Amazon/AMD/Disney/Data Center Lease 之間的資金流向網路圖,線型分 Customer/Revenue Share/Investor/Repurchase Agreement/Vendor Financing 五類,標註各筆金額(如 OpenAI–Oracle $300bn、Nvidia–OpenAI $100bn、Microsoft–OpenAI $13bn 等) |
報告_MS_MLCC產業_20260915_011.png |
— | 真資料圖 | Exhibit 16「AI/DC MLCC Demand Split by High/Low-Cap (US$M)」柱狀圖:低容量(22µF 以下)754/709/1,069/1,398/2,056/3,704(2022–2027),高容量(47µF 以上)1/5/26/218/514/2,476 |
本報告共抽出 38 張圖,上表為本次 ingest 實際開圖驗證者;其餘未逐張驗證,不得直接嵌入 lib/。
原始內容
M September 15, 2026 09:24 PM GMT
Global Technology
MLCC: Continued Demand Growth for High-Value-added Products for AI & Data Centers
Remain OW on Murata, SEMCO & Yageo, which we see as MLCC demand growth beneficiaries, and upgrade Taiyo Yuden to EW.
Key Takeaways
- We forecast global MLCC shipment value to expand at a CAGR of 20.3%, driven by growing demand for AI servers/DCs.
- MLCCs are a key business, accounting for 50% of sales at Murata Mfg, 46% at SEMCO, 19% at Yageo, and 70% at Taiyo Yuden in 2025.
- We expect Murata, the top player by global market share, and No. 2 SEMCO to benefit particularly strongly from expanding demand for AI server/DC MLCCs.
MLCC is early cycle in AI server & rack penetration:
Revenue growth is inflecting, driven by a structural change from AI-related MLCC content. This shift to higher-margin AI products will support sustained earnings growth worth more than cyclical earnings growth - and thus, higher valuations. In short, MLCC is perhaps the new investment highly levered to data center spending among the "AI picks & shovels".
Demand in high-value-added MLCCs for AI/DC to
keep growing from 2027: We forecast CAGR in global MLCC shipment value at 20.3% in 2025-31 ($14.67bn to $44.45bn) based on our outlook for continued growth in sales of small, high-capacity, high-value-added MLCCs for AI servers/DCs.
Murata & SEMCO the biggest beneficiaries: MLCCs are a key business, with 50% of sales at Murata, 46% SEMCO, 19% Yageo, and 70% Taiyo Yuden in 2025. We expect growing demand for AI server/DC MLCCs to be particularly positive for Murata (top player at 41% global MLCC market share in 2025) and SEMCO (#2 at 23%). We view the sell-off in these stocks from their peaks as a re-entry opportunity.
Remain OW on Murata as Top Pick in Japan electronic components; raise Taiyo Yuden to EW: We raise Murata forecasts as in Exhibit 25 . However, we lower our DCF-based PT from ¥12,500 to ¥11,000, mainly reflecting an increase in our DCF model risk-free rate (2.6% to 3.0%). We also revise Taiyo Yuden estimates ( Exhibit 33 ), but expect it to take longer than Murata & SEMCO to benefit from AI server/ DC MLCC demand growth. We lower our DCF-based PT from ¥12,500 to ¥10,500
Morgan Stanley MUFG Securities Co., Ltd.+
| Shoji Sato Equity Analyst Shoji.Sato@morganstanleymufg.com | +81 3 6836-8404 |
|---|---|
| Howard Kao Equity Analyst Howard.Kao@morganstanley.com Morgan Stanley & Co. International plc+ | +886 2 2730-2989 |
| Equity Analyst Shawn.Kim@morganstanley.com Morgan Stanley MUFG Securities Co., Ltd.+ Sota Harashima Equity Analyst Sota.Harashima@morganstanleymufg.com | +44 20 7677-1018 |
| Morgan Stanley Asia Limited+ | +81 3 6836-8897 |
| Duan Liu Equity Analyst Duan.Liu@morganstanley.com Morgan Stanley & Co. International plc+ Cindy Huang | +852 2239-7357 |
| What's Changed Taiyo Yuden (6976.T) Rating Price Target | From Underweight ¥12,500 | To Equal-weight ¥10,500 |
|---|---|---|
| Murata Manufacturing (6981.T) Price Target | From ¥12,500 | To ¥11,000 |
| Yageo Corp. (2327.TW) Price Target | From NT$1,465.00 | To NT$1,050.00 |
Morgan Stanley does and seeks to do business with companies covered in Morgan Stanley Research. As a result, investors should be aware that the firm may have a conflict of interest that could affect the objectivity of Morgan Stanley Research. Investors should consider Morgan Stanley Research as only a single factor in making their investment decision.
For analyst certification and other important disclosures, refer to the Disclosure Section, located at the end of this report.
+= Analysts employed by non-U.S. affiliates are not registered with FINRA, may not be associated persons of the member and may not be subject to FINRA restrictions on communications with a subject company, public appearances and trading securities held by a research analyst account.
pIw
ціпол1|
Nowaw
M
Investment Perspective Ơ ISON
now
MLCC is early cycle in AI server & rack penetration
There is immense change underway for the MLCC industry with an investment narrative that is changing as AI chips/server demand is increasingly driving MLCC scarcity. AI is shifting from semiconductors to MLCCs, creating a supply/demand mismatch in high-end components. The high-end AI MLCC market is effectively a Japanese-Korean duopoly with Murata and SEMCO together hold around 85% share. High-capacitance, low-ESL parts for AI accelerators require hundreds to over a thousand dielectric layers with near-zero defects and face strict customer qualification - the barrier preventing a repeat of 201718, when shortages invited entry and the cycle self-corrected. AI platforms now compete directly with consumer, automotive, and industrial applications for advanced materials, heightening supply risk for MLCC traditional customers. We are still in the early innings, and supply concerns are extending beyond near-term shortages to longer-term supply security. As a result, we are seeing an increasing number of long-term supply agreements being signed between suppliers and customers.
Exhibit 1: Sequencing the technology cycle - still early cycle for MLCC
Source: Morgan Stanley Research estimates
Turning point in MLCC pricing
While Murata Mfg.'s CFO and Executive Deputy President Masanori Minamide stated in a Sep 14 Nikkei interview that rising production loads for high-end products are making it increasingly difficult to fully supply low-end products, and that the priority of defending low-end market share has effectively declined, we believe the company's fundamental policy of not changing prices based solely on short-term supply-demand conditions remains intact. That said, in our view, Murata has been gradually shifting its strategy toward focusing more on its areas of strength and adopting pricing that better reflects the need to cover large-scale capital investments, particularly in those core segments where it enjoys a competitive advantage. We believe that Murata's reluctance to enter into LTAs for AI/data-center use value added MLCCs reflects its view that locking in prices today may not be optimal, given the potential for MLCC pricing to rise in the future.
We expect sales growth to continue for small-sized, highcapacity, high-value-added MLCCs for AI servers/DCs
M
MLCCs are a key business, accounting for 50% of sales at Murata, 46% at SEMCO, 19% at Yageo, and 70% at Taiyo Yuden in 2025. We expect global MLCC shipment value to expand at a CAGR of 20.3%, from $18.51bn in 2025 to $44.45bn in 2031. We believe growth is set to accelerate from the 5.0% CAGR recorded in global MLCC shipment value over the 13 years of 2012-25 because we expect continued growth in sales of small, highcapacity, high-value-added MLCCs for AI servers/datacenters (DCs) from 2026. For AI servers/DCs alone, we forecast MLCC shipment value to reach $23.33bn by 2031 (vs. our previous estimate of $10.80bn), implying a 57.1% CAGR (vs. 38.1%).
Howard Kao (our Greater China Technology Hardware analyst) expects MLCC demand volume for VR200 NVL72 racks to increase about 80% versus GB300 NVL72 racks, and forecasts the number of MLCCs mounted in each Rubin NVL72 rack will jump to roughly 570,000 units from around 320,000 for GB300 NVL72 racks, with MLCC dollar content per rack estimated to increase by 166%. We expect the rapid expansion of the high-valueadded MLCC market for AI servers/DCs to be especially positive for earnings at Murata (#1 market share in MLCCs for 2025 at 41%) and SEMCO (#2 at 23%).
Exhibit 2: AI/DC-use MLCC shipment value forecasts (Old)
Exhibit 3: AI/DC-use MLCC shipment value forecasts (New)
e=Morgan Stanley Research estimates; Source: Morgan Stanley Research
e=Morgan Stanley Research estimates; Source: Morgan Stanley Research
Key roles of MLCCs in AI/DC
MLCCs play a role in locally stabilizing power supply (instantaneous current supply plus noise removal) near semiconductors, such as GPUs, CPUs, and FPGAs. Since GPUs, CPUs, and FPGAs repeatedly switch on and off on a nanosecond timescale, they demand large currents instantaneously, and MLCCs meet this instantaneous current demand by immediately discharging their stored charge. As semiconductor miniaturization advances, circuit operating speed increases and drive voltage falls. As voltage decreases, even small voltage fluctuations risk causing semiconductor malfunction, so even more stable power supply voltage is required than before. Demand for capacitor capacitance is also increasing in line with AI servers' rising computing power and power consumption, and because board area and mountable space are limited, we expect demand for smaller, highercapacity MLCCs to persist.
Sharp dips vs. share price peaks provide re-entry opportunity
Year-to-date to Sep 11, share prices of the four companies had risen 127% for Murata, 449% for SEMCO, 141% for Yageo, and 160% for Taiyo Yuden. However, from their respective June-July peaks, these have fallen 40% for Murata, 38% for SEMCO, 52% for
M
Yageo, and 59% for Taiyo Yuden. Considering the strong likelihood that high-value-added products for AI servers/DCs will continue to drive growth in MLCC demand not only in 2026 but also from 2027 onward, and that each company's earnings will stay on an expansionary trend, we believe the conditions are now in place to consider re-entering these stocks.
Exhibit 4: Stock performance comparison for 4 MLCC suppliers
| Murata | SEMCO | Yageo | Taiyo Yuden | |
|---|---|---|---|---|
| Trading currency | JPY | KRW | NTD | JPY |
| Latest close (9/11) | 7,352 | 1,400,000 | 544 | 9,209 |
| CY26 high | 12,250 | 2,270,000 | 1,140 | 22,655 |
| Price target | 11,000 | 2,620,000 | 1,050 | 10,500 |
| YTD | 126.5% | 449.0% | 141.2% | 160.1% |
| Deviation from peak price | -40.0% | -38.3% | -52.3% | -59.4% |
| Deviation from PT | 49.6% | 87.1% | 93.0% | 14.0% |
Source: FactSet, Morgan Stanley Research
Exhibit 5: ROE-P/B comparison for 4 MLCC suppliers
e=Morgan Stanley Research estimates; Source: Company data, Morgan Stanley Research
M
Exhibit 6: Valuation/earnings forecasts comparisons for 4 MLCC suppliers
| Murata 6981.T | SEMCO 009150.KS | Yageo 2327.TW | Taiyo Yuden 6976.T | |
|---|---|---|---|---|
| Rating | Overweight | Overweight | Overweight | Equal-weight |
| Trading Currency | JPY | KRW | TWD | JPY |
| Price Target | 11,000 | 2,620,000 | 1,050 | 10,500 |
| Current Price | 7,352 | 1,400,000 | 544 | 9,209 |
| Upside/(Downside) (%) | 50% | 87% | 93% | 14% |
| Market Cap (in USD mm) | 87,168.4 | 78,844.1 | 34,344.9 | 8,256.9 |
| Avg Daily Traded Vol (in USD mm) | 541.9 | 457.2 | 615.6 | 452.0 |
| Bull Case Value | 14,000 | 3,000,000 | 1,490 | 14,000 |
| Upside (%) | 90% | 114% | 174% | 52% |
| Bear Case Value | 3,500 | 1,350,000 | 480 | 4,500 |
| Downside (%) | -52% | -4% | -12% | -51% |
| Risk/Reward Skew | 1.7 | 32.0 | 14.8 | 1.0 |
| Earnings Forecasts (in USD mn) | ||||
| Sales | 14,057.9 | 10,258.7 | 5,797.2 | 2,746.3 |
| MLCC Sales | 8,163.7 | 5,374.1 | 1,296.3 | 2,055.2 |
| (% of sales) | 58.1% | 52.4% | 22.4% | 74.8% |
| OP | 3,143.6 | 1,564.6 | 1,589.4 | 288.8 |
| Net income | 2,454.8 | 1,219.0 | 1,289.4 | 192.6 |
| FY27e | ||||
| Sales | 16,957.0 | 17,387.4 | 7,984.2 | 3,135.2 |
| MLCC Sales | 10,173.9 | 10,988.2 | 2,531.9 | 2,414.6 |
| (% of sales) | 60.0% | 63.2% | 31.7% | 77.0% |
| OP | 4,533.0 | 4,253.2 | 2,663.3 | 426.4 |
| Net income | 3,480.9 | 3,340.2 | 2,093.2 | 282.9 |
| Implied Multiples on MS Price Target | ||||
| FY26e | ||||
| P/E | 52.0x | 116.9x | 47.2x | 48.1x |
| EV/EBIT | 39.62 | 86.67 | 28.22 | 33.13 |
| EV/EBITDA | 28.96 | 55.34 | 27.12 | 15.71 |
| EV/Sales | 8.86 | 13.22 | 5.45 | 3.48 |
| FY27e | ||||
| P/E | 36.4x | 46.2x | 41.9x | 33.0x |
| EV/EBIT | 28.62 | 34.72 | 28.86 | 22.00 |
| EV/EBITDA | 22.53 | 27.84 | 27.81 | 12.31 |
| EV/Sales | 7.65 | 8.49 | 5.46 | 2.99 |
| Stock Price Performance | ||||
| 1 Month | (2.5%) | 10.9% | (11.8%) | (10.3%) |
| 3 Month | (18.0%) | (22.4%) | (35.4%) | (44.6%) |
| 1 Year | 195.0% | 644.7% | 294.2% | 203.1% |
| YTD | 126.5% | 449.0% | 135.5% | 160.1% |
Note: e=Morgan Stanley Research estimates; Rating data is based on FactSet; FY ends in Mar for Murata and Taiyo Yuden, ends in Dec for SEMCO and Yageo; Based on Sep 11 close price Source: FactSet, Morgan Stanley Research
Earnings and share price risks
We expect capital expenditure on AI/DC to keep expanding and generational transitions to
STBD bn 121
Disney
$100 bn 72)
$1 bn/20
$30 bn/11
Oracle
STBO bn(2a)
$0.75 bn
STBD bn(1?)
AMD
/ 56.1 bn/(20
$261.3 bn/2u/
Microsoft
S33 bn|15)/6145.1 bnl34
$106.4 bnil
$40 bn/"
Nvidia
$21 bn|a00
$22.7 bn/l
Customer
Revenue Share
• Investor
M
$0.69 bn/1|
$300 bn (1Ml
$13 bn|12)
$50 bn(24)
continue in GPUs, sustaining growth in demand for small, high-capacity, high-value-added MLCCs. Risks to the continuity of AI/DC capex expansion include: (1) rising risk from the growing practice of hyperscalers and major semiconductor companies charging usage fees in exchange for equity investments in AI development companies, conditional on the use of their own cloud services or semiconductors; and (2) risk that AI/DC capex growth slows due to bottlenecks, such as power infrastructure constraints. If the pace of AI/DC capex growth slows, we cannot rule out that MLCC demand falls short of our base case outlook for demand. Also, as shown in Exhibits Exhibit 8 Exhibit 8 and Exhibit 9 , during the IT bubble around 2000, there was a strong correlation between the YoY change in Murata's and Taiyo Yuden's monthly order intake and their market cap. Since order intake has risen sharply since Jul-Sep 2025, we cannot ignore the possibility that YoY growth in order intake will slow. On the other hand, MLCC demand continues to expand for high-valueadded products for AI/DC, and we expect the major MLCC makers' sales to grow along with an improving product mix.
Exhibit 7: AI ecosystem capital flows
Source: Morgan Stanley Research
Exhibit 8: Murata Mfg: Market cap and order YoY (IT bubble
era)
Source: Company data, Morgan Stanley Research
Exhibit 9: Taiyo Yuden: Market cap and orders YoY (IT bubble era)
Source: Company data, Morgan Stanley Research
M
High-value-added products for AI servers will likely drive MLCC market growth
We expect global MLCC shipment value to increase at 20.3% CAGR through 2031
As shown in Exhibit 10 , we estimate that global MLCC shipment value fell for two consecutive years, from $17.47bn in 2021 (up 26.0% YoY) to $14.32bn in 2022 (down 18.1%) and $12.64bn in 2023 (down 11.7%), before rising back up to $13.30bn in 2024 (up 5.2%) and $14.67bn in 2025 (up 10.3%). We increase our forecasts for shipment value from $18.48bn to $18.51bn for 2026 (up 26.2% YoY), from $22.16bn to $24.52bn for 2027 (up 32.4%), and from $25.73bn to $28.60bn for 2028 (up 16.7%), and we expect the market to reach $44.45bn in 2031, growing at a CAGR of 20.3% over the six-year period.
Exhibit 10: Global MLCC market forecasts
| Base Case | 2007 | 2008 | 2009 | 2010 | 2011 | 2012 | 2013 | 2014 | 2015 | 2016 | 2017 | 2018 | 2019 | 2020 | 2021 | 2022 | 2023 | 2024 | 2025 2026e | 2027e | 2028e 2029e | 2030e | 2031e | |
|---|---|---|---|---|---|---|---|---|---|---|---|---|---|---|---|---|---|---|---|---|---|---|---|---|
| Total worldwide shipment quantity (Bil pcs) | 1,504 | 1,480 | 1,640 | 2,050 | 2,029 2,167 | 2,293 | 2,605 | 2,735 | 3,080 | 3,480 | 3,828 | 3,254 | 3,695 | 4,446 | 3,572 | 3,187 3,386 | 3,773 | 4,037 | 4,360 4,709 | 5,086 | 5,493 | 5,932 | ||
| YoY (%) | 14.9% | -1.6% | 10.8% | 24.9% | -1.0% | 6.8% | 5.8% | 13.6% | 5.0% | 12.6% | 13.0% | 10.0% | -15.0% | 13.5% | 20.3% | -19.7% -10.8% | 6.2% | 11.4% | 7.0% | 8.0% | 8.0% | 8.0% | 8.0% | 8.0% |
| CAGR (1991~) | 14.9% | 13.8% | 13.7% | 14.2% | 13.4% | 13.1% 12.8% | 12.8% | 12.5% | 12.5% | 12.5% | 12.4% | 11.3% | 11.4% | 11.6% | 10.5% | 9.7% | 9.6% 9.7% | 9.6% | 9.6% | 9.5% | 9.5% | 9.4% | 9.4% | |
| ASP in worldwide shipment (Cent) | 0.47 | 0.42 | 0.36 | 0.38 | 0.39 | 0.36 0.33 | 0.30 | 0.29 | 0.26 | 0.27 | 0.37 | 0.39 | 0.38 | 0.39 0.40 | 0.40 | 0.39 0.39 | 0.43 | 0.48 | 0.52 | 0.54 | 0.55 | 0.57 | ||
| YoY (%) | -0.2% | -10.1% | -14.0% | 6.8% | 1.2% | -7.7% -7.2% | -10.6% | -4.1% | -7.2% | 3.8% | 34.3% | 4.6% -2.8% | 4.7% | 2.0% | -1.0% | -1.0% -1.0% | 11.0% | 11.0% | 7.5% | 4.0% | 3.0% | 3.0% | ||
| CAGR (1991~) | -8.6% | -8.7% | -9.0% | -8.2% | -7.8% | -7.8% | -7.7% | -7.9% | -7.7% | -7.7% | -7.3% | -6.0% | -5.6% | -5.5% | -5.2% | -5.0% | -4.9% | -4.8% -4.6% | -4.2% | -3.8% | -3.5% | -3.4% | -3.2% | -3.0% |
| Total worldwide shipment value (Bil $) | 7.00 | 6.19 | 5.90 | 7.87 | 7.89 | 7.77 | 7.63 | 7.75 | 7.80 | 8.15 | 9.56 | 14.13 | 12.56 | 13.86 | 17.47 | 14.32 | 12.64 13.30 | 14.67 | 17.43 | 20.89 | 24.25 | 27.24 | 30.30 | 33.71 |
| YoY (%) | 14.6% | -11.6% | -4.7% | 33.4% | 0.2% -1.5% | -1.8% | 1.6% | 0.7% | 4.5% | 17.3% | 47.7% | -11.1% | 10.3% | 26.0% | -18.1% -11.7% | 5.2% | 10.3% | 18.8% | 19.9% | 16.1% | 12.3% | 11.2% | 11.2% | |
| CAGR (1991~) | 5.0% | 4.0% | 3.5% | 4.8% | 4.6% 4.3% | 4.0% | 3.9% | 3.8% | 3.8% | 4.3% | 5.7% | 5.0% | 5.2% | 5.8% | 5.0% | 4.4% 4.4% | 4.6% | 5.0% 5.3% | 5.6% | 5.8% | 5.9% | 6.1% |
e=Morgan Stanley Research estimates; Source: Morgan Stanley Research
AI/DC MLCC market to continue growing at a rapid pace
We expect growth in demand to accelerate for high-value-added products for AI/DC from the second half of 2026. Howard Kao expects MLCC demand volume for VR200 NVL72 racks to increase about 80% versus GB300 NVL72 racks, and forecasts the number of MLCCs mounted in each Rubin NVL72 rack will rise sharply to roughly 570,000 units from around 320,000 units for GB300 NVL72 racks ( Exhibit 11 ). This increase stems from a rise in the number of MLCCs mounted on both compute boards and switch boards, as well as an increase in PCB content across the overall system, including modules such as CX9 Orchid. Howard Kao estimates this increase in MLCC mounting volume will lift the dollarbased MLCC content per rack by 166% ( Exhibit 12 ).
M
Exhibit 11: MLCC assumptions for servers
| Server Assumptions | Server Assumptions | # of MLCCs | # of MLCCs | US$ | US$ |
|---|---|---|---|---|---|
| General server | General server | 2,000 | 43 | ||
| HGX Hopper AI server (8x GPU) | HGX Hopper AI server (8x GPU) | 22,000 | 505 | ||
| GPU module (OAM) | 8x | 1,300 | 10,400 | 30 | 240 |
| GPU baseboard (UBB) | 1x | 4,900 | 4,900 | 135 | 135 |
| CPU motherboard | 1x | 1,500 | 1,500 | 75 | 75 |
| Peripheral boards | 8x | 650 | 5,200 | 7 | 55 |
| HGX B200 AI server (8x GPU) | 36,000 | 886 | |||
| GPU module (OAM) | 8x | 3,000 | 24,000 | 72 | 576 |
| GPU baseboard (UBB) | 1x | 5,300 | 5,300 | 180 | 180 |
| CPU motherboard | 1x | 1,500 | 1,500 | 75 | 75 |
| Peripheral boards | 8x | 650 | 5,200 | 7 | 55 |
| HGX B300 AI server (8x GPU) | 48,000 | 1,240 | |||
| GPU module (OAM) | 8x | 4,400 | 35,200 | 120 | 960 |
| GPU baseboard (UBB) | 1x | 6,100 | 6,100 | 150 | 150 |
| CPU motherboard | 1x | 1,500 | 1,500 | 75 | 75 |
| Peripheral boards | 8x | 650 | 5,200 | 7 | 55 |
| GB200 (NVL72) | 337,500 | 5,370 | |||
| Bianca | 36x | 6,800 | 244,800 | 118 | 4,232 |
| Switch board | 9x | 3,800 | 34,200 | 57 | 515 |
| Peripheral boards | 90x | 650 | 58,500 | 7 | 622 |
| GB300 (NVL72) | 319,500 | 4,664 | |||
| Bianca | 36x | 6,300 | 226,800 | 98 | 3,527 |
| Switch board | 9x | 3,800 | 34,200 | 57 | 515 |
| Peripheral boards | 90x | 650 | 58,500 | 7 | 622 |
| VR200 (NVL72) | 571,050 | 12,411 | |||
| Strata | 36x | 11,000 | 396,000 | 257 | 9,239 |
| Switch board | 9x | 7,000 | 63,000 | 222 | 1,997 |
| BlueField Module | 18x | 2,000 | 36,000 | 20 | 366 |
| CX9 Orchid Module | 72x | 650 | 46,800 | 7 | 498 |
| Peripheral boards | 45x | 650 | 29,250 | 7 | 311 |
| Vera Rack | 494,048 | 8,339 | |||
| Vera MGX | 128x | 3,316 | 424,448 | 56 | 7,131 |
| Switch board | 4x | 7,000 | 28,000 | 222 | 888 |
| Peripheral boards | 64x | 650 | 41,600 | 5 | 320 |
| STX Rack | 326,256 | 3,184 | |||
| Mainboard | 16x | 4,791 | 76,656 | 79 | 1,264 |
| Peripheral boards | 384x | 650 | 249,600 | 5 | 1,920 |
| LPX Rack | 581,024 | 12,371 | |||
| LPX UBB | 16x | 5,374 | 85,984 | 103 | 1,646 |
| LPX Module | 256x | 1,705 | 436,480 | 39 | 9,953 |
| BF4 | 16x | 2,000 | 32,000 | 20 | 326 |
| x86 CPU Module | 16x | 1,660 | 26,560 | 28 | 446 |
Source: Morgan Stanley Research
M
Exhibit 12: MLCC content value per rack comparison between GB300 and VR200
| MLCCcontent per board (US$) | GB300 | VR200 |
|---|---|---|
| ComputePCB | $98 | $257 |
| Switch PCB | $57 | $222 |
| BlueField DPUModule | $7 | $20 |
| ConnectX Orchid Module | $7 | $7 |
| Other peripheralPCB | $7 | $7 |
| Units per rack | GB300 | VR200 |
| ComputePCB | 36x | 36x |
| Switch PCB | 9x | 9x |
| BlueField DPUModule | 0x | 18x |
| ConnectX Orchid Module | 0x | 72x |
| Other peripheralPCB | 90x | 45x |
| Total MLCCContent per rack | GB300 | VR200 |
| ComputePCB | $3,527 | $9,239 |
| Switch PCB | $515 | $1,997 |
| BlueField DPUModule | $0 | $366 |
| ConnectX Orchid Module | $0 | $498 |
| Other peripheralPCB | $622 | $311 |
| Total MLCCContent per rack | $4,664 | $12,411 |
Source: Morgan Stanley Research
Exhibit 13: AI/DC-use MLCC shipment value forecasts (Old)
e=Morgan Stanley Research estimates; Source: Morgan Stanley Research
Exhibit 14: AI/DC-use MLCC shipment value forecasts (New)
e=Morgan Stanley Research estimates; Source: Morgan Stanley Research
Role of MLCCs in AI servers
Capacitors, including multi-layer ceramic capacitors (MLCCs), function as a 'dam' that temporarily stores electricity, and are an essential electronic component for noise removal and voltage stabilization in virtually all electronic circuits, including those used in computers, smartphones, and automobiles. MLCCs play a role in locally stabilizing power supply (instantaneous current supply plus noise removal) near semiconductors such as GPUs, CPUs, and FPGAs. Since GPUs, CPUs, and FPGAs repeatedly switch on and off on a nanosecond timescale, they demand large currents instantaneously, and MLCCs meet this instantaneous current demand by immediately discharging their stored charge. At the same time, MLCCs bypass only the AC component (noise and fluctuating current), which also serves to prevent noise from entering GPUs, CPUs, and FPGAs. MLCCs feature low ESR (low resistance) and low ESL (low inductance), allowing them to track even
M
nanosecond-level current fluctuations in semiconductors such as GPUs, CPUs, and FPGAs. MLCCs are often placed around components such as GPUs and ASICs that operate at low voltages of around 1.0V. As semiconductor miniaturization advances, circuit operating speed increases and drive voltage falls. As voltage decreases, even small voltage fluctuations risk causing semiconductor malfunction, requiring an even more stable power supply voltage than before. Demand for capacitor capacitance will also rise along with AI servers' improving computing power and increasing power consumption, and because board area and mountable space are limited, demand for smaller, higher-capacity MLCCs will likely continue.
MLCC miniaturization and higher capacity to accelerate with VR200 NVL72
We assume that the space available for mounting MLCCs on VR200 NVL72 will not change significantly from the GB300 NVL72 rack, and that the transition from GB300 to VR200 will require installing higher-capacity MLCCs within the limited space of semiconductor ABF package substrates and AI accelerator boards, accelerating growth in demand for small-sized, high-capacity MLCCs. Murata has consistently been a leader in MLCC miniaturization and capacity increases, beginning mass production of 1005-size 1 F MLCCs in 2000 and 0402-size 1 F and 1005-size 22 F MLCCs in 2020. We expect demand for 1608-size 100 F, 1005-size 47 F, and 0603-size 10 F MLCCs to increase substantially with VR200 NVL72. We estimate that 1608-size 100 F MLCCs command a unit price 5-10x higher than 2012-size 100 F or 1608-size 47 F MLCCs, and we expect the shift to smaller, higher-capacity MLCCs accompanying the transition to VR200 NVL72 to drive a substantial rise in ASP.
Exhibit 15: High-cap (47uF+) MLCC usage to increase to 30%+ in VR200 (vs <20% for GB300)
Nvidia's Rubin System Uses More High-Cap MLCCs
Source: Morgan Stanley Asia Pacific Research estimates based on supply chain checks. Note: High-cap refers to 47uF+ MLCCs.
High-capacitance MLCCs (47µF+) are likely to capture a disproportionate share of this incremental opportunity: Our analysis suggests that 47µF+ MLCCs could account for approximately 50-60% of the incremental Cloud AI MLCC TAM in CY27, representing an additional ~US$2B market opportunity alone. This reflects both the increasing use of high-
M
capacitance devices within AI accelerator systems and a growing mix shift toward highervalue MLCC content.
From a volume perspective, we estimate Cloud AI demand for 47µF+ MLCCs could increase from approximately 4 billion units in CY25 to 40B+ units by CY27: Such a rapid increase would represent a meaningful step-up in industry demand and could require substantial capacity reallocation or expansion among leading suppliers.
Based on our industry discussions, the market for high-capacitance MLCCs remains concentrated among a limited number of suppliers, primarily Japanese and Korean manufacturers, including Murata, Taiyo Yuden, and Samsung Electro-Mechanics (SEMCO). As demand from AI infrastructure accelerates, we believe capacity utilization for these products could tighten, raising the possibility of capacity crowding-out effects across other end markets and applications.
Exhibit 16: Demand for high-cap (47uF+) MLCC is growing at a very fast pace
AI/DC MLCC Demand Split by High/Low-Cap (US$ M)
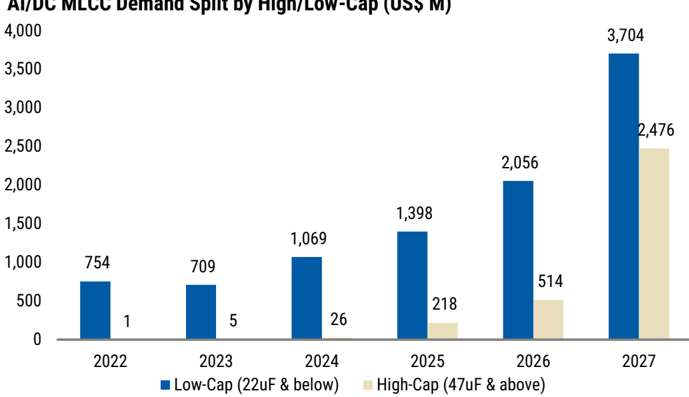
AI/DC MLCC Demand (US$ M) Source: Morgan Stanley Research; estimates are by Morgan Stanley Research
Exhibit 17: MLCC maximum capacitance by size
(μF)
| <=1000 | 220 | ||||||
|---|---|---|---|---|---|---|---|
| <=100 | 100 | 100 | 47 | ||||
| <=10 | 10 | ||||||
| <=1 | 1 | 0.1 | |||||
| (mm) | 3216 | 2012 | 1608 | 1005 | 0603 | 0402 | 0201 |
| Murata Mfg | ○ | ○ | ○ | ○ | ○ | ○ | ○ |
Note: O denotes products under mass production
Source: Morgan Stanley Research based on Murata Mfg product catalog
Exhibit 18: MLCC size comparison
| 4532 | 3216 | 2012 | 1608 | 1005 | 0603 | 0402 | 0201 | 016008 | |
|---|---|---|---|---|---|---|---|---|---|
| Length | 4.5mm | 3.2mm | 2.0mm | 1.6mm | 1.0mm | 0.6mm | 0.4mm | 0.25mm | 0.16mm |
| Width | 3.2mm | 1.6mm | 1.25mm | 0.8mm | 0.5mm | 0.3mm | 0.2mm | 0.125mm | 0.08mm |
| Thickness | 2.0mm | 0.85mm | 0.6mm | 0.8mm | 0.5mm | 0.3mm | 0.2mm | 0.125mm | 0.08mm |
| Volume | 28.8mm 3 | 4.35mm 3 | 1.5mm 3 | 1.024mm 3 | 0.25mm 3 | 0.054mm 3 | 0.016mm 3 | 0.004mm 3 | 0.001mm 3 |
| Volume ratio | 7,373 | 1,114 | 384 | 262 | 64.0 | 13.8 | 4.1 | 1.0 | 0.26 |
Source: Morgan Stanley Research
CAmbre 12. Milue composition
Multilayer structure
External electrode structure
M
Materials development and production technology behind MLCC miniaturization and capacity increases
In MLCCs, smaller sizes and higher capacities have mainly been achieved by thinning the dielectric and electrode layers (layer thinning) and increasing the number of layers stacked (multilayering). For high-capacity products for AI/DC, in addition to the layer thinning and multilayering described above, efforts are accelerating to further miniaturize and increase capacity by expanding the area of the dielectric and internal electrodes per dielectric sheet. We believe MLCC miniaturization and capacity increases depend on: (1) developing superior dielectric and electrode materials; (2) manufacturing highly uniform, highly reliable slurry; (3) technology for precisely stacking dielectric sheets; and (4) technology for firing in a controlled atmosphere without oxidation. For high-capacity products for AI/DC, we see the key factors as (1) materials development that increases the crystallinity of dielectric materials while making them finer, in order to thin each dielectric layer as much as possible (layer thinning), together with (2) manufacturing technology to precisely stack the dielectric sheets.
Exhibit 19: MLCC composition
Source: Murata Mfg materials
M
Exhibit 20: MLCC production process
| Dielectric raw material manufacturing (solid-phase method) | Raw materials (barium carbonate, titanium oxide, etc.) and additives Pre-firing, grinding, and drying produces dielectric raw material (barium titanate + additives) |
|---|---|
| Dielectric sheet manufacturing | Air bubbles removed from slurry Dielectric sheet manufactured using sheet-forming equipment Dielectric raw materials, binder, dispersant, solvent, etc. weighed/combined. |
| Internal electrode coating, lamination, crimping | Internal electrodes applied to dielectric sheets, layers built up Pressure of 50-200MPa applied to cast layers into a single solid |
| Chip processing | Cut into chips of required size Chips fired at 1,000-1,350°C External electrode paste applied to both ends of chips, fired at 600-850°C External electrodes coated with nickel, tin |
| Measurement, packaging, shipment | Sorting/screening based on measurements of electrostatic capacity, insulation resistance, etc. Sorting/screening based on visual/characteristic inspection Chips packaged using taping, bulk cassettes, etc. Shipment inspection Shipment |
Source: Morgan Stanley Research
Dielectric material manufacturing process
Dielectric materials are manufactured by adding a binder, solvent, and additives to barium titanate (BaTiO3), which is produced from barium carbonate (B aCO3) and titanium oxide (TiO2). Methods for manufacturing barium titanate are broadly divided into the solidphase method and the liquid-phase method. In the solid-phase method, barium carbonate and titanium oxide are mixed and fired at high temperature, producing barium titanate through a chemical reaction at the firing stage. In the liquid-phase method, barium carbonate and titanium oxide are dissolved in a solution, reacted at the solution stage, and fired at a relatively low temperature to produce the compound. Manufacturing methods used in mass production via the liquid-phase method include the oxalate method and the hydrothermal synthesis method. Barium titanate with small and uniform particle size is key to smaller and higher-capacity MLCCs. In 2023, Murata established MF Materials, a joint venture with Ishihara Sangyo and Ishihara Sangyo's wholly owned subsidiary Fuji Titanium (with equity stakes of 20% for Murata, 10% for Ishihara Sangyo, and 70% for Fuji Titanium). MF Materials produces barium titanate via the oxalate process and supplies it to Murata Manufacturing. MF Materials is constructing a new building adjacent to its head office plant in Nobeoka, Miyazaki Prefecture, with operations scheduled to commence in 2027. TDK established a joint venture with Nippon Chemical Industrial in April 2026 called TDK-NCI Advanced Materials (with equity stakes of 51% for TDK and 49% for Nippon Chemical Industrial), with plans to accelerate development of the oxalate method barium titanate.
M
| Solid-phase method | Oxalate method | Hydrothermal synthesis | ||
|---|---|---|---|---|
| Internal production Murata Mfg. | Internal production Murata Mfg. | ○ | ||
| Taiyo Yuden | ○ | |||
| SEMCO | ○ | |||
| Yageo | ○ | |||
| External sourcing | Sakai Chemical | ○ | ||
| Nippon Chem. Industrial | ○ | |||
| Ishihara Chemical | ○ | |||
| Noritake | ○ | |||
| Toda Kogyo | ○ | |||
| Sinocera | ○ | ○ |
Exhibit 21: Situations around Barium Titanate production
Source: Morgan Stanley Research
Murata and SEMCO to benefit the most from growing demand for high-value-added products for AI servers
We expect Murata and SEMCO, which supply small, high-capacity products stably and in large volumes, to capture the greatest benefits from growing demand for small-sized, high-capacity MLCCs used in AI servers and data centers. Murata has explained that AI/DC MLCC sales accounted for 10-15% of its MLCC sales in F3/26 and are forecast to rise 100105% YoY in F3/27, accounting for 20-25% of MLCC sales. We estimate Murata's AI/DC MLCC sales to rise roughly 120% YoY in F3/27 and about 100% YoY in F3/28, with AI/DC MLCCs underpinning growth in the company's overall MLCC sales. Murata has stated that it forecasts a 100-105% increase in AI/DC MLCC sales in F3/27, reflecting a roughly 40% increase in volume and a roughly 50% rise in ASP, but we expect the increase in ASP to exceed its forecast.
2025 MLCC market share was Murata 40.8%, Taiyo Yuden 11.3%
We estimate that global MLCC shipment value totaled $14.67bn in 2025 (up 10.3% YoY), with shares of 40.8% for Murata, 22.5% for SEMCO, 11.3% for Taiyo Yuden, 6.9% for TDK, and 5.4% for Yageo, and a combined 13.0% for all companies outside these top five. We expect demand for high-value-added products for AI/DC to keep expanding from 2027, with Murata and SEMCO continuing to gain market share.
M
Exhibit 23: MLCC market share
Source: Company data, Morgan Stanley Research
Exhibit 24: MLCC market share (CY25)
Source: Company data, Morgan Stanley Research
What are the risks to Murata?
Risks for Murata include: (1) losing MLCC market share by failing to adequately supply MLCCs for AI servers/DCs amid rapidly expanding demand. (2) Murata's products, including MLCCs, are used not only in AI servers/DCs but across virtually all electronic equipment, including automobiles, smartphones, and industrial machinery, making the company sensitive to macroeconomic conditions and inventory cycles. (3) The company has explained that a ¥1/$ appreciation of the yen would reduce operating profit by ¥4.5bn per year, and the yen could appreciate beyond our assumed rate of ¥155/$, among other factors.
M
Murata Manufacturing earnings forecasts
We expect Murata at 2Q results (end-Oct) to hike F3/27 guidance; continued earnings growth from F3/28
F3/27-28 and F3/27 2Q forecasts: We project F3/27 OP of ¥490.8bn (guidance ¥430bn, FactSet consensus ¥453.9bn), up ¥208.9bn YoY and above F3/22's record of ¥424.1bn. That is because we expect profit in the Components segment to rise ¥186.2bn to ¥501.3bn and losses in the Device & Modules segment to shrink by ¥24.1bn from -¥26.5bn to ¥2.4bn. We look for Components profit to rise due to a +31.6% YoY increase in MLCC sales in dollar terms (+36.1% on yen basis), a continued increase after F3/26's +13.8% rise (+12.6% on yen basis), product mix improvement, and higher utilization rates absorbing increased depreciation and other fixed cost growth. We expect Device & Modules losses to shrink mainly due to the falling out of ¥43.8bn in Resonant goodwill impairment and ¥6bn from the disposal of the micro battery business. We project F3/28 OP of ¥702.6bn (consensus ¥655.3bn). The projected ¥211.8bn YoY growth breaks down as Components + ¥170bn and Devices & Modules +¥39.6bn. We expect Components profit to rise thanks to a 24.5% YoY increase in capacitor (MLCC) sales in dollars (+23.7% on yen basis) and continued product mix improvement absorbing increased depreciation & other fixed cost growth. We look for Devices & Modules profit to rise on factors including increased sales of high-frequency modules, secondary batteries, and vertical power delivery modules.
We project 2Q OP of ¥125bn (consensus ¥122.9bn). The projected QoQ ¥26.6bn growth breaks down as Components +¥12.5bn QoQ to ¥126bn, and Devices & Modules +¥13.9bn QoQ to ¥1bn. For Components, we expect sales of MLCCs for AI/data centers to continue to increase, the MLCC product mix to improve, and utilization rates to continue to rise. For Devices & Modules, we expect sales for North American smartphones to increase seasonally and reenter the black, but because North American smartphone production is split between fall models and spring models, profit contributions are likely to be limited.
Exhibit 25: Murata Mfg: Earnings forecast changes
| F3/26 | F3/27 | F3/27 | F3/27 | F3/27 | F3/27 | F3/27 | F3/26 F3/27 | F3/26 F3/27 | F3/26 F3/27 | F3/25 F3/26 | F3/27e | F3/28e F3/29e | F3/30e | F3/31e | F3/27e | F3/28e | F3/29e F3/30e | F3/31e | F3/27Ce | F3/27Ce | ||||
|---|---|---|---|---|---|---|---|---|---|---|---|---|---|---|---|---|---|---|---|---|---|---|---|---|
| (Y bn) | 1Q | 2Q | 3Q | 4Q | 2Qe | 3Qe | 4Qe | 1H | 2H 1He | 2He | NEW | NEW | NEW | NEW | NEW | OLD | OLD OLD | OLD OLD | 1He | 2He | ||||
| Income Statement | ||||||||||||||||||||||||
| Net Sales | 416.2 | 486.6 | 467.5 | 460.6 | 502.3 574.5 | 565.8 | 552.0 | 902.8 | 928.1 1,076.8 | 1,117.8 | 1,743.4 | 1,830.9 | 2,194.6 2,628.3 | 3,104.1 | 3,682.2 | 4,348.3 | 2,044.2 | 2,449.7 | 2,830.5 3,292.2 | 3,860.7 | 1,040.0 | 1,070.0 | 2,110.0 | |
| Gross Profit | 172.7 | 208.2 | 194.9 | 199.1 | 229.9 255.1 | 263.9 | 261.9 | 380.9 | 394.0 | 485.0 525.8 | 717.7 | 774.8 | 1,010.8 | 1,247.5 1,464.7 | 1,747.7 | 2,057.8 | 914.5 | 1,132.8 | 1,287.2 1,474.1 | 1,718.1 | - | - | - | |
| Operating Profit | 61.6 | 103.5 | 37.9 | 78.8 | 98.5 125.0 | 134.5 | 132.8 | 165.1 | 116.7 223.5 | 267.3 | 279.7 | 281.8 | 490.8 | 702.6 | 891.0 | 1,112.0 | 1,350.6 | 431.9 | 624.0 | 754.3 | 889.1 1,068.9 | 202.0 | 228.0 | 430.0 |
| Pretax profit | 62.3 | 112.5 | 49.5 | 84.4 | 109.2 127.0 | 138.0 | 134.8 | 174.8 | 133.9 | 236.3 | 272.8 | 304.4 | 308.6 | 509.0 714.6 | 903.0 | 1,124.0 | 1,362.6 | 442.9 | 636.0 | 766.3 | 901.1 1,080.9 | 216.0 | 235.0 | 451.0 |
| Net Profit | 49.7 | 82.7 | 24.9 | 76.5 | 81.4 95.9 | 104.2 | 101.8 | 132.4 | 101.4 177.3 | 206.0 | 233.8 | 233.8 | 383.2 | 539.5 | 681.8 | 848.6 | 1,028.8 | 334.4 | 480.2 | 578.5 680.3 | 816.1 | 161.0 | 177.0 | 338.0 |
| ROE | - | - | - | - | - | - - | - | - | - - | - | 9.1% | 8.8% | 13.8% | 18.2% | 20.8% | 22.6% | 23.4% | 12.2% | 16.7% | 18.5% 19.6% | 20.8% | - | - | - |
| Average Share Outstanding (Diluted) | - | - | - | - | - | - - | - | - | - | - - | 1,869.3 | 1,831.4 | 1,811.9 | 1,786.3 | 1,769.6 | 1,752.9 | 1,736.3 | 1,801.9 | 1,765.7 | 1,738.5 1,711.2 | 1,683.9 | - | - | - |
| EPS (Diluted, Yen) | - | - | - | - | - | - - | - | - | - | - - | 125.1 | 127.7 211.5 | 302.0 | 385.3 484.1 | 592.5 | 185.6 | 271.9 | 332.8 397.6 | 484.6 | 88.5 | 97.2 | 185.7 | ||
| BPS (Yen) | - | - | - | - | - | - - | - | - | - | - - | 1,380 | 1,484 | 1,559 1,729 | 1,965 2,300 | 2,745 | 1,541 | 1,689 | 1,880 2,138 | 2,485 | - | - | - | ||
| DPS (Yen) | - | - | - | - | - | - - | - | - | - | - - | 57.0 | 65.0 | 70.0 75.0 | 82.0 | 82.0 | 82.0 | 70.0 | 75.0 | 82.0 | 82.0 82.0 | 35.0 | 35.0 | 70.0 |
e=Morgan Stanley Research estimates; Company data; Source: Company data, Morgan Stanley Research
M
Exhibit 26: Murata Mfg: Mid-term forecasts
| (bn JPY, JPY/share) | F3/22 | F3/23 | F3/24 | F3/25 | F3/26 | F3/27 MSe | F3/28 MSe | F3/29 MSe | F3/30 MSe | F3/31 MSe |
|---|---|---|---|---|---|---|---|---|---|---|
| Sales | 1,811.2 | 1,686.8 | 1,640.2 | 1,743.4 | 1,830.9 | 2,194.6 | 2,628.3 | 3,104.1 | 3,682.2 | 4,348.3 |
| Components | 984.3 | 911.2 | 933.8 | 1,033.1 | 1,159.7 | 1,526.1 | 1,838.7 | 2,156.5 | 2,528.1 | 2,918.2 |
| Capacitors | 788.5 | 738.8 | 753.5 | 831.8 | 936.4 | 1,274.5 | 1,577.0 | 1,884.3 | 2,245.0 | 2,623.8 |
| Inductors and EMI Filters | 195.8 | 172.3 | 180.3 | 201.3 | 223.3 | 251.6 | 261.7 | 272.2 | 283.1 | 294.4 |
| Devices/Modules | 815.0 | 761.0 | 695.2 | 697.2 | 656.0 | 653.2 | 776.7 | 934.7 | 1,141.1 | 1,417.0 |
| High Frequency Devices/Communications Module | 528.2 | 453.6 | 440.1 | 443.6 | 394.8 | 377.9 | 453.5 | 544.2 | 653.0 | 783.6 |
| Battery/Power supply | 180.4 | 214.6 | 164.4 | 155.7 | 154.1 | 162.3 | 203.4 | 263.5 | 353.5 | 490.7 |
| Functional Devices | 106.4 | 92.8 | 90.7 | 97.8 | 107.1 | 113.0 | 119.8 | 127.0 | 134.6 | 142.7 |
| Others | 11.9 | 14.7 | 11.2 | 13.1 | 15.2 | 15.3 | 13.0 | 13.0 | 13.0 | 13.0 |
| OP | 424.1 | 297.9 | 215.4 | 279.7 | 281.8 | 490.8 | 702.6 | 891.0 | 1,112.0 | 1,350.6 |
| Components | 355.5 | 280.1 | 234.2 | 275.2 | 315.1 | 501.4 | 671.4 | 834.5 | 1,029.9 | 1,236.3 |
| Devices/Modules | 69.7 | 20.6 | -13.0 | 10.0 | -26.5 | -2.4 | 37.2 | 62.5 | 88.0 | 120.3 |
| Others | -1.2 | -2.8 | -5.7 | -5.4 | -6.8 | -8.2 | -6.0 | -6.0 | -6.0 | -6.0 |
| OPM | 23.4% | 17.7% | 13.1% | 16.0% | 15.4% | 22.4% | 26.7% | 28.7% | 30.2% | 31.1% |
| ROE | 15.0% | 10.9% | 7.3% | 9.1% | 8.8% | 13.8% | 18.2% | 20.8% | 22.6% | 23.4% |
| EPS | 163.7 | 133.8 | 95.7 | 125.1 | 127.7 | 211.5 | 302.0 | 385.3 | 484.1 | 592.5 |
| FCF | 209.2 | 118.4 | 288.1 | 243.8 | 231.4 | 208.5 | 341.2 | 468.1 | 580.4 | 731.8 |
MSe=Morgan Stanley Research estimates; Source: Company data, Morgan Stanley Research
Exhibit 27: Murata Mfg: OP forecasts comparison
Note: Consensus is based on FactSet; Source: Fact Set, Morgan Stanley Research
Murata's share price risk/reward: Even though we raise our earnings estimates for Murata, we lower our DCF-based price target from ¥12,500 to ¥11,000, mainly reflecting an increase in our DCF model's risk-free rate from 2.60% to 3.0%. Murata's share price has fallen 41% year-to-date from its June 22 peak, and we see 53% upside over the next 12-18 months, maintain our OW rating, and designate the stock as our Top Pick in Japan's electronic components industry. The reasons are as follows: (1) We forecast the dollarbased shipment value of MLCCs, where Murata held the top global share of 40% in 2025, to expand at a CAGR of 21% through 2031, with Murata continuing to gradually gain market share. (2) Demand for MLCCs used in AI servers/DCs is likely to continue expanding, and demand for small, high-capacity, high-value-added products, which Murata has brought to market ahead of competitors, should grow substantially. (3) Outside of MLCCs, we look for demand to expand for small, high-value-added products, including secondary batteries for DC BBUs, power modules for vertical power delivery in AI servers, and RF modules for smartphones, and then expand even further as edge AI devices
M
become widespread. (4) In addition to earnings growth, we expect that management's proactive approach to shareholder returns, including share buybacks, will raise capital efficiency and lift ROE.
Bull case ¥14,000, 95% projected upside
In our bull case, we assume higher sales of MLCCs for AI servers/data centers than in our base case, for component sales of 7% higher than our base case, for OP of ¥560.3bn in F3/27, ¥794bn in F3/28, and ¥1.515tn in F3/31. Our forex assumptions and DCF assumptions are the same as for our base case. Bull case fair value corresponds to 58.2x of fully-diluted F3/27 EPS of ¥240.4, 41.1x fully-diluted F3/28 EPS of ¥340.7, and 21.1x fullydiluted F3/31 EPS of ¥664.0.
Bear case ¥3,500
Murata products are used in all kinds of different electronic devices, and they are easily affected by the macro economy and inventory cycle. In our bear case, we assume slower global economic growth rates and lower production of high-end consumer goods like high-end smartphones than in our base case for OP of ¥314.6bn in F3/27, ¥330bn in F3/28, and ¥362.4bn in F3/31. Our forex assumptions and DCF assumptions are the same as in our base case. Here we look for ROE to increase from 8.8% in F3/26 to 9.3% in F3/27 and 9.4% in F3/28, above capital cost of 7.5%. With profit below the market consensus, we assume the share price falls to a P/B of 2.4x.
M
Risk Reward - Murata Manufacturing (6981.T) Risk Reward - Murata Manufacturing (6981.T) Top Pick
We expect AI/DC use value-added MLCC sales and earnings to continue to expand
¥11,000 PRICE TARGET
Derived from our base case and a DCF model, with the following assumptions: 3.0% risk-free rate, 1.39 equity beta, 3.2% risk premium, yielding 7.5% WACC; zero growth from F3/36.
¥9,896
BASE CASE
¥11,000
Derived from DCF
Earnings continue to grow and beat consensus over the medium/long term due to technological advantages & competitiveness, especially in MLCCs.
Assumptions: OP ¥490.8bn in F3/27, ¥702.6bn in F3/28, ¥1,350.6bn in F3/31; FX ¥155/US$, DCF model (see Valuation Methodology); zero growth from F3/36. Base case fair value equates to P/E 52.0x on F3/27e diluted EPS of ¥211.5, 36.4x on F3/28e diluted EPS of ¥302.0 and 18.6x on F3/31e diluted EPS of ¥592.5.
Source: Refinitiv, Morgan Stanley Research
BULL CASE
¥14,000
Derived from DCF
Demand for AI/DC use MLCC is stronger than in the base case. OP assumptions: ¥560.3bn in F3/27, ¥794.0bn in F3/28, ¥1,515bn in F3/31. Same FX & DCF model assumptions as the base case. Bull case fair value equates to P/E of 58.2x on F3/27 diluted EPS of ¥240.4, 41.1x on F3/28 diluted EPS of ¥340.7, and 21.1x on F3/31 diluted EPS of ¥664.0.
OVERWEIGHT THESIS
- ▪
- We expect AI/DC use value-added MLCC sales and earnings expansion to continue..
- ▪
- Expect a significant increase in the total capacitance required for MLCCs in AI/data center applications, alongside continued miniaturization and further increases in capacitance per unit.
- We expect Murata to remain competitive in MLCCs and other products over the long term.
- In F3/27 onward, we expect module earnings to improve as sales of RF modules rise.
New Data Era: Secular Growth:
Positive Positive
BEAR CASE
¥3,500
F3/27e BPS ¥1,486 x P/B 2.4
Murata remains competitive, but fi nal demand for its components is lower than we
envision. OP assumptions: ¥314.6bn in F3/27, ¥330.0bn in F3/28, ¥362.4bn in F3/31. Same FX assumptions as the base case. Assumes ROE moves from 8.8% in F3/26 to 9.3% in F3/27 and 9.4% in F3/28, higher than our capital cost estimate of 7.5%, but with earnings missing market expectations, P/B drops to 2.4x.
M
Risk Reward - Murata Manufacturing (6981.T)
KEY EARNINGS INPUTS
| Drivers | Mar 2026 | Mar 2027e | Mar 2028e | Mar 2029e |
|---|---|---|---|---|
| Components Total OPM (%) | 27.2 | 32.9 | 36.5 | 38.7 |
| Capex (¥, bn) | 247.8 | 253.0 | 250.0 | 250.0 |
| Capacitors Revenue (¥, bn) | 936.4 | 1,274.5 | 1,577.0 | 1,884.3 |
INVESTMENT DRIVERS
- Strength of global manufacturing.
- Over the medium/long term, we think Murata can maintain its tech positioning (MLCC global share of 40%) and increase earnings.
GLOBAL REVENUE EXPOSURE
Source: Morgan Stanley Research Estimate View explanation of regional hierarchies here
MS ALPHA MODELS
3 Month
Horizon
Source: Refinitiv, FactSet, Morgan Stanley Research; 1 is the highest favored Quintile and 5 is the least favored Quintile
RISKS TO PT/RATING
RISKS TO UPSIDE
If total MLCC capacitance in AI/DC applications exceeds our forecast, driving sales of high valueadded MLCCs (smaller, higher capacitance) above our forecasts.
RISKS TO DOWNSIDE
- Since Murata's core products are in all sorts of electronic devices, demand and unit prices could fluctuate widely due to changes in the global economy.
- Slowe MLCC technology innovation.
- We estimate ¥1/$ weakness boosts annual OP by ¥4.5bn.
OWNERSHIP POSITIONING
Inst. Owners, % Active
Source: Refinitiv, Morgan Stanley Research
MS ESTIMATES VS. CONSENSUS
M
SEMCO earnings forecasts
Shawn Kim
AI-driven MLCC growth and pricing to drive sharp earnings acceleration in FY27, with continued growth in FY28
FY26-28 forecasts: We project SEMCO OP of W2.34tn in FY26 (+156% YoY), W5.70tn in FY27 and W8.36tn in FY28, implying further growth of 144% and 47%, respectively. We expect the earnings acceleration to be driven mainly by the Components (MLCC) and Package Solution businesses, while the Optics business remains a relatively modest contributor. In FY27, our projected OP of W5.70tn breaks down as Components W4.56tn, Package Solution W943bn, and Optics W201bn, versus W1.67tn, W510bn, and W165bn, respectively, in FY26. In FY28, we forecast Components OP rising further to W6.55tn, Package Solution to W1.58tn, and Optics to W230bn. As such, we expect SEMCO's consol. OP margin to grow from 8.1% in FY25 to 15.7% in FY26, 24.5% in FY27, and 25.9% in FY28. We maintain the stock as our top pick within our S. Korea Technology coverage.
For Components, we expect profit growth to accelerate as AI-server demand drives both strong MLCC volume growth and a structurally richer product mix. High-end AI MLCC supply remains tight, with lead times exceeding 20 weeks, supply-chain inventories lean following two years of destocking, and book-to-bill at the three high-end suppliers reaching its highest level since the pandemic. Importantly, contract pricing has increasingly been institutionalized through long-term agreements, while the high-end AI MLCC market remains concentrated, with Murata and SEMCO together holding around 85% share. Capacity additions are also unlikely to close the supply-demand gap quickly, as most meaningful new capacity is scheduled for 2027 or later and suppliers are generally targeting only around 10-15% annual output growth. We thus expect tighter supplydemand, higher pricing, and a shift toward high-capacitance, low-ESL AI products to drive Components OP margin from 21.4% in FY26 to 30.9% in FY27 and 30.1% in FY28.
Bull case W3,000,000
Our bull case assumes ABF opportunities from major US CSPs drive stronger content growth, with future ASIC content & volume growth continuing to outpace our base-case expectations. Customer diversification toward non-mobile customers should also reduce earnings volatility and improve profitability. Our bull case, equivalent to 15x FY27e P/B, reflects what we see as an unprecedented super-cycle in the underlying AI-related MLCC and ABF markets.
Bear case W1,350,000
In our bear case, we assume slower content growth in MLCCs and substrates due to greater competition and China's localization, together with prolonged consumer weakness weighing on the Optics business. However, we still expect increasing AI exposure to structurally lift SEMCO's MLCC and ABF ASPs, product mix and margins, given the difficulty commodity suppliers face in penetrating the premium market. Our bear-case value corresponds to 7x FY27e P/B. Key downside risks include a significant pullback in
M
Samsung's mobile flagship cycle, lower SEMCO market share, execution risk in penetrating Chinese smartphone customers, and continued consumer-demand weakness.
M
Risk Reward - Samsung Electro-Mechanics (009150.KS) Risk Reward - Samsung Electro-Mechanics (009150.KS) Top Pick
Dual AI opportunity - ABF and MLCC
W2,620,000 PRICE TARGET
Base case, residual income valuation model. We apply a 10% cost of equity (beta 1.0, equity risk premium of 6.5%, and risk-free rate of 3.5%) and a 5% terminal growth rate. Our base year is 2026 and our forecast period is 2026-36.
W2,384,348
| Consensus Price Target Distribution | W570,000.00 | W3,300,000.00 MS PT |
|---|---|---|
| Source: Refinitiv, Morgan Stanley Research | Morgan Stanley Estimates Mean |
RISK REWARD CHART AND OPTIONS IMPLIED PROBABILITIES (12M)
Key:
Source: Refinitiv, Morgan Stanley Research, Morgan Stanley Institutional Equities Division. The probabilities of our Bull, Base, and Bear case scenarios playing out were estimated with implied volatility data from the options market as of 14 Sep 2026. All figures are approximate risk-neutral probabilities of the stock reaching beyond the scenario price in either three-months' or one-years' time. View explanation of Options Probabilities methodology here
15x 2027E P/B BULL CASE
W3,000,000
ABF opportunities from major US CSPs drive meaningful content growth, and we estimate future ASIC content and volume growth will continue to outpace. Customer diversification into non-mobile companies also lowers earnings volatility and improves profitability. Our bull case implies a 2028e P/B at 15x. We believe this premium is supported by what we view as an unprecedented super-cycle in the underlying industry dynamics.
13x 2027e P/B BASE CASE
W2,620,000
We see a number of catalysts ahead for SEMCO, including a large ABF opportunity in ASIC chip wins, accelerating MLCC growth and FCF inflection. Our long-term conviction in custom silicon opportunities via ABF substrates has grown substantially.
OVERWEIGHT THESIS
- We see long-term improvement in SEMCO's operating profile - multi-layer core ABF capacity sold out from ASIC customers and accelerating AI penetration in MLCC, driving substantial content from rising complexity.
- With the AI computing opportunity and the prospect of a cyclical recovery from 2H26, earnings expectations appear to be lagging significantly based on the current outlook.
- We think the share price will look to discount accelerating EPS estimate revisions.
- Our price target implies 2027e P/B of 13x.
7x 2027e P/B BEAR CASE
W1,350,000
We reflect slower content growth for MLCC and substrates amid competition and China's localization. But AI exposure will structurally increase SEMCO's MLCC and ABF ASP, product mix, and margin with commodity suppliers not easy to penetrate.
M
Risk Reward - Samsung Electro-Mechanics (009150.KS)
KEY EARNINGS INPUTS
| Drivers | Dec 2025 | Dec 2026e | Dec 2027e | Dec 2028e |
|---|---|---|---|---|
| Revenue Growth (%) | 9.9 | 31.5 | 56.7 | 38.6 |
| OPM (%) | 8.1 | 15.7 | 24.5 | 25.9 |
| CAPEX (%) | 8.7 | 14.3 | 9.8 | 10.4 |
INVESTMENT DRIVERS
- AI servers, high-speed networking, Auto 2.0, and smartphone content growth
- Customer diversification away from Samsung Electronics, targeting major CSPs
- MLCC pricing/margin trend
GLOBAL REVENUE EXPOSURE
Source: Morgan Stanley Research Estimate View explanation of regional hierarchies here
MS ALPHA MODELS
3 Month Horizon
Source: Refinitiv, FactSet, Morgan Stanley Research; 1 is the highest favored Quintile and 5 is the least favored Quintile
RISKS TO PT/RATING
RISKS TO UPSIDE
- Price hikes driven by MLCC shortage
- Better-than-expected smartphone demand
- Higher MLCC margin from better yield and product mix
- Strong tailwind from China's consumptionfriendly policies
RISKS TO DOWNSIDE
- Significant pullback in Samsung's mobile flagship product cycle and SEMCO's lower market share
- Execution risk in penetrating Chinese smartphone customers
- Consumer demand headwinds in 2026
OWNERSHIP POSITIONING
Inst. Owners, % Active
84.5%
Source: Refinitiv, Morgan Stanley Research
MS ESTIMATES VS. CONSENSUS
M
Yageo earnings forecasts
Howard Kao
Tightening MLCC Narrative is Unchanged
We forecast CY26 revenue of approximately NT$183B, up 38% y/y, driven primarily by stronger AI-related demand, with a more modest contribution from consumer applications. This demand strength should support broad-based utilization improvement across Yageo's passive component portfolio. Pricing is also turning more favorable, with distributor price increases implemented in 2Q26 and Yageo raising prices for direct customers in 3Q26, as previously highlighted. The combination of higher utilization and firmer pricing should drive meaningful operating leverage. We forecast gross margin expanding to 39.3%, up 310bps y/y, and operating margin reaching 27.4%, up 500bps y/y, supporting EPS of approximately NT$19.79.
Looking into CY27, we expect supply/demand conditions in the mid- and low-end markets to tighten further, sustaining pricing momentum and driving an additional improvement in utilization. We therefore forecast revenue of approximately NT$252B, up 38% y/y. Continued operating leverage should lift gross margin to 43.2%, an increase of 390bps y/y, and operating margin to 33.4%, up 600bps y/y, resulting in EPS of approximately NT$32.11.
Why has the stock been so volatile?
Yageo benefited from a sharp increase in MLCC pricing in 2Q26, driven by a temporary spike in spot-market demand. In our view, ODM/EMS customers accelerated inventory replenishment amid concerns that the ramp in high-end AI-server MLCC demand, particularly alongside Nvidia's Vera Rubin platform, could constrain supply of mid- and low-end MLCCs. Under normal market conditions, these customers typically carry only 3-4 weeks of inventory. However, supply concerns prompted a rapid increase in inventory coverage to approximately 4-6 months .
During this restocking phase, ODM/EMS customers sourced MLCCs from both manufacturers, including Yageo, and distributors. The resulting demand surge drove a sharp increase in spot/distributor pricing and also contributed to the stock's strong performance. However, the pricing move was largely driven by a one-off inventory build. Once customers had secured sufficient inventory, purchasing activity normalized and spot pricing began to soften. This, together with weaker broader market sentiment, led to a pullback of ~50% from the stock's peak of approximately NT$1,140.
At the current share price, however, we believe the risk-reward has become attractive. The underlying fundamentals, and, importantly, our view of the MLCC upcycle, remain intact. Our analysis indicates substantial incremental demand for high-end, high-capacitance MLCCs of 47µF and above, which will require a meaningful increase in dedicated production capacity. We expect this to drive further capacity conversion toward high-end MLCCs, with the resulting crowding-out effect becoming more visible from late CY26 into early CY27. This should progressively tighten supply in the mid- and low-end MLCC market and provide renewed support for pricing.
cxmlbl 4. Tayeo. Cammlyo Eotmmates ullanlye
2026e Earnings Estimates
NTS mn
Net sales
COGS
2028e Earnings Estimates
New
Old
Variance
306,659
Old
New
Variance
182,769
182,769
0%
2027e Earnings Estimates
New
Old
Variance
251,501
251,501
0%
M
Income tax
Net income
EPS (NT$)
Margins (%)
Gross margin
Operating margin
Pre-tax margin
Net margin
-11,428
40,652
19.79
39.3%
27.4%
28.6%
22.2%
-11,660
20.21
41,505
39.6%'
27.7%'
29.2%'
22.7%'
-2%
-2%
-2%
ppt
-0.3
-0.3
-0.6
-19,614
65,937
32.11
43.2%
33.4%
34.1%
-0.5
26.2%
cnta tineman Сал, Палалельі
-20,891
306,659
-157,970
148,688
121,225
-27,463
3,844
125,069
-28,687
0%
5%
-5%
-1%
-6%
-52%
-7%
-7%
-6%
-26,581
Exhibit 28: Yageo vs TAIEX YTD share price performance (%)
Yageo vs. TAIEX YTD performance
39.5%
ppt
3.6
46.1%
48.5%
-2.4
Source: Company data, Morgan Stanley Research.
Earnings Estimates Change
We have fine-tune our model, which drives our CY26-28 EPS reductions by 2%, 6%, and 7% respectively.
Exhibit 29: Yageo: Earnings Estimates Change
e=Morgan Stanley Research estimates; Source: Company data, Morgan Stanley Research
Price Target Discussion and Valuation Methodology
We lower our 12-month price target to NT$1,050 (from NT$1,465): This reflects our lower earnings estimates for CY26-28. Our price target is our base case value, derived from our residual income valuation model. Similar to our analysis of other tech hardware companies within our coverage, we think this methodology provides the most accurate value of the firm by taking into account the cost of equity.
Our key assumptions are:
- Cost of equity of 7.8%:
- ° Risk-free rate of 1.0% (10-year Taiwanese government bond yield);
- ° Equity risk premium of 6.8%;
- ° Beta of 1.1;
cambiol. layeu. Quattelly calmiyo coultaleo
1Q25
2Q25
Net sales
COGS
Total Equity
Net Profit
Gross profit
SG&A
Beta
R&D
Cost of Equity
2029E
352,983
99,850
2030E
404,905
111,832
2028E
306,624
89,152
2031E
463,058
125,252
2026E
32,771
(21,119)
217,162
40,652
2027E
257,880
65,937
2025
2032E
2033E
132,930
(84,800)
528,189
140,283
601,136
2034E
2026E
182,769
682,837
(110,968)
48,130
157,117
2035E
2027E|
251,501
(142,878)
175,971
71,801
M
Spread
Investment income
Disposal of investment
Beginning Equity Capital
PV of Forecast Period
Exchange gain
Other
Pre-tax income
Equity Value
PV of Continuing Value
No. of Shares
Income tax
Projected Price
Implied 2027e PE
Minority interest
Net income
Adj.wtd.avg.shrs (mn)
Implied 2028e PE
EPS
Fully Diluted shares (mn)
Diluted EPS (NTS)
Margins (%)
Operating Margin
Gross Margin
Pretax Margin
Net Margin
QoQ Growth (%)
Sales
Gross Profit
Operating Profit
Pretax Profit
Net Profit
YoY Growth (%)
Sales
Gross Profit
Pretax Profit
35.6
21.5
21.4
15.3
5
No un
-10
4
in co 0s
13.0%
24
217,162
582,581
1,356,663
2,156,406
2.054
1,050.0
14
33x
0
39
24x
36.2
22.9
24.8
19.2
1
7
17
27
7
14
15
117
100
(148)
108
7,173
(1,610)
33
5,530
2,053
2.69
2,459
2.25
35.6
20.8
23.1
17.8
4
11
20
15
49
9
15
31
18
20.0%
23.8%
56
37.3
24.3
24.2
18.8
9
12
15
20
35
63
39
21
Operating Profit
Net Profit
-8
13
82
CAurAs. CAmpanu Anta MArMAn CtAnlAr DaGnarAh. COllArMAn @
22.5%
0
38.5
26.4
27.5
21.2
18
22
18
18
36
47
67
74
88
21.8%
21.1%
0
38
39.6
22.5
47
61
80
71
72
20.5%
2036E
2028E
306,659
(165,373)
859,089
203,000
141,286
(27,229)
24.9%
(22,876)
6.8%
1.0
(4,354)
114.057
1.0%
1,828
7.8%
774,341
197,087
27.1%
108,623
(24,729)
27.4%
1.0
(20,687)
6.8%
1.0
6.8%
1.0%
7.8%
2,121
118,125
(4,042)
83,894
7.8%
1.0%
1,809
19.7%
131,723
19.3%
132,378
1,339
1,382
1,382
- Medium-term growth rate of 12% (down from 16%); 827 827 846
20.1%
17.1%
- Terminal growth rate of 3%. 0 0
52,231
85,703
(11,428)
(19,614)
115.885
(26,581)
Our price target implies 33x 2027e P/E and 24x 2028e P/E. These are above its five-year historical range of 8x to 18x, which we view as justified considering its longer-term transformation story to become a global total solutions provider, moving from passive into active components. In addition, compared to global passive component peers, we believe Yageo stock remains undervalued with higher ROE and margins but lower P/E vs. Japanese peers (which trade on an average at 40x+ P/E). 152
Our bull and bear case scenario values decrease by magnitudes similar to the change to our base case value, to NT$1,490 and NT$480, respectively.
Exhibit 30: Yageo: Residual Income (RI) Model
| 43 9 | 38 |
|---|---|
| 56 | 51 |
| 73 | 67 |
| 79 82 | 64 62 |
E=Morgan Stanley Research estimates; Source: Morgan Stanley Research
Exhibit 31: Yageo: Quarterly earnings estimates
Source: Company data, Morgan Stanley Research; E=Morgan Stanley Research estimates.
31,104
(20,018)
7
37
38.1
25.2
27.1
21.0
19
19
23
31
49
44
45
Sxmbll oc. layeu. vunloumluateu l matlulat vurtlllal
Consolidated Income Statement
NTSmn (Year End Dec 31)
2025
Net sales
COGS
Gross profit
Interest income
2026E
182,769
(110,968)
2028E|
306,659
(165,373)
132,930
(84,800)
2027E
251,501
(142,878)
Consolidated Cash Flow Statement
NTSmn (Year End Dec 31)
2025
Operating Cashflow
Net Profits
30,863
23,634
2026E|
45,519
40,652
M
Disposal of investment
Exchange gain
Other
Pre-tax income
Income tax
Minority interests
Net income
Adj. wtd. Avg. shrs (m)
Reported EPS (NTS)
Diluted shrs (m)
Diluted EPS (NTS)
Consolidated Balance Sheet
NTSmn (Year End Dec 31)
Cash
Mkt securities
AR/NR
Inventory
Others
Current Assets
Long-term investments
Fixed assets
Other assets
Total Assets
S/T borrowings
AP/NP
Other ST liabilities
Total Current Liabilities
UT debt
Other LT libilities
Total Liabilities
Common shares
Retained Earnings
Other SH' Equity
Total Shareholders' Equi
100
(742)
(90)
31,120
(7,343)
143
23,634
2,053
11.51
2,053|
11.51
2025
81,473
16,634
27,792
31,636
7,811
165,346
45,572
65,305
114,566
390,789
86,196
18,031
31,852
136,079
57,589
23,124
216,793
5,182
104,669
64,145
173,997
Total Liab./SH's Equity
390,789
Амкак соа лемок Сакіли ВАлАлелЬ. СеЛАлемокІ
7
(333)
280
52,231
(11,428)
151
40,652
2,054
19.79
2,054
19.79
Change of L/T investment
(4,146)
2028E
87,035
89,152
8,866
(846)
(6,896)
(3,241)
(6,920)
(8,000)
0
Exhibit 32: Yageo: Consolidated Financial Summary
Financing Cashflow
Increase in L/T debt
Increase in S/T debt
Issuance of stock
Cash dividends
Other adjustments
FX adjustment
Net change in cash
Consolidated Financial Ratios
Margins (%)
Gross margin
Operating margin
Pretax margin
Net margin
YoY growth (%)
Sales
Operating profits
Pretax profits
Net profits
Others
Cash dividend payout (%)
Cash div (NTS) |
Yield (%)
Net Debt/Equity (%)
Liabilities/Equity (%)
Liabilities/Assets (%)
ROAE (%)
ROAA (%)
AR/NR Turnover (days)
Inventory Turnover (days)
AP/NP Turnover (days)
(400)
115,885
(26,581)
152
89,152
2,054
43.41
2,054
43.41
2028E
224,649
16,634
59,743
59,653
18,019
378,698
45,572
59,197
114,566
598,034
86,196
35,164
62,115
183,476
54,589
53,346
291,411
20,519
221,959
64,145
306,624
598,034
Cash conversion cycle
…TAnininnnhr
| (3,135) 10,685 (1,000) (13,435) (1,000) (30,967) (1,000) | (3,135) 10,685 (1,000) (13,435) (1,000) (30,967) (1,000) | (3,135) 10,685 (1,000) (13,435) (1,000) (30,967) (1,000) | (3,135) 10,685 (1,000) (13,435) (1,000) (30,967) (1,000) | (3,135) 10,685 (1,000) (13,435) (1,000) (30,967) (1,000) |
|---|---|---|---|---|
| (543) 7,613 | ||||
| 0 | ||||
| 0 | 15,337 | 0 | ||
| (10,265) | (12,322) | (24,392) | (39,562) | |
| 61 | 8,670 | 11,957 | 9,595 | |
| (3,647) | 333 | 49,147 | ||
| 20,356 | 49,180 | 44,848 | ||
| 2025 | ||||
| 36.2 | ||||
| 9.3 | ||||
| 27.4 15.8 | ||||
| 52% NNT MHEE MEEEE AUESSITIÕ H9EE YOSEE | 52% NNT MHEE MEEEE AUESSITIÕ H9EE YOSEE | 52% NNT MHEE MEEEE AUESSITIÕ H9EE YOSEE | 52% NNT MHEE MEEEE AUESSITIÕ H9EE YOSEE | 52% NNT MHEE MEEEE AUESSITIÕ H9EE YOSEE |
| 6.00 1% | ||||
| 6% | ||||
| 68 128 |
Source: Company data, Morgan Stanley Research; E=Morgan Stanley Research estimates.
(827)
(840)
(400)
85,703
(19,614)
152
65,937
2,054
32.11
2,054
32.11
2027E
65,397
65,937
9,163
(827)
(4,837)
(4,039)
(7,114)
(8,000)
M
Risk Reward - Yageo Corp. (2327.TW) Risk Reward - Yageo Corp. (2327.TW)
Demand looks stronger and price increases appear likely - stay OW
NT$1,050.00 PRICE TARGET
Base case, multistage residual income valuation model. Key assumptions: cost of equity 7.8% (risk-free rate 1%, equity risk premium 6.8% and beta of 1.1), medium-term growth rate 12%, terminal growth rate 3%.
NT$1,129.50
Morgan Stanley Estimates
Mean
Consensus Price Target Distribution
NT$740.00
NT$1,465.00
Source: Refinitiv, Morgan Stanley Research
MS PT
Source: Refinitiv, Morgan Stanley Research
BULL CASE
NT$1,490.00
34x 2028e EPS
Demand continues to grow faster than
expected in 2027-28: 1) Demand improves significantly, driving pricing power for Yageo in premium and standard products alike. 2) Yageo makes meaningful progress into AI, driving significant share gains. 3) Yageo takes on more acquisition initiatives to further widen its product portfolio. 4) Severe undersupply leads to continued price hikes for an extended period of time, which helps expand Yageo's margins in 2027-28.
BASE CASE
NT$1,050.00
24x 2028e EPS
Demand remains strong into 2027-28: 1)
Utilization remains high for premium products. 2) Utilization for standard products stabilizes at 70%+ with resilient consumer tech demand. 3) Transformation and synergies are ongoing with continued active initiatives. 4) Yageo continues to drive expansion into the AI realm and slowly gains market share. 5) High utilization rates and inflationary raw material costs result in continued price hikes.
OVERWEIGHT THESIS
- There is fear that leading Japanese and Korean MLCC suppliers are shifting more capacity to cater to the high end, resulting in undersupply for the midrange/low end.
- The same narrative that drove the 2018 cycle is now back in play.
- Utilization rates are increasing, so suppliers are expecting price hikes for the midrange/low end. Distributors and ODMs are both building inventory.
- AI demand is growing and tantalum capacitor pricing may show further price increases in 2H.
- All of this should help support a re-rating in the stock.
Risk Reward Themes
Electric Vehicles:
Positive
Self-help:
Positive
Special Situation:
Positive
View descriptions of Risk Rewards Themes here
BEAR CASE
11x 2028e EPS
Earnings erode as macro conditions weaken and demand falls again in 2027-28: 1) Non-AI demand weakens from 2H26 onward, despite AI demand remaining strong. 2) Pricing power shifts to end customers with heightened competition among peers. 3) Acquisitions do not bear fruit, resulting in layoffs and leading to cost burdens. 4) Automotive and industrial end demand does not recover, hampering Yageo's premium business. 5) Yageo does not make any material advancements into AI.
NT$480.00
M
Risk Reward - Yageo Corp. (2327.TW)
KEY EARNINGS INPUTS
| Drivers | Dec 2025 | Dec 2026e | Dec 2027e | Dec 2028e |
|---|---|---|---|---|
| MLCC ASP y/y (%) | 0.6 | 24.3 | 65.3 | 14.9 |
| MLCC GM (%) | 31.7 | 36.4 | 43.6 | 47.2 |
| r-chip ASP y/y (%) | 0.8 | 11.8 | 47 | 27.3 |
| r-chip GM (%) | 43.4 | 45.5 | 50.3 | 53.4 |
INVESTMENT DRIVERS
- Transformation into global total solutions service provider
- Premium/standard sales mix
- Utilization rates and capacity
- Inventory and pricing
GLOBAL REVENUE EXPOSURE
Source: Morgan Stanley Research Estimate View explanation of regional hierarchies here
MS ALPHA MODELS
3 Month Horizon
Source: Refinitiv, FactSet, Morgan Stanley Research; 1 is the highest favored Quintile and 5 is the least favored Quintile
RISKS TO PT/RATING
RISKS TO UPSIDE
- Faster-than-expected revenue/profit recognition from stronger AI server/notebook demand
- Further price hikes led by stronger pricing power arising from better demand and/or tighter supply
RISKS TO DOWNSIDE
- A sudden bursting of demand for AI
- Inventory risk
- Consumer electronics demand risk
OWNERSHIP POSITIONING
Inst. Owners, % Active
70.4%
Source: Refinitiv, Morgan Stanley Research
MS ESTIMATES VS. CONSENSUS
M
Taiyo Yuden earnings forecasts
We expect expect record profit in F3/29, not F3/28; upgrade the stock from UW to EW
Full-term F3/27 and F3/28 earnings forecasts, F3/27 2Q forecasts: We project F3/27 OP of ¥45.1bn (guidance ¥45bn, FactSet consensus ¥42bn), up +¥25.1bn YoY. We expect sales in dollars of core product capacitors (MLCCs) to increase +22.6% YoY (+27.4% on yen basis), a continued increase following on FY3/26's +10.4% rise (+8.5% on yen basis), and higher utilization rates absorbing increased depreciation expense and other fixed cost increases. We project F3/28 OP of ¥66.1bn (consensus ¥73.1bn), up +¥25bn YoY. We look for sales in dollars of capacitors (MLCCs) to rise +17.3% YoY (+16.6% on a yen basis), absorbing increased depreciation expense and other fixed cost increases. We expect OP to rise ¥83.8bn in F3/29 (consensus ¥107.1bn), surpassing the historical high profit of ¥68.2bn in F3/22.
We project 2Q OP of ¥12.6bn (consensus ¥11bn), up +¥7.8bn from ¥4.8bn in 1Q. We look for MLCC sales to rise +18.1% compared with 1Q and for the utilization rate to rise from 85% in 1Q to 95% in 2Q. With increased sales of inductors for North American smartphones, there should be a major profit increase on 1Q.
Exhibit 33: Taiyo Yuden: Earnings forecast changes
| F3/26 | F3/27 | F3/26 F3/27 | F3/25 F3/26 | F3/27e | F3/25 F3/26 | F3/27 |
|---|---|---|---|---|---|---|
Note: e=Morgan Stanley Research estimates; Source: Company data, Morgan Stanley Research
Exhibit 34: Taiyo Yuden: Mid-term forecasts
| (bn JPY, JPY/share) | F3/20 | F3/21 | F3/22 | F3/23 | F3/24 | F3/25 | F3/26 | F3/27 | F3/28 | F3/29 | F3/30 | F3/31 |
|---|---|---|---|---|---|---|---|---|---|---|---|---|
| MSe | MSe | MSe | MSe | MSe | ||||||||
| Sales | 282.3 | 300.9 | 349.6 | 319.5 | 322.6 | 341.4 | 355.3 | 428.7 | 486.0 | 558.4 | 630.0 | 686.6 |
| Capacitor | 176.5 | 195.2 | 230.4 | 208.1 | 205.8 | 232.1 | 251.8 | 320.8 | 374.3 | 441.6 | 507.9 | 558.7 |
| Inductor | 38.8 | 41.6 | 48.9 | 52.9 | 55.6 | 61.5 | 64.3 | 70.2 | 72.2 | 77.3 | 82.7 | 88.4 |
| Complex devices | 49.8 | 46.9 | 48.8 | 32.6 | 34.9 | 23.0 | 14.8 | 12.1 | 14.5 | 14.5 | 14.5 | 14.5 |
| Others | 17.3 | 17.2 | 21.5 | 25.9 | 26.3 | 24.8 | 24.5 | 25.6 | 25.0 | 25.0 | 25.0 | 25.0 |
| OP | 37.2 | 40.8 | 68.2 | 32.0 | 9.1 | 10.5 | 20.0 | 45.1 | 66.1 | 83.8 | 98.3 | 107.7 |
| OPM | 13.2% | 13.5% | 19.5% | 10.0% | 2.8% | 3.1% | 5.6% | 10.5% | 13.6% | 15.0% | 15.6% | 15.7% |
| ROE | 8.7% | 12.6% | 20.0% | 7.5% | 2.6% | 0.7% | 4.5% | 8.5% | 11.6% | 13.6% | 14.4% | 14.2% |
| EPS | 142.7 | 227.3 | 432.2 | 185.7 | 63.5 | 16.1 | 107.6 | 218.3 | 318.5 | 408.6 | 482.0 | 530.1 |
| FCF | 11.6 | 10.7 | 16.7 | 2.1 | -31.7 | -29.6 | 32.4 | 36.7 | 19.1 | 24.8 | 23.2 | 51.1 |
Note: MSe=Morgan Stanley Research estimates; Source: Company data, Morgan Stanley Research
M
Note: Consensus is based on FactSet; Source: Fact Set, Morgan Stanley Research
Taiyo Yuden share price risk/reward: We upgrade Taiyo Yuden from UW to EW, as we believe its share price, having fallen 56.0% from its July 1 peak, has limited downside risk and offers 6% upside over the next 12-18 months. We lower our DCF-based price target from ¥12,500 to ¥10,500. This mainly reflects an increase in the DCF model's risk-free rate from 2.60% to 3.0%. We rate the stock EW rather than OW because: (1) In its core MLCC business, we estimate Taiyo Yuden's MLCC market share was 11.3% in 2025, down from 12.7% in 2020, and we think this downtrend continued into 2026, with its market share shrinking to 10.7% in 1Q and 9.9% in 2Q. (2) We believe Taiyo Yuden is lagging behind Murata (No. 1 share) and SEMCO (No. 2) in small, high-capacity MLCCs for AI server accelerator boards, where demand is rapidly expanding. (3) We expect consensus estimates for F3/28 onward to be revised down after 2Q results.
Bull case ¥14,000, 49% projected upside
In our bull case, F3/27 sales of MLCCs for AI servers/data centers are 7% higher than in our base case, for OP of ¥56.5bn in F3/27, ¥85.5bn in F3/28, and ¥176.3bn in F3/31. Our forex assumptions and DCF assumptions match our base case. Bull case fair value corresponds to 50.7x our fully-diluted F3/27 EPS estimate of ¥276.1, 33.6x our fully-diluted F3/28 EPS estimate of ¥417.0, and 15.9x our full-diluted F3/31 EPS estimate of ¥879.1.
Bear case ¥4,500
Taiyo Yuden's care products (MLCCs and inductors) are used in all kinds of electronic devices, and are easily affected by the macro economy and inventory cycle. In our bear case, we assume slower global economic growth rates and lower production of high-end consumer goods like high-end smartphones than in our base case, for OP of ¥39.2bn in F3/27, ¥56.1bn in F3/28, and ¥65.8bn in F3/31. Our forex assumptions and DCF assumptions are the same as in our base case. Here we look for ROE of 7.3% in F3/27 and 10.1% in F3/28, improving to a level above capital cost of 7.9%. With profit below market expectations, we assume the share price falls to a P/B of 1.8x.
M
Risk Reward - Taiyo Yuden (6976.T) Risk Reward - Taiyo Yuden (6976.T)
Share price has fallen, but upside potential likely to remain limited
¥10,500 PRICE TARGET
EQUAL-WEIGHT THESIS
Source: Refinitiv, Morgan Stanley Research
BULL CASE
Derived from DCF
MLCC sales exceed the base case. OP ¥56.5bn in F3/27, ¥85.5bn in F3/28, ¥176.3bn in F3/31. Same FX & DCF model assumptions as the base case. Fair value equates to P/E 50.7x on F3/27e diluted EPS of ¥276.1, 33.6x on F3/28e diluted EPS of ¥417.0, and 15.9x on F3/31e diluted EPS of ¥879.1.
¥14,000
BASE CASE
Derived from DCF
Earnings are expanding driven by growth in MLCC sales, but market expectations appear overly high : OP ¥45.1bn in F3/27, ¥66.1bn in F3/28, ¥107.7bn in F3/31. FX assumption: ¥155/US$. Base case fair value equates to P/E 48.1x on F3/27e diluted EPS of ¥218.3, 33.0x on F3/28e diluted EPS of ¥318.5, and 19.8x on F3/31e diluted EPS of ¥530.1.
¥10,500
BEAR CASE
¥4,500
F3/27e diluted BPS ¥2,552 x P/B 1.8
Stays competitive in core products, but slowing end demand drags pro fi ts down. OP
¥39.2bn in F3/27, OP ¥56.1bn in F3/28, ¥65.8bn in F3/31. Same FX and DCF assumptions as in the base case. ROE 7.3% in F3/27, 10.1% in F3/28, improving from 4.5% in F3/26 and higher in F3/28 than cost of capital (7.9%), but with earnings lower than market expectation, P/B falls to 1.8x.
M
Risk Reward - Taiyo Yuden (6976.T)
KEY EARNINGS INPUTS
| Drivers | Mar 2026 | Mar 2027e | Mar 2028e | Mar 2029e |
|---|---|---|---|---|
| Total Operating Profit (¥, bn) | 20 | 45 | 66 | 84 |
| Capacitors Sales YoY (%) | 8.5 | 27.4 | 16.6 | 18 |
| Complex Devices Sales YoY (%) | (35.6) | (18.3) | 19.9 | 0 |
| SG&A Expenses (¥, bn) | 61.9 | 67.9 | 69.6 | 71.8 |
| Capex (¥, bn) | 40.4 | 42.0 | 60 | 60 |
INVESTMENT DRIVERS
- Continuing tech advances via smaller/highercapacitance MLCCs, and Taiyo Yuden's strong tech competitiveness.
- We expect sales of premium MLCCs for AI/data center applications to remain limited.
GLOBAL REVENUE EXPOSURE
Source: Morgan Stanley Research Estimate View explanation of regional hierarchies here
MS ALPHA MODELS
5/5 MOST
3 Month Horizon
Source: Refinitiv, FactSet, Morgan Stanley Research; 1 is the highest favored Quintile and 5 is the least favored Quintile
RISKS TO PT/RATING
RISKS TO UPSIDE
- Increase in premium MLCC sales for AI/DC use.
- Power inductor sales for 5G handsets and others grow steeper than expected.
RISKS TO DOWNSIDE
- We estimate a ¥1/US$ depreciation affects annual OP increases by ¥0.9bn.
- Since MLCCs are fitted in various electronic devices, demand depends to some extent on the rate of global economic growth, and prices can swing widely depending on supply/demand balances.
OWNERSHIP POSITIONING
Inst. Owners, % Active
80.5%
Source: Refinitiv, Morgan Stanley Research
MS ESTIMATES VS. CONSENSUS
M
Risk Reward Reference links
- View explanation of Options Probabilities methodology -
Options_Probabilities_Exhibit_Link.pdf
-
View descriptions of Risk Rewards Themes - RR_Themes_Exhibit_Link.pdf
-
View explanation of regional hierarchies - GEG_Exhibit_Link.pdf
-
View explanation of Theme/Exposure methodology -
-
ESG_Sustainable_Solutions_External_Link.pdf
-
View explanation of HERS methodology - ESG_HERS_External_Link.pdf
M
Disclosure Section
The information and opinions in Morgan Stanley Research were prepared by Morgan Stanley MUFG Securities Co., Ltd. and its affiliates (collectively, "Morgan Stanley").
For important disclosures, stock price charts and equity rating histories regarding companies that are the subject of this report, please see the Morgan Stanley Research Disclosure Website at www.morganstanley.com/eqr/disclosures/webapp/generalresearch, or contact your investment representative or Morgan Stanley Research at 1585 Broadway, (Attention: Research
Management), New York, NY, 10036 USA.
For valuation methodology and risks associated with any recommendation, rating or price target referenced in this research report, please contact the Client Support Team as follows: US/Canada +1 800 303-2495; Hong Kong +852 2848-5999; Latin America +1 718 754-5444 (U.S.); London +44 (0)20-7425-8169; Singapore +65 6834-6860; Sydney +61 (0)2-9770-1505; Tokyo +81 (0)3-6836-9000. Alternatively you may contact your investment representative or Morgan Stanley Research at 1585 Broadway, (Attention: Research Management), New York, NY 10036 USA.
Analyst Certification
The following analysts hereby certify that their views about the companies and their securities discussed in this report are accurately expressed and that they have not received and will not receive direct or indirect compensation in exchange for expressing specific recommendations or views in this report: Sota Harashima; Cindy Huang; Howard Kao; Shawn Kim; Duan Liu; Shoji Sato.
.
Global Research Conflict Management Policy
Morgan Stanley Research has been published in accordance with our conflict management policy, which is available at www.morganstanley.com/institutional/research/conflictpolicies. A Portuguese version of the policy can be found at www.morganstanley.com.br
Important Regulatory Disclosures on Subject Companies
As of August 31, 2026, Morgan Stanley beneficially owned 1% or more of a class of common equity securities of the following companies covered in Morgan Stanley Research: Murata Manufacturing, Samsung Electro-Mechanics, Taiyo Yuden, Yageo Corp..
Within the last 12 months, Morgan Stanley has received compensation for investment banking services from Yageo Corp..
In the next 3 months, Morgan Stanley expects to receive or intends to seek compensation for investment banking services from Murata Manufacturing, Taiyo Yuden, Yageo Corp..
Within the last 12 months, Morgan Stanley has received compensation for products and services other than investment banking services from Yageo Corp..
Within the last 12 months, Morgan Stanley has provided or is providing investment banking services to, or has an investment banking client relationship with, the following company: Murata Manufacturing, Yageo Corp..
Within the last 12 months, Morgan Stanley has either provided or is providing non-investment banking, securities-related services to and/or in the past has entered into an agreement to provide services or has a client relationship with the following company: Yageo Corp..
The equity research analysts or strategists principally responsible for the preparation of Morgan Stanley Research have received compensation based upon various factors, including quality of research, investor client feedback, stock picking, competitive factors, firm revenues and overall investment banking revenues. Equity Research analysts' or strategists' compensation is not linked to investment banking or capital markets transactions performed by Morgan Stanley or the profitability or revenues of particular trading desks.
Morgan Stanley and its affiliates do business that relates to companies/instruments covered in Morgan Stanley Research, including market making, providing liquidity, fund management, commercial banking, extension of credit, investment services and investment banking. Morgan Stanley sells to and buys from customers the securities/instruments of companies covered in Morgan Stanley Research on a principal basis. Morgan Stanley may have a position in the debt of the Company or instruments discussed in this report. Morgan Stanley trades or may trade as principal in the debt securities (or in related derivatives) that are the subject of the debt research report.
Certain disclosures listed above are also for compliance with applicable regulations in non-US jurisdictions.
STOCK RATINGS
Morgan Stanley uses a relative rating system using terms such as Overweight, Equal-weight, Not-Rated or Underweight (see definitions below). Morgan Stanley does not assign ratings of Buy, Hold or Sell to the stocks we cover. Overweight, Equal-weight, Not-Rated and Underweight are not the equivalent of buy, hold and sell. Investors should carefully read the definitions of all ratings used in Morgan Stanley Research. In addition, since Morgan Stanley Research contains more complete information concerning the analyst's views, investors should carefully read Morgan Stanley Research, in its entirety, and not infer the contents from the rating alone. In any case, ratings (or research) should not be used or relied upon as investment advice. An investor's decision to buy or sell a stock should depend on individual circumstances (such as the investor's existing holdings) and other considerations.
Global Stock Ratings Distribution
(as of August 31, 2026)
The Stock Ratings described below apply to Morgan Stanley's Fundamental Equity Research and do not apply to Debt Research produced by the Firm.
For disclosure purposes only (in accordance with FINRA requirements), we include the category headings of Buy, Hold, and Sell alongside our ratings of Overweight, Equal-weight, Not-Rated and Underweight. Morgan Stanley does not assign ratings of Buy, Hold or Sell to the stocks we cover. Overweight, Equal-weight, Not-Rated and Underweight are not the equivalent of buy, hold, and sell but represent recommended relative weightings (see definitions below). To satisfy regulatory requirements, we correspond Overweight, our most positive stock rating, with a buy recommendation; we correspond Equal-weight and Not-Rated to hold and Underweight to sell recommendations, respectively.
M
| Coverage Universe | Coverage Universe | Investment Banking Clients (IBC) | Investment Banking Clients (IBC) | Investment Banking Clients (IBC) | Other Material Investment Services Clients (MISC) | Other Material Investment Services Clients (MISC) | |
|---|---|---|---|---|---|---|---|
| Stock Rating Category | Count | %of Total | Count | %of Total IBC | %of Rating Category | Count | %of Total Other MISC |
| Overweight/Buy | 1555 | 42% | 450 | 48% | 29% | 767 | 44% |
| Equal-weight/Hold | 1577 | 43% | 395 | 42% | 25% | 770 | 44% |
| Not-Rated/Hold | 3 | 0% | 1 | 0% | 33% | 1 | 0% |
| Underweight/Sell | 559 | 15% | 93 | 10% | 17% | 216 | 12% |
| Total | 3,694 | 939 | 1754 |
Data include common stock and ADRs currently assigned ratings. Investment Banking Clients are companies from whom Morgan Stanley received investment banking compensation in the last 12 months. Due to rounding off of decimals, the percentages provided in the "% of total" column may not add up to exactly 100 percent.
Analyst Stock Ratings
Overweight (O). The stock's total return is expected to exceed the average total return of the analyst's industry (or industry team's) coverage universe, on a risk-adjusted basis, over the next 12-18 months.
Equal-weight (E). The stock's total return is expected to be in line with the average total return of the analyst's industry (or industry team's) coverage universe, on a risk-adjusted basis, over the next 12-18 months.
Not-Rated (NR). Currently the analyst does not have adequate conviction about the stock's total return relative to the average total return of the analyst's industry (or industry team's) coverage universe, on a risk-adjusted basis, over the next 12-18 months.
Underweight (U). The stock's total return is expected to be below the average total return of the analyst's industry (or industry team's) coverage universe, on a risk-adjusted basis, over the next 12-18 months.
Unless otherwise specified, the time frame for price targets included in Morgan Stanley Research is 12 to 18 months.
Analyst Industry Views
Attractive (A): The analyst expects the performance of his or her industry coverage universe over the next 12-18 months to be attractive vs. the relevant broad market benchmark, as indicated below.
In-Line (I): The analyst expects the performance of his or her industry coverage universe over the next 12-18 months to be in line with the relevant broad market benchmark, as indicated below. Cautious (C): The analyst views the performance of his or her industry coverage universe over the next 12-18 months with caution vs. the relevant broad market benchmark, as indicated below. Benchmarks for each region are as follows: North America - S&P 500; Latin America - relevant MSCI country index or MSCI Latin America Index; Europe - MSCI Europe; Japan - TOPIX; Asia relevant MSCI country index or MSCI sub-regional index or MSCI AC Asia Pacific ex Japan Index.
Stock Price, Price Target and Rating History (See Rating Definitions)
18000
16000
14000
12000
10000
8000
6000
Murata Manufacturing (6981.T) - As of 09/15/26 GMT in JPy
Industry : Electronic Components
M
328% 000100
09/01
2023
Stock and Industry Ratings cabbrevigtions belowd appear as + Stock Rating/Industry View
125 0 0
Stock Ratings: Quernight coo Equal-wight dE) Underusight duD Not-Rated iNRo No Rating Huailable iNAD
Industry View: Attractine dAD In-line tI) Caut ious No Rating Effective January 13, 2014, the stocks covered by Morgan Stanley Pacific will be rated relative to the analyst's industry or industry tear's? coverage. Effective January 15, 2014, the industry view benchmarks for Morgan Stanley Asia Pacifie are as follous: releuant MSCI country index or MSCI sub-regional index or MSCI AC Asia Pacific ex Japan Index.
-
EVI
-
0./I
4 0 0 0000
3500000
3000000
2500000
2000000
1500000
1000000
500000
2029
Stock Price (Not. Cougned by Current. Analysto Stock Price (Covered by Current Analyst i m
Samsung Electro-Mechanics (009150.KS) - As of 09/15/26 GMT in KRW
Industry : S. Korea Technology
M
2620000
2560000
Stock and Industry Ratings abbreviations belowd appear as + Stock Rating/Industry View Stock Ratings: Queruzight co0 Equal-weight dE! Underweight dUs Not-Rated INR. No Rating Available iNA
Industry View: Attractive iao In-line iI Cautious iC No Rating NRI Effective January 15, 2014, the stocks covered by Morgan Stanley Asia Pacific will be rated relative to the analyst's industry Cop industry team's courage. Effective January 15, 2014, the industry view benchwarts for Morgan Stanley Asia Pacific are as follous: relevant MSCI country
index or MSCI sub-regional index or MSCI AC Asia Pacific ex Japan Index.
-
E.C:
-
E./I
-
0/A
-
0/1
95000
3Ộ 000
25000
20000
15000
10000
50 0 0
Taiyo Yuden (6976.T) - As of 09/15/26 GMT in JPY
Industry : Electronic Components
M
51480
09/01
2020
6/17/26 : U/I
Stock Price (Not. Cougned by Current. Analysto Stock Price (Couered by Current Analyst imm
- U./I
Stock and Industry Ratings abbreviations belowd appear as + Stock Rating/Industry View Stock Ratings: Queruzight co0 Equal-weight dE! Underweight dUs Not-Rated INR. No Rating Available iNA
Industry View: Attractive iao In-line iI Cautious iC No Rating CNR. Effective January 15, 2014, the stocks covered by Morgan Stanley Asia Pacific will be rated relative to the analyst's industry cop industry team'so cougrage. Effective January 15, 2014, the industry view benchwarts for Morgan Stanley Asia Pacific are as follous: relevant MSCI country index or MSCI sub-regional index or MSCI AC Asia Pacific ex Japan Index.
2000
1600
1400
1200
1000
800
600
400
200
Yageo Corp. (2327.TW) - As of 09/15/26 GMT in TWD
Industry : Greater China Technology Hardware
M
151.2550
09/01
2025
Stock Price (Not Cougned by Current. Analysto Stock Price (Couered by Current Analyst imm
Stock and Industry Ratings abbreviations belowd appear as + Stock Rating/Industry View Stock Ratings: Quernight too Equal-wight cED Underuzight dUD Not-Rated CHRY No Rating HuailablaiNa i my Baking Auailable INA) Industry View: Attractive iad In-line iI Cautious iC No Rating NRI Effective January 18, 2014, the stocks covered by Morgan Stanley Asia Pacific will be rated relative to the analusts industry Cop industry team'so couerage. Effective January 15, 2014, the industry view benchwarts for Morgan Stanley Asia Pacific are as follous: relevant MSCI country index or MSCI sub-regional index or MSCI AC Asia Pacific ex Japan Index.
Important Disclosures for Morgan Stanley Smith Barney LLC Customers
Important disclosures regarding any material conflict of interest that can reasonably be expected to have influenced Morgan Stanley Smith Barney LLC's choice of a third-party research provider or the subject company of a third-party research report, are available on the Morgan Stanley Wealth Management disclosure website at www.morganstanley.com/online/researchdisclosures. For Morgan Stanley specific disclosures, you may refer to https://www.morganstanley.com/eqr/disclosures/webapp/generalresearch.
Each Morgan Stanley research report is reviewed and approved on behalf of Morgan Stanley Smith Barney LLC. This review and approval is conducted by the same person who reviews the research report on behalf of Morgan Stanley. This could create a conflict of interest.
Other Important Disclosures
Morgan Stanley Research policy is to update research reports as and when the Research Analyst and Research Management deem appropriate, based on developments with the issuer, the sector, or the market that may have a material impact on the research views or opinions stated therein. In addition, certain Research publications are intended to be updated on a regular periodic basis (weekly/monthly/quarterly/annual) and will ordinarily be updated with that frequency, unless the Research Analyst and Research Management determine that a different publication schedule is appropriate based on current conditions.
Morgan Stanley is not acting as a municipal advisor and the opinions or views contained herein are not intended to be, and do not constitute, advice within the meaning of Section 975 of the Dodd-Frank Wall Street Reform and Consumer Protection Act.
Morgan Stanley produces an equity research product called a "Tactical Idea." Views contained in a "Tactical Idea" on a particular stock may be contrary to the recommendations or views expressed in research on the same stock. This may be the result of differing time horizons, methodologies, market events, or other factors. For all research available on a particular stock, please contact your sales representative or go to Matrix at http://www.morganstanley.com/matrix.
Morgan Stanley Research is provided to our clients through our proprietary research portal on Matrix and also distributed electronically by Morgan Stanley to clients. Certain, but not all, Morgan Stanley Research products are also made available to clients through third-party vendors or redistributed to clients through alternate electronic means as a convenience. For access to all available Morgan Stanley Research, please contact your sales representative or go to Matrix at http://www.morganstanley.com/matrix.
Any access and/or use of Morgan Stanley Research is subject to Morgan Stanley's Terms of Use (http://www.morganstanley.com/terms.html). By accessing and/or using Morgan Stanley Research, you are indicating that you have read and agree to be bound by our Terms of Use (http://www.morganstanley.com/terms.html). In addition you consent to Morgan Stanley processing your personal data and using cookies in accordance with our Privacy Policy and our Global Cookies Policy (http://www.morganstanley.com/privacy_pledge.html), including for the purposes of setting your preferences and to collect readership data so that we can deliver better and more personalized service and products to you. To find out more information about how Morgan Stanley processes personal data, how we use cookies and how to reject cookies see our Privacy Policy and our Global Cookies Policy (http://www.morganstanley.com/privacy_pledge.html). Please use the provided link to review the Terms and Conditions and Most Important Terms and Conditions for Morgan Stanley India Company Private Limited (https://www.morganstanley.com/assets/ pdfs/about-us-global-offices/india/Terms_and_conditions.pdf) and the following link to review the audit report (https://ny.matrix.ms.com/eqr/research/webapp/researchdocs/ MSICPL_Morgan_Stanley_Research_Audit_Report.pdf).
If you do not agree to our Terms of Use and/or if you do not wish to provide your consent to Morgan Stanley processing your personal data or using cookies please do not access our research.
- 0/1
1515
1355---
1465
144°
M
Morgan Stanley Research does not provide individually tailored investment advice. Morgan Stanley Research has been prepared without regard to the circumstances and objectives of those who receive it. Morgan Stanley recommends that investors independently evaluate particular investments and strategies, and encourages investors to seek the advice of a financial adviser. The appropriateness of an investment or strategy will depend on an investor's circumstances and objectives. The securities, instruments, or strategies discussed in Morgan Stanley Research may not be suitable for all investors, and certain investors may not be eligible to purchase or participate in some or all of them. Morgan Stanley Research is not an offer to buy or sell or the solicitation of an offer to buy or sell any security/instrument or to participate in any particular trading strategy. The value of and income from your investments may vary because of changes in interest rates, foreign exchange rates, default rates, prepayment rates, securities/instruments prices, market indexes, operational or financial conditions of companies or other factors. There may be time limitations on the exercise of options or other rights in securities/instruments transactions. Past performance is not necessarily a guide to future performance. Estimates of future performance are based on assumptions that may not be realized. If provided, and unless otherwise stated, the closing price on the cover page is that of the primary exchange for the subject company's securities/instruments.
The fixed income research analysts, strategists or economists principally responsible for the preparation of Morgan Stanley Research have received compensation based upon various factors, including quality, accuracy and value of research, firm profitability or revenues (which include fixed income trading and capital markets profitability or revenues), client feedback and competitive factors. Fixed Income Research analysts', strategists' or economists' compensation is not linked to investment banking or capital markets transactions performed by Morgan Stanley or the profitability or revenues of particular trading desks.
The "Important Regulatory Disclosures on Subject Companies" section in Morgan Stanley Research lists all companies mentioned where Morgan Stanley owns 1% or more of a class of common equity securities of the companies. For all other companies mentioned in Morgan Stanley Research, Morgan Stanley may have an investment of less than 1% in securities/instruments or derivatives of securities/instruments of companies and may trade them in ways different from those discussed in Morgan Stanley Research. Employees of Morgan Stanley not involved in the preparation of Morgan Stanley Research may have investments in securities/instruments or derivatives of securities/instruments of companies mentioned and may trade them in ways different from those discussed in Morgan Stanley Research. Derivatives may be issued by Morgan Stanley or associated persons.
With the exception of information regarding Morgan Stanley, Morgan Stanley Research is based on public information. Morgan Stanley makes every effort to use reliable, comprehensive information, but we make no representation that it is accurate or complete. We have no obligation to tell you when opinions or information in Morgan Stanley Research change apart from when we intend to discontinue equity research coverage of a subject company. Facts and views presented in Morgan Stanley Research have not been reviewed by, and may not reflect information known to, professionals in other Morgan Stanley business areas, including investment banking personnel.
Morgan Stanley Research personnel may participate in company events such as site visits and are generally prohibited from accepting payment by the company of associated expenses unless pre-approved by authorized members of Research management.
Morgan Stanley may make investment decisions that are inconsistent with the recommendations or views in this report.
To our readers based in Taiwan or trading in Taiwan securities/instruments: Information on securities/instruments that trade in Taiwan is distributed by Morgan Stanley Taiwan Limited ("MSTL"). Such information is for your reference only. The reader should independently evaluate the investment risks and is solely responsible for their investment decisions. Morgan Stanley Research may not be distributed to the public media or quoted or used by the public media without the express written consent of Morgan Stanley. Any non-customer reader within the scope of Article 7-1 of the Taiwan Stock Exchange Recommendation Regulations accessing and/or receiving Morgan Stanley Research is not permitted to provide Morgan Stanley Research to any third party (including but not limited to related parties, affiliated companies and any other third parties) or engage in any activities regarding Morgan Stanley Research which may create or give the appearance of creating a conflict of interest. Information on securities/instruments that do not trade in Taiwan is for informational purposes only and is not to be construed as a recommendation or a solicitation to trade in such securities/instruments. MSTL may not execute transactions for clients in these securities/instruments.
Morgan Stanley is not incorporated under PRC law and the research in relation to this report is conducted outside the PRC. Morgan Stanley Research does not constitute an offer to sell or the solicitation of an offer to buy any securities in the PRC. PRC investors shall have the relevant qualifications to invest in such securities and shall be responsible for obtaining all relevant approvals, licenses, verifications and/or registrations from the relevant governmental authorities themselves. Neither this report nor any part of it is intended as, or shall constitute, provision of any consultancy or advisory service of securities investment as defined under PRC law. Such information is provided for your reference only.
Morgan Stanley Research is disseminated in Brazil by Morgan Stanley C.T.V.M. S.A. located at Av. Brigadeiro Faria Lima, 3600, 6th floor, São Paulo - SP, Brazil; and is regulated by the Comissão de Valores Mobiliários; in Mexico by Morgan Stanley México, Casa de Bolsa, S.A. de C.V which is regulated by Comision Nacional Bancaria y de Valores. Paseo de los Tamarindos 90, Torre 1, Col. Bosques de las Lomas Floor 29, 05120 Mexico City; in Japan by Morgan Stanley MUFG Securities Co., Ltd. and, for Commodities related research reports only, Morgan Stanley Capital Group Japan Co., Ltd; in Hong Kong by Morgan Stanley Asia Limited (which accepts responsibility for its contents) and by Morgan Stanley Bank Asia Limited; in Singapore by Morgan Stanley Asia (Singapore) Pte. (Registration number 199206298Z) and/or Morgan Stanley Asia (Singapore) Securities Pte Ltd (Registration number 200008434H), regulated by the Monetary Authority of Singapore (which accepts legal responsibility for its contents and should be contacted with respect to any matters arising from, or in connection with, Morgan Stanley Research) and by Morgan Stanley Bank Asia Limited, Singapore Branch (Registration number T14FC0118J); in Australia to "wholesale clients" within the meaning of the Australian Corporations Act by Morgan Stanley Australia Limited A.B.N. 67 003 734 576, holder of Australian financial services license No. 233742, which accepts responsibility for its contents; in Australia to "wholesale clients" and "retail clients" within the meaning of the Australian Corporations Act by Morgan Stanley Wealth Management Australia Pty Ltd (A.B.N. 19 009 145 555, holder of Australian financial services license No. 240813, which accepts responsibility for its contents; in Korea by Morgan Stanley & Co International plc, Seoul Branch; in India by Morgan Stanley India Company Private Limited having Corporate Identification No (CIN) U22990MH1998PTC115305, regulated by the Securities and Exchange Board of India ('SEBI') and holder of licenses as a Research Analyst (SEBI Registration No. INH000001105); Stock Broker (SEBI Stock Broker Registration No. INZ000244438), Merchant Banker (SEBI Registration No. INM000011203), and depository participant with National Securities Depository Limited (SEBI Registration No. IN-DP-NSDL-567-2021) having registered office at Altimus, Level 39 & 40, Pandurang Budhkar Marg, Worli, Mumbai 400018, India; Telephone no. +91-22-61181000; Compliance Officer Details: Mr. Tejarshi Hardas, Tel. No.: +91-22-61181000 or Email: tejarshi.hardas@morganstanley.com; Grievance officer details: Mr. Tejarshi Hardas, Tel. No.: +91-22-61181000 or Email: msic-compliance@morganstanley.com. Morgan Stanley India Company Private Limited (MSICPL) may use AI tools in providing research services. All recommendations contained herein are made by the duly qualified research analysts; in Germany and the European Economic Area where required by Morgan Stanley Europe S.E., authorised and regulated by Bundesanstalt fuer Finanzdienstleistungsaufsicht (BaFin) under the reference number 149169; in the US by Morgan Stanley & Co. LLC, which accepts responsibility for its contents. Morgan Stanley & Co. International plc, authorized by the Prudential Regulation Authority and regulated by the Financial Conduct Authority and the Prudential Regulation Authority, disseminates in the UK research that it has prepared, and research which has been prepared by any of its affiliates, only to persons who (i) are investment professionals falling within Article 19(5) of the Financial Services and Markets Act 2000 (Financial Promotion) Order 2005 (as amended, the 'Order'); (ii) are persons who are high net worth entities falling within Article 49(2)(a) to (d) of the Order; or (iii) are persons to whom an invitation or inducement to engage in investment activity (within the meaning of section 21 of the Financial Services and Markets Act 2000, as amended) may otherwise lawfully be communicated or caused to be communicated. RMB Morgan Stanley Proprietary Limited is a member of the JSE Limited and A2X (Pty) Ltd. RMB Morgan Stanley Proprietary Limited is a joint venture owned equally by Morgan Stanley International Holdings Inc. and RMB Investment Advisory (Proprietary) Limited, which is wholly owned by FirstRand Limited. Morgan Stanley Research is disseminated in Canada by Morgan Stanley Canada Limited and Morgan Stanley Wealth Management Canada Inc., members of the Canadian Investment Regulatory Organization (CIRO). The information in Morgan Stanley Research is being disseminated by Morgan Stanley Saudi Arabia, regulated by the Capital Market Authority in
M
the Kingdom of Saudi Arabia, and is directed at Sophisticated investors only.
The information in Morgan Stanley Research is being communicated by Morgan Stanley & Co. International plc (DIFC Branch), regulated by the Dubai Financial Services Authority (the DFSA) or by Morgan Stanley & Co. International plc (ADGM Branch), regulated by the Financial Services Regulatory Authority Abu Dhabi (the FSRA), and is directed at Professional Clients only, as defined by the DFSA or the FSRA, respectively. The financial products or financial services to which this research relates will only be made available to a customer who we are satisfied meets the regulatory criteria of a Professional Client. A distribution of the different MS Research ratings or recommendations, in percentage terms for Investments in each sector covered, is available upon request from your sales representative.
The information in Morgan Stanley Research is being communicated by Morgan Stanley & Co. International plc (QFC Branch), regulated by the Qatar Financial Centre Regulatory Authority (the QFCRA), and is directed at business customers and market counterparties only and is not intended for Retail Customers as defined by the QFCRA.
As required by the Capital Markets Board of Turkey, investment information, comments and recommendations stated here, are not within the scope of investment advisory activity. Investment advisory service is provided exclusively to persons based on their risk and income preferences by the authorized firms. Comments and recommendations stated here are general in nature. These opinions may not fit to your financial status, risk and return preferences. For this reason, to make an investment decision by relying solely to this information stated here may not bring about outcomes that fit your expectations.
The trademarks and service marks contained in Morgan Stanley Research are the property of their respective owners. Third-party data providers make no warranties or representations relating to the accuracy, completeness, or timeliness of the data they provide and shall not have liability for any damages relating to such data. The Global Industry Classification Standard (GICS) was developed by and is the exclusive property of MSCI and S&P.
Morgan Stanley Research, or any portion thereof may not be reprinted, sold or redistributed without the written consent of Morgan Stanley.
Indicators and trackers referenced in Morgan Stanley Research may not be used as, or treated as, a benchmark under Regulation EU 2016/1011, or any other similar framework.
The issuers and/or fixed income products recommended or discussed in certain fixed income research reports may not be continuously followed. Accordingly, investors should regard those fixed income research reports as providing stand-alone analysis and should not expect continuing analysis or additional reports relating to such issuers and/or individual fixed income products. Morgan Stanley may hold, from time to time, material financial and commercial interests regarding the company subject to the Research report.
Registration granted by SEBI and certification from the National Institute of Securities Markets (NISM) in no way guarantee performance of the intermediary or provide any assurance of returns to investors. Investment in securities market are subject to market risks. Read all the related documents carefully before investing.