PDF 原檔:報告_MS_CCL銅箔玻纖AI材料循環_20260913_original.pdf
報告定位
MS 2026-09-13 對 CCL/銅箔/玻纖布上游材料的 initiation 報告,同時首評台光電(OW,TP 8,400)、台燿(OW,TP 2,700)、金居(OW,TP 730)、建滔積層板(OW,TP HK$75)。本檔為 pdf_parse 完整版(未 trim),因 pdf_trim 對本份圖表密集報告過度刪除(4,467 → 54 行)。
已驗證圖片清單(Step 2.5)
| 檔名 | 內容 | 類別 |
|---|---|---|
報告_MS_CCL銅箔玻纖AI材料循環_20260913_026.png |
Exhibit 32 — NVIDIA 各世代 CCL 等級與 PCB 層數演進(Hopper M6/M7 18L/24L → Blackwell M8 22L → Vera Rubin M8/M8.5 26L/32L/44L → Feynman M9/M10) | 真資料圖,可嵌入 |
報告_MS_CCL銅箔玻纖AI材料循環_20260913_083.png |
銅箔/玻纖布/樹脂三大材料屬性與 CCL 成形關係總覽 | 真資料圖,可嵌入 |
報告_MS_CCL銅箔玻纖AI材料循環_20260913_080.png |
CCL 斷面結構圖(copper foil/filler/resin/glass fabric 各自決定的性質) | 真資料圖,可嵌入 |
報告_MS_CCL銅箔玻纖AI材料循環_20260913_033.png |
Mitsui Kinzoku VSP 系列高頻銅箔(Rz 1.0µm)剖面 | 真資料圖(廠商素材) |
報告_MS_CCL銅箔玻纖AI材料循環_20260913_019.png |
Exhibit 25 — PCB/載板/上游材料六因子計分卡(內文已轉為表格) | 真資料圖,內文有表可替代 |
報告_MS_CCL銅箔玻纖AI材料循環_20260913_018.png |
Exhibit 24 — 先進 AI PCB 生產週期 2.2 倍 | 真資料圖 |
| 其餘 87 張 | 多為趨勢折線/堆疊柱狀圖與 Risk Reward 價格區間圖,數值已於內文表格或敘述呈現 | 未逐張驗證,勿直接引用 |
原始內容
M September 13, 2026 09:00 PM GMT
Asia Pacific Technology | Asia Pacific
AI's Hidden Backbone
We view this as a selective, specification-driven materials cycle rather than a broad commodity upturn. The strongest positioning belongs to suppliers with next-generation qualifications, reliable manufacturing yields, and access to constrained upstream inputs.
Key Takeaways
- Long qualification cycles and lower production yields in advanced copper foil and glass cloth should keep effective high-end CCL supply tight into 2028.
- Our proprietary bottom-up analysis quantifies copper foil, CCL and PCB content across Nvidia, AMD, TPU and Trainium platforms.
- We introduce a scorecard comparing 16 PCB, substrate & materials suppliers on six factors to distinguish structural winners from cyclical beneficiaries.
- DDR4-like supply squeeze; standard E-glass pricing likely has further upside as capacity shifts toward higher-value, more advanced grade cloth.
- Initiate at OW on EMC (NT$8,400 PT), TUC (NT$2,700 PT), Co-Tech (NT$730 PT), and KB Laminates (HK$75 PT).
AI-driven specification upgrades are reshaping the economics of copper-clad laminate (CCL), the core material in PCBs, and driving demand for higherperformance copper foil and glass cloth. We expect the global CCL TAM to rise from US$19B in 2025 to US$47B by 2030, implying a 20% CAGR (vs market expectations at US$35-40B) , with AI/data-center applications accounting for 90% of incremental growth and nearly two-thirds of demand by decade-end.
Content, not units, is the key growth driver. We estimate rising material intensity accounts for 84% of AI-related CCL growth, as next-generation compute and networking platforms move to higher-layer-count PCBs, lower-loss CCL and smoother HVLP copper foil. Our bottom-up model implies the HVLP4 market grows from <US$50M in 2025 to US$2.8B by 2030, a 123% CAGR . Extending the same framework further downstream, we forecast the global PCB TAM will rise from US$58bn to US$135bn over 2025-30, an 18% CAGR .
Broadening the AI trade upstream. We think high-end CCL, HVLP copper foil and advanced glass cloth have entered an earnings upcycle but have yet to reach full earnings realization and peak-cycle conditions. AI-driven specification upgrades are reducing the number of qualified suppliers and supporting mix, pricing and margins, while long qualification cycles, lower yields and equipment bottlenecks should slow the supply response.
Foundation
Morgan Stanley Taiwan Limited+
| Howard Kao Equity Analyst Howard.Kao@morganstanley.com | +886 2 2730-2989 |
|---|---|
| Irene Yen Research Associate Irene.Yen@morganstanley.com Morgan Stanley MUFG Securities Co., Ltd.+ | +886 2 2730-2869 |
| Kazuo Yoshikawa, CFA Equity Analyst Kazuo.Yoshikawa@morganstanleymufg.com | +81 3 6836-8408 |
| Yoshihito Hasegawa Equity Analyst Yoshihito.Hasegawa@morganstanleymufg.com | +81 3 6836-8910 |
| Ryoichi Watanabe Equity Analyst Ryoichi.Watanabe@morganstanleymufg.com | +81 3 6836-8929 |
| Yu Shirakawa Equity Analyst Yu.Shirakawa@morganstanleymufg.com | +81 3 6836-5432 |
| Shoji Sato Equity Analyst Shoji.Sato@morganstanleymufg.com | +81 3 6836-8404 |
| Equity Analyst Sota.Harashima@morganstanleymufg.com Tomonobu Tsunoyama | +81 3 6836-8897 |
| Equity Analyst Tomonobu.Tsunoyama@morganstanleymufg.com Morgan Stanley & Co. International plc, Seoul | +81 3 6836-8936 Branch+ |
| Ryan Kim Equity Analyst Ryan.G.Kim@morganstanley.com | +82 2 399-4939 |
| Morgan Stanley Asia Limited+ Rachel L Zhang Equity Analyst Rachel.Zhang@morganstanley.com | +852 2239-1520 |
| +852 2239-7689 | |
| Greater China Technology | |
| Equity Analyst | |
| Andy Meng, CFA | |
| Andy.Meng@morganstanley.com | |
| Hardware |
Asia Pacific
Industry View
In-Line
Morgan Stanley does and seeks to do business with companies covered in Morgan Stanley Research. As a result, investors should be aware that the firm may have a conflict of interest that could affect the objectivity of Morgan Stanley Research. Investors should consider Morgan Stanley Research as only a single factor in making their investment decision.
For analyst certification and other important disclosures, refer to the Disclosure Section, located at the end of this report.
+= Analysts employed by non-U.S. affiliates are not registered with FINRA, may not be associated persons of the member and may not be subject to FINRA restrictions on communications with a subject company, public appearances and trading securities held by a research analyst account.
M
ul thie thee layelo ('iver lon anu uur) vy yraue
M7
8
M8
6
M9
5
M10
2?
M
Copper foil
Our Thesis in Six Charts
Cauran. Alnrnan Ctanlau Dacnarah notimatan.
Exhibit 2: Years of relatively slow to no growth for CCL - then AI changed the trajectory
Source: Morgan Stanley Research estimates.
Exhibit 4: Our base case assumes leading platform architectures migrate toward M9-grade CCL, with US$30-40K CCL content, within two generations
Source: Morgan Stanley Research estimates.
Exhibit 6: HVLP4 supply deficit widens sharply in 2027 and persists through 2028
Source: Morgan Stanley Research estimates.
Exhibit 3: Content, not units, will drive 84% of AI-related CCL growth to 2030 (US$ B)
Source: Morgan Stanley Research estimates.
Exhibit 5: A narrowing funnel - qualified supplier count at each of the three layers (HVLP foil and CCL) by grade
Source: Morgan Stanley Research estimates.
Exhibit 7: We expect KB Laminates' net profit to rise 97% HoH in 2H26, driven by rising E-glass pricing, which has increased ~4x in the past year
Source: Company data, Morgan Stanley Research estimates.
M
Executive Summary
Why read this report?
We provide a comprehensive understanding of what copper foil, and copper-clad laminates are and how they fit into the PCB supply chain. In addition, we have built a proprietary bottom-up model to model out the copper foil and copper-clad laminates market ( please reach out to us for the model ).
We also broke down the copper foil, copper-clad laminate, and printed circuit board content per AI system across the different Nvidia, AMD, TPU, and Trainium architectures.
AI has completely overhauled the PCB supply chain, going all the way up to upstream materials like CCL (key raw material used in PCB production), copper foil (used in CCL production), as well as electronic glass cloth (used in CCL production) and others. ABF substrates are also seeing similar tailwinds, but we have talked about that here, here, and here. In this report, we focus primarily on CCL and copper foil, but also touch on glass cloth.
We forecast the CCL market to grow at a 20% CAGR over 2025-30, to US$47B from US$19B (2.5x). Unit and content growth both contribute. AI data center cluster deployments lift volumes, while faster signal transmission speeds require upgraded CCL to contain insertion loss and crosstalk, on top of a mix shift toward higher layer-count and more complex PCBs.
Against this demand, we see high-end CCL as under-supplied. Only a handful of suppliers globally are qualified for M8+ grades, including EMC, Panasonic, TUC, Doosan, and Shengyi. Because CCL capacity is grade-agnostic in architecture, nameplate capacity overstates effective high-grade supply, and M7/M8+ supply-demand is therefore difficult to quantify with precision. The absence of a precise gap does not change the direction. We expect high-end tightness to translate into firmer pricing and margin expansion for the qualified incumbents.
In copper foil, we forecast the high-end HVLP4 market to reach US$2.8B by 2030 , a 123% CAGR over 2025-2030, though off a de minimis base. HVLP4 (hyper very low profile) foil is the enabling input for low-loss, high-speed CCL, and therefore a gating item in the AI PCB supply chain.
Effective capacity rests with five suppliers today: Mitsui Kinzoku, Co-Tech, Furukawa, Fukuda and Copper Foil Luxembourg at roughly 1,000t/month, with Mitsui alone at 41% of 2026 capacity. Adding to that base is harder than nameplate suggests. Converting HVLP2 lines is not one-for-one; the longer production cycle cuts effective output by more than 40%. New lines require 6-12 months to ramp, and sit behind delivery queues for surface-treatment equipment concentrated among a small number of Japanese suppliers.
We model demand rising to 39.2kt in 2027 from 12.3kt in 2026 (+218% y/y), and further growing to 52.0kt in 2028 (+33% y/y). That would leave the market in a deficit of 31% by
M
2027 and 20% by 2028. As such, we expect a handful of qualified producers to hold meaningful pricing power over that window.
Our conclusion is that CCL makers that are able to secure the full input set of cloth, foil and resin should hold pricing power over downstream customers.
As a result of our bottom-up analysis of CCL and its upstream materials, we expect the PCB TAM to grow from US$58B in 2025 to US$135B by 2030, representing an 18% CAGR.
Beyond discovery: Why high-end CCL stocks still have room to run
We believe the market continues to underestimate the extent to which AI infrastructure investment will expand end demand for copper-clad laminate. Our 2030 CCL total addressable market estimate of US$47B is meaningfully above market forecasts of US$35-40B.
The key difference lies not only in our assumptions for AI server and data-center unit growth, but also in the increasing material intensity of next-generation computing and networking platforms. Higher layer counts, larger and more complex PCBs, faster datatransmission requirements, and the growing use of premium low-loss and high-speed materials should drive CCL content per system materially higher. This is all made possible with more advanced copper foil with tighter surface-profile, signal-integrity, and reliability requirements.
Structural demand is supported by capex. The spending backdrop still has more than a year of visible growth in it. Our house view on cash cloud capex now stands at US$1.2T in 2026 (+104% y/y) and US$1.6T in 2027 (+38% y/y) vs. consensus at US$1.39T for 2027. This compares with buyside expectations of US$1.8T+ (including financial and operating leases), suggesting there could still be meaningful room for further upward consensus revisions.
CCL content is growing faster than AI-system units. The demand driver is a specification ladder, not a single product cycle, and that distinction is what makes the cycle durable. Layer counts on AI server motherboards are increasing with each generation to support additional routing space for more signals as AI boards become more complex, while rising signal and thermal demands also support the adoption of higher grade CCLs. Crucially, each rung multiplies rather than adds, because moving up a grade changes the resin chemistry, the copper-foil profile and the glass-cloth grade simultaneously. Content per rack can therefore keep rising even if unit shipment growth moderates. The continuing migration toward lower-loss grades is another reason the earnings opportunity may have further to run.
M
Exhibit 8: CCL TAM growth from 2025 to 2030 is primarily driven by content, rather than units (US$ B)
Source: Morgan Stanley Research estimates.
The real scarcity is qualified, high-yield capacity. High-speed laminate is not a commodity that can be replaced solely on price; materials must be validated for signal loss, thermal reliability, dimensional stability and compatibility with specific PCB fabrication processes. For example, an upgrade to M8 grade CCL is not a simple incremental upgrade from M7. It requires simultaneous improvements in low-loss resin, smoother HVLP copper foil, higher-spec low-Dk glass cloth, and much tighter manufacturing tolerances. These changes narrow the process window, reduce throughput and yields, and increase scrap, inspection, and qualification costs. At the same time, the pool of suppliers able to produce M8 reliably at scale is much smaller, while AI-server demand is accelerating, creating significantly tighter effective supply. That is why the M8 CCL ASP is more than double that of M7 grade CCL ( Exhibit 9 ).
Once a material has been designed into a high-volume platform, changing it can require renewed signal-integrity work, reliability testing and PCB-process validation. That creates design-in persistence, and we believe a supplier's qualification at M9 (for example) should be viewed as more than a one-generation design win; it creates a cumulative advantage for the next material transition. By the time a CCL supplier is qualified for M9, it has already demonstrated that it can meet demanding electrical, thermal, dimensional-stability, and manufacturability requirements at commercial scale. It has also accumulated valuable process data, refined production yields, and developed working relationships with the end customer, PCB fabricators, and upstream material suppliers. When the end customer begins evaluating M10 or higher-grade materials, the incumbent can build from a proven technical and manufacturing base rather than starting the qualification process from scratch.
This advantage is reinforced by earlier access to customer roadmaps and opportunities for joint development. A qualified M9 supplier is more likely to understand the customer's next-generation loss budget, stack-up constraints, reliability requirements, and production timeline, allowing it to tailor its M10 product before broader qualification begins. Customers also have an incentive to work with proven suppliers because changing materials can require renewed signal-integrity modeling, PCB-process adjustments,
M
reliability testing, and yield validation. M9 qualification therefore does not guarantee success at M10, as each generation can reopen competition, but it meaningfully improves the probability of qualification, shortens time to market, and creates a compounding technological and commercial lead.
Exhibit 9: Higher CCL grades are supported by a progressively smaller pool of capable suppliers
| CCL Grade | ASP Index | Companies that have capability |
|---|---|---|
| <M7 | 1.0 to 2.4x | EMC, TUC, Panasonic, Doosan, Shengyi, ITEQ, KB Laminates, Nan Ya Plastics, Nan Ya New Materials, Huazheng New Materials, Chang Chun, Isola |
| M7 | 3.1x | EMC, TUC, Panasonic, Doosan, Shengyi, ITEQ, Nan Ya Plastics, Huazheng New Materials |
| M8 | 6.5x | EMC, TUC, Panasonic, Doosan, Shengyi, Nan Ya Plastics |
| M9+ | 12.1x | EMC, TUC, Shengyi, Panasonic, Doosan |
Source: Morgan Stanley Research estimates. Note: M2 pricing is indexed to 1.0x, with higher-grade CCL prices shown relative to this benchmark.
As a result, our stronger industry-level demand outlook underpins our above-consensus revenue and earnings estimates for the companies under our coverage.
Exhibit 10: MSe vs consensus
Where are we in the cycle?
In our cycle framework, we place high-end CCL and HVLP copper foil at past the trough, but still ahead of full earnings realization and peak-cycle conditions. Demand is being driven by a multi-year migration toward higher layer-count PCBs and lower-loss materials, while qualified supply remains constrained by long customer qualification cycles, lower yields and upstream bottlenecks. We therefore expect mix, pricing and margins to improve through 2027-28; however, the opportunity remains selective, as commodity-grade CCL can stay oversupplied even as qualified high-end materials tighten, making this a stockselection cycle rather than a broad sector call.
Peak
M
Exhibit 11: Sequencing the cycle
Mid
Trough iPhone
Ok Desien
• BT substrates
• Power & Networking
General server
O IC Foundry
O uten.
Source: Morgan Stanley Research estimates.
• OSAT
M
Conclusion
We view the current demand cycle as being driven by a sustained rise in material specifications rather than by a single product refresh. This distinction is important, as it suggests the opportunity could be more structural and durable than previous electronics cycles, which were often more dependent on unit shipments and shorter replacement cycles.
In our view, the specification upgrades are also multiplicative rather than merely additive. Moving to a higher-performance grade CCL typically requires simultaneous changes across the material stack, involving more advanced resin systems, lower-profile copper foil, and higher-grade glass cloth. At the same time, increasingly complex AI server and networking architectures require PCBs with more layers, greater routing density, tighter signalintegrity tolerances, and, in some cases, larger board dimensions. As a result, the value of CCL, copper foil, and related materials used per system, or per rack, can continue to increase even if the pace of server or rack shipment growth begins to moderate.
The main drivers of this content growth include:
- Migration toward higher-grade CCL. Rising data-transfer speeds, higher operating frequencies, and greater thermal loads are increasing the need for low-loss, highspeed CCL materials. As AI accelerators and networking systems move to faster interconnect standards, electrical performance becomes increasingly sensitive to dielectric loss, signal attenuation, and material consistency. This should support a continued mix shift toward higher-grade CCLs with more advanced resin formulations and tighter manufacturing requirements.
- Increasing PCB layer counts. AI servers, accelerator boards, and high-speed switches require substantially more routing capacity to support a growing number of processors, memory modules, power-delivery components, and high-speed input/output channels. Higher layer counts allow designers to accommodate this complexity while maintaining signal and power integrity. This increases the amount of CCL and copper foil required per board and can also raise manufacturing complexity and average selling prices.
Taken together, the continued migration toward higher-layer-count PCBs, lower-loss and higher-speed CCL, more advanced copper foil, and potentially larger board formats should support sustained growth in material content per system. We believe this specificationdriven upgrade cycle creates further revenue and earnings upside for the broader CCL and copper-foil supply chain, particularly for suppliers that are already qualified on leading AI server, accelerator, and networking platforms. This underappreciated content opportunity is central to our positive industry view.
M
Exhibit 12: MS estimates of CF/CCL/PCB content per Nvidia AI system
| Nvidia (US$) | GB300 | VR200 | VR300 |
|---|---|---|---|
| Total Copper Foil Content per rack | $1,697 | $5,164 | $5,705 |
| Total CCLContent per rack | $6,695 | $18,750 | $35,601 |
| Total PCBContent per rack | $37,491 | $91,227 | $154,377 |
| Gen/Gen | GB300 | VR200 | VR300 |
| Total Copper Foil Content per rack | 15% | 204% | 10% |
| Total CCLContent per rack | 1% | 180% | 90% |
| Total PCBContent per rack | 0% | 143% | 69% |
Source: Morgan Stanley Research estimates.
Exhibit 14: MS estimates of CF/CCL/PCB content per TPU AI system
| TPU (US$) | TPUv7 | TPUv8 | TPUv9 |
|---|---|---|---|
| Total Copper Foil Content per rack | $1,783 | $4,457 | $4,657 |
| Total CCLContent per rack | $6,550 | $13,009 | $32,288 |
| Total PCBContent per rack | $19,474 | $37,861 | $87,906 |
| Gen/Gen | TPUv7 | TPUv8 | TPUv9 |
| Total Copper Foil Content per rack | -- | 150% | 4% |
| Total CCLContent per rack | -- | 99% | 148% |
| Total PCBContent per rack | -- | 94% | 132% |
Source: Morgan Stanley Research estimates.
Exhibit 13: MS estimates of CF/CCL/PCB content per AMD AI system
| AMD(US$) | MI4XX | MI5XX |
|---|---|---|
| Total Copper Foil Content per rack | $9,610 | $9,734 |
| Total CCLContent per rack | $20,099 | $37,268 |
| Total PCBContent per rack | $66,143 | $114,188 |
| Gen/Gen | MI4XX | MI5XX |
| Total Copper Foil Content per rack | -- | 1% |
| Total CCLContent per rack | -- | 85% |
| Total PCBContent per rack | -- | 73% |
Source: Morgan Stanley Research estimates.
Exhibit 15: MS estimates of CF/CCL/PCB content per Trainium AI system
| Trainium (US$) | T2 | T3 | T4 |
|---|---|---|---|
| Total Copper Foil Content per rack | $1,423 | $3,266 | $6,855 |
| Total CCLContent per rack | $9,599 | $10,218 | $32,789 |
| Total PCBContent per rack | $24,500 | $26,287 | $84,770 |
| Gen/Gen | T2 | T3 | T4 |
| Total Copper Foil Content per rack | -- | 129% | 110% |
| Total CCLContent per rack | -- | 6% | 221% |
| Total PCBContent per rack | -- | 7% | 222% |
Source: Morgan Stanley Research estimates.
Stock implications
Elite Materials Co. (2383.TW, OW, PT NT$8,400)
EMC is a global leader in high-speed, low-loss CCL, with dominant market share across all major GPU and ASIC customer platforms. It continues to invest for future growth, with capacity expected to grow from 5,850k sheets/month at the end of 2025 to 11,250k sheets/month by the end of 2028, or 92% growth. Most of these capacity additions will be to support advanced grade CCL demand (M8+) over the next few years, driven by rising demand for AI-related systems. We therefore forecast EMC's revenue to grow at a 76% CAGR in 2025-2028, but we expect net profit to grow at a faster rate of 117% over the same period. On EPS, our forecasts for 2026-28 are NT$122.17, NT$266.24, and NT $416.24, respectively.
Price target and valuation discussion : Our price target of NT$8,400 implies 20x CY28 P/ E or 0.36x PEG, which we think is fair vs. its three year average of 14x because of the strong revenue and profit outlook driven by higher grade CCLs. In the higher grade CCL segment, there are also less capable suppliers, so competition decreases.
The 20x CY28 P/E implied by our price target is slightly above the past 3Y average +1SD of 19x, but much lower than the 32x recent P/E peak. We deem this valuation as fair, because EMC is benefitting from an earnings growth cycle fueled by stronger AI server CCL demand, EMC's own mix improvement and continued pricing adjustments, which supports margin expansion from 29.8% in 2025 to 41.4% by 2028 and an EPS CAGR of 117% over 2025-2028, on our estimates. Our 20x CY28 P/E for EMC is also higher than our
M
17x CY28 P/E for TUC, reflecting EMC's leading position in the AI CCL market in terms of both technology capabilities and production capacity. The stock is trading at just 12.8x CY28 P/E, below EMC's past 3Y average of 14x and Shengyi's current valuation of 21x CY28 P/E. Thus, we view the risk reward as attractive.
Taiwan Union Co. (6274.TWO, OW, PT NT$2,700)
TUC is another leading supplier of high-speed, low-loss CCL in Taiwan, though behind EMC, with particular strength in high-end networking switches at 400G, 800G and above, as well as growing exposure to AI ASIC platforms, including AWS Trainium from Trainium2 onward. Its M7+ mix is expected to rise from approximately 36% of sales in 2025 to 46% in 2028, while capacity grows from 2,300K sheets/month at the end of 2025 to 5,300K sheets/month by the end of 2028, an increase of approximately 130%. The richer product mix and pricing adjustments should support gross-margin expansion from 22.7% in 2025 to 36.0% in 2028. Our forecasts for 2026-28 EPS are NT$40.17, NT$94.43 and NT$156.68, respectively, implying a 138% CAGR over 2025-2028.
Price target and valuation discussion : Our NT$2,700 price target implies 17x CY28 P/E, or 0.26x PEG, vs. TUC's three-year average of 13x. We think this premium is fair given the rapid M7+ mix shift, capacity expansion and margin uplift, together with TUC's strong networking franchise and growing hyperscaler exposure. Its position as the primary, if not sole, supplier of thick-copper CCL used by a leading data-center power-solution provider offers an additional differentiated growth and pricing lever.
The 17x CY28 P/E implied by our price target is in line with the past 3Y average +1SD of 17x. We deem this valuation as fair, because TUC is benefitting from an earnings growth cycle fueled by stronger AI server/networking CCL demand, TUC's own mix improvement and continued pricing adjustments, which supports margin expansion from 22.7% in 2025 to 36.0% by 2028 and an EPS CAGR of 138% over 2025-2028, on our estimates. The stock is trading at just 8.6x CY28 P/E, below the past 3Y average -1SD of 9.4x. Thus, we view risk reward as attractive.
Co-Tech (8358.TWO, OW, PT NT$730).
Co-Tech is the leading advanced copper foil company in Taiwan and one of the few qualified suppliers of advanced RTF and HVLP3/4 copper foil and is emerging as the most important second source to Mitsui for AI servers and high-end networking. The company stopped supplying conventional HTE and standard RTF in 3Q26, redirecting its capacity toward higher-value RG and HVLP products, while its HVLP4 officially entered the Nvidia supply chain in 2025 and ramped up mass production in 2026. We model Co-Tech's HVLP4 capacity increasing from less than 50 tonnes/month in 2025 to approximately 200 tonnes at the end of 2026, 700 tonnes at the end of 2027 and 800 tonnes at the end of 2028. This would increase its global capacity share from approximately 13% in 2026 to 21% in 2028, making it the second-largest supplier after Mitsui. Our forecasts for 2026-28 EPS are NT$9.34, NT$18.59 and NT$31.63, respectively, implying a 96% CAGR over 202528.
Price target and valuation discussion : Our NT$730 price target implies 23x CY28 P/E, or 0.33x PEG, vs. Co-Tech's three-year average of 20x. We think the premium is fair given CoTech's qualification moat, rapid capacity ramp and exposure to a structurally under-
M
supplied market. We forecast global HVLP4 demand to exceed supply by approximately 31% and 20% in 2027 and 2028, respectively. Moreover, sellable HVLP4 capacity depends on specialized surface-treatment equipment, tight process tolerances, production yields and customer qualification, not simply installed nameplate capacity, which should limit credible competition and support pricing power.
The 23x CY28 P/E implied by our price target is slightly above the past 3Y average of 20x. We deem this valuation as fair, because Co-Tech is benefitting from an earnings growth cycle fueled by stronger AI server/networking CCL demand, Co-Tech's continued mix improvement (from HTE + RTF (RG) copper foils to advanced RTF (RG) + HVLP3+ copper foils) and continued processing fee adjustments, which supports margin expansion from 21.8% in 2025 to 47.2% by 2028 and an EPS CAGR of 96% over 2025-2028, on our estimates. The stock is trading at just 16.4x CY28 P/E, below Co-Tech's past 3Y average 20x. Thus, we view risk reward as attractive.
Kingboard Laminates (1888.HK, OW, PT: HK$75).
KB Laminates is the world's largest CCL producer by volume and is differentiated by its vertical integration across copper foil, glass yarn and cloth, epoxy resin and paper-based materials, providing advantages in cost, supply security and production planning. Although its current product mix remains weighted toward commodity FR-4, with less than 5% of capacity allocated to M6+ products, KB is moving up the specification curve. Its first 350K sheets/month of M6+ capacity is scheduled to come online in 1H27, followed by another 350K sheets/month in 1H28, while a new 21,000-tonne high-frequency and low-loss copper-foil plant is expected to start production in mid-2027. We forecast FY25-28 revenue to grow at a 42% CAGR and net profit at a faster 91% CAGR. Our FY26-28 EPS forecasts are HK$2.73, HK$4.51 and HK$5.40, respectively.
Price target and valuation discussion : Our HK$75 price target implies 14x CY28 P/E, or 0.7x PEG, modestly above its three-year average of 12.8x. We think this is fair given the profit-growth outlook, the cost and supply-security benefits of vertical integration, and the earnings optionality from its M6+ expansion. However, KB should trade at a lower multiple than the leading high-end CCL suppliers until advanced grades become a meaningfully larger part of its mix, as commodity FR-4 remains its core market and its high-end qualification position is still at an earlier stage.
The 14x CY28 P/E implied by our price target is slightly above the past 3Y average of 12.8x. We deem this valuation as fair, because KB Laminates is benefitting from an earnings growth cycle fueled by price hikes of its FR4 CCLs and glass cloth, as well as its gradual penetration into the higher-end CCL material market, which supports margin expansion from 19.6% in 2025 to 41.7% by 2028 and an EPS CAGR of 91% over 2025 2028, on our estimates. That said, we believe the company remains more of a cyclical play compared to its Taiwanese peers including EMC and TUC. Thus, we view the 1x re-rating vs. its past 3Y P/E average as fair. The stock is trading at just 8.5x CY28 P/E, below its past 3Y average of 12.8x. Therefore, we view risk reward as attractive.
To get more broad range of AI materials, please see this report: AI Infrastructure: The Materials Super-cycle
M
Exhibit 16: Key Greater China CCL and Copper Foil Suppliers' P/Es since 2023
Key Greater China CCL and Copper Foil Suppliers
Source: Morgan Stanley Research.
What are the key risks?
- A slowdown in AI infrastructure investment over the next several years. Demand for high-end copper foil and copper-clad laminate is increasingly tied to AI servers, networking equipment, and data-center expansion. A moderation in hyperscaler capital spending, slower growth in AI workloads, or longer server replacement cycles could weaken demand and delay expected capacity utilization.
- Company-specific execution or yield challenges. Lower-than-expected yields could result in higher unit costs and a slower margin recovery. This may create a gap between reported profitability and market expectations, particularly during the qualification and initial mass-production stages.
- Failure to qualify for next-generation materials platforms. Suppliers must typically undergo customer qualification processes before their products can be used in new server, switch, and accelerator platforms. An inability to meet increasingly stringent requirements for signal integrity, thermal performance, dimensional stability, or reliability could cause a supplier to miss an entire product cycle and lose share in higher-margin applications.
- Competition from Chinese suppliers . Continued investment by Chinese copper foil and CCL manufacturers could increase competition in higher-grade segments.
- Constraints in upstream raw-material supply. Shortages in materials such as glass cloth, specialty resin, and copper foil could limit production volumes.
- Faster-than-expected adoption of co-packaged optics. A more rapid transition to co-packaged optics could shorten electrical signal paths and reduce the need for certain high-speed PCB interconnections within networking equipment, resulting in a downgrade of CCL material used, therefore reducing some content opportunity of premium low-loss CCL and copper foil.
- Copper price changes. In estimating the TAM for copper foil and CCL, we have not assumed any specific movement in copper prices over the next few years. Instead, we have held copper prices constant at current levels.
M
Exhibit 17: CCL comps table
| CCL Ticker | Company | Closing price (LC) 9/8/2026 | Rating | Price target | Market cap (US$ M) | EPS (LC) | EPS (LC) | Current P/E (X) | Current P/E (X) | PT PEG (X) | PT PEG (X) | P/B (X) | P/B (X) | P/S (X) | P/S (X) | EV/EBITDA | EV/EBITDA | ROA (%) | ROA (%) | ROE (%) | ROE (%) | |
|---|---|---|---|---|---|---|---|---|---|---|---|---|---|---|---|---|---|---|---|---|---|---|
| Company | Closing price (LC) 9/8/2026 | Rating | Price target | Market cap (US$ M) | 26E | 27E | 28E | 27E | 28E | 27E | 28E | 27E | 28E | 27E | 28E | 27E | 28E | 27E 28E | 27E | 28E | ||
| 2383.TW | EMC | 5,340.00 | OW | 8,400 | 57,042 | 122.17 | 266.24 | 416.24 | 20.1 | 12.8 | 0.27 | 0.36 | 12.6 | 7.9 | 5.0 | 3.5 | 14.1 | 8.8 | 39% 40% | 80% | 74% | |
| 6274.TWO | TUC | 1,345.00 | OW | 2,700 | 11,578 | 40.17 | 94.43 | 156.68 | 14.2 | 8.6 | 0.21 | 0.26 | 8.3 | 5.2 | 3.0 | 1.9 | 9.5 | 5.6 | 32% | 33% | 72% | 73% |
| 6213.TW | ITEQ | 517.00 | NC | -- | 5,940 | 13.60 | 26.09 | 31.81 | 19.8 | 16.3 | -- | -- | 6.2 | 4.8 | 2.6 | 2.2 | 10.6 | 10.6 | 17% | 17% | 31% | 29% |
| 1888.HK | Kingboard Laminates | 45.82 | OW | 75.00 | 17,376 | 2.73 | 4.51 | 5.40 | 10.2 | 8.5 | 0.26 | 0.70 | 4.7 | 4.0 | 2.9 | 2.3 | 6.6 | 5.5 | 39% 39% | 54% | 53% | |
| 600183.SS | Shengyi Technology | 146.28 | EW | 170.00 | 46,795 | 3.12 | 4.82 | 6.98 | 30.4 | 21.0 | 0.65 | 0.54 | 10.6 | 8.1 | 4.9 | 3.6 | 20.5 | 14.1 | 28% 31% | 42% | 47% | |
| 6752.T | Panasonic | 4,164.00 | EW | 4,700 | 62,220 | 207.92 | 239.66 | 287.51 | 17.4 | 14.5 | 1.28 | 0.82 | 1.6 | 1.5 | 1.1 | 1.1 | 8.1 | 6.9 5% | 6% | 10% | 11% | |
| 4004.T | Resonac | 15,675.00 | OW | 22,400 | 20,193 | 564.14 | 755.87 | 862.51 | 20.7 | 18.2 | 0.87 | 1.84 | 3.1 | 2.7 | 2.6 | 2.5 | 12.5 | 11.2 | 6% 7% | 16% | 16% | |
| 4182.T | Mitsubishi Gas Chemical | 3,735.00 | OW | 5,900 | 4,795 | 293.67 | 333.14 | 378.32 | 11.2 | 9.9 | 1.32 | 1.15 | 1.0 | 1.0 | 0.8 | 0.8 | 7.9 | 7.2 | 5% | 6% | 9% | 10% |
| 000150.KS | Doosan Corporation | 1,142,000 | NC | -- | 15,142 | 30,039 | 45,913 | 67,262 | 24.9 | 17.0 | -- | -- | 7.1 | 5.4 | 0.8 | 0.7 | 15.5 | 15.5 2% | 3% | 29% | 32% | |
| Average | 18.8 | 14.1 | 0.69 | 0.81 | 6.1 | 4.5 | 2.7 | 2.1 | 11.7 | 9.5 | 19% | 20% | 38% | 38% | ||||||||
| Median | 19.8 | 14.5 | 0.65 | 0.70 | 6.2 | 4.8 | 2.6 | 2.2 | 10.6 | 8.8 | 17% | 17% | 31% | 32% |
Source: Visible Alpha, Morgan Stanley Research estimates. Pricing as of September 8, 2026.
Exhibit 18: Copper foil comps table
| Copper Foil Ticker | Company | Closing price (LC) 9/8/2026 | Rating | Price target | Market cap (US$ mn) | EPS (LC) | EPS (LC) | Current | Current | P/E (X) PT PEG | P/E (X) PT PEG | P/B (X) (X) | P/B (X) (X) | P/S | P/S | (X) | (X) | EV/EBITDA ROA (%) | EV/EBITDA ROA (%) | ROE (%) | ROE (%) |
|---|---|---|---|---|---|---|---|---|---|---|---|---|---|---|---|---|---|---|---|---|---|
| Company | Closing price (LC) 9/8/2026 | Rating | Price target | 26E | 27E | 28E | 27E | 28E | 27E | 28E | 27E | 28E | 27E | 28E 27E | 28E | 27E | 28E | 27E | 28E | ||
| 8358.TWO | Co-Tech | 520.00 | OW | 730.00 | 3,978 | 9.34 | 18.59 | 31.63 | 28.0 | 16.4 | 0.40 | 0.33 | 9.8 | 6.8 | 7.9 | 5.6 | 20.8 11.9 | 34% | 42% | 42% | 51% |
| 5706.T | Mitsui Kinzoku | 24,905.00 | OW | 56,000 | 9,387 | 1,583.43 | 1,942.24 | 2,332.32 | 12.8 | 10.7 | 1.27 | 1.20 | 2.5 | 2.1 1.5 | 1.4 8.4 | 7.1 | 13% | 14% | 21% | 21% | |
| 5801.T | Furukawa | 3,666.00 | OW | 6,600 | 17,308 | 118.94 | 190.91 | 244.46 | 19.2 | 15.0 | 0.57 | 0.96 | 4.5 | 3.6 | 1.5 | 1.4 14.4 | 11.8 | 10% | 11% | 25% | 25% |
| 1888.HK | Kingboard Laminates | 45.82 | OW | 75.00 | 17,376 | 2.73 | 4.51 | 5.40 | 10.2 | 8.5 | 0.26 | 0.70 | 4.7 | 4.0 | 2.9 | 2.3 | 6.6 5.5 | 39% | 39% | 54% | 53% |
| 600362.SS | Jiangxi Copper | 48.53 | OW | 55.00 | 20,655 | 3.87 | 2.96 | 3.31 | 16.4 | 14.7 | -0.79 | 1.41 | 1.7 | 1.6 | 0.2 | 0.2 10.7 | 9.7 | 3% | 4% | 11% | 12% |
| 301217.SZ | Anhui Tongguan | 106.99 | NC | -- | 12,461 | 0.68 | 1.36 | 2.22 | 74.4 | 45.5 | -- | -- | 6.7 | 6.2 | 8.6 | 7.6 88.7 | 88.7 | 8% | 13% | 9% | 14% |
| 301511.SZ | Defu Technology | 99.48 | NC | -- | 4,747 | 1.22 | 3.06 | 5.45 | 27.8 | 15.6 | -- | -- | 7.8 | 5.3 | 2.0 | 1.7 37.4 | 37.4 | 6% | 9% | 28% | 34% |
| Average | 27.0 | 18.1 | 0.34 | 0.92 | 5.4 | 4.2 3.5 | 2.9 26.7 | 24.6 | 16% | 19% | 27% | 30% | |||||||||
| Median | 19.2 | 15.0 | 0.40 | 0.96 | 4.7 | 4.0 2.0 | 1.7 14.4 | 11.8 | 10% | 13% | 25% | 25% |
Source: Visible Alpha, Morgan Stanley Research estimates. Pricing as of September 8, 2026.
Te rub supply uhlal! Tow ullall
ELECTRICAL PERFORMANCE
(Lower loss, higher speed)
PCB SUPPLY CHAIN
M
Copper ore concentrate
• Electrodeposited copper foil (ED)
• Rolled-annealed copper foil (RA)
PCB Supply Chain Flow Chart
• Thickness and surface
High-purity treatment vary by
Exhibit 19: The PCB Supply Chain Flow Chart
B. GLASS (for Cloth)
B. GLASS FIBER CLOTH
Silica sand
Additives
(limestone, alumina, boron, etc.)
Melting
Glass fiber
Glass yarn
glass cloth
C. CHEMICALS (for Resin)
• Representative
IPC styles: 106,
1080, 2116, 7628
• Standard and spread opened glass
constructions
• E-glass, low-Dk glass
and low-CTE glass
options
• Controls thickness, skow and electrical
dimensional stability,
C. RESIN SYSTEMS (Formulated)
• Base resin + curing agents
(BPA, epichlorohydrin,
Source: Morgan Stanley Research.
(Rigid Multilayer)
-
BARE PCB FABRICATION
-
Inner-layer imaging
-
Inner-layer etching
-
Inner-layer AOl
-
Lay-up & lamination
(heat & pressure)
-
Drilling (mechanical or laser)
-
Desmear & hole-wall
Partial curing (B-stage)
preparation
Prepreg (rolled) 7. Hole metallization & copper plating
- Outer-layer imaging. plating & etching
B. CCL MANUFACTURING
(Copper-Clad Laminate)
Copper foil
(treated)
Key CCL properties: Electrical performance,
retardants + fillers +
solvents/additives
• Epoxy
Modified PPE/PPO
BT
Cyanate ester
- PTFE-based systems
thermal stability, dimensional stability, reliability.
- MATERIAL TECHNOLOGY DRIVERS (Multiple Dimensions)
THERMAL & RELIABILITY
- DENSITY & CONSTRUCTION
• Higher Tg/Td
• Lower z-axis CTE
• CAF resistance
• Moisture resistance
- More layers · Thinner cores & dielectric HDI / microvias
• Sequential lamination
9. Outer-layer AOl
-
Solder mask & legend
-
Surface finish
-
Profiling, electrical test
& final inspection
-
Finished bare PCB
-
PCBA / ELECTRONICS ASSEMBLY
Inputs
Solder materials
-
Solder-paste printing
-
Component placement
-
Reflow soldering
-
AOl / X-ray inspection
-
Through-hole / secondary
-
END PRODUCTS & MARKETS
Data Centers & Al Infrastructure
• Al accelerators, GPUs
• High-speed networking (800G/1.6T)
• Cloud infrastructure
Consumer Electronics
• Smartphones, PCs, tablets
• Wearables, gaming
• Home appliances
Automotive
- DRIVING INDUSTRY TRENDS
- Higher dila rates Cle end/Cent, 8006,157
- Higher layer count & routing density
- Signal integrity & power integrity Thermal management & reliability
• ADAS, autonomous driving
• Infotainment, connectivity
- Industrial
- Industrial automation
- Robotics, control systems
• Renewable energy, inverters
Finished PCBA / PCB assembly
Aerospace, Defense & Other
• Telecommunications
• Aerospace & defense
- Medical, others
Higher data rates, routing density, layer counts, and power
- density are driving upgrades across laminate systems, copper foil, glass cloth, and PCB fabrication processes.
CCL and prepreg are core materials for rigid multilayer
PCBs. The finished bare board is subsequently assembled with electronic components to form a PCBA and
- electronic system.
phthalic anhydride, etc.)
Glass fiber cloth
Resin system
(formulated)
M
AI-Related Demand Will Add Over US$70B to the PCB Market
We estimate the global PCB addressable market will grow at an 18% CAGR between 2025 and 2030 , increasing from US$58B to US$135B. This expansion will be driven overwhelmingly by demand from AI and data-center infrastructure. As shown in Exhibit 22 , the AI and data center-related PCB market is expected to rise from US$13B in 2025 to US$86B by 2030, more than a sixfold increase. Its share of total PCB industry revenue would therefore increase from roughly 20-25% in 2025 to 64% by the end of the decade. On these assumptions, AI and data-center applications account for essentially all of the industry's net growth over the period, while demand across the remaining end markets is broadly stable.
The opportunity is also expected to be diversified across end segments. Growth should extend across PCBs used in general servers, GPU servers, custom ASIC servers, networking switches, and optical modules as demand continues to grow across the board and computing clusters continue to scale and grow. In addition to higher shipment volumes, these applications carry significantly greater PCB content per system, reflecting larger board sizes (potentially), higher layer counts, more advanced materials, tighter electrical requirements, and more complex manufacturing processes. The combination of volume growth and rising PCB value per system underpins the sharp expansion expected in the AI and data-center segment through 2030.
Exhibit 20: We estimate the global PCB TAM will grow at an 18% CAGR, from US$58B in 2025 to US$135B in 2030
Global PCB TAM (US$ B)
Source: Prismark, Morgan Stanley Research estimates.
M
Exhibit 21: AI/data center-related PCB mix will rise to 64% by 2030
Source: Morgan Stanley Research estimates.
Exhibit 23: PCB TAM
Exhibit 22: We estimate AI/data center-related PCB TAM to grow at a 45% CAGR in 2025-2030
AI/Data center-related PCB TAM (US$ B)
Source: Morgan Stanley Research estimates.
MS estimates on breakdown of different end segments of the AI/data center-related
Source: Morgan Stanley Research estimates.
Advanced AI PCB manufacturing requires a longer cycle
Advanced AI server PCB takes 2.2x longer to produce than a normal PCB: Based on our assumptions, the end-to-end lead time for an advanced AI PCB is approximately 100 days, or 14.6 weeks, compared with 46 days, or 6.6 weeks, for a conventional multilayer PCB. This represents an incremental lead time of 56 days, or eight weeks, meaning an AI PCB takes 2.2x as long to produce and deliver to the ODM.
- Transportation lead times are assumed to be the same for both products, so the full difference reflects the longer manufacturing cycle for the advanced AI PCB. The additional lead time consists of approximately 15 days for glass-cloth production, 11 days for CCL production, and 30 days for PCB fabrication.
M
The primary driver is the greater manufacturing complexity of the advanced AI PCB.
Higher-performance materials, including low-Dk+ glass cloth and HVLP+ copper foil, require longer production cycles, although these materials are produced in parallel and therefore do not add to lead time sequentially. The largest difference arises during PCB fabrication. Our estimate assumes an Nvidia-grade compute board with 22 layers and five lamination cycles, compared with a conventional 12-16-layer multilayer board requiring a single lamination cycle.
Each additional HDI build-up cycle may involve another round of lay-up, lamination, cooling, laser drilling, copper plating or via filling, imaging, and inspection before the next layer sequence can begin. Advanced AI boards also require tighter layer-to-layer registration, finer circuitry, stricter impedance control, and more extensive quality assurance. Together, these requirements extend the manufacturing cycle and increase the risk of yield loss or rework.
Exhibit 24: Advanced AI PCB takes 2.2x more time to produce than a normal PCB
Source: Morgan Stanley Research.
M
Regional PCB Supply Chain Scorecard
Investors often look at technology from a regional perspective, and so we collaborated with various analysts covering different stocks to put together the below scorecard, which we think captures the value of each company and how they position relative to each other. We believe these six factors best capture how investors should value these companies, in no particular order: 1) pricing power, 2) AI mix, 3) capital efficiency, 4) market concentration, 5) supply tightness, and 6) China substitution risk.
- Pricing power. The ability to raise or maintain prices and mix through the cycle without sacrificing volume. This is distinct from passing through input-cost inflation, which most suppliers can do. It is the clearest evidence that a company captures the value it creates rather than ceding it to customers. A score of 5 indicates pricing gains even in a downturn; a 1 indicates that price is the primary basis of competition.
- AI mix. We assess the share of revenue and profit attributable to AI and accelerated computing, including exposure to both ASIC- and GPU-based platforms. The scoring is straightforward: a score of 5 indicates that substantially all revenue and profit are AI-related, while a score of 1 indicates exposure of less than 10%.
- Capital efficiency. Returns on invested capital and cash conversion measured against the capital intensity required to grow. There are several companies that can hold pricing power, sit in a tight market, and enjoy a genuine qualification moat, but may differ on capital efficiency. We measure ROIC against cost of capital across a full cycle rather than at a peak year.
- Market concentration. The degree of supplier consolidation, measured through top-one and top-three market share, the number of suppliers customers could realistically qualify, and the stability of those positions. Concentration matters because it underpins many of the other factors: fragmented markets tend to compete on price, making durable pricing power difficult to sustain.
- Supply tightness. The current and expected balance between demand and available capacity, assessed through lead-time trends, customer prepayments and long-term agreements. Tight supply can temporarily support pricing and margins, making an otherwise ordinary business appear structurally stronger than it is. We therefore place greater weight on the capacity pipeline than on current lead times: capacity scheduled to come online over the next two years is often a better indicator of exit-cycle margins than today's order book.
- China substitution risk. The risk that qualified domestic Chinese suppliers or localization policies displace revenue. This is primarily a terminal value consideration: whether the company's addressable market in China remains intact over a five-year horizon. We assess China revenue exposure and its trend, the qualification status of domestic competitors, the size and direction of the technical gap, explicit localization targets, and barriers to entry such as tooling, intellectual property, materials purity and export controls. The score is inverted: a 5 denotes severe risk and is entered into the composite as 6 minus the score, reducing the overall result.
M
Under this framework, Ibiden scores the highest (4.50), and should be the most favored stock in this PCB/Substrate pool. Our analyst Shoji Sato has an Overweight rating on Ibiden, with a price target of ¥27,500. Ibiden: F3/27 1Q Results: Double Upgrade to OW (4 Aug 2026), and Shennan Circuits score the lowest (2.00). Shennan Circuits Co Ltd: 2Q26 earnings call takeaways (27 Aug 2026). We have an Equal-weight rating on Shennan mainly due to valuation, with Shennan trading at 28x CY27 P/E vs Gold Circuit, where we have an Overweight rating, and trades at a more favorable valuation of 15x CY27 P/E.
Exhibit 25: Positioning across PCB, IC Substrate and Upstream Materials
| RANK | COMPANY | TICKER | MSRATING | MSANALYST | CAPITAL EFFICIENCY | MARKET CONCENTRATION | SUPPLY TIGHTNESS | CHINA SUBSTITUTION RISK | SCORE | ||
|---|---|---|---|---|---|---|---|---|---|---|---|
| 1 | IBIDEN | 4062.T | Overweight | Shoji Sato | 5 | 5 | 3 | 4 | 5 | 1 | 4.5 |
| 2 | UNIMICRON | 3037.TW | Overweight | Howard Kao | 5 | 5 | 3 | 4 | 5 | 2 | 4.33 |
| 2 | RESONAC | 4004.T | Overweight | Ryoichi Watanabe | 5 | 5 | 4 | 5 | 3 | 2 | 4.33 |
| 4 | AJINOMOTO | 2802.T | Overweight | Tomonobu Tsunoyama | 5 | 3 | 4 | 5 | 4 | 2 | 4.17 |
| 5 | ELITE MATERIALS | 2383.TW | Overweight | Howard Kao | 4 | 5 | 5 | 3 | 4 | 3 | 4 |
| 5 | NITTO BOSEKI | 3110.T | Overweight | Yoshihito Hasegawa | 5 | 4 | 3 | 5 | 4 | 3 | 4 |
| 7 | NYPCB | 8046.TW | Overweight | Howard Kao | 5 | 2 | 3 | 4 | 5 | 2 | 3.83 |
| 8 | CO-TECH | 8358.TWO | Overweight | Howard Kao | 4 | 3 | 4 | 3 | 4 | 2 | 3.67 |
| 8 | MITSUI KINZOKU | 5706.T | Overweight | Yu Shirakawa | 4 | 3 | 4 | 3 | 4 | 2 | 3.67 |
| 8 | TUC | 6274.TWO | Overweight | Howard Kao | 4 | 3 | 5 | 3 | 4 | 3 | 3.67 |
| 11 | SHENGYITECHNOLOGY | 600183.SS | Equal-weight | Howard Kao | 4 | 1 | 4 | 3 | 4 | 3 | 3.17 |
| 11 | KBLAMINATES | 1888.HK | Overweight | Howard Kao | 4 | 1 | 4 | 3 | 4 | 3 | 3.17 |
| 13 | GOLDCIRCUIT | 2368.TW | Overweight | Howard Kao | 3 | 4 | 2 | 2 | 3 | 5 | 2.5 |
| 13 | ISU PETASYS | 007660.KS | Overweight | Ryan Kim | 3 | 4 | 2 | 2 | 3 | 5 | 2.5 |
| 13 | MEIKO | 6787.T | Equal-weight | Sota Harashima | 3 | 2 | 2 | 2 | 3 | 3 | 2.5 |
| 16 | SHENNANCIRCUITS | 002916.SZ | Equal-weight | Howard Kao | 2 | 2 | 2 | 2 | 3 | 5 | 2 |
Source: Morgan Stanley Research. Note: Red highlighted stocks (EMC, Co-Tech, TUC, and KB Laminates) are the four stocks we are initiating in this report.
M
Copper Clad Laminate (CCL): The Backbone of Electronic Inter-connectivity
How big is the market and who are the key players?
The CCL market has gone through a few cycles over the past decade . CCL is a broader, more standardized materials market, so market value reflects more than PCB unit demand. It also captures the pass-through of copper foil, glass fabric and yarn, epoxy resin, and other input costs, as well as shifts in mix from conventional FR-4 toward higher-value low-loss, high-speed, high-frequency, and specialty materials. As a result, headline sheet capacity can appear ample even when supply remains tight in the highest-performance grades, where customer qualification limits effective availability.
During 2016-17, the CCL market benefited from both a broad electronics upcycle and tightening upstream supply. Demand was supported by rising electronics content in automobiles, greater adoption of smart-home appliances, and wider LED penetration. At the same time, electrolytic copper foil capacity was diverted toward lithium battery applications, while electronic-grade glass yarn and fabric, epoxy resin, and other inputs also became scarce. This allowed laminate suppliers to push through several rounds of price increases, lifting the CCL TAM from US$10B in 2016 to US$12B in 2017. The increase reflected higher input costs and price pass-through as much as stronger underlying demand. But through 2018-19, input supply normalized, smartphone volumes plateaued, and the geopolitics disrupted ordering patterns, and a lot of the pricing uplift faded, which left the market largely flat at US$12B.
Covid-19 drove a sharp reset in CCL demand and pricing in 2020-21. Production was disrupted early in the pandemic, but demand rebounded in 2H20 as WFH and more time at home lifted sales of PCs and home electronics, while automotive and smartphone demand also recovered. Growth broadened in 2021 across consumer electronics, PCs, servers, home appliances, and new-energy vehicles. The resulting strain on laminate and raw-material supply led to several rounds of price increases and a marked improvement in producer margins. The CCL TAM rose from US$11B in 2020 to US$19B in 2021. This was a broad cyclical surge in demand and pricing, rather than the start of a structurally AI-driven upcycle.
The tight market in 2021 was followed by a two-year inventory and capacity correction. CCL suppliers added capacity in response to the shortage. This is evidenced by key CCL suppliers' capex rising from US$397M in 2020 to US$560-570M in 2021-2022, before falling to US$346M in 2023 ( Exhibit 28 ). But by the time it came online, consumer electronics demand had normalized, channel inventories were being reduced, and raw material prices were falling. Shipments and selling prices weakened in 2022, with conditions deteriorating further in 2023 as excess capacity and intense competition pushed prices down faster than production costs, leaving many producers loss-making. The CCL TAM fell from US$19B in 2021 to US$16B in 2022 and US$13B in 2023. The pressure was concentrated in standard and lower-end grades, while high-frequency, highspeed, and other higher-value products continued to gain share.
M
The CCL market began a two-speed recovery in 2024-25, led by AI and automotive
electronics. Industry inventories normalized, consumer-electronics demand improved gradually, and downstream customers resumed restocking. Demand from automotive electronics and AI-related applications outpaced the broader market, prompting suppliers to continue shifting their portfolios toward higher-end products. As a result, commodity FR-4 recovered only modestly, while low-loss and high-speed materials used in AI servers, conventional servers, switches, and data storage saw a stronger rebound. Based on the TAM series provided, the market grew from US$15B in 2024 to US$19B in 2025.
We expect to see a broader adoption cycle for AI and high-speed CCL over 2026-2030.
AI servers and accelerators require more, larger, and higher-layer-count PCBs, while nextgeneration switches, silicon-photonics modules, storage infrastructure, edge AI, and rising electronics content in vehicles are pushing laminate requirements higher. These applications require lower signal loss, tighter dielectric control, better thermal performance, greater dimensional stability, and higher reliability, driving demand for customer-qualified high-speed materials. Based on our estimates, we forecast the CCL TAM to reach US$47B by 2030, implying a CAGR of 20% from 2025.
We would therefore characterize the current CCL cycle as selectively bullish rather than uniformly bullish . The more relevant indicators are high-end product mix, customer qualification, manufacturing yield and pricing power in low-loss and high-speed grades, not conventional laminate capacity utilization alone. Commodity CCL can remain oversupplied and price-sensitive even while qualified AI-related materials tighten. This should make the current cycle more company-specific, and potentially more durable, than the broad pandemic-era surge.
M
| Periods | Description |
|---|---|
| Period I (2016-2018): Copper- foil diversion and broad materials tightness | CCL demand was mainly driven by smartphones, notebooks, and consumer electronics, with servers and networking making up a relatively small portion of the mix. Most products were standard FR-4 and mid-Tg. The step-up in 2017 was largely cost-driven, as electrolytic copper foil capacity shifted toward lithium battery foil and electronic-grade glass fabric tightened, allowing suppliers to raise prices. |
| Period II (2018-2019): Saturation and price give-back | Global smartphone volumes saturated and began to decline, while the trade war disrupted order patterns. At the same time, copper foil and glass fabric supply normalized, reversing much of the pricing gains seen in 2017. Continued capacity additions in standard-grade CCL in China kept industry returns at commodity-like levels, leaving the market broadly flat in value terms for three years. |
| Period III (2019-20): The quiet inflection - 5G, high-speed servers and early HPC | China's 5G base-station rollout and the server platform upgrade cycle marked the first real shift toward product differentiation in CCL. Low-loss and high-frequency grades required more advanced materials, including PPO and hydrocarbon resin systems, low-Dk glass fabric, and low-profile copper foil. Although the segment remained small, it allowed suppliers to earn a premium for technical capability rather than compete solely on price. With that said, total market value still fell in 2020, driven by weakness in smartphones, autos, and industrial applications in the first half, along with multi-year low copper prices. |
| Period IV (2020-2022): Demand shock and cost-push spike | Demand from notebooks, tablets, TVs, gaming, and networking surged at the same time that copper foil, epoxy resin, and glass fabric were in short supply. Suppliers implemented multiple rounds of price increases, lead times lengthened, and customers began double-ordering. Market value rose 73% to US$19B in 2021, although much of the increase reflected cost pass-through and inventory build. |
| Period V (2022-2024): Destocking and price reset | From 2H22, consumer electronics entered a sharp destocking cycle, China's 5G rollout slowed, and copper, resin, and glass costs fell in tandem. As an upstream input to PCB production, CCL felt the correction earlier than the rest of the supply chain. Market value declined for two straight years, reaching a trough of US$13B in 2023. Standard grades returned to intense price competition, while high-speed products were more resilient, supported by server demand and the early build-out of AI infrastructure. |
| Period VI (2024-2026): Bifurcated recovery turns broad- based | The recovery began in 2024, driven by AI, high-end servers, and networking, while PC and broader consumer demand improved only modestly. By 2025-26, the gap between high-end and standard grades had narrowed. Key inputs for advanced CCL, low-Dk glass fabric, HVLP copper foil, and PPE resin, also become constraints on overall industry output. As upstream suppliers shift production capacity toward higher-end, standard grades (ie. E-Glass) tightened as well, allowing price increases to spread across the industry. Market value returned to its 2021 peak in 2025, but with a fundamentally different product mix. |
| Period VII (2026-30): AI diffusion | AI/data center-related CCL content per rack continues to rise as boards become larger, layer counts increase, and cableless architectures shift more of the interconnect into the PCB. Each new platform generation raises the technical bar and narrows the pool of qualified suppliers, reversing the commoditisation seen from 2012 to 2019. Supply is slow to respond, given the multi-year lead times for glass fabric, high-end copper foil, and CCL lamination equipment. We expect the market to grow from US$19B in 2025 to US$47B by 2030, with high-speed and high- frequency grades contributing most of the incremental value. |
M
Exhibit 26: We forecast CCL TAM to grow materially over the next few years driven primarily by AI/data center-related demand
Source: Morgan Stanley Research estimates.
Exhibit 27: CCL TAM (US$ B) vs LME copper price (US$/Ton) CCL TAM vs LME Copper Price (US$/Ton)
13,000
8,000
3,000
50
Source: FactSet, Morgan Stanley Research estimates.
Exhibit 28: Four key CCL suppliers' aggregate capex spending from 2010 to 2025 (US$ M)
40
30
20
10
0
Source: Company data, Morgan Stanley Research. Note: This includes EMC, TUC, ITEQ, and Shengyi.
AI reshaping the CCL market: A US$30B data-center opportunity by 2030
We estimate the global CCL addressable market will grow at an approximate 20% CAGR between 2025 and 2030, increasing from around US$19B to US$47B. This expansion is expected to be driven overwhelmingly by AI and data-center infrastructure. As shown in Exhibit 29 , the AI and data-center-related CCL market is projected to rise from US$4B in 2025 to US$30B by 2030, representing a 47% CAGR, or close to sevenfold growth. Its share of the overall CCL market would consequently increase from 23% in 2025 to 63% by the end of the decade. On these assumptions, AI and data-center applications would contribute US$26B of the industry's US$28B net growth over the period, or 90%, while demand from other end markets remains broadly stable at approximately US$15-18B.
M
In addition to higher shipment volumes, these applications carry greater CCL dollar content per system due to more complex board designs, higher layer counts, and larger board sizes (potentially), which drives increased laminate usage, and greater adoption of higher grade low-loss and high-speed CCLs. The combination of continued compute cluster deployment, rising CCL content per system, and a mix shift toward higherperformance materials underpins the sharp expansion expected in AI and data-centerrelated CCL demand through 2030.
Exhibit 29: We expect the AI data center-related CCL TAM to grow at a 47% CAGR in 2025-2030 2023 2024 2025 2026E 2027E 2028E 2029E 2030E
Source: Morgan Stanley Research estimates.
Exhibit 30: AI/data center-related CCL mix will rise to 63% by 2030
Exhibit 31: MS estimates on the breakdown of different end segments of the AI/data center-related CCL TAM
Source: Morgan Stanley Research estimates.
Source: Morgan Stanley Research estimates.
Sxmbll oe. Tviula Hi oyolelllo vul Lrulutlull
NVIDIA AI SYSTEMS & CCL (COPPER CLAD LAMINATE) EVOLUTION
Higher Performance Systemce Demand Higher Grade CCL for Speed, Signal Integrity, and Reliability
M
CCL CLASS
M6 / M7
(LOW-LOSS)|
• Suitable for PCie Gen5 and up to
400G-class scale-out networking channets
• Balances insertion-loss performance and cost
• High thermal reliability and low Z-axis expansion
• Industry-estimated material class for
HGX H100-era designs
PCB LAYER COUNT
OAM
→ 18L
UBB
→
24L
CCL CLASS
M8
(VERY LOW-LOSS)|
• Designed for increasingly high-speed, low-loss channels and dense rack-scale
interconnects
• Suitable for 400G/800G-class networking.
depending on syster generation
• Lower Df for greater channel margin
Tighter Dk control and stronger thermal reliability
• Suitable for dense NVL72-class
PCB stackups
PCB LAYER COUNT I
Bianca
Switch board
Structural growth drivers
(ULTRA LOW-LOSS)
(EXTREME LOW-LOSS)
• Suitable for PCie Gen6 and 800G-class networking channels
(ESTIMATE)
Strata
Midplane
• Expected to extend scale-out networking.
photonics, and higher-speed electrical
Higher-grade CCLs reduce dielectric loss and improve signal integrity at the high frequencies used by AI accelerators, HBM, PCIe, and high-speed networking. Taking Nvidia's platform roadmap as an example, the earlier eight-GPU HGX systems used M6/ M7-grade CCL across both the Ampere and Hopper generations. With Blackwell, M8 became the primary grade used in NVL72 systems. Rubin is expected to bring another modest step-up: most PCBs should remain on M8, while selected boards, such as the midplane, move to M8.5. Looking further ahead, we expect Feynman to drive another upgrade toward M9/M10 materials ( Exhibit 32 ). · Supports higher layer counts and advanced stackups| 44L
The progression reflects the rising electrical and thermal demands of AI servers. As data rates increase and power density climbs, the PCB laminate plays a more critical role in maintaining signal integrity, managing heat, and ensuring system reliability.
However, better material does not reduce the number of electrical connections that must be routed. AI boards are becoming larger and more complex, with wider memory buses, more accelerator-to-accelerator links, dense BGA packages, and thousands of highspeed signals. Designers therefore need additional signal layers to provide enough routing space while maintaining controlled impedance, limiting crosstalk, and giving critical signals clean ground references.
AI systems also require increasingly demanding power-delivery networks because accelerators consume very high currents at low voltages. More power and ground planes help reduce resistance, inductance, and voltage fluctuations, while also improving electromagnetic shielding and heat spreading. Higher-grade CCLs and higher layer counts are therefore complementary: the CCL supports faster signal transmission, while the additional layers handle greater routing density, power demand, and overall system complexity.
Exhibit 32: Nvidia AI Systems' CCL Evolution
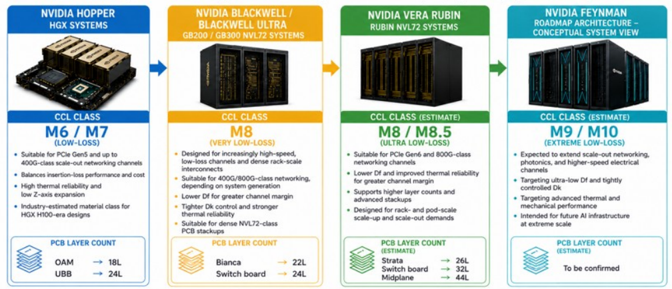
Source: Morgan Stanley Research.
22L
24L
M
Exhibit 33: Nvidia CCL content per rack is increasing with each generation of AI rack
| CCLASPperboard (US$) | GB300 | VR200 | VR300 |
|---|---|---|---|
| ComputePCB | $107 | $146 | $251 |
| Switch PCB | $150 | $520 | $1,313 |
| Midplane PCB | $0 | $212 | $276 |
| BlueFieldPCB | $0 | $47 | $101 |
| ConnectX PCB | $0 | $47 | $101 |
| Other peripheralPCB | $16 | $16 | $16 |
| PCBUnits per rack | GB300 | VR200 | VR300 |
| ComputePCB | 36x | 36x | 36x |
| Switch PCB | 9x | 9x | 9x |
| Midplane PCB | 0x | 18x | 18x |
| BlueFieldPCB | 0x | 18x | 18x |
| ConnectX PCB | 0x | 72x | 72x |
| Other peripheralPCB | 90x | 45x | 45x |
| Total CCLContent per rack | GB300 | VR200 | VR300 |
| ComputePCB | $3,863 | $5,245 | $9,026 |
| Switch PCB | $1,348 | $4,680 | $11,813 |
| Midplane PCB | $0 | $3,819 | $4,961 |
| BlueFieldPCB | $0 | $853 | $1,812 |
| ConnectX PCB | $0 | $3,411 | $7,247 |
| Other peripheralPCB | $1,485 | $742 | $742 |
| Total CCLContent per rack | $6,695 | $18,750 | $35,601 |
| Difference | 1% | 180% | 90% |
Source: Morgan Stanley Research estimates.
M
Rubin Ultra reopens the PTFE box
Based on our supply chain checks, Nvidia had initially planned to adopt PTFE CCL for the very high-layer-count midplane in its Kyber architecture. With Kyber now delayed, and Rubin Ultra no longer expected to use that architecture, as previously discussed, the focus has shifted back to the Oberon architecture. Nvidia is again evaluating PTFE for Rubin Ultra on Oberon, with adoption most likely to begin on the switch-tray boards, though actual adoption remains uncertain. At this stage, our checks have not indicated that either the midplane or the smaller in-tray boards will move to PTFE CCL.
Potential solutions:
- Hybrid PTFE: PTFE CCL cores (potentially with no glass cloth) paired with M9 prepregs. Here we see Shengyi camp competing against an Elite Material + Taiflex (8039.TW, not covered) camp.
- Pure PTFE: modified PTFE CCLs engineered to improve processability.
- Pure M9: M9 built on Q glass, i.e. what we would call the 'real M9.'
- Pure M10: the least likely of the four.
Advantages of PTFE
- Best signal performance: the lowest Dk and Df of the mainstream options, below even standard M9-class CCLs. This matters most where insertion-loss budgets are tightest, i.e. the highest speeds and highest layer counts.
- Stable electricals: the low Dk/Df hold up across frequency and temperature, and PTFE absorbs very little moisture, so performance is stable in use.
- Less dependence on Q glass: because PTFE's intrinsic dielectric constant is already very low, reaching the target Dk requires less (and in some hybrid constructions, none) of the expensive, supply-constrained Q glass. That is both a cost lever and a supply-security benefit.
Disadvantages of PTFE
- Mechanically soft: low modulus makes it difficult to handle and to hold to tolerance.
- Difficult lamination: PTFE does not flow like a thermoset, so bonding needs either very high temperatures or lower-melting fluoropolymer (such as PFA (polyfluoroalkoxy))/thermoset bond layers; its high, non-linear CTE stresses copper adhesion and complicates layer-to-layer registration, and pressing typically requires vacuum or an inert atmosphere with longer cycles.
- Difficult drilling: the soft, gummy resin tends to smear and can tear, and any ceramic filler is abrasive on tooling. Also, the hole wall will not accept electroless copper without an added activation step (sodium etch or plasma) on top of normal desmear.
- Higher cost and qualification risk: materials and fabrication are both more expensive, the qualified supply base is narrower, and yields at very high layer counts carry risk.
1lJ CvalliDl•Le 1idiIIy
1LUuL olaun uo
Tee ul nuel ylaso witlt ultla luw ol
M
Cauron. Thifloul
Foundation
Net, PTFE offers the best electrical headroom, but the processing and cost penalties are real, which is why hybrid PTFE and a 'real M9' remain credible alternatives rather than PTFE being a foregone conclusion. On adoption, nothing is confirmed at this stage, but the outcome warrants close monitoring, as adoption of a PTFE-based solution could materially reshape the market-share split among the relevant materials suppliers, though we believe the overall CCL TAM growth remains unimpeded by this technology shift.
If adoption of a PTFE-based solution materializes, we view Shengyi as a key beneficiary . Shengyi has an established track record in producing PTFE CCLs for high-frequency applications, including automotive millimeter-wave radar, ultra-high-frequency satellite communications, and certain defense applications. The company is also working with several PCB vendors to develop PTFE CCLs for high-layer-count PCBs used in NVIDIA server systems.
We also see EMC competing for share in next-generation Nvidia switch board materials. For hybrid PTFE solutions, EMC partners with Taiflex (8039.TW, not covered), which contributes PTFE-related expertise, while EMC supplies M8-and-above prepregs that provide the structural support for the overall CCL. However, EMC's addressable market could shrink if it continues to source PTFE materials externally. This would represent a change from the current generation of Nvidia switch board CCLs, for which EMC manufactures a decent share of the CCL in-house.
By contrast, we see limited risk to TUC . TUC has traditionally not been a CCL supplier for Nvidia-branded products and has relatively limited direct exposure to Nvidia. Its main exposure comes from supplying CCLs for CPU motherboards in Nvidia HGX systems, where ODMs have discretion over PCB and CCL supplier selection. TUC's core exposure is instead to the high-end networking and ASIC server CCL markets, where we believe the likelihood of meaningful PTFE CCL adoption in server or networking-switch PCBs remains low over the medium term. We would therefore view any share-price pullback driven by investor concerns over PTFE adoption as a buying opportunity.
Exhibit 34: Taiflex's PTFE CCL stack-up - free of fiberglass with ultra low Df
Source: Taiflex.
M
CCL price drivers
CCL pricing rises with each performance grade because the underlying material requirements become more demanding. The transition from M2 to M10 typically involves:
- lower-loss resin systems,
- smoother copper foil,
- higher-specification glass cloth, and
- tighter tolerances for dielectric thickness, copper roughness, and material consistency.
These improvements are necessary to support higher data rates and maintain signal integrity, but they also increase both raw-material costs and formulation complexity.
Production costs also increase as manufacturing specifications become more stringent.
Higher-grade CCLs require tighter control over coating, lamination, curing, and inspection, while narrower process tolerances can reduce throughput and yield. Defects or variations that may be acceptable in lower-grade products can disqualify a sheet intended for highspeed applications, resulting in higher scrap rates and quality-assurance costs. Customer qualification is similarly more rigorous, covering electrical performance, thermal reliability, dimensional stability, and compatibility with advanced multilayer PCB processes.
The resulting ASP progression, from 1.0x for M2 to around 17x for M10, which reflects a cost curve that becomes increasingly steep at the highest grades. Incremental improvements in dielectric loss and conductor-related signal loss require disproportionately greater investment in materials, process control, equipment, and technical expertise.
High-grade CCLs also tend to have lower production volumes and fewer qualified suppliers, limiting economies of scale and supporting stronger pricing. As a result, premium CCL pricing reflects not only higher value material inputs and higher production costs, but also the value of enabling next-generation AI, networking, and high-performance computing systems.
M
Exhibit 35: Higher-grade CCL is materially more expensive per sheet, reflecting greater manufacturing complexity and lower production yields
CCL ASP by grade
Source: Morgan Stanley Research estimates.
What are the key risks?
AI demand may be structural but not linear. Hyperscaler investment can remain on a long-term upward trend while quarterly hardware demand remains volatile. Accelerator launch delays, power and cooling constraints, networking bottlenecks, changes in server architecture or a temporary digestion of previously installed capacity could shift PCB and CCL orders between periods. Because CCL sits relatively far upstream in the supply chain, inventory adjustments by PCB makers and distributors can amplify changes in end demand. Investors should monitor customer inventory days, lead times, order cancellations and PCB production rather than relying only on headline cloud capex.
Qualification leadership is valuable, but not permanent. Qualification creates incumbency, but not entitlement. A supplier qualified for a leading material grade today enters the next development cycle with meaningful advantages: validated resin and copper systems, accumulated production data, established yields, familiarity with the customer's PCB process and earlier access to next-generation design requirements. These factors should improve the probability of winning next-generation CCL business and can shorten the time required to move from development to commercial production.
Nevertheless, each platform transition can partially reopen the competitive process. The customer may change its loss budget, glass composition, copper-foil requirement, stackup, thermal specification or sourcing strategy, while also introducing additional suppliers to reduce concentration risk. A delayed qualification, reliability failure, inconsistent batch performance or inability to ramp qualified output can result in lost supply share. Given the size and concentration of leading AI platforms, missing one major qualification can affect revenue growth, product mix and margins for several quarters, even if the supplier remains competitive elsewhere.
Chinese entry at the top end. Shengyi and KB Laminates are expanding high-grade CCL
M
capacity with Shengyi being the front-runner, securing Nvidia M8 qualification, at least.
The near-term risk is not necessarily that Shengyi or Kingboard immediately displaces current leading CCL incumbents on the most technically demanding layers of a flagship Nvidia or ASIC platform. Competition may initially emerge through domestic China AI systems, less critical boards and layers, or second-source positions at global customers. That can still be economically significant: a broader qualified supplier base may limit ASP premiums, accelerate annual price reductions and dilute the share gains currently assumed for Taiwanese leaders. Over time, experience gained in M7- and M8-class products can also help competitors close the gap at higher grades.
Upstream bottleneck and constraints. At advanced CCL grades, the relevant bottlenecks are no longer generic fiberglass cloth, copper foil and resin. Suppliers require low-Dk, or quartz-based glass cloth; ultra-low-profile HVLP copper foil; and specialized low-loss resin systems.
- Glass cloth is particularly difficult to expand because advanced products require proprietary glass compositions, precise fiber drawing and highly uniform weaving and spreading. Toyota Industry's limited monthly output of air-jet weaving looms, would limit the output of new electronic-grade glass-cloth capacity expansion.
- High-end copper foil faces a similar constraint. As signal frequencies increase, smoother copper is needed to reduce conductor loss, but the foil must still maintain sufficient adhesion to the resin system through repeated thermal and manufacturing cycles. This makes HVLP foil materially harder to produce than conventional foil.
Upstream tightness is therefore a two-sided factor for CCL suppliers. Scarcity can support ASPs and reinforce the value of qualified capacity, but it can also prevent manufacturers from converting strong orders into shipments.
CPO adoption presents a longer-term risk to the premium CCL thesis. Its main advantage is that it reduces the electrical losses premium laminate grades are designed to address. By placing optical engines within millimeters of the switch ASIC, rather than sending high-speed signals across longer PCB traces, CPO could reduce the need for ultralow-Dk/Df materials such as M7 to M10. In effect, part of the signal-integrity challenge, and the associated value, would shift from the system board to the package substrate and interposer, potentially moving some margin capture from CCL suppliers to substrate and advanced-packaging players.
The risk is unlikely to be immediate. CPO still faces challenges around cost, yield, reliability, and thermal management, while pluggable optics remain the dominant architecture. We therefore view CPO as a multi-year risk to the pace of premium-grade CCL adoption, rather than a near-term threat to the supply tightness expected in 2026.
M
Implications for Japan CCL
Panasonic Holdings (6752.T) EW, covered by Kazuo Yoshikawa
Panasonic's multilayer circuit board material MEGTRON is positioned to benefit from the ongoing shift toward higher-performance CCL materials. In the current mix, products up to MEGTRON 6 account for roughly 60%, while M7 and M8 account for around 40%. MEGTRON 6 and earlier generations are mainly used in general-purpose servers, but partial adoption of MEGTRON 9 and next-generation MEGTRON X has already begun, reflecting demand for higher-performance applications.
Panasonic noted that it can flexibly switch production across grades using common production equipment. Going forward, the company plans to expand production capacity and further develop next-generation areas, including substrate-related applications, to differentiate its offerings. Panasonic plans to more than double capacity for highperformance multilayer circuit board materials from FY3/26 to FY3/31 and allocate approximately \60bn to circuit board materials over FY3/27-FY3/29. The company is expanding production capacity across three global sites and is evaluating further investment.
The company also noted that MEGTRON adoption is expanding beyond motherboards and substrates into automatic test equipment, supported by strong demand from a leading ATE manufacturer. Although material costs are rising, Panasonic has raised prices several times this year to pass these increases through to customers (Panasonic Holdings: Group Call with Management: AI Demand Spilling Over + Price Increases (2 Aug 2026)).
M
AI Server PCB/CCL Specs
Exhibit 36: Nvidia AI server CCL specs
| NVIDIA | H100 | H200 | B200 | GB200 NVL72 | GB300 NVL72 | VR200 NVL144 | VR300 |
|---|---|---|---|---|---|---|---|
| OCP Accelerator Module (OAM) | |||||||
| CCL Spec. | Very low-loss (M6) | Very low-loss (M6) | Ultra low-loss (M7) | Extreme low-loss (M8) + Low- loss (M4) | Extreme low-loss (M8) + Low- loss (M4) | Extreme low-loss (M8) + Low- loss (M4) | Extreme low-loss (M8) + Low- loss (M4) ? |
| CCL supplier | EMC | EMC | Doosan | Doosan | Doosan | Doosan | Doosan, ? |
| PCB Size | 152mm x 80.5mm | 152mm x 80.5mm | 170mm x 86.5mm | 305.5mm x 222mm | 305.5mm x 222mm | 320.8mm x 233.1mm | ? |
| PCB Spec. | 18L HDI (5+8+5) | 18L HDI (5+8+5) | 20L HDI (5+10+5) | 22L HDI (5+12+5) | 22L HDI (5+12+5) | 26L HDI (6+14+6) | ? |
| PCB Supplier | UMTC, TTM, WUS | UMTC, TTM, WUS | UMTC, TTM, WUS, VGT | VGT, UMTC | VGT, UMTC | VGT, UMTC, ZDT, etc. | VGT, UMTC, ZDT, ? |
| Universal Baseboard (UBB) | |||||||
| CCL Spec. | Ultra low-loss (M7) | Ultra low-loss (M7) | Extreme low-loss (M8) + Low- loss (M4) | NA | NA | NA | NA |
| CCL supplier | EMC, Doosan | EMC, Doosan | Doosan, EMC | NA | NA | NA | NA |
| PCB Spec. | 24L PTH | 24L PTH | 18L PTH | NA | NA | NA | NA |
| PCB Supplier | WUS, TTM, ISU | WUS, TTM, ISU | WUS, TTM, ISU, UMTC | NA | NA | NA | NA |
| Switch board | |||||||
| CCL Spec. | Ultra low-loss (M7) | Ultra low-loss (M7) | Ultra low-loss (M7), Extreme low-loss (M8) | Extreme low-loss (M8) + Standard loss (M2) | Extreme low-loss (M8) + Standard loss (M2) | Extreme low-loss (M8) | M9Q or hybrid PTFE ? |
| CCL supplier | EMC, TUC | EMC, TUC | EMC, TUC, Doosan | EMC, Shengyi | EMC, Shengyi | EMC, Shengyi | EMC+Taiflex, Shengyi, ? |
| PCB Spec. | 26-28L | 26-28L | 28-30L | 24L PTH | 24L PTH | 32L PTH | ? |
| PCB Supplier | WUS, TTM, ISU, GCE | WUS, TTM, ISU, GCE | WUS, TTM, ISU, GCE | WUS, TTM, UMTC, VGT | WUS, TTM, UMTC, VGT | WUS, TTM, UMTC, VGT | WUS, VGT, SCC, ? |
| CCL Spec. | Very low-loss (M6) | Very low-loss (M6) | Very low-loss (M6) | NA | NA | NA | NA |
| CCL supplier | EMC, TUC, ITEQ, Panasonic | EMC, TUC, ITEQ, Panasonic | EMC, TUC, ITEQ, Panasonic | NA | NA | NA | NA |
| PCB Spec. | 16-18L | 16-18L | 16-20L | NA | NA | NA | NA |
| PCB Supplier | GCE, WUS, TTM, ISU, Tripod | GCE, WUS, TTM, ISU, Tripod | GCE, WUS, TTM, ISU, Tripod | NA | NA | NA | NA |
| Midplane (in-tray) | |||||||
| CCL Spec. | M8 | M8? M9? | |||||
| CCL supplier | EMC | EMC, ? | |||||
| PCB Spec. | 44L PTH | 36L PTH? | |||||
| PCB Supplier | WUS, TTM, Kinwong, VGT, etc. | WUS, TTM, Kinwong, VGT, ? |
Source: Morgan Stanley Research.
M
Exhibit 37: ASIC server CCL specs
| TPUv7 (Ironwood) | TPUv8i (Sunfish) | TPUv8t (Zebrafish) | TPUv9 | TPUv10 | |
|---|---|---|---|---|---|
| Universal Baseboard (UBB) | Universal Baseboard (UBB) | Universal Baseboard (UBB) | Universal Baseboard (UBB) | Universal Baseboard (UBB) | Universal Baseboard (UBB) |
| CCL Spec. | Ultra low-loss (M7) | Extreme low-loss (M8) + Very low-loss (M6) | Extreme low-loss (M8) + Very low-loss (M6) | Testing M9 | M9? |
| CCL supplier | Panasonic, EMC | Panasonic, EMC | Panasonic, EMC | Panasonic, EMC and ? | Panasonic, EMC and ? |
| PCB Spec. | 24L PTH | 44L PTH | 40L PTH | HDI ? | HDI ? |
| PCB Supplier | TTM, ISU, WUS, GCE, etc. | TTM, ISU, WUS, Lincstech, GCE, VGT, SCC, ZDT, Dynamic, etc. | TTM, ISU, WUS, Lincstech, GCE, VGT, SCC, ZDT, Dynamic, etc. | TTM, ISU, WUS, Lincstech, GCE, VGT, SCC, ZDT, Dynamic and ? | TTM, ISU, WUS, Lincstech, GCE, VGT, SCC, ZDT, Dynamic and ? |
| AWS | Trainium 2.0 Inferentia 2.5 | Trainium 2.5 | Trainium 3.0 | ||
| OCP Accelerator Module (OAM) | OCP Accelerator Module (OAM) | OCP Accelerator Module (OAM) | OCP Accelerator Module (OAM) | ||
| CCL Spec. | Very low-loss (M6) | Very low-loss (M6) | Ultra low-loss (M7) | ||
| CCL supplier | Panasonic | Panasonic | Panasonic | ||
| PCB Spec. | 22L HDI | 24L HDI | 24L HDI | ||
| PCB Supplier | Shengyi Elec | Shengyi Elec, ZDT | Shengyi Elec, ZDT | ||
| Universal Baseboard (UBB) CCL Spec. | Extreme low-loss (M8) | Extreme low-loss (M8) | Extreme low-loss (M8) | ||
| CCL supplier | EMC, TUC | EMC, TUC | EMC, TUC and ? | ||
| PCB Spec. | 26L PTH | 26L PTH | 26L PTH | ||
| PCB Supplier | GCE, Shengyi Elec, FHT, WUS | GCE, Shengyi Elec, FHT, WUS | GCE, Shengyi Elec, FHT, WUS | ||
| Meta | MTIA 2 MTIA T-V1 (Athena) | MTIA 3 MTIA T-V1.5 (Iris) | MTIA 4 MTIA T-V2 (Olympus) | ||
| Universal Baseboard (UBB) | Universal Baseboard (UBB) | Universal Baseboard (UBB) | Universal Baseboard (UBB) | ||
| CCL Spec. | Extreme low-loss (M8) + Low- loss (M4) | Extreme low-loss (M8) + Low- loss (M4) | M9? | ||
| CCL supplier | EMC | EMC | EMC and ? | ||
| PCB Spec. | 36-40L PTH | 40+L PTH | ? | ||
| PCB Supplier | WUS, TTM, ISU | WUS, TTM, GCE, ISU | WUS, TTM, GCE, ISU ? |
Source: Morgan Stanley Research.
M
Copper Foil
Market development and competition
For two decades, PCB/CCL copper foil has been both cyclical, tracking electronics production, and technology-driven, with premium grades pulling away from commodity foil as customers demand thinner, smoother, more consistent material. What has changed is where the performance frontier sits.
Phase 1 (2016-2018): EV batteries drew attention away
Between 2016 and 2018, electric vehicles (EVs) became the industry's main source of incremental growth as PC and smartphone demand plateaued. Most new investment therefore flowed into EV battery foil, which created a short-lived circuit foil shortage in 2016-17 and allowed suppliers to raise prices. Circuit foil itself advanced more quietly during this period, driven by interconnect and data-transmission requirements rather than headline volume. The qualities that would later define premium foil - surface smoothness, low defect rates, and high yield - were already beginning to improve.
Phase 2 (2018-2019): The circuit foil shortage eased
In 2018-2019, the supply-demand imbalance in the circuit foil market normalized as capacity increased and demand across PCs, smartphones, and servers stagnated. Copper prices and suppliers' processing fees fell sharply as a result, leading to two years of declining profitability for circuit foil suppliers.
Phase 3 (2020-2022): The COVID-19 demand surge
During COVID quarantines, work-from-home needs drove a sudden surge in demand for notebooks, tablets, gaming devices, servers, and networking switches. This created a favorable pricing environment for circuit foil suppliers, who benefited not only from higher volumes but also from accelerated material upgrades across the PCB/CCL supply chain as data-transmission requirements rose. Suppliers focused on circuit foil - notably Co-Tech - were able to pass higher copper costs on to customers and implement price increases, which drove margin expansion.
Phase 4 (2022-2024): Inventory de-stocking
Price competition for standard circuit foil (HTE / partial RTF) intensified during this period. End demand was subdued as the market worked through the excess inventory built up during the WFH era, and new Chinese capacity pushed the commodity segment further into oversupply. At the same time, a new premium driver emerged: AI infrastructure mainly high-end servers and switches - which requires ultra-smooth, low-profile copper to limit signal loss.
Phase 5 (2025-Future): AI, HVLP scarcity, and premium leadership
AI tightened the premium segment, while the commodity segment shifted from broad oversupply to benefiting from surging demand for general-purpose servers used in agentic AI workloads and from pull-forward PC demand (in late 2025 to 1H26). In particular, demand for HVLP (hyper-very-low-profile) foil - the ultra-smooth grade required for
M
high-speed AI-server and networking boards, where standard foil loses too much signal has outrun supply.
High-end capacity remains concentrated in Japan and Taiwan, led by Mitsui Kinzoku (5706.T) and Furukawa Electric (5801.T) - both covered by Yu Shirakawa - with CoTech catching up aggressively. Planned expansions are expected to cover only part of AI server-related demand, implying likely undersupply in 2027. The result is a selective market, with premium, qualified circuit foil clearly outperforming standard supply.
Note: Co-Tech (8358.TWO) has no involvement in EV battery copper foil and substrate copper foil. This report therefore focuses only on the development of PCB/CCL (circuit) copper foil; lithium-battery foil or substrate foil is a separate segment and appears above only as context for where the industry's growth capital went.
| Phase | Primary drivers | Main development |
|---|---|---|
| Phase 1: 2016-2018 | Commercialization of electric vehicles (EV) | Most new investment flowed into EV battery foil, which created a short-lived circuit foil shortage. |
| Phase 2: 2018-2019 | Stagnant demand for PCs, smartphones and servers | The supply-demand imbalance in the circuit foil market normalized, leading to declining profitability. |
| Phase 3: 2020-2022 | The COVID-19 demand surge | Circuit foil suppliers saw a sudden surge in demand from quarantine PC/gaming device/tablet purchases and increased server shipments |
| Phase 4: 2022-2024 | Inventory de-stocking | End demand was subdued; capacity additions from the COVID period further pushed the market into oversupply |
| Phase 5: 2025-Future | AI diffusion | AI/data center-related circuit foil content per rack continues to rise as boards become larger, layer counts increase and more advanced materials are adopted. Leading circuit foil suppliers enjoy better profitability from mix improvement and price hikes. |
We estimate the global R-PCB (excluding substrate copper foil) copper foil addressable market will grow at a 14% CAGR in 2025-30, from US$5.0B to US$9.6B ,
driven almost entirely by AI and data-center infrastructure. As shown in Exhibit 38 and Exhibit 39 , AI/data-center HVLP4+ copper foil demand is expected to grow 123% over 2025-2030 to US$2.8B in 2030, taking its value share of industry revenue from a low single digit to 29%. On our estimates, AI/data-center applications account for essentially all of the industry's net growth through 2030, with demand across other end markets (PC, smartphone, tablets, consumer electronics, etc.) broadly stable.
We expect the R-PCB copper foil TAM growth to be tracking that of the global R-PCB market growth, which is driven by broad-based demand across general servers, GPU servers, custom ASIC servers, networking switches and optical modules, supported by rising system shipments and continued scaling of compute clusters (see Exhibit 40 and Exhibit 41 ).
M
Exhibit 38: We estimate global R-PCB copper foil TAM to expand at a 14% CAGR to US$9.6B over 2025-2030...
Source: Morgan Stanley Research estimates.
Exhibit 40: We expect AI/DC related circuit copper foil to account for 58% of the total R-PCB copper foil market by 2030
Source: Morgan Stanley Research estimates.
Exhibit 39: ...and HVLP4+ copper foil TAM to expand at a 123% CAGR to US$2.8B, or 29% of total R-PCB copper foil TAM
Source: Morgan Stanley Research estimates.
Exhibit 41: Within the AI/DC related circuit copper foil TAM, AI servers and switches are becoming bigger revenue contributors
Source: Morgan Stanley Research estimates.
Bottleneck emerges?
HVLP4 (hyper very low profile) copper foil is the enabling material for the fastest copper interconnects in AI infrastructure. It is laminated into high-speed copper-clad laminate (CCL) and then fabricated into the high-layer-count PCBs - compute boards, switch boards and midplanes - that carry the newest high-speed signals at acceptable insertion loss. The direct buyers are therefore CCL producers. End demand is pulled almost entirely by the leading AI accelerator and networking programs.
Application
I POO PER CHE
Switches eme
Routers
Transmission loss
Low
Product type
New copper foil is under development.
M
production
Exhibit 42: Mitsui Kinzoku: Copper Foil for High-Frequency Communication Infrastructure VSP™
Rz 1.0 um
Source: Mitsui Kinzoku.
On our bottom-up build, HVLP4 adoption is specified into Nvidia Rubin and successors, Nvidia LPX racks, AWS Trainium3/4 , Google TPU v8 family (Sunfish/Zebrafish) and successors, AMD "Helios" racks, Meta MTIA Iris , and both 800G (partially) and 1.6T Ethernet switches . In 2026, we estimate the single largest demand comes from AWS Trainium3 (360+ tons per month) ahead of Nvidia NVL72+LPX (180+ tons per month); by 2028, the base broadens materially, with Nvidia NVL72+LPX (760+ tons per month), the Google TPU family (1,100+ tons per month) and 800G/1.6T switches (1500+ tons per month combined) becoming the dominant consumers, and AMD Helios adding 440+ tons per month. It's worth noting that networking could be easy to under-weight but, on sheer unit volume, is as large as any single accelerator program by the end of our forecast.
HVLP4 copper foil supply remains more concentrated than demand and, in our view, is the binding constraint. Mitsui Kinzoku (5706.T, covered by Yu Shirakawa) is the clear incumbent leader, accounting for 41% of global HVLP4 capacity in 2026, and still the largest at 33% in 2028, on our estimates, even as the field broadens. The most important second source is Co-Tech , which is the fastest follower: from a negligible <50 tons/month in 2025 capacity, we model it scaling to at least 200 tons by the end of 2026, 700 tons by EoY 2027 and 800 tons by EoY 2028. This will bring Co-Tech's supply share to 21% in 2028 from only 13% in 2026, making it the second largest supplier to Mitsui.
Beyond these two, Japan's Furukawa (5801.T, covered by Yu Shirakawa) and Fukuda (private), as well as Luxembourg's CFL , add incremental qualified tons, while a cohort of Chinese and Korean entrants - primarily Tongguan, Defu and Lotte Energy Materials (020150.KS, covered by Ryan Kim) - sits in our "Others" bucket and is racing to expand capacity. We would stress that "catching up" in HVLP4 means clearing customer qualification at the CCL/PCB level, not merely installing a line; the incumbents' lead in yield and consistency is why our supply build stays top-heavy toward Mitsui and Co-Tech even in the out-years.
Our HVLP4 model is built bottom-up: we take our rack- and switch-level shipment forecasts and multiply by an engineered estimate of HVLP4 foil consumed per rack, derived from board area, layer count, HVLP4 layer coverage, and areal density (1oz default), then gross up net foil to consumed foil and process scrap. On this basis, our HVLP4 monthly demand estimate rises from 1,028 tons in 2026 to 3,270 tons in 2027 (+218% y/y) and 4,335 tons in 2028 (+33% y/y). This equates to a market TAM of US
High
High-grade
Copper foil category
HVLP3
HVLP2
HVLP
SI-VSP
HS2-VSP
HS1-VSP
Cross-section image/
Laminate surface
M
$540M, US$1.7B and US$2.3B, respectively.
Against our modeled average monthly global capacity of 1,080/2,495/3,600 tons in 202628, we conclude that the market tips into undersupply in late 2026, and the undersupply gap then widens sharply in 2027 to 31% and remains a meaningful 20% shortfall in 2028 . In short, our base case shows HVLP4 undersupply emerging in 2026, deepening in 2027, and sustaining through 2028.
New capacity is also difficult to scale. Two structural constraints sit at the center of our undersupply call. First, equipment lead times: the surface treatment step - the process that gives the foil its ultra-low, ultra-uniform profile - relies on specialized lines from a very small set of Japanese equipment makers (e.g., Mifune, New Long and Nishi Industry). With essentially the whole industry trying to expand at once, delivery times for these treaters have stretched, and every expansion - incumbent or newcomer alike - is effectively queuing for the same tools, pushing the date at which new nameplate capacity produces sellable HVLP4 well to the right. Second, throughput: HVLP4's real output per unit time is inherently lower than that of RTF or lower-tier HVLP. Hitting the very low profile and tight roughness tolerance requires the treatment lines to run slower and within a much narrower process window, and first-pass yields are lower - so a given line yields materially fewer tons of qualified HVLP4 per unit time than it would of lower grades. The steep processing-fee premium HVLP4 commands over RTF and lower HVLP tiers in our model ( Exhibit 47 ) is a direct reflection of that added difficulty. The two effects compound: even if a maker has ordered tools, the combination of delivery queues and low as-run throughput caps how fast usable tons actually reach customers.
Still, we would flag a few downside risks to our call:
- First, overcapacity: a fast, subsidized ramp could add qualified tons faster than we assume and close the gap.
- Second, yield: better-than-expected yield and throughput gains would effectively lift real capacity off the same equipment base and erode the deficit.
- Third - and least likely, in our view - a PCB design shift that removes the need for HVLP4 foil altogether; we struggle to construct a realistic path to this, since high-speed copper interconnect still requires low-loss foil.
- Fourth, on the demand side, a shortage of other critical materials or components (advanced glass fabric, ABF substrate, memory, optics, etc.) could delay when customers actually pull HVLP4 orders in, softening the near-term deficit even if end-demand is intact.
- Fifth, slower-than-expected or cancelled data-center build-outs - the ultimate demand driver - would lower rack and switch shipments and, mechanically, HVLP4 demand across the forecast.
Beyond these, our estimates are sensitive to the per-rack foil assumptions, to ASP/mix, and to how much nameplate capacity is genuinely HVLP4-qualified versus lower grade small changes in any of these could impact the balance.
M
Exhibit 43: HVLP4+ copper foil supply-demand analysis
Source: Company data, Morgan Stanley Research estimates.
Exhibit 44: We estimate average HVLP4+ copper foil capacity will increase 131% in 2027 and another 44% in 2028...
Exhibit 45: ...but demand should rise faster than supply, up 218% in 2027 and 33% in 2028
Source: Company data, Morgan Stanley Research estimates.
Source: Company data, Morgan Stanley Research estimates.
M
Exhibit 46: We expect Co-Tech's supply share for HVLP4 copper foil to rise to 21% by 2028
Global HVLP4 copper foil suppliers' market share by capacity (2028E)
Source: Morgan Stanley Research estimates.
Exhibit 47: We estimate HVLP4 processing fee to be >7x that of HTE/RTF process fee
Source: Morgan Stanley Research estimates.
M
Exhibit 48:
Copper foil types and respective applications
| Copper Foil | Applications |
|---|---|
| HVLP5+ | NVIDIA Kyber midplane? 1.6T/3.2T switch? etc. |
| HVLP4 | NVIDIA Rubin, AWSTrainium3, NVIDIA LPX, Google TPU v8, AMDMI450, Meta MTIA Iris, 800G switch, 1.6T switch, etc. |
| HVLP3 | NVIDIA Blackwell, Google TPUv7, 800G switch, etc. |
| HVLP2 | AWSTrainium2, Google TPUv5/v6, LEO satellite, etc. |
| HVLP1 | General server, switch, LEO satellite, etc. |
| RTF | General server, switch, PC, all kinds of electronic devices. |
| HTE | FCCL, automotive, power supply, HDI for 3C products, high-frequency applications. |
| RCC | Mobile applications (requires thin and light-weight features) |
Source: Morgan Stanley Research.
M
Implications for Japan PCB
Sota Harashima
PCB suppliers' profitability has recently been under pressure: As shown in the quarterly operating margin chart, profitability trends among Japanese PCB manufacturers, including our covered companies Meiko Electronics (6787.T) and CMK (6958.T), have recently remained weak, with only a few exceptions. We estimate that this was primarily attributable to higher gold prices used in plating processes, as well as the rapid increase in CCL procurement costs.
Exhibit 49: Quarterly OPM trend for Japanese PCB manufacturers
Source: FactSet
Strong demand for high-grade CCL may have contributed to weaker PCB manufacturer profitability: In PCBs used for automotive, consumer electronics, and smartphone applications, general-purpose CCL grades such as FR-4 are widely used. While CCL suppliers are expanding production capacity for high-end products, we believe they are also reallocating capacity from general-purpose grades to higher-end materials. As a result, we believe the cost burden on PCB manufacturers that mainly use general-purpose CCL has increased in the near term.
Exhibit 50: Major PCB composition by application
| Usage/Product | 1-2 sided ◯ | MLB | HDI | Flexible/ Rigid-flex ◯ |
|---|---|---|---|---|
| General server/Computer | ◯ (4-16) ◯ | ◯ ◯ | ◯ | |
| AI server | ◯ | (4-40+) ◯ | ◯ | |
| Automotive | (4-8) | |||
| Mobile | ◯ | (4-12) | ||
| Consumer electronics | ◯ ◯ (4-6) | ◯ | ◯ | |
| 5G | ◯ ◯ | ◯ (20-26) | ◯ ◯ | |
| Industrial | ◯ (4-16) ◯ | |||
| Medical | (-20) ◯ | |||
| Aerospace/Millitary | ◯ | (4-6) | ◯ | |
| Satellite | ◯ | (8+) |
Source: Morgan Stanley Research.
◯
◯
Cost pass-through has become easier, but further CCL price inflation remains a key risk: Pricing revisions for automotive and smartphone PCBs are typically conducted at
M
predetermined intervals, such as at the beginning of the year, the start of a fiscal period, or during the ramp-up of new smartphone models. Since Japanese PCB manufacturers generally have a higher exposure to automotive and consumer applications than their Greater China peers, we believe the decline in profitability has become more pronounced among Japanese companies.
That said, end-product manufacturers currently appear to be prioritizing supply security over component prices, which we believe has allowed PCB manufacturers to implement price increases over shorter intervals than was previously possible. We expect margin pressure to gradually ease from 2Q onward as price pass-through progresses. However, a further acceleration in CCL price increases remains a key risk to monitor. In addition, there is a possibility that end-product manufacturers may pass higher material costs on to consumers through higher product prices, which could eventually lead to weaker end demand.
For Meiko, increasing contributions from high-value-added build-up PCBs should support mid-term margin expansion: We expect sales of high-value-added build-up PCBs utilizing high-grade CCL, including accelerator boards, eSSD modules, and optical transceiver PCBs for AI servers, as well as antenna PCBs and satellite PCBs for LEO satellite communications, to increase from 2H F3/27 onward. By F3/31, we expect AI server-related products to account for approximately 17% of company-wide sales and satellite communication-related products to account for approximately 21%, driving both revenue growth and margin expansion.
Exhibit 51: Meiko Electronics: Sales composition by application (F3/26)
Exhibit 52: Meiko Electronics: Sales composition by application (F3/31e)
Source: Company data, Morgan Stanley Research.
Source: Company data, Morgan Stanley Research estimates.
Meiko has approximately 15 years of mass production experience in high-layer-count buildup PCBs in Vietnam and has been successfully capturing demand from customers seeking to diversify away from Greater China supply chains, particularly in North America. We believe this trend will continue over the medium term and estimate that the company can achieve approximately 20% revenue and 28% operating profit CAGR.
M
Exhibit 53: Meiko Electronics: Mid-term forecasts
| (JPY bn, JPY/share) | F3/24 | F3/25 | F3/26 | F3/27 MSe | F3/27 Ce | F3/28 MSe | F3/28 Ce | F3/29 MSe | F3/29 Ce | F3/30 MSe | F3/31 MSe |
|---|---|---|---|---|---|---|---|---|---|---|---|
| Sales | 179.5 | 206.8 | 240.6 | 323.8 | 320.0 | 412.9 | 390.0 | 482.1 | 460.0 | 539.7 | 595.1 |
| Automotive | 94.7 | 90.4 | 97.5 | 101.3 | 100.0 | 104.0 | 101.0 | 107.0 | 104.0 | 110.3 | 113.9 |
| Smartphone/Tablet | 23.6 | 25.5 | 29.4 | 36.8 | 37.0 | 54.5 | 44.0 | 70.8 | 54.0 | 76.1 | 81.9 |
| Satellite | 7.6 | 16.6 | 28.2 | 56.0 | 55.0 | 82.0 | 79.0 | 102.0 | 94.0 | 114.0 | 127.4 |
| AI server | - | 4.2 | 7.3 | 20.0 | 17.0 | 45.0 | 38.0 | 60.0 | 60.0 | 82.0 | 99.2 |
| Moludes | - | 9.2 | 9.2 | 13.0 | 13.0 | 16.0 | 16.0 | 18.0 | 18.0 | 20.0 | 22.0 |
| Amusement/Smart appliance/Others | 14.1 | 23.7 | 24.4 | 27.8 | 29.0 | 28.2 | 28.0 | 30.1 | 29.0 | 32.1 | 34.4 |
| Electronic equipment | 30.3 | 36.2 | 42.6 | 66.0 | 66.0 | 79.2 | 76.0 | 89.2 | 86.0 | 99.2 | 109.2 |
| IC Package | 0.7 | 1.0 | 2.0 | 3.0 | 3.0 | 4.0 | 8.0 | 5.0 | 15.0 | 6.0 | 7.0 |
| OP | 11.66 | 19.083 | 24.572 | 38.6 | 38.0 | 48.7 | 51.0 | 62.5 | 65.0 | 73.4 | 83.8 |
| OPM | 6.5% | 9.2% | 10.2% | 11.9% | 11.9% | 11.8% | 13.1% | 13.0% | 14.1% | 13.6% | 14.1% |
| ROE | 12.9% | 14.5% | 16.2% | 18.9% | 17.1% | 20.5% | 20.1% | 22.3% | 21.1% | 21.9% | 21.2% |
| EPS | 428.7 | 569.5 | 758.6 | 1,063.6 | 1,039.7 | 1,336.4 | 1,362.0 | 1,753.2 | 1,749.0 | 2,084.4 | 2,427.3 |
| FCF | 1.8 | -2.7 | -27.9 | -42.7 | - | -19.6 | - | 4.4 | - | 15.3 | 23.7 |
Note: MSe=Morgan Stanley Research estimates, Ce=Company guidance Source: Company data, Morgan Stanley Research estimates.
M
Risk Reward - Meiko Electronics (6787.T) Risk Reward - Meiko Electronics (6787.T)
Rapid Earnings Growth Driven by Aggressive Investment Largely Priced in
¥39,200 PRICE TARGET
Our price target is ¥39,200, based on a DCF valuation (risk-free rate 2.6%; beta 1.5; risk premium 3.2%; WACC 4.6%); beyond our 3-year base earnings models, we also build forecasts for F3/30-31 into our DCF-based valuation, and our assumptions for F3/32 onward are that the firm maintains FCF/share of ¥2,800; our price target equates to 36.9x our F3/27e EPS of ¥1,063.6, and our forex rate assumption for the next quarter and thereafter is ¥155/$.
Source: Refinitiv, Morgan Stanley Research
BULL CASE
¥69,000
Faster demand growth in buildup/semi PKG substrate
OP and EPS forecasts of ¥42.4bn/¥1,176.6 in F3/27, ¥61.9bn/¥1,726.0 in F3/28, ¥87.5bn/ ¥2,497.4 in F3/29, ¥111.3bn/¥3,214.3 in F3/30, and ¥132.2bn/¥3,868.8 in F3/31. Our calculations also assume that from F3/32 onward the firm can maintain FCF/share at ¥4,500. Our fair value equates to 58.6x our F3/27e EPS of ¥1,176.6 and 11.4x BPS of ¥6,045.4.
EQUAL-WEIGHT THESIS
Our scenario has the firm benefitting from production capacity enhancements undertaken to meet growing demand. We evaluate positively its proactive stance on expanding production capacity for build-up substrates, including those for satellite communications and high-end smartphones. In our view, Meiko's expertise in producing build-up substrates in Vietnam will enable it to benefit from growing demand for high layer/density buildup PCBs, as well as from efforts to move supply chains out of Greater China.
Risk Reward Themes
New Data Era: Secular Growth:
Positive Positive
View descriptions of Risk Rewards Themes here
BEAR CASE
¥17,000
AI server/satellite demand weakens
OP and EPS forecasts of ¥36.4bn/¥997.4 in F3/27, ¥34.5bn/¥919.5 in F3/28, ¥38.6bn/ ¥1,048.1 in F3/29, ¥43.0bn/¥1,184.4 in F3/30, and ¥47.6bn/¥1,351.9 in F3/31. Our calculations also assume that from F3/32 onward the firm can maintain FCF/share at ¥1,550. Our fair value equates to 17.0x our F3/27e EPS of ¥997.4 and 2.9x BPS of ¥5,866.2.
BASE CASE
¥39,200
Continued growth in high layer/density buildup PCB
OP and EPS forecasts of ¥38.6bn/¥1,063.6 in F3/27, ¥48.7bn/¥1,336.4 in F3/28, ¥62.5bn/¥1,753.2 in F3/29, ¥73.4bn/¥2,084.4 in F3/30, and ¥83.8bn/¥2,427.3 in F3/31. Our calculations also assume that from F3/32 onward the firm can maintain FCF/share at ¥2,800. Our PT equates to 36.9x our F3/27e EPS of ¥1,063.6 and 6.6x BPS of ¥5,932.4.
M
Risk Reward - Meiko Electronics (6787.T)
KEY EARNINGS INPUTS
| Drivers | Mar 2026 | Mar 2027e | Mar 2028e | Mar 2029e |
|---|---|---|---|---|
| Operating Profit (¥, mn) | 24,572 | 38,600 | 48,700 | 62,500 |
| Sales YoY (%) | 16.3 | 34.6 | 27.5 | 16.8 |
| ROE (%) | 16.2 | 18.9 | 20.5 | 22.3 |
| Inventory (¥, mn) | 49,530 | 64,003 | 78,222 | 87,369 |
| Sales of HDI substrate (¥, mn) | 109,800 | 164,000 | 238,300 | 295,900 |
INVESTMENT DRIVERS
Potential upside catalysts include growth in buildup PCB sales and an expanded applications/customer base, as well as increased business in satellite communications. We are also keen to see when demand for semi package substrate really gets going.
GLOBAL REVENUE EXPOSURE
Source: Morgan Stanley Research Estimate View explanation of regional hierarchies here
MS ALPHA MODELS
3 Month Horizon
Source: Refinitiv, FactSet, Morgan Stanley Research; 1 is the highest favored Quintile and 5 is the least favored Quintile
RISKS TO PT/RATING
RISKS TO UPSIDE
Manifested growth in buildup PCBs mainly for automotive products/low orbit satellite communications; expansion of customer base for high-end smartphone applications; and rapider growth in demand for chip package substrates.
RISKS TO DOWNSIDE
Earlier launch of ASEAN capacity by Taiwanese peers; another downturn in auto production; a rise in material costs; fiercer competition from rivals in automotive PCBs.
OWNERSHIP POSITIONING
Inst. Owners, % Active
72.7%
Source: Refinitiv, Morgan Stanley Research
MS ESTIMATES VS. CONSENSUS
M
EMC (2383.TW): Initiate at Overweight, Price Target of NT $8,400
Company overview
Elite Material Co. was incorporated on 24 March 1992 in Taoyuan's Guanyin Industrial District, where it still has its head office, and began by supplying conventional FR-4 thin laminates and prepreg; it listed on the Taiwan Stock Exchange on 27 November 1998. In 2002, EMC introduced its Green Materials product line using a license from Hitachi Chemical of Japan. By 2013, it had become the largest halogen-free CCL supplier in the world, according to Prismark (a position it still holds). Since the beginning, EMC also worked on HDI board materials, which paid off when it entered Apple's supply chain in 2009. After many years of working with Apple on ultra-thin prepreg and any-layer/mSAP process control, it gave EMC the capability to develop CCL required for high-speed server materials, and in 2017, EMC entered high-speed CCL and eventually became number one by 2023, when AI server specifications pushed the whole industry up the M-grade ladder.
Key products
Copper-clad laminates (CCL) and prepreg are EMC's two core products and are sold to the same customer base. CCL forms the cured core layers of a multilayer PCB, while prepreg is a semi-cured, resin-impregnated glass cloth used to bond those layers together. EMC also operates a small mass-lamination business in Hsinchu, though its contribution is negligible.
Product mix by grade. In 2H26, we expect M7 and above to account for 67% of the product mix, in line with our margin outlook. We believe the mix will continue to shift toward higher-grade products as AI server PCBs require increasingly advanced CCL. Given EMC's position as the leading global supplier of high-speed CCL, we expect this mix upgrade to support continued margin expansion.
Total capacity expands from 4,200K sheets/month in 2023 to 11,250K sheets/month in 2028, roughly 2.7x in 5Y. Additions are heavily concentrated in 2025-28. 2025 capacity increased by 34% in 2025, 5% in 2026, will increase by 54% in 2027 and another 19% in 2028. China continues to be EMC's biggest production site, with an expected 8,750K sheets/month ending CY28, which would account for 78% of total capacity, with Taiwan accounting for 15%, Malaysia 7%, and the US <1%.
M
Exhibit 54: Quarterly product mix
Source: Company data, Morgan Stanley Research estimates.
Exhibit 56: Capacity data
Elite Material CCL capacity (K Sheets/Month)
Source: Company data, Morgan Stanley Research.
Exhibit 55: Annual product mix
Source: Company data, Morgan Stanley Research estimates.
Exhibit 57: EMC's CCL grade breakdown (2H26e)
Source: Morgan Stanley Research estimates.
Key competitors
The competitive landscape varies by product grade. In commodity FR-4, the largest volume suppliers include China's Kingboard Laminates and Shengyi Technology, as well as Nan Ya Plastics, with the top five producers accounting for more than 60% of the global CCL market. However, this is not EMC's primary market. EMC primarily plays in the highspeed and low-loss materials space, and in this market, its closest competitors are Taiwan Union Technology, Panasonic, Doosan Electro-Materials, and Shengyi Technology.
Key customers
EMC sells directly to PCB fabricators. As AI servers have become an increasingly important part of its high-speed CCL business, its customer base has come to include many of the world's leading PCB manufacturers, including Gold Circuit Electronics, Unimicron, Victory Giant, Wus Printed Circuit, Compeq, Shennan Circuits, TTM Technologies, and Tripod Technology, among others.
These relationships are typically close and engineering-intensive, as EMC must tailor its materials to each fabricator's manufacturing process and the performance requirements of the end platform. In most cases, however, the laminate specification is set or approved by
M
the platform owner, such as Nvidia or a US hyperscaler. EMC therefore generally wins the design-in at the end-customer level, after which the approved material is adopted by the designated PCB fabricators. The full design-in and qualification cycle for a new high-speed CCL platform can take 12-18 months.
What are the key risks?
- AI demand is structural but volatile: Hardware/CCL orders can swing with delays, bottlenecks and inventory digestion.
- Qualification creates an edge, not permanence: Incumbents benefit, but each platform transition can reopen competition.
- Competition is rising: Shengyi/Nan Ya/Kingboard could pressure share, pricing and margins, even initially via second-source positions.
- Upstream materials are constrained: Advanced glass cloth and HVLP copper foil shortages support pricing but can cap shipments.
- CPO is a longer-term risk: It could reduce demand for premium CCL grades, but is unlikely to materially affect 2026 tightness.
Price target and valuation methodology
Our price target for EMC is NT$8,400: This implies 20x CY28 P/E. Our price target is also our base case scenario value. It is derived from our residual income (RI) model (similar to the rest of our tech hardware universe).
To calculate the fair value of the stock, we use the company's beginning equity plus the present value of all expected residual income of earnings in excess of cost of capital. The RI is positive when ROAE is above the cost of capital and negative when it is below the cost of capital. Our key assumptions include a cost of equity of 9.3% (beta of 1.0, equity risk premium of 8.7%, and risk-free rate of 1.0%), a medium-term growth rate of 12% and a terminal growth rate of 3%.
The 20x CY28 P/E implied by our price target is slightly above the past 3Y average +1SD of 19x, but much lower than the 32x recent P/E peak. We deem this valuation as fair, because EMC is benefitting from an earnings growth cycle fueled by stronger AI server CCL demand, EMC's own mix improvement and continued pricing adjustments, supporting margin expansion from 29.8% in 2025 to 41.4% by 2028 and an EPS CAGR of 117% over 2025-2028, on our estimates. Our 20x CY28 P/E for EMC is also higher than 18.5x for TUC, reflecting EMC's leading position in the AI CCL market in terms of both technology capabilities and production capacity. The stock is trading at just 12.8x CY28 P/E, below EMC's past 3Y average of 14x and Shengyi's current valuation of 21x CY28 P/E. Thus, we view the risk reward as attractive.
Bull case value NT$13,000: In this scenario, we assume demand for general servers, networking switches, and AI servers sees significantly stronger growth in 2026-28, driven by replacement and new data center builds. In addition, we also assume EMC to take share and see faster material upgrade across all AI platforms. Under this scenario, our bull case value implies 31x CY28 P/E.
Bear case value NT$4,000: In this scenario, we assume demand for general servers, networking switches, and AI servers declines vs our current expectations of growth, in
M
2027-28. In addition, we also assume CPO adoption happens faster than expected, and Chinese CCL makers are able to expand more capacity and take share on advanced CCLs. Under this scenario, our bear case value implies 10x CY28 P/E.
Exhibit 58: Residual income (RI) model
| 2027E | 2028E | 2029E | 2030E | 2031E | 2032E | 2033E | 2034E | 2035E | 2036E | 2037E | ||
|---|---|---|---|---|---|---|---|---|---|---|---|---|
| Total Equity | 154,341 | 246,445 | 309,532 | 380,191 | 459,328 | 547,961 | 647,231 | 758,413 | 882,937 | 1,022,403 | 1,145,371 | |
| Net Profit | 95,400 | 149,147 | 167,045 | 187,090 | 209,541 | 234,686 | 262,848 | 294,390 | 329,716 | 369,282 | 380,361 | |
| Return on Equity | 79.7% | 74.4% | 60.1% | 54.3% | 49.9% | 46.6% | 44.0% | 41.9% | 40.2% | 38.8% | 35.1% | |
| Beta | 1.0 | 1.0 | 1.0 | 1.0 | 1.0 | 1.0 | 1.0 | 1.0 | 1.0 | 1.0 | 1.0 | 1.0 |
| Equity Risk Premium (Rm-Rf) | 8.7% | 8.7% | 8.7% | 8.7% | 8.7% | 8.7% | 8.7% | 8.7% | 8.7% | 8.7% | 8.7% | 8.7% |
| Risk Free Rate (Rf) | 1.0% | 1.0% | 1.0% | 1.0% | 1.0% | 1.0% | 1.0% | 1.0% | 1.0% | 1.0% | 1.0% | 1.0% |
| Cost of Equity | 9.3% | 9.3% | 9.3% | 9.3% | 9.3% | 9.3% | 9.3% | 9.3% | 9.3% | 9.3% | 9.3% | 9.3% |
| Residual Income | 59,902 | 100,512 | 125,160 | 139,125 | 154,415 | 171,299 | 190,034 | 210,886 | 234,139 | 260,103 | 263,660 | |
| Spread | 70.4% | 65.1% | 50.8% | 44.9% | 40.6% | 37.3% | 34.7% | 32.6% | 30.9% | 29.5% | 25.8% | |
| Beginning Equity Capital | 154,341 | |||||||||||
| PV of Forecast Period | 1,085,818 | |||||||||||
| PV of Continuing Value | 1,769,722 | |||||||||||
| Equity Value | 3,009,882 | |||||||||||
| No. of Shares | 358 | |||||||||||
| Projected Price | 8,400.0 | |||||||||||
| Implied CY27 PE | 32x | |||||||||||
| Implied CY28 PE | 20.2x |
Source: Morgan Stanley Research estimates.
Exhibit 59: EMC P/E chart
Source: Company data, Morgan Stanley Research.
M
Elite Material (EMC) Financials
Exhibit 60: EMC: Quarterly earnings estimates
| 1Q26 | 2Q26 | 3Q26E | 4Q26E | 1Q27E | 2Q27E | 3Q27E | 4Q27E | 2025 | 2026E | 2027E | 2028E | |
|---|---|---|---|---|---|---|---|---|---|---|---|---|
| Net sales | 33,067 | 47,275 | 55,662 | 63,945 | 70,361 | 78,182 | 94,738 | 114,024 | 94,261 | 199,950 | 357,306 | 513,466 |
| COGS | (23,338) | (31,272) | (35,636) | (40,144) | (43,577) | (47,737) | (57,308) | (68,316) | (66,141) | (130,390) | (216,938) | (300,708) |
| Gross profit | 9,729 | 16,003 | 20,026 | 23,801 | 26,784 | 30,446 | 37,431 | 45,708 | 28,120 | 69,559 | 140,369 | 212,758 |
| Operating expenses | (2,601) | (3,269) | (3,509) | (3,744) | (3,829) | (3,998) | (4,310) | (4,649) | (9,012) | (13,123) | (16,786) | (18,981) |
| SG&A | (1,836) | (2,363) | (2,566) | (2,763) | (2,858) | (2,989) | (3,260) | (3,578) | (6,870) | (9,528) | (12,685) | (14,549) |
| R&D | (764) | (907) | (943) | (981) | (971) | (1,010) | (1,050) | (1,071) | (2,142) | (3,595) | (4,102) | (4,432) |
| Operating income | 7,128 | 12,734 | 16,516 | 20,058 | 22,955 | 26,447 | 33,121 | 41,060 | 19,108 | 56,436 | 123,583 | 193,777 |
| Non-operating income | 66 | 52 | 11 | 11 | 11 | 11 | 11 | 11 | (232) | 140 | 45 | 45 |
| Interest income | (65) | (89) | (89) | (89) | (89) | (89) | (89) | (89) | (216) | (332) | (355) | (355) |
| Investment income | 0 | 0 | 0 | 0 | 0 | 0 | 0 | 0 | 0 | 0 | 0 | 0 |
| Disposal of investment | 0 | 0 | 0 | 0 | 0 | 0 | 0 | 0 | 0 | 0 | 0 | 0 |
| Exchange gain | (3) | 72 | 0 | 0 | 0 | 0 | 0 | 0 | (108) | 69 | 0 | 0 |
| Other | 134 | 68 | 100 | 100 | 100 | 100 | 100 | 100 | 92 | 402 | 400 | 400 |
| Pre-tax income | 7,194 | 12,785 | 16,528 | 20,069 | 22,966 | 26,459 | 33,132 | 41,071 | 18,876 | 56,576 | 123,627 | 193,821 |
| Income tax | (1,855) | (2,914) | (3,719) | (4,315) | (5,856) | (6,085) | (7,455) | (8,830) | (4,231) | (12,802) | (28,227) | (44,674) |
| Minority interest | (1) | (2) | 0 | 0 | 0 | 0 | 0 | 0 | (4) | (3) | 0 | 0 |
| Net income | 5,340 | 9,873 | 12,809 | 15,754 | 17,109 | 20,373 | 25,677 | 32,241 | 14,649 | 43,776 | 95,400 | 149,147 |
| Adj.wtd.avg.shrs (mn) | 358 | 358 | 358 | 358 | 358 | 358 | 358 | 358 | 352 | 358 | 358 | 358 |
| EPS | 14.90 | 27.55 | 35.75 | 43.97 | 47.75 | 56.86 | 71.66 | 89.98 | 41.67 | 122.17 | 266.24 | 416.24 |
| Fully Diluted shares (mn) | 358 | 358 | 358 | 358 | 358 | 358 | 358 | 358 | 352 | 358 | 358 | 358 |
| Diluted EPS (NT$) | 14.90 | 27.55 | 35.75 | 43.97 | 47.75 | 56.86 | 71.66 | 89.98 | 41.67 | 122.17 | 266.24 | 416.24 |
| Margins (%) | ||||||||||||
| Gross Margin | 29.4 | 33.9 | 36.0 | 37.2 | 38.1 | 38.9 | 39.5 | 40.1 | 29.8 | 34.8 | 39.3 | 41.4 |
| Operating Margin | 21.6 | 26.9 | 29.7 | 31.4 | 32.6 | 33.8 | 35.0 | 36.0 | 20.3 | 28.2 | 34.6 | 37.7 |
| Pretax Margin | 21.8 | 27.0 | 29.7 | 31.4 | 32.6 | 33.8 | 35.0 | 36.0 | 20.0 | 28.3 | 34.6 | 37.7 |
| Net Margin | 16.1 | 20.9 | 23.0 | 24.6 | 24.3 | 26.1 | 27.1 | 28.3 | 15.5 | 21.9 | 26.7 | 29.0 |
| QoQ Growth (%) | ||||||||||||
| Sales | 33 | 43 | 18 | 15 | 10 | 11 | 21 | 20 | ||||
| Gross Profit | 37 | 64 | 25 | 19 | 13 | 14 | 23 | 22 | ||||
| Operating Profit | 44 | 79 | 30 | 21 | 14 | 15 | 25 | 24 | ||||
| Pretax Profit | 56 | 78 | 29 | 21 | 14 | 15 | 25 | 24 | ||||
| Net Profit | 43 | 85 | 30 | 23 | 9 | 19 | 26 | 26 | ||||
| YoY Growth (%) | ||||||||||||
| Sales | 53 | 110 | 121 | 157 | 113 | 65 | 70 | 78 | 46 | 112 | 79 | 44 |
| Gross Profit | 48 | 134 | 164 | 234 | 175 | 90 | 87 | 92 | 56 | 147 | 102 | 52 |
| Operating Profit | 57 | 174 | 231 | 306 | 222 | 108 | 101 | 105 | 57 | 195 | 119 | 57 |
| Pretax Profit | 54 | 186 | 223 | 334 | 219 | 107 | 100 | 105 | 56 | 200 | 119 | 57 |
| Net Profit | 54 | 184 | 223 | 322 | 220 | 106 | 100 | 105 | 53 | 199 | 118 | 56 |
Source: Company data, Morgan Stanley Research estimates.
M
Exhibit 61: EMC: Consolidated financial summary
| Consolidated Income Statement | Consolidated Income Statement | Consolidated Income Statement | Consolidated Income Statement | Consolidated Income Statement | Consolidated Cash Flow Statement | Consolidated Cash Flow Statement | Consolidated Cash Flow Statement | Consolidated Cash Flow Statement | Consolidated Cash Flow Statement |
|---|---|---|---|---|---|---|---|---|---|
| NT$mn (Year End Dec 31) | 2025 | 2026E | 2027E | 2028E | NT$mn (Year End Dec 31) | 2025 | 2026E | 2027E | 2028E |
| Net sales | 94,261 | 199,950 | 357,306 | 513,466 | Operating Cashflow | 11,968 | 21,652 | 60,608 | 115,476 |
| COGS | (66,141) | (130,390) | (216,938) | (300,708) | Net Profits | 14,649 | 43,776 | 95,400 | 149,147 |
| Gross profit | 28,120 | 69,559 | 140,369 | 212,758 | Depreciation & Amort. | 1,849 | 1,914 | 3,507 | 4,920 |
| Operating expenses | (9,012) | (13,123) | (16,786) | (18,981) | Investment losses/(income) | 0 | 0 | 0 | 0 |
| Operating income | 19,108 | 56,436 | 123,583 | 193,777 | Working capital change | 51,298 | (22,798) | (36,453) | (36,759) |
| Non-operating income | (232) | 140 | 45 | 45 | Other adjustments | (55,798) | (1,240) | (1,846) | (1,832) |
| Interest income | (216) | (332) | (355) | (355) | Investing Cashflow | (9,888) | (24,996) | (22,994) | (19,991) |
| Investment income | - | - | - | - | Capex | (9,490) | (25,000) | (23,000) | (20,000) |
| Disposal of investment | - | - | - | - | Change of L/T investment | 0 | 0 | 0 | 0 |
| Exchange gain | (108) | 69 | - | - | Change of S/T investment | 0 | 0 | 0 | 0 |
| Other | 92 | 402 | 400 | 400 | Other adjustments | (400) | 0 | 0 | 0 |
| Pre-tax income | 18,876 | 56,576 | 123,627 | 193,821 | Financing Cashflow | 2,776 | (3,631) | (19,122) | (50,028) |
| Income tax | (4,231) | (12,802) | (28,227) | (44,674) | Increase in L/T debt | 5,543 | 2,000 | 2,000 | 2,000 |
| Minority interests | (4) | (3) | - | - | Increase in S/T debt | 3,175 | 0 | 0 | 0 |
| Net income | 14,649 | 43,776 | 95,400 | 149,147 | Issuance of stock | 0 | (68) | 0 | 0 |
| Adj. wtd. Avg. shrs (m) | 352 | 358 | 358 | 358 | Cash dividends | (5,894) | (8,958) | (26,175) | (57,043) |
| Reported EPS (NT$) | 41.67 | 122.17 | 266.24 | 416.24 | Other adjustments | (48) | 3,394 | 5,054 | 5,015 |
| Diluted shrs (m) | 352 | 358 | 358 | 358 | FX adjustment | 163 | (69) | 0 | 0 |
| Diluted EPS (NT$) | 41.67 | 122.17 | 266.24 | 416.24 | Net change in cash | 5,020 | (7,046) | 18,493 | 45,457 |
| Consolidated Balance Sheet | Consolidated Balance Sheet | Consolidated Balance Sheet | Consolidated Balance Sheet | Consolidated Balance Sheet | Consolidated Financial Ratios | Consolidated Financial Ratios | Consolidated Financial Ratios | Consolidated Financial Ratios | Consolidated Financial Ratios |
| NT$mn (Year End Dec 31) | 2025 | 2026E | 2027E | 2028E | 2025 | 2026E | 2027E | 2028E | |
| Cash | 20,008 | 12,962 | 31,455 | 76,911 | Margins (%) | ||||
| Mkt securities | - | - | - | - | Gross margin | 29.8 | 34.8 | 39.3 | 41.4 |
| AR/NR | 36,115 | 76,608 | 136,897 | 196,727 | Operating margin | 20.3 | 28.2 | 34.6 | 37.7 |
| Inventory | 16,752 | 33,024 | 54,944 | 76,161 | Pretax margin | 20.0 | 28.3 | 34.6 | 37.7 |
| Others | 1,106 | 2,345 | 4,191 | 6,023 | Net margin | 15.5 | 21.9 | 26.7 | 29.0 |
| Current Assets | 73,980 | 124,940 | 227,487 | 355,823 | YoY growth (%) | ||||
| Long-term investments | - | - | - | - | Sales | 46.4 | 112.1 | 78.7 | 43.7 |
| Fixed assets | 30,864 | 53,947 | 73,434 | 88,505 | Operating profits | 57.2 | 195.3 | 119.0 | 56.8 |
| Other assets | 3,069 | 3,069 | 3,069 | 3,069 | Pretax profits | 55.6 | 199.7 | 118.5 | 56.8 |
| Total Assets | 107,913 | 181,955 | 303,990 | 447,396 | Net profits | 52.9 | 198.8 | 117.9 | 56.3 |
| S/T borrowings | 11,264 | 11,264 | 11,264 | 11,264 | Others | ||||
| AP/NP | 24,518 | 48,334 | 80,416 | 111,469 | Cash dividend payout (%) | 60% | 60% | 60% | 60% |
| Other ST liabilities | 10,450 | 20,601 | 34,274 | 47,510 | Cash div (NT$) | 25.00 | 73.05 | 159.20 | 248.88 |
| Total Current Liabilities | 46,231 | 80,198 | 125,954 | 170,242 | Yield (%) | 0% | 1% | 3% | 5% |
| L/T debt | 8,219 | 10,219 | 12,219 | 14,219 | Net Debt/Equity (%) | -1% | 10% | -5% | -21% |
| Other LT libilities | 3,027 | 6,422 | 11,475 | 16,490 | Liabilities/Equity (%) | 114% | 114% | 97% | 82% |
| Total Liabilities | 57,477 | 96,839 | 149,649 | 200,952 | Liabilities/Assets (%) | 53% | 53% | 49% | 45% |
| Common shares | 3,583 | 3,516 | 3,516 | 3,516 | ROAE (%) | 34% | 65% | 80% | 74% |
| Retained Earnings | 30,364 | 65,112 | 134,337 | 226,441 | ROAA (%) | 16% | 30% | 39% | 40% |
| Other SH' Equity | 16,488 | 16,488 | 16,488 | 16,488 | AR/NR Turnover (days) | 120 | 103 | 109 | 119 |
| Total Shareholders' Equity | 50,435 | 85,116 | 154,341 | 246,445 | Inventory Turnover (days) | 72 | 70 | 74 | 80 |
| Total Liab./SH's Equity | AP/NP Turnover (days) | 112 | 102 | 108 | 116 | ||||
| 107,913 | 181,955 | 303,990 | 447,396 | 82 | |||||
| Cash conversion cycle 81 71 75 | Cash conversion cycle 81 71 75 | Cash conversion cycle 81 71 75 | Cash conversion cycle 81 71 75 | Cash conversion cycle 81 71 75 |
Source: Company data, Morgan Stanley Research estimates.
M
Risk Reward - Elite Material Co. (2383.TW) Risk Reward - Elite Material Co. (2383.TW)
Best-in-class CCL supplier; AI driving revenue and margin expansion
NT$8,400.00 PRICE TARGET
Base case, derived from a residual income (RI) model. Key assumptions include a cost of equity of 9.3% (beta of 1.0, equity premium of 8.7% and risk-free rate of 1%), medium-term growth rate of 12%, and terminal growth rate of 3%.
NT$7,173.21
NT$10,200.00
MS PT
Mean
Morgan Stanley Estimates
OVERWEIGHT THESIS
- EMC is the CCL leader globally, enabling AI systems by providing advanced highspeed, low-loss CCLs.
▪ Continued demand growth from AI and
EMC's own capacity expansion will support material growth in the coming years.
▪ Risk-reward is attractive with the stock trading at 13x CY28 P/E vs 3Y historical range of 8-32x.
New Data Era: Pricing Power:
Positive Positive
NT$4,000.00
10x 2028 P/E
BEAR CASE
CPO adoption happens faster than expected, while AI demand weakens and Chinese CCL makers are able to expand more capacity and take share on advanced CCLs.
Consensus Price Target Distribution
Source: Refinitiv, Morgan Stanley Research
RISK REWARD CHART
Key:
Historical Stock Performance
Current Stock Price
Source: Refinitiv, Morgan Stanley Research
BULL CASE
NT$13,000.00
31x 2028e P/E
We assume EMC takes share and sees faster material upgrades across all AI platforms.
Price Target
BASE CASE
20x 2028e P/E
EMC continues to grow materially driven by AI server demand growth and material grade upgrades.
NT$2,400.00
NT$8,400.00
M
Risk Reward - Elite Material Co. (2383.TW)
KEY EARNINGS INPUTS
| Drivers | 2025 | 2026e | 2027e | 2028e |
|---|---|---|---|---|
| Server/Switch/LEO Satellite Revenue Contribution (%) | 67.8 | 78.6 | 85.6 | 89.2 |
INVESTMENT DRIVERS
- Monthly revenue
- Suppler share allocation
- CCL content per rack
GLOBAL REVENUE EXPOSURE
Source: Morgan Stanley Research Estimate View explanation of regional hierarchies here
MS ALPHA MODELS
3/5 MOST
3 Month
Horizon
Source: Refinitiv, FactSet, Morgan Stanley Research; 1 is the highest favored Quintile and 5 is the least favored Quintile
RISKS TO PT/RATING
RISKS TO UPSIDE
- Stronger AI demand
- Share gains
- Faster-than-expected material upgrades
- Slower-than-expected CPO adoption
RISKS TO DOWNSIDE
- Weaker AI demand
- Share loss
- Slower-than-expected material upgrades
- Faster-than-expected CPO adoption
MS ESTIMATES VS. CONSENSUS
M
Taiwan Union Corporation (TUC): Initiate at Overweight, Price Target of NT$2,700
Company overview
Taiwan Union Technology Corporation (TUC) was established in 1974 under its former name, Taiwan Union Glass Industrial Co., Ltd., initially specializing in the production of optical glass. In 1997, the company transitioned its business focus to the manufacturing of copper-clad laminates (CCL) and prepregs. In 2001, TUC further expanded its capabilities by introducing mass lamination services for customers. In December 2003, TUC was officially listed on the Taiwan OTC market.
To better serve growing customer demand in Greater China, TUC established its Changshu plant in Jiangsu, China, in 2004. Today, TUC has one production site (also R&D Center) in Taiwan, one in Thailand (Chonburi) and two in China (Changshu and Zhongshan); it also operates a global service network covering Taiwan, China, Japan, South Korea, the United States, and Germany. Its total production capacity exceeds 2.3M sheets of laminates per month.
TUC's product portfolio offers a broad range of advanced features, including high-speed and low-loss performance, environmentally friendly solutions, lead-free compatibility, halogen-free materials, low coefficient of thermal expansion (CTE), superior chemical and thermal resistance, and solutions for rigid-flex applications.
Key products
As a CCL manufacturer, TUC is specialized in the R&D, manufacturing and sales of CCLs and prepregs . CCL forms the cured core layers of a multilayer PCB, while prepreg is a semi-cured, resin-impregnated glass cloth used to bond those layers together. TUC also offers lamination service to its customers, though its contribution is negligible at only 3% in 2025.
Product mix by grade: In 2025, M7 and above contributed 36% of TUC's total sales, M4M6 32%, HDI and M4 below 23% and others 9%. We expect TUC's M7 and above mix to increase to 40%/42%/46% in 2026/2027/2028, primarily driven by AI servers and highend networking switches that require increasingly advanced CCLs and prepregs (M7 at least). On our estimates, this healthy shift toward more high-end applications, along with its pricing adjustments, should support TUC's gross margin expansion from 22.7% in 2025 to 30.7%/35.0%/36.0% in 2026/2027/2028.
Capacity expansion plans: In 2018-2024, TUC's CCL capacity remained stable at 2M sheets per month. In 3Q25, TUC added 0.3M sheets per month of capacity at its newly opened Thailand plant (Thailand 1-1), which brought its total monthly capacity to 2.3M sheets. TUC is currently ramping up its Thailand 1-2 facility, which will bring total monthly capacity to 2.6M by the end of 2026. Total capacity is expected to increase from 2.6M at year-end of 2026, to 3.8M/5.3M by the end of 2027/2028 (+46%/+39% y/y).
M
Exhibit 62: TUC revenue mix by speed
Source: Company data, Morgan Stanley Research estimates.
Exhibit 63: TUC CCL capacity
Source: Company data, Morgan Stanley Research estimates.
Key competitors
The competitive landscape varies by product grade. In commodity FR-4, the largest volume suppliers include China's Kingboard Laminates and Shengyi Technology, as well as Nan Ya Plastics, with the top five producers accounting for more than 60% of the global CCL market. However, this is not TUC's primary market either.
TUC is primarily involved in the high-speed and low-loss materials space, and it has a particularly strong presence in the high-end networking switch CCL market (400G, 800G and above); in this market, its closest competitors are EMC, Doosan Electro-Materials, and Shengyi Technology. TUC was also a qualified supplier to AWS for the CCLs used in Trainium servers. It was qualified in 1H25 and started supplying to the AWS supply Chain from Trainium2 onwards. In the ASIC server market, TUC primarily competes with EMC and potentially Panasonic as well.
It's also worth noting that TUC is the primary, if not sole, supplier of thick copper CCLs used in power supply applications to a dominant data center power supplier solution provider; this niche product falls in the 'Others' category, with 'Others' revenue mix rising sharply from 8% in 2Q25 to 14% in 2Q26.
Key customers
TUC also sells directly to PCB fabricators. With high-end switches and servers being an crucial part of its high-speed CCL business, TUC's customer base includes many of the world's leading server/switch PCB manufacturers, including Gold Circuit Electronics, ISU Petasys (007660.KS, covered by Ryan Kim), Wus Printed Circuit (002463.SZ, not covered), Shennan Circuits, TTM Technologies (TTMI.O, not covered), Tripod Technology (3044.TW, not covered), First High Tech (5439.TWO, not covered), Shengyi Electronics (688183.SS, not covered) etc.
What are the key risks?
- AI demand is structural but volatile: Hardware/CCL orders can swing with delays, bottlenecks and inventory digestion.
- Qualification creates an edge, not permanence: Incumbents benefit, but each
M
platform transition can reopen competition.
- Competition is rising: Shengyi/Nan Ya/Kingboard could pressure share, pricing and margins, even initially via second-source positions.
- Upstream materials are constrained: Advanced glass cloth and HVLP copper foil shortages support pricing but can cap shipments.
- CPO is a longer-term risk: It could reduce demand for premium CCL grades, but is unlikely to materially affect 2026 tightness.
Price target and valuation methodology
Our price target for TUC is NT$2,700: This implies 29x CY27 or 17x CY28 P/E. Our price target is also our base case scenario value. It is derived from our residual income (RI) model (similar to the rest of our tech hardware universe).
To calculate the fair value of the stock, we use the company's beginning equity plus the present value of all expected residual income of earnings in excess of cost of capital. The RI is positive when ROAE is above the cost of capital and negative when it is below the cost of capital. Our key assumptions include a cost of equity of 9.3% (beta of 1.0, equity risk premium of 8.7%, and risk-free rate of 1.0%), a medium-term growth rate of 11% and a terminal growth rate of 3%.
The 17x CY28 P/E implied by our price target is in line with the past 3Y average +1SD of 17x. We deem this valuation as fair, because TUC is benefitting from an earnings growth cycle fueled by stronger AI server/networking CCL demand, TUC's own mix improvement and continued pricing adjustments, which supports margin expansion from 22.7% in 2025 to 36.0% by 2028 and a EPS CAGR of 138% over 2025-2028, on our estimates. The stock is trading at just 8.6x CY28 P/E, below TUC's past 3Y average -1SD of 9.5x. Thus, we view the risk reward as attractive.
Bull case value NT$4,050: In this scenario, we assume high-end servers and switches see significantly stronger growth in 2027-28, driven by faster-than-expected new data center build-outs and a smooth ramp of new generations of AI/networking chips; we also assume CCL demand from key satellite customer and power supply customer will be stronger than expected. In addition, we also assume a new CSP ASIC customer win for TUC, which will start contributing to sales from 2027 onwards. Under this scenario, our bull case value implies 26x 2028e EPS.
Bear case value NT$675: In this scenario, we assume high-end server and switch sees sluggish demand in 2027-28, because of slower-than-expected new data center build-outs and significant delay in new generations of AI/networking chips; we also assume CCL demand from key satellite customer and power supply customer will become stagnant in the near to medium term. In addition, we also assume no new CSP customer win and share loss in AWS Trainium project for TUC. Under this scenario, our bear case value implies 4.3x 2028e EPS.
M
Exhibit 64: Residual income (RI) model
| 2027E | 2028E | 2029E | 2030E | 2031E | 2032E | 2033E | 2034E | 2035E | 2036E | 2037E | ||
|---|---|---|---|---|---|---|---|---|---|---|---|---|
| Total Equity | 48,267 | 76,936 | 102,926 | 131,776 | 163,799 | 199,344 | 238,800 | 282,595 | 331,208 | 385,169 | 436,629 | |
| Net Profit | 27,579 | 45,758 | 50,791 | 56,378 | 62,580 | 69,464 | 77,105 | 85,586 | 95,001 | 105,451 | 108,615 | |
| Return on Equity | 72.4% | 73.1% | 56.5% | 48.0% | 42.3% | 38.3% | 35.2% | 32.8% | 31.0% | 29.4% | 26.4% | |
| Beta | 1.0 | 1.0 | 1.0 | 1.0 | 1.0 | 1.0 | 1.0 | 1.0 | 1.0 | 1.0 | 1.0 | 1.0 |
| Equity Risk Premium (Rm-Rf) | 8.7% | 8.7% | 8.7% | 8.7% | 8.7% | 8.7% | 8.7% | 8.7% | 8.7% | 8.7% | 8.7% | 8.7% |
| Risk Free Rate (Rf) | 1.0% | 1.0% | 1.0% | 1.0% | 1.0% | 1.0% | 1.0% | 1.0% | 1.0% | 1.0% | 1.0% | 1.0% |
| Cost of Equity | 9.3% | 9.3% | 9.3% | 9.3% | 9.3% | 9.3% | 9.3% | 9.3% | 9.3% | 9.3% | 9.3% | 9.3% |
| Residual Income | 17,629 | 30,790 | 36,294 | 39,872 | 43,540 | 47,425 | 51,614 | 56,179 | 61,184 | 66,692 | 65,977 | |
| Spread | 63.1% | 63.8% | 47.2% | 38.7% | 33.0% | 29.0% | 25.9% | 23.5% | 21.7% | 20.1% | 17.1% | |
| Beginning Equity Capital | 48,267 | |||||||||||
| PV of Forecast Period | 297,464 | |||||||||||
| PV of Continuing Value | 442,847 | |||||||||||
| Equity Value | 788,578 | |||||||||||
| No. of Shares | 292 | |||||||||||
| Projected Price | 2,700 | |||||||||||
| Implied CY27 PE | 29x | |||||||||||
| Implied CY28 PE | 17x |
Source: Morgan Stanley Research estimates.
Exhibit 65: TUC P/E chart
Source: Company data, Morgan Stanley Research.
M
TUC Financials
Exhibit 66: TUC: Quarterly Earnings Estimates
| 1Q25 | 2Q25 | 3Q25 | 4Q25 | 1Q26 | 2Q26 | 3Q26E | 4Q26E | 2025 | 2026E | 2027E | 2028E | |
|---|---|---|---|---|---|---|---|---|---|---|---|---|
| Net sales | 6,372 | 6,780 | 8,063 | 9,125 | 10,054 | 14,301 | 18,706 | 21,366 | 30,340 | 64,427 | 120,406 | 189,373 |
| COGS | (4,839) | (5,345) | (6,148) | (7,110) | (7,525) | (10,051) | (12,771) | (14,310) | (23,442) | (44,658) | (78,252) | (121,221) |
| Gross profit | 1,533 | 1,435 | 1,915 | 2,015 | 2,529 | 4,250 | 5,935 | 7,056 | 6,898 | 19,769 | 42,154 | 68,152 |
| Operating expenses | (598) | (583) | (649) | (725) | (701) | (892) | (1,028) | (1,104) | (2,554) | (3,724) | (5,343) | (7,102) |
| SG&A | (469) | (457) | (513) | (601) | (606) | (773) | (904) | (977) | (2,040) | (3,260) | (4,806) | (6,505) |
| R&D | (128) | (126) | (136) | (124) | (95) | (118) | (124) | (127) | (514) | (464) | (537) | (597) |
| Operating income | 935 | 853 | 1,266 | 1,290 | 1,828 | 3,358 | 4,907 | 5,952 | 4,344 | 16,045 | 36,811 | 61,050 |
| Non-operating income | (1) | (13) | 52 | 136 | 46 | 69 | (10) | (10) | 175 | 96 | (39) | (39) |
| Interest income | 17 | 16 | 3 | 5 | (7) | (10) | (10) | (10) | 42 | (36) | (39) | (39) |
| Investment income | 0 | 0 | 0 | 0 | 0 | 0 | 0 | 0 | 0 | 0 | 0 | 0 |
| Disposal of investment | 0 | 0 | 0 | 0 | 0 | 0 | 0 | 0 | 0 | 0 | 0 | 0 |
| Exchange gain | 27 | (169) | 110 | 127 | 46 | 75 | 0 | 0 | 95 | 120 | 0 | 0 |
| Other | (45) | 140 | (61) | 5 | 7 | 4 | 0 | 0 | 38 | 11 | 0 | 0 |
| Pre-tax income | 935 | 840 | 1,318 | 1,427 | 1,874 | 3,427 | 4,897 | 5,942 | 4,519 | 16,141 | 36,771 | 61,011 |
| Income tax | (263) | (188) | (315) | (344) | (614) | (1,085) | (1,224) | (1,486) | (1,109) | (4,409) | (9,193) | (15,253) |
| Minority interest | 0 | 0 | 0 | 0 | 0 | 0 | 0 | 0 | 0 | 0 | 0 | 0 |
| Net income | 672 | 652 | 1,003 | 1,083 | 1,260 | 2,342 | 3,673 | 4,457 | 3,409 | 11,732 | 27,579 | 45,758 |
| Adj.wtd.avg.shrs (mn) | 276 | 276 | 280 | 281 | 289 | 292 | 292 | 292 | 281 | 292 | 292 | 292 |
| EPS | 2.43 | 2.36 | 3.58 | 3.85 | 4.36 | 8.02 | 12.58 | 15.26 | 12.12 | 40.17 | 94.43 | 156.68 |
| Fully Diluted shares (mn) | 276 | 276 | 280 | 281 | 289 | 292 | 292 | 292 | 281 | 292 | 292 | 292 |
| Diluted EPS (NT$) | 2.43 | 2.36 | 3.58 | 3.85 | 4.36 | 8.02 | 12.58 | 15.26 | 12.12 | 40.17 | 94.43 | 156.68 |
| Margins (%) | ||||||||||||
| Gross Margin | 24.1 | 21.2 | 23.7 | 22.1 | 25.1 | 29.7 | 31.7 | 33.0 | 22.7 | 30.7 | 35.0 | 36.0 |
| Operating Margin | 14.7 | 12.6 | 15.7 | 14.1 | 18.2 | 23.5 | 26.2 | 27.9 | 14.3 | 24.9 | 30.6 | 32.2 |
| Pretax Margin | 14.7 | 12.4 | 16.3 | 15.6 | 18.6 | 24.0 | 26.2 | 27.8 | 14.9 | 25.1 | 30.5 | 32.2 |
| Net Margin | 10.5 | 9.6 | 12.4 | 11.9 | 12.5 | 16.4 | 19.6 | 20.9 | 11.2 | 18.2 | 22.9 | 24.2 |
| QoQ Growth (%) | ||||||||||||
| Sales | 1 | 6 | 19 | 13 | 10 | 42 | 31 | 14 | ||||
| Gross Profit | 5 | -6 | 33 | 5 | 26 | 68 | 40 | 19 | ||||
| Operating Profit | 0 | -9 | 48 | 2 | 42 | 84 | 46 | 21 | ||||
| Pretax Profit | -1 | -10 | 57 | 8 | 31 | 83 | 43 | 21 | ||||
| Net Profit | -5 | -3 | 54 | 8 | 16 | 86 | 57 | 21 | ||||
| YoY Growth (%) | ||||||||||||
| Sales | 44 | 19 | 22 | 45 | 58 | 111 | 132 | 134 | 32 | 112 | 87 | 57 |
| Gross Profit | 51 | 5 | 27 | 38 | 65 | 196 | 210 | 250 | 29 | 187 | 113 | 62 |
| Operating Profit | 66 | -2 | 31 | 38 | 95 | 294 | 288 | 361 | 30 | 269 | 129 | 66 |
| Pretax Profit | 56 | -4 | 37 | 52 | 100 | 308 | 272 | 317 | 34 | 257 | 128 | 66 |
| Net Profit | 49 | -6 | 33 | 54 | 88 | 259 | 266 | 312 | 31 | 244 | 135 | 66 |
Source: Company Data, Morgan Stanley Research estimates.
M
Exhibit 67: TUC: Consolidated Financial Summary
| Consolidated Income Statement | Consolidated Income Statement | Consolidated Income Statement | Consolidated Income Statement | Consolidated Income Statement | Consolidated Cash Flow Statement | Consolidated Cash Flow Statement | Consolidated Cash Flow Statement | Consolidated Cash Flow Statement | Consolidated Cash Flow Statement | Consolidated Cash Flow Statement | Consolidated Cash Flow Statement | Consolidated Cash Flow Statement | Consolidated Cash Flow Statement | Consolidated Cash Flow Statement | Consolidated Cash Flow Statement | Consolidated Cash Flow Statement | Consolidated Cash Flow Statement | Consolidated Cash Flow Statement | Consolidated Cash Flow Statement |
|---|---|---|---|---|---|---|---|---|---|---|---|---|---|---|---|---|---|---|---|
| NT$mn (Year End Dec 31) | 2025 | 2026E | 2027E | 2028E | NT$mn (Year End Dec 31) | 2025 | 2026E | 2027E | 2028E | 2028E | 2028E | 2028E | 2028E | 2028E | 2028E | 2028E | 2028E | 2028E | 2028E |
| Net sales | 30,340 | 64,427 | 120,406 | 189,373 | Operating Cashflow | 596 | 668 | 8,972 | 23,157 | 23,157 | 23,157 | 23,157 | 23,157 | 23,157 | 23,157 | 23,157 | 23,157 | 23,157 | 23,157 |
| COGS | (23,442) | (44,658) | (78,252) | (121,221) | Net Profits | 3,409 | 11,732 | 27,579 | 45,758 | 45,758 | 45,758 | 45,758 | 45,758 | 45,758 | 45,758 | 45,758 | 45,758 | 45,758 | 45,758 |
| Gross profit | 6,898 | 19,769 | 42,154 | 68,152 | Depreciation & Amort. | 459 | 459 | 586 | 702 | 702 | 702 | 702 | 702 | 702 | 702 | 702 | 702 | 702 | 702 |
| Operating expenses | (2,554) | (3,724) | (5,343) | (7,102) | Investment losses/(income) | 0 | 0 | 0 | 0 | 0 | 0 | 0 | 0 | 0 | 0 | 0 | 0 | 0 | 0 |
| Operating income | 4,344 | 16,045 | 36,811 | 61,050 | Working capital change | 18,399 | (10,937) | (18,231) | (22,119) | (22,119) | (22,119) | (22,119) | (22,119) | (22,119) | (22,119) | (22,119) | (22,119) | (22,119) | (22,119) |
| Non-operating income | 175 | 96 | (39) | (39) | Other adjustments | (21,634) | (585) | (961) | (1,185) | (1,185) | (1,185) | (1,185) | (1,185) | (1,185) | (1,185) | (1,185) | (1,185) | (1,185) | (1,185) |
| Interest income | 42 | (36) | (39) | (39) | Investing Cashflow | (6,502) | (1,999) | (1,998) | (1,996) | (1,996) | (1,996) | (1,996) | (1,996) | (1,996) | (1,996) | (1,996) | (1,996) | (1,996) | (1,996) |
| Investment income | - | - | - | - | Capex | (1,949) | (2,000) | (2,000) | (2,000) | (2,000) | (2,000) | (2,000) | (2,000) | (2,000) | (2,000) | (2,000) | (2,000) | (2,000) | (2,000) |
| Disposal of investment | - | - | - | - | Change of L/T investment | 0 | 0 | 0 | 0 | 0 | 0 | 0 | 0 | 0 | 0 | 0 | 0 | 0 | 0 |
| Exchange gain | 95 | 120 | - | - | Change of S/T investment | (26) | 0 | 0 | 0 | 0 | 0 | 0 | 0 | 0 | 0 | 0 | 0 | 0 | 0 |
| Other | 38 | 11 | - | - | Other adjustments | (4,528) | 0 | 0 | 0 | 0 | 0 | 0 | 0 | 0 | 0 | 0 | 0 | 0 | 0 |
| Pre-tax income | 4,519 | 16,141 | 36,771 | 61,011 | Financing Cashflow | 4,888 | 2,125 | (120) | (8,304) | (8,304) | (8,304) | (8,304) | (8,304) | (8,304) | (8,304) | (8,304) | (8,304) | (8,304) | (8,304) |
| Income tax | (1,109) | (4,409) | (9,193) | (15,253) | Increase in L/T debt | 5,381 | 100 | 100 | 100 | 100 | 100 | 100 | 100 | 100 | 100 | 100 | 100 | 100 | 100 |
| Minority interests | - | - | - | - | Increase in S/T debt | 1,275 | 0 | 0 | 0 | 0 | 0 | 0 | 0 | 0 | 0 | 0 | 0 | 0 | 0 |
| Net income | 3,409 | 11,732 | 27,579 | 45,758 | Issuance of stock | 0 | (74) | 0 | 0 | 0 | 0 | 0 | 0 | 0 | 0 | 0 | 0 | 0 | 0 |
| Adj. wtd. Avg. shrs (m) | 281 | 292 | 292 | 292 | Cash dividends | (1,797) | (2,193) | (7,269) | (17,089) | (17,089) | (17,089) | (17,089) | (17,089) | (17,089) | (17,089) | (17,089) | (17,089) | (17,089) | (17,089) |
| Reported EPS (NT$) | 12.12 | 40.17 | 94.43 | 156.68 | Other adjustments | 30 | 4,293 | 7,050 | 8,685 | 8,685 | 8,685 | 8,685 | 8,685 | 8,685 | 8,685 | 8,685 | 8,685 | 8,685 | 8,685 |
| Diluted shrs (m) | 281 | 292 | 292 | 292 | FX adjustment | (97) | (120) | 0 | 0 | 0 | 0 | 0 | 0 | 0 | 0 | 0 | 0 | 0 | 0 |
| Diluted EPS (NT$) | 12.12 | 40.17 | 94.43 | 156.68 | Net change in cash | (1,115) | 674 | 6,855 | 12,857 | 12,857 | 12,857 | 12,857 | 12,857 | 12,857 | 12,857 | 12,857 | 12,857 | 12,857 | 12,857 |
| Consolidated Balance Sheet | Consolidated Financial Ratios | ||||||||||||||||||
| NT$mn (Year End Dec 31) | 2025 | 2026E | 2027E | 2028E | 2025 | 2026E | 2027E | ||||||||||||
| Cash | 5,165 | 5,839 | 12,694 | 25,551 | Margins (%) | ||||||||||||||
| Mkt | 22.7 | 30.7 | 35.0 | 36.0 | 36.0 | 36.0 | 36.0 | 36.0 | 36.0 | 36.0 | 36.0 | 36.0 | 36.0 | 36.0 | |||||
| 13,823 | 29,353 | 86,277 | Operating margin | 14.3 | 24.9 | 30.6 | 32.2 | 32.2 | 32.2 | 32.2 | 32.2 | 32.2 | 32.2 | 32.2 | 32.2 | 32.2 | 32.2 | ||
| Inventory | 7,405 | 14,106 | 24,718 | 38,290 | Pretax margin | 14.9 | 25.1 | 30.5 | 32.2 | 32.2 | 32.2 | 32.2 | 32.2 | 32.2 | 32.2 | 32.2 | 32.2 | 32.2 | 32.2 |
| Others | 521 | 1,107 | 2,068 | 3,253 | Net margin | 11.2 | 18.2 | 22.9 | 24.2 | 24.2 | 24.2 | 24.2 | 24.2 | 24.2 | 24.2 | 24.2 | 24.2 | 24.2 | 24.2 |
| 99,773 | |||||||||||||||||||
| Current Assets | 55,842 | 158,808 | YoY growth (%) | ||||||||||||||||
| Long-term investments | 4 | 4 | 112.3 | 86.9 | |||||||||||||||
| Fixed assets | 5,565 | 7,105 | 8,517 | 9,810 | Operating profits | 30.4 | 269.4 | 129.4 | 65.8 | 65.8 | 65.8 | 65.8 | 65.8 | 65.8 | 65.8 | 65.8 | 65.8 | 65.8 | 65.8 |
| Other assets | 1,820 | 1,820 | 1,820 | 1,820 | Pretax profits | 30.9 | 33.8 257.2 | 65.9 65.9 | 65.9 65.9 | 65.9 65.9 | 65.9 65.9 | 65.9 65.9 | 65.9 65.9 | 65.9 65.9 | 65.9 65.9 | 65.9 65.9 | 65.9 65.9 | 65.9 65.9 | |
| Total Assets | 39,741 | 64,772 | 110,114 | Net profits | 244.1 | ||||||||||||||
| S/T borrowings | 2,141 | 2,141 | 2,141 | 2,141 | Others | ||||||||||||||
| AP/NP | 10,320 | 19,659 | 34,448 | Cash dividend | payout 62% | (%) 62% | 62% | 62% | 62% | 62% | 62% | 62% | 62% | 62% | 62% | 62% | 62% | 62% | |
| Other ST liabilities | 2,160 | 4,115 | 53,363 | 7.51 | |||||||||||||||
| 7,210 | 11,169 | Cash div (NT$) | 58.51 | 97.08 | 97.08 | 97.08 | 97.08 | 97.08 | 97.08 | 97.08 | 97.08 | 97.08 | 97.08 | 97.08 | |||||
| Total Current Liabilities L/T debt | 14,621 2,686 | 2,786 | 43,799 | 66,673 | Yield (%) | -31% | 0% 2% -23% | 4% | |||||||||||
| 2,986 | Net Debt/Equity (%) | -27% | -34% | -34% | -34% | -34% | -34% | -34% | -34% | -34% | -34% | -34% | -34% | ||||||
| Other LT libilities | 3,821 | 8,114 | 15,163 | 23,849 | Liabilities/Equity (%) | 114% | 132% | 128% | 122% | 122% | 122% | 122% | 122% | 122% | 122% | 122% | 122% | 122% | 122% |
| Total Liabilities | 21,127 | 36,814 | 61,847 | 93,507 | Liabilities/Assets | (%) 53% | 57% 50% | 56% 72% | 55% 73% | 55% 73% | 55% 73% | 55% 73% | 55% 73% | 55% 73% | 55% 73% | 55% 73% | 55% 73% | 55% 73% | 55% 73% |
| Common shares | 2,887 | 2,813 | 2,813 | 2,813 | ROAE (%) | 21% | 22% | 32% | 33% | 33% | 33% | 33% | 33% | 33% | 33% | 33% | 33% | 33% | 33% |
| Retained Earnings | 8,285 | 66,681 | ROAA (%) | 10% | |||||||||||||||
| Other SH' Equity Total Shareholders' Equity | 7,442 18,614 | 7,442 | 7,442 | 7,442 | (days) | 142 122 | 128 | 136 | 136 | 136 | 136 | 136 | 136 | 136 | 136 | 136 | 136 | 136 | |
| Total Liab./SH's Equity | 39,741 | 48,267 | 76,936 | Inventory Turnover (days) | 82 | 88 | 91 | 95 132 | 95 132 | 95 132 | 95 132 | 95 132 | 95 132 | 95 132 | 95 132 | 95 132 | 95 132 | 95 132 | |
| 64,772 | 110,114 | 170,443 | AP/NP Turnover (days) | 123 | 123 | 126 | |||||||||||||
| 92 | 99 | 99 | 99 | 99 | 99 | 99 | 99 | 99 | 99 | 99 | 99 | ||||||||
| Cash conversion cycle | |||||||||||||||||||
| 101 | 101 | 101 | 101 | 101 | 101 | 101 | 101 | 101 | 101 | 101 | 101 | 101 | 101 | ||||||
| 88 | |||||||||||||||||||
| 27,958 | 38,012 | ||||||||||||||||||
| 17,703 | 2,886 | AR/NR Turnover | 24.89 | 127.8 135.1 | |||||||||||||||
| 25,915 | 4 | 170,443 | Sales | ||||||||||||||||
| 32,351 | 31.5 | ||||||||||||||||||
| 4 | Gross | ||||||||||||||||||
| AR/NR | 54,856 | ||||||||||||||||||
| 5,437 | 5,437 | ||||||||||||||||||
| margin | margin | margin | margin | margin | margin | margin | margin | margin | |||||||||||
| securities | |||||||||||||||||||
| 5,437 | 5,437 | 5,437 | 5,437 | 5,437 | 5,437 | 5,437 | 5,437 | 5,437 | 5,437 | 5,437 | 5,437 | 5,437 | 5,437 | 5,437 | 5,437 | 5,437 | 5,437 |
Source: Company Data, Morgan Stanley Research estimates.
M
Risk Reward - Taiwan Union Technology Corporation Risk Reward - Taiwan Union Technology Corporation (6274.TWO)
(6274.TWO) Scarcity Value in High-End CCL
NT$2,700.00 PRICE TARGET
Base case, derived from a residual income (RI) model. Key assumptions include a cost of equity of 9.3% (beta of 1.0, equity premium of 8.7% and risk-free rate of 1%), medium-term growth rate of 11%, and terminal growth rate of 3%.
NT$2,269.55
Source: Refinitiv, Morgan Stanley Research
BULL CASE
26x CY28 P/E
In this scenario, we assume high-end servers and switches see significantly stronger growth in 2027-28, driven by faster-thanexpected new data center build-outs and a smooth ramp of new generations of AI/networking chips; we also assume CCL demand from key satellite and power supply customers will be stronger than expected. In addition, we also assume a new CSP ASIC customer win for TUC, which will start contributing to sales from 2027 onwards.
NT$4,050.00
BASE CASE
17x CY28 P/E
TUC continues to grow materially driven by AI ASIC server, power supply and LEO satellite demand growth and material CCL grade upgrades.
NT$2,700.00
OVERWEIGHT THESIS
- TUC is one of few high-end CCL suppliers whose M7/M8+ CCLs enable AI servers and 800G/1.6T switches.
- Continued demand growth from AI infrastructure build-out and LEO satellites will support continued mix improvement and earnings growth.
- Tight supply-demand conditions in the high-end CCL market further add to TUC's pricing power.
- Risk-reward is attractive with the stock trading at 8.6x CY28 P/E vs a 3Y historical range of 6-27x.
Consensus Rating Distribution
Source: Refinitiv, Morgan Stanley Research
Risk Reward Themes
New Data Era: Pricing Power:
Positive Positive
View descriptions of Risk Rewards Themes here
BEAR CASE
4.3x CY28 P/E
In this scenario, we assume high-end servers and switches see sluggish demand in 202728, because of slower-than-expected new data center build-outs and significant delays in new generations of AI/networking chips; we also assume CCL demand from key satellite customer and power supply customer will become stagnant in the near to medium term. In addition, we also assume no new CSP customer win and share loss in AWS Trainium project for TUC.
NT$675.00
M
Risk Reward - Taiwan Union Technology Corporation (6274.TWO)
KEY EARNINGS INPUTS
| Drivers | 2025 | 2026e | 2027e | 2028e |
|---|---|---|---|---|
| Extreme LL & Super LL Revenue Contribution (%) | 35.9 | 40.3 | 42.2 | 45.6 |
INVESTMENT DRIVERS
- Monthly revenue
- Suppler share allocation
- CCL content per server rack/switch
GLOBAL REVENUE EXPOSURE
Source: Morgan Stanley Research Estimate View explanation of regional hierarchies here
MS ALPHA MODELS
3/5 MOST
3 Month
Horizon
Source: Refinitiv, FactSet, Morgan Stanley Research; 1 is the highest favored Quintile and 5 is the least favored Quintile
RISKS TO PT/RATING
RISKS TO UPSIDE
- Stronger AI demand
- Share gains
- Faster-than-expected material upgrades
- Slower-than-expected CPO adoption
RISKS TO DOWNSIDE
- Weaker AI demand
- Share loss
- Slower-than-expected material upgrades
- Faster-than-expected CPO adoption
MS ESTIMATES VS. CONSENSUS
M
Co-Tech Development: Initiate at Overweight, Price Target of NT$730
Company overview
Co-Tech Development Corporation (Co-Tech) was established in May 1998 to manufacture electrodeposited (ED) copper foil for the copper-clad laminate (CCL) and printed circuit board (PCB) industries. Plant 1 entered mass production in 2000 and Plant 2 followed in 2002,. Co-Tech registered on Taiwan's emerging stock board in 2007 and was formally listed on the Taiwan OTC market in 2010; it changed its name to Co-Tech Development Corporation in 2014.
Headquarters and the R&D centre are in Neihu Technology Park, Taipei, and all manufacturing sits at a single site in Yunlin County, Taiwan, where Plant 1 and Plant 2 operate and Plant 3 is under construction. The current wholly-Taiwan manufacturing footprint is a point of difference versus most peers, which carry China or Southeast Asia capacity; it removes China tariff/localization exposure but concentrates operational risk in one site.
Key products
Copper foil is the conductive layer of a CCL: the laminator bonds foil onto resinimpregnated glass cloth to form the core, so foil surface roughness (Rz) sets the floor on insertion loss at high frequency. Co-Tech's ladder runs from LP310/HG310 (standard to mid-loss, outer layer) through the RT/RG reverse-treated family (RG311 at Rz ≤2.3µm, RG312 at ≤2.1µm, and the more advanced RG313) into the HVLP series (VG410 at ≤1.5µm, VL411 at ≤1.0µm, plus the more advanced PF51N (HVLP4+) and PF511 (HVLP5)).
Product mix by grade: Co-Tech fully stopped supplying conventional HTE and standard RTF in 3Q26, redirecting all capacity to the RG (advanced RTF) and HVLP series. Co-Tech estimates its RG series holds over dominant share of the general server market, while HVLP is more aimed at AI servers and high-end switches. Today, we estimate the RG family remains Co-Tech single largest revenue line at 73%, while HVLP revenue mix is at 14% in 2026. We expect Co-Tech HVLP3+ mix to reach 14%/34%/46% of sales in 2026/2027/2028, primarily driven by AI server boards and 800G/1.6T switches. This mix shift plus processing-fee hikes should lift Co-Tech's gross margin from 22% in 2025 to 30%/40%/47% in 2026/2027/2028, on our estimates.
M
Exhibit 68: We expect Co-Tech's margins to improve on stronger pricing power and continued shift towards the high-end market
Source: Morgan Stanley Research estimates.
Exhibit 70: We estimate Co-Tech's gross margins to expand on increasing processing fees
Source: Morgan Stanley Research estimates.
Exhibit 69: We estimate Co-Tech's processing fees to see continued expansion on stronger pricing power
Source: Morgan Stanley Research estimates.
Profitability for copper foil manufacturers is ultimately set by the processing fee rather than the copper price, since the metal cost is passed through to customers. Copper prices are nonetheless a useful read on demand conditions. As Exhibit 71 shows, periods of strong electronics demand have coincided with firmer processing fees and expanding gross margins at Co-Tech, typically with a one- to two-quarter lag before the benefit reaches the P&L.
M
Exhibit 71: Copper price vs. Co-Tech's gross margins
Source: FactSet, Morgan Stanley Research estimates.
Capacity expansion plans: We estimate Co-Tech's RG capacity to reach 1,000/1,200/1,200 tons per month and its HVLP3+ capacity will reach 340/890/1,150, within which 210/740/1,000 will be HVLP4+ capacity, by the end of 2026/2027/2028. The capacity addition will mainly come from continued upgrades of the existing Plant I and II, and the completion of Plant III in 2027, with potential new capacity coming online beyond 2028, per our checks.
Exhibit 72: Co-Tech monthly capacity
Source: Company data, Morgan Stanley Research estimates.
Key competitors
The competitive set varies by grade. In commodity HTE and standard foil, the volume suppliers are Chinese producers plus Chang Chun (unlisted) and Nan Ya Plastics (1303.TW, not covered). This is no longer Co-Tech's market.
Co-Tech primarily competes in advanced RTF and HVLP3+. Mitsui Kinzoku (5706.T, covered by Yu Shirakawa) is the clear technology and capacity leader in HVLP3+, followed by Furukawa Electric (5801.T, also covered by Yu Shirakawa), Co-Tech, Fukuda (unlisted), Circuit Foil Luxembourg (CFL, unlisted) and Lotte Energy Materials (020150.KS, covered by Ryan Kim). The second tier suppliers are mainly China-based, such as Tongguan Copper Foil (301217.SZ, not covered), Jiujiang Defu Technology (301511.SZ, not covered), Jiangxi Copper (600362.SS, covered by Rachel Zhang) and Kingboard Laminates, etc.
M
On our estimates ( Exhibit 73 & Exhibit 74 ), Mitsui Kinzoku, Co-Tech, Furukawa, Fukuda and CFL together account for 88%/78%/76% of global HVLP4+ copper foil capacity in 2026/2027/2028; Mitsui Kinzoku will remain the share leader for the most high-end grades, but Co-Tech is a close follower, with supply share expected to reach 20%+ by 2028, on our estimates.
Exhibit 73: Global HVLP4 copper foil suppliers' market share by capacity (2026E)
Exhibit 74: Global HVLP4 copper foil suppliers' market share by capacity (2028E)
Source: Morgan Stanley Research estimates.
Source: Morgan Stanley Research estimates.
Key customers
Co-Tech sits one step further upstream and sells circuit foils to CCL (PCB inner layers) and PCB makers (PCB outer layers). The customer base is led by the Taiwan laminators Elite Material (2383.TW), ITEQ (6213.TW, not covered) and TUC (6274.TWO), but Co-Tech also supplies to Shengyi Tech and Doosan. Because demand reaches Co-Tech through the laminators, end-platform exposure is indirect.
What are the key risks?
- AI demand is structural but volatile: Hardware/CCL orders can swing with delays, bottlenecks and inventory digestion.
- Qualification creates an edge, not permanence: Incumbents benefit, but each platform transition can reopen competition.
- Competition is rising: Chinese entrants could pressure share, pricing and margins, even initially via second-source positions.
- Other materials are constrained: Advanced glass cloth shortages could also cap copper foil and CCL shipments.
- CPO is a longer-term risk: It could reduce demand for premium copper foil grades, but is unlikely to materially affect 2026 tightness.
Price target and valuation methodology
Our price target for Co-Tech is NT$730: This implies 39x CY27 or 23x CY28 P/E. Our price target is also our base case scenario value. It is derived from our residual income (RI)
M
model (similar to the rest of our tech hardware universe).
To calculate the fair value of the stock, we use the company's beginning equity plus the present value of all expected residual income of earnings in excess of cost of capital. The RI is positive when ROAE is above the cost of capital and negative when it is below the cost of capital. Our key assumptions include a cost of equity of 9.3% (beta of 1.0, equity risk premium of 8.7%, and risk-free rate of 1.0%), a medium-term growth rate of 13% and a terminal growth rate of 3%.
The 23x CY28 P/E implied by our price target is slightly above the past 3Y average of 20x. We deem this valuation as fair, because Co-Tech is benefitting from an earnings growth cycle fueled by stronger AI server/networking CCL demand, Co-Tech's continued mix improvement (from HTE + RTF (RG) copper foils to advanced RTF (RG) + HVLP3+ copper foils) and continued processing fee adjustments, which supports margin expansion from 21.8% in 2025 to 47.2% by 2028 and a EPS CAGR of 96% over 2025-2028, on our estimates. The stock is trading at just 16.4x CY28 P/E, below Co-Tech's past 3Y average 20x. Thus, we view the risk reward as attractive.
Bull case value NT$1,200: In this scenario, we assume high-end servers and switches see significantly stronger growth in 2027-28, driven by faster-than-expected new data center build-outs and smooth ramp of new generations of AI/networking chips; we also assume copper foil demand from key satellite customer will be stronger than expected. As a result, we assume Co-Tech's copper foil demand from the aforementioned applications to remain robust and its product mix to see continued improvement from the adoption of HVLP4+ copper foils from more applications. Under this scenario, our bull case value implies 38x 2028e EPS.
Bear case value NT$300: In this scenario, we assume high-end servers and switches see significantly weaker demand in 2027-28, driven by slowdown in new data center buildouts and delayed ramps of new generations of AI/networking chips; we also assume copper foil demand from key satellite customer will be stagnant. As a result, we assume Co-Tech's copper foil demand from the aforementioned applications to become sluggish and its customers' migration to the HVLP4+ platform to be put on hold. Under this scenario, our bear case value implies 9x 2028e EPS.
Exhibit 75: Residual income (RI) model
| 2027E | 2028E | 2029E | 2030E | 2031E | 2032E | 2033E | 2034E | 2035E | 2036E | 2037E | ||
|---|---|---|---|---|---|---|---|---|---|---|---|---|
| Total Equity | 12,974 | 18,739 | 21,222 | 24,028 | 27,198 | 30,781 | 34,829 | 39,403 | 44,572 | 50,413 | 54,885 | |
| Net Profit | 4,706 | 8,009 | 9,050 | 10,227 | 11,556 | 13,059 | 14,756 | 16,675 | 18,842 | 21,292 | 21,931 | |
| Return on Equity | 42.1% | 50.5% | 45.3% | 45.2% | 45.1% | 45.0% | 45.0% | 44.9% | 44.9% | 44.8% | 41.7% | |
| Beta | 1.0 | 1.0 | 1.0 | 1.0 | 1.0 | 1.0 | 1.0 | 1.0 | 1.0 | 1.0 | 1.0 | 1.0 |
| Equity Risk Premium (Rm-Rf) | 8.7% | 8.7% | 8.7% | 8.7% | 8.7% | 8.7% | 8.7% | 8.7% | 8.7% | 8.7% | 8.7% | 8.7% |
| Risk Free Rate (Rf) | 1.0% | 1.0% | 1.0% | 1.0% | 1.0% | 1.0% | 1.0% | 1.0% | 1.0% | 1.0% | 1.0% | 1.0% |
| Cost of Equity | 9.3% | 9.3% | 9.3% | 9.3% | 9.3% | 9.3% | 9.3% | 9.3% | 9.3% | 9.3% | 9.3% | 9.3% |
| Residual Income | 3,079 | 5,346 | 6,744 | 7,618 | 8,606 | 9,721 | 10,982 | 12,407 | 14,016 | 15,835 | 16,309 | |
| Spread | 32.8% | 41.2% | 36.0% | 35.9% | 35.8% | 35.7% | 35.7% | 35.6% | 35.6% | 35.5% | 32.4% | |
| Beginning Equity Capital | 12,974 | |||||||||||
| PV of Forecast Period | 62,414 | |||||||||||
| PV of Continuing Value | 109,467 | |||||||||||
| Equity Value | 184,855 | |||||||||||
| No. of Shares | 253 | |||||||||||
| Projected Price | 730.0 | |||||||||||
| Implied CY27 PE | 39x | |||||||||||
| Implied CY28 PE | 23x |
Source: Morgan Stanley Research estimates.
M
Exhibit 76: Co-Tech P/E chart
Source: Company data, Morgan Stanley Research estimates.
M
Co-Tech Financials
Exhibit 77: Co-Tech: Quarterly earnings estimates
| 1Q25 | 2Q25 | 3Q25 | 4Q25 | 1Q26 | 2Q26 | 3Q26E | 4Q26E | 2025 | 2026E | 2027E | 2028E | |
|---|---|---|---|---|---|---|---|---|---|---|---|---|
| Net sales | 1,728 | 2,002 | 1,986 | 2,164 | 2,532 | 2,805 | 2,949 | 2,829 | 7,880 | 11,115 | 15,849 | 22,496 |
| COGS | (1,365) | (1,624) | (1,578) | (1,598) | (1,805) | (2,037) | (2,117) | (1,864) | (6,165) | (7,822) | (9,528) | (11,882) |
| Gross profit | 363 | 378 | 408 | 567 | 727 | 768 | 832 | 965 | 1,715 | 3,293 | 6,321 | 10,614 |
| Operating expenses | (57) | (60) | (71) | (79) | (78) | (83) | (99) | (96) | (268) | (356) | (485) | (650) |
| SG&A | (47) | (48) | (53) | (58) | (55) | (55) | (70) | (68) | (205) | (248) | (339) | (458) |
| R&D | (11) | (12) | (18) | (21) | (23) | (28) | (29) | (28) | (62) | (108) | (146) | (192) |
| Operating income | 306 | 317 | 337 | 487 | 649 | 685 | 733 | 870 | 1,447 | 2,936 | 5,835 | 9,964 |
| Non-operating income | 25 | (110) | (22) | 1 | 0 | 4 | 12 | 12 | (107) | 27 | 47 | 47 |
| Interest income | 0 | 0 | (4) | (5) | (6) | (3) | (3) | (3) | (8) | (15) | (13) | (13) |
| Investment income | 0 | 0 | 0 | 0 | 0 | 0 | 0 | 0 | 0 | 0 | 0 | 0 |
| Disposal of investment | 0 | 0 | 0 | 0 | 0 | 0 | 0 | 0 | 0 | 0 | 0 | 0 |
| Exchange gain | 15 | (116) | 41 | (14) | (10) | (9) | 0 | 0 | (74) | (18) | 0 | 0 |
| Other | 9 | 6 | (59) | 20 | 16 | 15 | 15 | 15 | (25) | 61 | 60 | 60 |
| Pre-tax income | 330 | 208 | 315 | 488 | 649 | 688 | 745 | 881 | 1,341 | 2,964 | 5,883 | 10,011 |
| Income tax | (65) | (41) | (62) | (111) | (129) | (143) | (149) | (176) | (278) | (598) | (1,177) | (2,002) |
| Minority interest | 0 | 0 | 0 | 0 | 0 | 0 | 0 | 0 | 0 | 0 | 0 | 0 |
| Net income | 265 | 167 | 253 | 377 | 520 | 545 | 596 | 705 | 1,063 | 2,366 | 4,706 | 8,009 |
| Adj.wtd.avg.shrs (mn) | 253 | 253 | 252 | 253 | 252 | 252 | 252 | 252 | 253 | 253 | 253 | 253 |
| EPS | 1.05 | 0.66 | 1.00 | 1.49 | 2.06 | 2.16 | 2.36 | 2.79 | 4.20 | 9.34 | 18.59 | 31.63 |
| Fully Diluted shares (mn) | 253 | 253 | 252 | 253 | 252 | 252 | 252 | 252 | 253 | 253 | 253 | 253 |
| Diluted EPS (NT$) | 1.05 | 0.66 | 1.00 | 1.49 | 2.06 | 2.16 | 2.36 | 2.79 | 4.20 | 9.34 | 18.59 | 31.63 |
| Margins (%) | ||||||||||||
| Gross Margin | 21.0 | 18.9 | 20.5 | 26.2 | 28.7 | 27.4 | 28.2 | 34.1 | 21.8 | 29.6 | 39.9 | 47.2 |
| Operating Margin | 17.7 | 15.9 | 17.0 | 22.5 | 25.6 | 24.4 | 24.9 | 30.7 | 18.4 | 26.4 | 36.8 | 44.3 |
| Pretax Margin | 19.1 | 10.4 | 15.9 | 22.5 | 25.6 | 24.5 | 25.3 | 31.2 | 17.0 | 26.7 | 37.1 | 44.5 |
| Net Margin | 15.3 | 8.3 | 12.8 | 17.4 | 20.5 | 19.4 | 20.2 | 24.9 | 13.5 | 21.3 | 29.7 | 35.6 |
| QoQ Growth (%) | ||||||||||||
| Sales | 1 | 16 | -1 | 9 | 17 | 11 | 5 | -4 | ||||
| Gross Profit | 21 | 4 | 8 | 39 | 28 | 6 | 8 | 16 | ||||
| Operating Profit | 26 | 4 | 6 | 44 | 33 | 6 | 7 | 19 | ||||
| Pretax Profit | 36 | -37 | 52 | 55 | 33 | 6 | 8 | 18 | ||||
| Net Profit | 36 | -37 | 52 | 49 | 38 | 5 | 9 | 18 | ||||
| YoY Growth (%) | ||||||||||||
| Sales | 15 | 10 | 11 | 27 | 47 | 40 | 49 | 31 | 16 | 41 | 43 | 42 |
| Gross Profit | 17 | -9 | 24 | 90 | 100 | 103 | 104 | 70 | 27 | 92 | 92 | 68 |
| Operating Profit | 19 | -13 | 20 | 101 | 112 | 116 | 117 | 78 | 27 | 103 | 99 | 71 |
| Pretax Profit | 25 | -43 | 14 | 101 | 97 | 232 | 136 | 81 | 17 | 121 | 99 | 70 |
| Net Profit | 25 | -43 | 14 | 93 | 96 | 226 | 135 | 87 | 15 | 123 | 99 | 70 |
Source: Company Data, Morgan Stanley Research estimates.
M
Exhibit 78: Co-Tech: Consolidated financial summary
| Consolidated Income Statement | Consolidated Income Statement | Consolidated Income Statement | Consolidated Income Statement | Consolidated Income Statement | Consolidated Cash Flow Statement | Consolidated Cash Flow Statement | Consolidated Cash Flow Statement | Consolidated Cash Flow Statement | Consolidated Cash Flow Statement |
|---|---|---|---|---|---|---|---|---|---|
| NT$mn (Year End Dec 31) | 2025 | 2026E | 2027E | 2028E | NT$mn (Year End Dec 31) | 2025 | 2026E | 2027E | 2028E |
| Net sales | 7,880 | 11,115 | 15,849 | 22,496 | Operating Cashflow | 362 | 1,439 | 3,318 | 6,029 |
| COGS | (6,165) | (7,822) | (9,528) | (11,882) | Net Profits | 1,063 | 2,366 | 4,706 | 8,009 |
| Gross profit | 1,715 | 3,293 | 6,321 | 10,614 | Depreciation & Amort. | 90 | 90 | 98 | 106 |
| Operating expenses | (268) | (356) | (485) | (650) | Investment losses/(income) | 0 | 0 | 0 | 0 |
| Operating income | 1,447 | 2,936 | 5,835 | 9,964 | Working capital change | 2,757 | (984) | (1,438) | (2,019) |
| Non-operating income | (107) | 27 | 47 | 47 | Other adjustments | (3,584) | (33) | (48) | (67) |
| Interest income | (8) | (15) | (13) | (13) | Investing Cashflow | (792) | (497) | (496) | (494) |
| Investment income | - | - | - | - | Capex | (500) | (500) | (500) | (500) |
| Disposal of investment | - | - | - | - | Change of L/T investment | 0 | 0 | 0 | 0 |
| Exchange gain | (74) | (18) | - | - | Change of S/T investment | (290) | 0 | 0 | 0 |
| Other | (25) | 61 | 60 | 60 | Other adjustments | (5) | 0 | 0 | 0 |
| Pre-tax income | 1,341 | 2,964 | 5,883 | 10,011 | Financing Cashflow | (816) | (194) | (819) | (1,931) |
| Income tax | (278) | (598) | (1,177) | (2,002) | Increase in L/T debt | 0 | 0 | 0 | 0 |
| Minority interests | - | - | - | - | Increase in S/T debt | (429) | 300 | 300 | 300 |
| Net income | 1,063 | 2,366 | 4,706 | 8,009 | Issuance of stock | 0 | 6 | 0 | 0 |
| Adj. wtd. Avg. shrs (m) | 253 | 253 | 253 | 253 | Cash dividends | (379) | (506) | (1,128) | (2,243) |
| Reported EPS (NT$) | 4.20 | 9.34 | 18.59 | 31.63 | Other adjustments | (8) | 6 | 9 | 12 |
| Diluted shrs (m) | 253 | 253 | 253 | 253 | FX adjustment | (0) | 18 | 0 | 0 |
| Diluted EPS (NT$) | 4.20 | 9.34 | 18.59 | 31.63 | Net change in cash | (1,246) | 767 | 2,004 | 3,604 |
| Consolidated Balance Sheet | Consolidated Balance Sheet | Consolidated Balance Sheet | Consolidated Balance Sheet | Consolidated Balance Sheet | Consolidated Financial Ratios | Consolidated Financial Ratios | Consolidated Financial Ratios | Consolidated Financial Ratios | Consolidated Financial Ratios |
| NT$mn (Year End Dec 31) | 2025 | 2026E | 2027E | 2028E | 2025 | 2026E | 2027E | 2028E | |
| Cash | 745 | 1,511 | 3,515 | 7,118 | Margins (%) | ||||
| Mkt securities | 0 | 0 | 0 | 0 | Gross margin | 21.8 | 29.6 | 39.9 | 47.2 |
| AR/NR | 2,388 | 3,368 | 4,803 | 6,817 | Operating margin | 18.4 | 26.4 | 36.8 | 44.3 |
| Inventory | 941 | 1,194 | 1,455 | 1,814 | Pretax margin | 17.0 | 26.7 | 37.1 | 44.5 |
| Others | 79 | 112 | 160 | 227 | Net margin | 13.5 | 21.3 | 29.7 | 35.6 |
| Current Assets | 4,153 | 6,185 | 9,932 | 15,976 | YoY growth (%) | ||||
| Long-term investments | 583 | 583 | 583 | 583 | Sales | 15.5 | 41.1 | 42.6 | 41.9 |
| Fixed assets | 4,598 | 5,004 | 5,402 | 5,790 | Operating profits | 26.6 | 102.9 | 98.7 | 70.8 |
| Other assets | 113 | 113 | 113 | 113 | Pretax profits | 16.7 | 121.0 | 98.5 | 70.2 |
| Total Assets | 9,446 | 11,885 | 16,029 | 22,461 | Net profits | 15.3 | 122.6 | 98.9 | 70.2 |
| S/T borrowings | 993 | 1,293 | 1,593 | 1,893 | Others | ||||
| AP/NP | 281 | 356 | 434 | 541 | Cash dividend payout (%) | 48% | 48% | 48% | 48% |
| Other ST liabilities | 647 | 821 | 1,000 | 1,247 | Cash div (NT$) | 2.00 | 4.45 | 8.86 | 15.08 |
| Total Current Liabilities | 1,921 | 2,470 | 3,027 | 3,681 | Yield (%) | 0% | 1% | 2% | 3% |
| L/T debt | - | - | - | - | Net Debt/Equity (%) | 3% | -2% | -15% | -28% |
| Other LT libilities | 14 | 20 | 29 | 41 | Liabilities/Equity (%) | 26% | 27% | 24% | 20% |
| Total Liabilities | 1,935 | 2,490 | 3,056 | 3,722 | Liabilities/Assets (%) | 20% | 21% | 19% | 17% |
| Common shares | 2,526 | 2,532 | 2,532 | 2,532 | ROAE (%) | 15% | 28% | 42% | 51% |
| Retained Earnings | 2,683 | 4,561 | 8,139 | 13,905 | ROAA (%) | 12% | 22% | 34% | 42% |
| Other SH' Equity | 2,302 | 2,302 | 2,302 | 2,302 | AR/NR Turnover (days) | 96 | 95 | 94 | 94 |
| Total Shareholders' Equity | 7,511 | 9,395 | 12,974 | 18,739 | Inventory Turnover (days) | 49 | 50 | 51 | 50 |
| Total Liab./SH's Equity | 22,461 | AP/NP Turnover (days) | 17 | 15 | 15 | 15 | |||
| 9,446 | 11,885 | 16,029 | Cash | ||||||
| conversion cycle 129 129 | conversion cycle 129 129 | conversion cycle 129 129 | 130 130 | 130 130 |
Source: Company Data, Morgan Stanley Research estimates.
M
Risk Reward - Co-Tech Development Corp. (8358.TWO) Risk Reward - Co-Tech Development Corp. (8358.TWO)
Exiting Cheap Copper, Entering Premium Returns
NT$730.00 PRICE TARGET
Base case, derived from a residual income (RI) model. Key assumptions include a cost of equity of 9.3% (beta of 1.0, equity premium of 8.7% and risk-free rate of 1%), medium-term growth rate of 13%, and terminal growth rate of 3%.
RISK REWARD CHART
Key:
Source: Refinitiv, Morgan Stanley Research
BULL CASE
38x 2028e P/E
We assume high-end servers and switches see significantly stronger growth in 2027-28, driven by faster-than-expected new data center build-outs and smooth ramp of new generations of AI/networking chips; we also assume copper foil demand from key satellite customer will be stronger than expected. We assume Co-Tech's copper foil demand from the mentioned applications remains robust while its product mix sees continued improvement from the adoption of HVLP4+ copper foil in more applications.
NT$1,200.00
BASE CASE
23x 2028e P/E
Co-Tech continues to grow materially driven by AI server demand growth, material grade upgrades and better pricing power due to scarce high-end capacity and continued shift toward higher-end applications.
NT$730.00
OVERWEIGHT THESIS
- Co-Tech has exited the low-margin HTE copper foil business, which should support profitability improvement.
- Co-Tech has a dominant share in the server R-PCB copper foil market with its RG copper foils (equivalent to HVLP1/2), making it a key beneficiary of global data center infrastructure build-outs.
- Co-Tech is proactively expanding its HVLP4 capacity to support key AI customers' high-end copper foil demand. It should have a 21% supply share by 2028, on our estimates.
- Risk-reward is attractive with the stock trading at 17x CY28 P/E vs the 3Y historical average of 20x.
Risk Reward Themes
New Data Era:
Positive Positive
Pricing Power:
View descriptions of Risk Rewards Themes here
BEAR CASE
9x 2028e P/E
We assume high-end servers and switches see significantly weaker demand in 2027-28, driven by slowdown in new data center build-outs and delayed ramp of new generations of AI/networking chips; we also assume copper foil demand from key satellite customer will be stagnant. As a result, we assume Co-Tech's copper foil demand from the aforementioned applications becomes sluggish and its customers' migration to the HVLP4+ platform to be put on hold.
NT$300.00
M
Risk Reward - Co-Tech Development Corp. (8358.TWO)
KEY EARNINGS INPUTS
| Drivers | 2025 | 2026e | 2027e | 2028e |
|---|---|---|---|---|
| HVLP Copper Foil Revenue Contribution (%) | 3.3 | 14.3 | 34 | 46.3 |
INVESTMENT DRIVERS
- Monthly sales
- Project and supply share allocation
- Copper foil content per server/switch/satellite
- Processing fee adjustment
GLOBAL REVENUE EXPOSURE
Source: Morgan Stanley Research Estimate View explanation of regional hierarchies here
RISKS TO PT/RATING
RISKS TO UPSIDE
- Stronger AI demand
- Slower-than-expected capacity expansion by competitors
- Faster-than-expected material upgrades
- Slower-than-expected CPO adoption
RISKS TO DOWNSIDE
- Weaker AI demand
- Faster-than-expected capacity expansion by competitors
- Slower-than-expected material upgrades
- Faster-than-expected CPO adoption
MS ESTIMATES VS. CONSENSUS
M
KB Laminates (1888.HK): Initiate at Overweight, Price Target of HK$75
Company overview
Kingboard Laminates (KB Laminates) is the laminates arm of the Kingboard Group, spun out of Kingboard Holdings (0148.HK) and listed on the Main Board of the Hong Kong Stock Exchange in December 2006. The operating history predates the listing by nearly two decades. The group built its first laminate plant in Shenzhen in 1988 and began producing paper laminates in 1989, then expanded horizontally into glass epoxy and flame-retardant paper laminates and vertically into copper foil, glass yarn, glass fabric, bleached kraft paper and epoxy resin, with the Fogang copper foil operation itself spun off and listed in Singapore in 1999 as Kingboard Copper Foil. That upstream ownership (vertical integration) is the defining feature of the business and the clearest contrast with most other CCL suppliers globally. Kingboard self-supplies most of its critical inputs and competes on cost, scale and supply security, whereas its competitors buy its inputs and compete on specification.
KB Laminates positions itself as the world's largest CCL producer by volume, a position it dates to the mid-2000s. Kingboard Laminates remains controlled through the parent, reports across the Laminates, Properties and Investments segments, and is headquartered in Sha Tin, Hong Kong.
Key products
KB Laminates mainly reports across three business segments:
- Laminates
- Properties
- Investments
In 2025, laminates accounted for 99% of revenue and 98% of operating profits.
- Within the laminates business, we believe the majority of revenue comes from CCL (80-90%), while the rest comes from upstream materials such as copper foil, glass cloth, etc.
Capacity
The laminate segment's capacity footprint is concentrated in China. In Guangdong, the core sites are Fogang in Qingyuan City (both glass epoxy and paper laminate plants, the historical heart of the business), Shixing County in Shaoguan, Jiangmen in the Jianghai hightech zone, and Guangzhou. In Jiangsu, there is Kunshan in the economic and technological development zone, plus Jiangyin for composite material.
Copper foil capacity mainly sits at Fogang and Lianzhou in Guangdong, with a new 21,000-tonne plant for high-frequency and low-loss foil starting mid-2027 in Fogang.
M
Glass yarn and cloth capacity mainly run through Qingyuan, Lianzhou and Panyu Nansha, with the first 500-tonne low-Dk yarn kiln at Qingyuan commissioned in 1H25, a six-kiln specialty yarn factory planned in the Qingyuan park, and a Shaoguan project carrying 70,000 tonnes of yarn and 100M meters of cloth from 2H26.
Bleached kraft paper is made at Taicang in Jiangsu and Qingyuan.
Exhibit 80: Glass cloth capacity (2023-28E)
Exhibit 79: CCL capacity (2023-2028E)
Source: Morgan Stanley Research estimates.
Exhibit 81: Copper foil capacity (2023-28E)
Copper foil capacity (tonnes/month)
Source: Morgan Stanley Research estimates.
Source: Morgan Stanley Research estimates.
Key competitors
The competitive landscape varies significantly by product grade. In commodity FR-4, the largest volume suppliers include China's Shengyi Technology and Taiwan's Nan Ya Plastics, with the top five producers accounting for more than 60% of the global CCL market. This remains Kingboard Laminates' core market today.
Kingboard is now expanding into M6-and-above high-speed, low-loss CCL. The first phase of its new capacity is scheduled to come online in 1H27, targeting 350,000 sheets per month, followed by a second phase of an additional 350,000 sheets per month in 1H28. In this higher-end segment, Kingboard will compete with Elite Material, Taiwan Union Technology, ITEQ, Panasonic, Doosan Electro-Materials, and Shengyi Technology.
Key customers
Kingboard Laminates sells its CCL directly to PCB fabricators, serving both independent
M
customers and affiliated manufacturers within the broader Kingboard Group. The group's downstream PCB operations include uo. These affiliated customers provide a captive outlet for part of Kingboard's production and allow closer coordination on material development, qualification, and production planning. However, the laminates business remains predominantly externally focused. In 2025, the segment generated HK$16.9 billion in external revenue and HK$3.8 billion in intersegment revenue, implying that external sales accounted for approximately 82% of the total. We believe KB Laminates' external PCB customer base includes TTM Technologies, Tripod Technology, Meiko Electronics, VGT, and Kinwong, among others.
Kingboard's vertical integration also extends upstream into several of the key raw materials used in CCL production, including copper foil, electronic fiberglass yarn and cloth, epoxy resin, and paper-based materials. These operations primarily support the group's own laminate manufacturing, giving Kingboard greater control over raw-material availability, cost, quality, and production scheduling. Surplus output is sold to third-party CCL manufacturers, providing an additional revenue stream, although the main strategic purpose of these assets is to support Kingboard's internal supply chain. This structure is particularly valuable during periods of tight raw-material supply, when less-integrated competitors may face higher input costs or production constraints. We estimate that KB Laminates sells 20% of its upstream materials to third parties. This includes glass cloth and copper foil supplied to external CCL manufacturers (such as EMC, Shengyi, Panasonic, Doosan, etc), as well as glass yarn sold to independent glass-cloth weavers such as Fulltech, amongst others.
Pricing tailwind for standard grade electronic cloth
We have seen ASP for standard E-Glass cloth rising, and we think there is more to come. Strong demand for higher-grade, more advanced cloth is causing more suppliers to shift capacity over, and a result of that shift, is causing constraints on standard grade cloth, thus creating this tailwind. This is one of the reasons why KB Laminates saw strong margin improvement in its 1H26 results.
Electronic fiberglass earnings inflection likely to accelerate in 2H26: According to KB Laminates' 2025 annual report, profit contribution from the electronic fiberglass yarn and fabric business exceeded HK$600M in CY25, representing 70% y/y growth. This implies a CY24 contribution of HK$350M, or approximately 27% of group profit. The segment's contribution increased further to HK$1.0B in 1H26 (1H26 interim results), equivalent to approximately 35% of total group profit, versus approximately 25% in CY25.
We expect the earnings contribution from electronic fiberglass to strengthen further in 2H26. KB Laminates implemented price increases in each month of 1H26, and the associated earnings benefit typically flows through with a lag as existing contracts and inventory are repriced. As a result, we believe several of the price increases announced during 1H26 will only be fully reflected in 2H26 earnings. Additional price increases in early July and late August should provide further support into the remainder of the year.
This pricing momentum may help explain management's disclosure that July profit reached HK$1.1B, a particularly strong result relative to the HK$2.9B reported for the entirety of 1H26. While monthly earnings may be volatile and July's performance should not necessarily be extrapolated in full, the current run rate suggests that 2H26 profit could
M
exceed HK$5.6B, with electronic fiberglass likely accounting for an increasing share of the group's earnings mix.
Exhibit 82: Pricing for E-glass yarn has been rising every month, and we believe September will continue the trend
Standard grade E-glass yarn (RMB/KG)
Source: Morgan Stanley Research estimates.
Exhibit 83: Pricing of different glass yarn grades Pricing of different glass yarn grades (RMB/KG)
Source: Morgan Stanley Research estimates.
Exhibit 84:
Electronic fiberglass yarn and fabric's recent ASP increase is resulting in larger contributions to KB Laminates' total profit
Electronic fiberglass yarn and fabric profit (HK$ M)
Source: Company data, Morgan Stanley Research.
What are the key risks?
- AI demand is structural but volatile: Hardware/CCL orders can swing with delays, bottlenecks and inventory digestion.
- Qualification creates an edge, not permanence: Incumbents benefit, but each platform transition can reopen competition.
- Competition is rising: Other new Chinese entrants could pressure share, pricing and margins.
- Upstream materials are constrained: Advanced glass cloth and HVLP copper foil shortages support pricing but can cap shipments.
- CPO is a longer-term risk: It could reduce demand for premium CCL grades, but is unlikely to materially affect 2026 tightness.
4.1x
M
Price target and valuation methodology
Our price target for KB Laminates is HK$75: This implies 14x CY28 P/E. Our price target is also our base case scenario value. It is derived from our residual income (RI) model (similar to the rest of our tech hardware universe).
To calculate the fair value of the stock, we use the company's beginning equity plus the present value of all expected residual income of earnings in excess of cost of capital. The RI is positive when ROAE is above the cost of capital and negative when it is below the cost of capital. Our key assumptions include a cost of equity of 9.7% (beta of 1.0, equity risk premium of 8.7%, and risk-free rate of 1.0%), a medium-term growth rate of 8% and a terminal growth rate of 3%.
The 14x CY28 P/E implied by our price target is slightly above the past 3Y average of 12.8x. We deem this valuation as fair, because KB Laminates is benefitting from an earnings growth cycle fueled by price hikes of its FR4 CCLs and glass cloth, as well as its gradual penetration into the higher-end CCL material market, which supports margin expansion from 19.6% in 2025 to 41.7% by 2028 and a EPS CAGR of 91% over 2025-2028, on our estimates. That said, we believe the company remains more of a cyclical play compared to its Taiwanese peers including EMC and TUC. Thus, we view the 1x re-rating vs. its past 3Y P/E average as fair. The stock is trading at just 8.5x CY28 P/E, below KB's past 3Y average of 13x. Therefore, we view the risk reward as attractive.
Bull case value HK$115: In this scenario, we assume demand for general server, networking switches, and AI servers sees significantly stronger growth in 2026-28, driven by replacement and new data center builds. In addition, we also assume KB Laminates is able to secure and take share in the high-speed, low-loss CCL market (M6+ grade CCLs), while also able to continue to hike price well into 2027 with no signs of pricing declines into 2028. Under this scenario, our bull case value implies 21.3x CY28 P/E.
Bear case value HK$33: In this scenario, we assume demand for general server, networking switches, and AI servers declines vs our current expectations of growth, in 2027-28. And therefore KB Laminates is not able to take share in the high-speed, low-loss CCL market, as leading incumbents compete on price to keep utilization rates full. We also assume KB Laminates will have to start lowering prices for standard grade CCLs. Under this scenario, our bear case value implies 6.1x CY28 P/E.
Exhibit 85: Residual income (RI) model
| HK$ M | FY2027E | FY2028E | FY2029E | FY2030E | FY2031E | FY2032E | FY2033E | FY2034E | FY2035E | FY2036E | FY2037E |
|---|---|---|---|---|---|---|---|---|---|---|---|
| Total Equity | 29,498 | 34,130 | 37,406 | 51,905 | 67,563 | 84,474 | 102,738 | 122,462 | 143,765 | 166,772 | 191,620 |
| Core Net Profit | 14,134 | 16,919 | 17,984 | 19,422 | 20,976 | 22,654 | 24,466 | 26,424 | 28,538 | 30,821 | 33,286 |
| Return on Equity | 62.0% | 57.4% | 52.7% | 51.9% | 40.4% | 33.5% | 29.0% | 25.7% | 23.3% | 21.4% | 20.0% |
| Beta | 1.00 | 1.00 | 1.00 | 1.00 | 1.00 | 1.00 | 1.00 | 1.00 | 1.00 | 1.00 | 1.00 |
| Equity Risk Premium (Rm-Rf) | 8.7% | 8.7% | 8.7% | 8.7% | 8.7% | 8.7% | 8.7% | 8.7% | 8.7% | 8.7% | 8.7% |
| Risk Free Rate (Rf) | 1.0% | 1.0% | 1.0% | 1.0% | 1.0% | 1.0% | 1.0% | 1.0% | 1.0% | 1.0% | 1.0% |
| Cost of Equity | 9.7% | 9.7% | 9.7% | 9.7% | 9.7% | 9.7% | 9.7% | 9.7% | 9.7% | 9.7% | 9.7% |
| Residual Income | 11,933 | 14,073 | 14,690 | 15,812 | 15,967 | 16,134 | 16,315 | 16,510 | 16,720 | 16,947 | 17,193 |
| Spread | 52.3% | 47.7% | 43.0% | 42.3% | 30.8% | 23.9% | 19.3% | 16.1% | 13.7% | 11.8% | 10.3% |
| Yr-end Equity Capital | 29,498 | ||||||||||
| PV of Forecast Period | 98,562 | ||||||||||
| PV of Continuing Value | 106,830 | ||||||||||
| Equity Value | 234,890 | ||||||||||
| Fully diluted Shares | 3,132 | ||||||||||
| Projected Price (HK$) | 75.00 | ||||||||||
| Implied CY27 P/E | 17x | ||||||||||
| Implied CY28 P/E | 14x |
Source: Morgan Stanley Research estimates.
M
Exhibit 86: KB Laminates P/E chart
Source: Company data, Morgan Stanley Research estimates.
M
Kingboard Laminates Financials
Exhibit 87: Kingboard Laminates: Semi-Annual Earnings Estimates
| HK$ M | 1H25 | 2H25 | 1H26 | 2H26E | 1H27E | 2H27E | 1H28E | 2H28E | F2025 | F2026E | F2027E | F2028E |
|---|---|---|---|---|---|---|---|---|---|---|---|---|
| Net sales | 9,588 | 10,812 | 14,904 | 20,087 | 22,093 | 24,317 | 26,747 | 32,115 | 20,400 | 34,990 | 46,410 | 58,862 |
| COGS | (7,825) | (8,584) | (10,324) | (11,608) | (12,551) | (13,401) | (15,810) | (18,518) | (16,409) | (21,932) | (25,953) | (34,328) |
| Gross profit | 1,763 | 2,228 | 4,580 | 8,479 | 9,542 | 10,916 | 10,937 | 13,598 | 3,991 | 13,059 | 20,457 | 24,534 |
| Other income (expense) | 107 | 464 | - | - | - | - | - | - | 571 | - | - | - |
| Operating expenses | (612) | (729) | (694) | (793) | (797) | (883) | (863) | (971) | (1,341) | (1,487) | (1,680) | (1,834) |
| Selling and distribution | (231) | (247) | (273) | (287) | (301) | (316) | (332) | (349) | (479) | (560) | (618) | (681) |
| Administrative | (380) | (430) | (439) | (461) | (484) | (508) | (534) | (560) | (811) | (900) | (992) | (1,094) |
| R&D | - | - | - | - | - | - | - | - | - | - | - | - |
| Other OP income (expense)- net | - | (52) | 19 | (45) | (12) | (58) | 2 | (62) | (52) | (27) | (70) | (60) |
| Operating income | 1,258 | 1,963 | 3,887 | 7,685 | 8,745 | 10,033 | 10,073 | 12,627 | 3,221 | 11,572 | 18,777 | 22,700 |
| Non-operating income | (87) | (75) | (372) | (74) | (88) | (75) | (91) | (77) | (161) | (446) | (163) | (168) |
| Profit & Loss of Investment | - | - | - | - | - | - | - | - | - | - | - | - |
| Finance income | - | - | - | - | - | - | - | - | - | - | - | - |
| Finance cost | (87) | (75) | (102) | (68) | (67) | (68) | (68) | (70) | (161) | (170) | (136) | (138) |
| Other income (expense) | - | - | (269) | (6) | (21) | (7) | (22) | (7) | - | (276) | (28) | (30) |
| Pre-tax income | 1,171 | 1,888 | 3,515 | 7,611 | 8,657 | 9,957 | 9,982 | 12,549 | 3,060 | 11,126 | 18,614 | 22,532 |
| Income tax | (238) | (380) | (628) | (1,936) | (1,856) | (2,625) | (2,198) | (3,414) | (618) | (2,564) | (4,480) | (5,613) |
| Consolidated income | 934 | 1,509 | 2,887 | 5,676 | 6,801 | 7,333 | 7,784 | 9,135 | 2,442 | 8,562 | 14,134 | 16,919 |
| Minority interest | 0 | (0) | 0 | 0 | 0 | 0 | 0 | 0 | (0) | 0 | 0 | 0 |
| Net income | 933 | 1,509 | 2,887 | 5,676 | 6,801 | 7,333 | 7,784 | 9,135 | 2,442 | 8,562 | 14,134 | 16,919 |
| Adj.wtd.avg.shrs (m) | 3,120 | 3,122 | 3,122 | 3,122 | 3,122 | 3,122 | 3,122 | 3,122 | 3,122 | 3,122 | 3,122 | 3,122 |
| EPS (HK dollars) | 0.30 | 0.48 | 0.92 | 1.82 | 2.18 | 2.35 | 2.49 | 2.93 | 0.78 | 2.74 | 4.53 | 5.42 |
| Diluted EPS (HK dollars) | 0.30 | 0.48 | 0.92 | 1.81 | 2.17 | 2.34 | 2.49 | 2.92 | 0.78 | 2.73 | 4.51 | 5.40 |
| Margins | ||||||||||||
| Gross margin (%) | 18.4 | 20.6 | 30.7 | 42.2 | 43.2 | 44.9 | 40.9 | 42.3 | 19.6 | 37.3 | 44.1 | 41.7 |
| Operating margin (%) | 13.1 | 18.2 | 26.1 | 38.3 | 39.6 | 41.3 | 37.7 | 39.3 | 15.8 | 33.1 | 40.5 | 38.6 |
| OPM excl. one time charges (%) | 13.1 | 18.2 | 26.1 | 38.3 | 39.6 | 41.3 | 37.7 | 39.3 | 15.8 | 33.1 | 40.5 | 38.6 |
| Pretax margin (%) | 12.2 | 17.5 | 23.6 | 37.9 | 39.2 | 40.9 | 37.3 | 39.1 | 15.0 | 31.8 | 40.1 | 38.3 |
| Net margin (%) | 9.7 | 14.0 | 19.4 | 28.3 | 30.8 | 30.2 | 29.1 | 28.4 | 12.0 | 24.5 | 30.5 | 28.7 |
| HoH | ||||||||||||
| Sales (%) | (3) | 13 | 38 | 35 | 10 | 10 | 10 | 20 | ||||
| Gross profit (%) | 12 | 26 | 106 | 85 | 13 | 14 | 0 | 24 | ||||
| Operating profit (%) | 31 | 56 | 98 | 98 | 14 | 15 | 0 | 25 | ||||
| Pretax profit (%) | 51 | 61 | 86 | 117 | 14 | 15 | 0 | 26 | ||||
| Net profit (%) | 56 | 62 | 91 | 97 | 20 | 8 | 6 | 17 | ||||
| YoY | ||||||||||||
| Sales (%) | 11 | 9 | 55 | 86 | 48 | 21 | 21 | 32 | 10 | 72 | 33 | 27 |
| Gross profit (%) | 3 | 42 | 160 | 281 | 108 | 29 | 15 | 25 | 22 | 227 | 57 | 20 |
| Operating profit (%) | 13 | 104 | 209 | 292 | 125 | 31 | 15 | 26 | 55 | 259 | 62 | 21 |
| Pretax profit (%) | 22 | 143 | 200 | 303 | 146 | 31 | 15 | 26 | 76 | 264 | 67 | 21 |
| Net profit (%) | 28 | 152 | 209 | 276 | 136 | 29 | 14 | 25 | 84 | 251 | 65 | 20 |
Source: Company data, Morgan Stanley Research estimates.
M
Exhibit 88: Kingboard Laminates: Consolidated Financial Summary
Income Statement
| HK$ M; Year end March | F2025 | F2026E | F2027E | F2028E |
|---|---|---|---|---|
| Net sales | 20,400 | 34,990 | 46,410 | 58,862 |
| COGS | (16,409) | (21,932) | (25,953) | (34,328) |
| Gross profit | 3,991 | 13,059 | 20,457 | 24,534 |
| Other operating income | 571 | 0 | 0 | 0 |
| Operating expenses | (1,341) | (1,487) | (1,680) | (1,834) |
| Operating income | 3,221 | 11,572 | 18,777 | 22,700 |
| Profit/Loss of Investment | 0 | 0 | 0 | 0 |
| Finance income | 0 | 0 | 0 | 0 |
| Finance cost | (161) | (170) | (136) | (138) |
| Pre-tax income | 3,060 | 11,126 | 18,614 | 22,532 |
| Income tax | (618) | (2,564) | (4,480) | (5,613) |
| Consolidated income | 2,442 | 8,562 | 14,134 | 16,919 |
| Minority interest | (0) | 0 | 0 | 0 |
| Net income | 2,442 | 8,562 | 14,134 | 16,919 |
| Diluted EPS (HK dollars) | 0.78 | 2.73 | 4.51 | 5.40 |
Balance Sheet
| HK$ M; Year end March | F2025 | F2026E | F2027E | F2028E |
|---|---|---|---|---|
| Cash | 1,628 | 1,278 | 5,477 | 5,402 |
| Mkt securities | 0 | 0 | 0 | 0 |
| AR/NR | 9,599 | 16,463 | 21,837 | 27,695 |
| Inventory | 3,065 | 4,097 | 2,336 | 3,090 |
| Others | 1,251 | 1,251 | 1,251 | 1,251 |
| Current Assets | 15,543 | 23,090 | 30,901 | 37,438 |
| Long-term investments | 1,229 | 1,229 | 1,229 | 1,229 |
| Fixed assets | 7,122 | 7,072 | 6,722 | 6,422 |
| Other assets | 1,019 | 1,019 | 1,019 | 1,019 |
| Total Assets | 25,475 | 32,972 | 40,434 | 46,670 |
| S/T borrowings | 0 | 0 | 0 | 0 |
| AP/NP | 3,143 | 4,200 | 4,970 | 6,574 |
| Other ST liabilities | 4,970 | 4,970 | 4,970 | 4,970 |
| Other liabilities | 356 | 356 | 356 | 356 |
| L/T debt | 639 | 639 | 639 | 639 |
| Total Liabilities | 9,108 | 10,166 | 10,936 | 12,540 |
| Common shares | 314 | 314 | 314 | 314 |
| Reserves | 16,028 | 22,467 | 29,159 | 33,792 |
| Shareholders' equity | 16,367 | 22,806 | 29,498 | 34,130 |
| Total Liab./SH's Equity | 25,475 | 32,972 | 40,434 | 46,670 |
Source: Company data, Morgan Stanley Research estimates.
Cash Flow Statement
| HK$ M; Year end March | F2025 | F2026E | F2027E | F2028E |
|---|---|---|---|---|
| Operating CF | 2,160 | 2,623 | 12,192 | 12,811 |
| Net Profits | 2,442 | 8,562 | 14,134 | 16,919 |
| Depreciation | 932 | 900 | 900 | 900 |
| Equity losses/(income) | 0 | 0 | 0 | 0 |
| Other adjustments | (1,214) | (6,839) | (2,842) | (5,009) |
| Investing CF | (1,339) | (800) | (500) | (500) |
| Capex | (822) | (800) | (500) | (500) |
| Change of S/T investment | (2) | 0 | 0 | 0 |
| Other adjustments | (589) | 0 | 0 | 0 |
| Financing CF | (1,119) | (2,173) | (7,493) | (12,386) |
| Increase in L/T debt | 868 | 0 | 0 | 0 |
| Increase in S/T debt | 0 | 0 | 0 | 0 |
| Issuance of stock | 0 | 0 | 0 | 0 |
| Cash dividends | (1,934) | (2,123) | (7,443) | (12,286) |
| Dir.& Emp. Bonus | 0 | 0 | 0 | 0 |
| Changes in Treasury Stocks | 0 | 0 | 0 | 0 |
| Other adjustments | (53) | (50) | (50) | (100) |
| FX adjustment | 2 | 0 | 0 | 0 |
| Net change in cash | (296) | (350) | 4,199 | (76) |
Financial Ratios
| HK$ M; Year end March | F2025 | F2026E | F2027E | F2028E |
|---|---|---|---|---|
| Margins | ||||
| Gross margin | 19.6% | 37.3% | 44.1% | 41.7% |
| Operating margin | 15.8% | 33.1% | 40.5% | 38.6% |
| Pretax margin | 15.0% | 31.8% | 40.1% | 38.3% |
| Net margin | 12.0% | 24.5% | 30.5% | 28.7% |
| YoY growth | ||||
| Sales | 10% | 72% | 33% | 27% |
| Operating profits | 55% | 259% | 62% | 21% |
| Pretax profits | 76% | 264% | 67% | 21% |
| Net profits | 84% | 251% | 65% | 20% |
| EPS | 84% | 251% | 65% | 20% |
| Others | ||||
| Net Debt/Equity | -6% | -3% | -16% | -14% |
| Liabilities/Equity | 56% | 45% | 37% | 37% |
| Liabilities/Assets | 36% | 31% | 27% | 27% |
| ROAE | 15% | 44% | 54% | 53% |
| ROAA | 10% | 29% | 39% | 39% |
| AR/NR Turnover (days) | 154 | 136 | 151 | 154 |
| AP/NP Turnover (days) | 67 | 61 | 64 | 61 |
| Inventory Turnover (days) | 65 | 60 | 45 | 29 |
| Cash conversion (days) | 151 | 134 | 131 | 121 |
M
Risk Reward - Kingboard Laminates Holdings Ltd. (1888.HK) Risk Reward - Kingboard Laminates Holdings Ltd. (1888.HK)
World's largest vertically integrated CCL producer by volume
HK$75.00 PRICE TARGET
Base case, derived from a residual income (RI) model. Key assumptions include a cost of equity of 9.7% (beta of 1.0, equity premium of 8.7% and risk-free rate of 1%), medium-term growth rate of 8%, and terminal growth rate of 3%.
HK$64.29
Source: Refinitiv, Morgan Stanley Research
BULL CASE
21x 2028e P/E
We assume demand for general servers, networking switches, and AI servers sees significantly stronger growth in 2026-28, driven by replacement and new data center builds. In addition, we also assume KB Laminates is able to secure and take share in the high-speed, low-loss CCL market (M6+ grade CCLs), while also continuing to hike prices well into 2027 with no signs of pricing declines into 2028.
HK$115.00
BASE CASE
14x 2028e P/E
We assume KB Laminates will slowly penetrate the high-speed, low-loss CCL market, while standard grade CCL prices can continue to increase over the next several months. In this scenario, we estimate a revenue CAGR of 40-50% in 2025-29 and a 90-100% profit CAGR over the same period.
HK$75.00
OVERWEIGHT THESIS
- Differentiated by its vertical integration across copper foil, glass yarn and cloth, resin, and paper-based materials, which gives it an advantage in this current cycle as it has internal capability to produce upstream materials that are in constraint now.
- Expanding capacity for M6+ CCL, with capacity coming online from 1H27 onwards.
- Expanding capacity for advanced glass cloth (LowDK1, LowDK2, Low-CTE), making it a competitive player in the high-end advanced glass cloth segment.
- Pricing on standard grade electronic yarn and cloth (E-glass).
- Risk-reward looks attractive at 8.5x CY28 P/E.
Risk Reward Themes
New Data Era: Pricing Power:
Positive Positive
View descriptions of Risk Rewards Themes here
BEAR CASE
6x 2028e P/E
We assume demand for general server, networking switches, and AI servers declines vs our current expectations of growth, in 2027-28. And therefore KB Laminates is not able to take share in the high-speed, lowloss CCL market, as leading incumbents compete on price to keep utilization rates full. We also assume KB Laminates will have to start lowering prices for standard grade CCLs.
HK$33.00
M
Risk Reward - Kingboard Laminates Holdings Ltd. (1888.HK)
KEY EARNINGS INPUTS
| Drivers | 2025 | 2026e | 2027e | 2028e |
|---|---|---|---|---|
| Company Gross Margins (%) | 19.6 | 37.3 | 44.1 | 41.7 |
INVESTMENT DRIVERS
- Price increases for standard grade E-glass
- Suppler share allocation
- Capacity expansion for LowDK/Low-CTE cloth
- CCL content per rack
GLOBAL REVENUE EXPOSURE
Source: Morgan Stanley Research Estimate View explanation of regional hierarchies here
MS ALPHA MODELS
2/5 MOST
3 Month
Horizon
Source: Refinitiv, FactSet, Morgan Stanley Research; 1 is the highest favored Quintile and 5 is the least favored Quintile
RISKS TO PT/RATING
RISKS TO UPSIDE
- Stronger AI demand
- Share gains
- Faster-than-expected material upgrades
- Slower-than-expected CPO adoption
RISKS TO DOWNSIDE
- Weaker AI demand
- Share loss
- Slower-than-expected material upgrades
- Faster-than-expected CPO adoption
MS ESTIMATES VS. CONSENSUS
M
Shengyi Technology (600183.SS, EW, Price Target Rmb170)
Earnings estimate changes
We raise our 2026-27 EPS estimates by 52% and 79% respectively to factor in stronger CCL and PCB demand, as well as stronger than expected pricing, which is why our gross margin assumptions increase 380bps for 2026 and 470bps for 2027. We also introduce our 2028 EPS estimate at Rmb6.98. The difference between net income % change and EPS % change in 2026-27 is due to a slight change in outstanding shares.
Exhibit 89: Shengyi: Estimate changes
| Year to Dec. 31 | 2026E | 2026E | %diff | 2027E | 2027E | %diff | 2028E | 2028E | %diff |
|---|---|---|---|---|---|---|---|---|---|
| (RMB mn) | New | Old | New | Old | New | Old | |||
| P&L Summary | |||||||||
| Net sales | 43,983 | 36,790 | 20% | 63,694 | 44,411 | 43% | 86,867 | 44,411 | 96% |
| COGS | (30,032) | (26,540) | (42,351) | (31,617) | (57,075) | (31,617) | |||
| Gross profit | 13,952 | 10,250 | 36% | 21,344 | 12,794 | 67% | 29,792 | 12,794 | 133% |
| Operating expenses | (4,570) | (3,939) | (6,809) | (4,778) | (9,302) | (4,778) | |||
| Operating income | 9,382 | 6,311 | 49% | 14,535 | 8,017 | 81% | 20,490 | 8,017 | 156% |
| Non-operating income | 317 | (30) | (58) | (30) | (58) | (30) | |||
| Pre-tax income | 9,699 | 6,281 | 54% | 14,477 | 7,987 | 81% | 20,432 | 7,987 | 156% |
| Income tax | (1,168) | (672) | (1,742) | (859) | (2,458) | (859) | |||
| Minority interest | (944) | (700) | (1,027) | (700) | (1,027) | (700) | |||
| Net income | 7,587 | 4,909 | 55% | 11,708 | 6,428 | 82% | 16,947 | 6,428 | 164% |
| EPS (RMB) | 3.12 | 2.06 | 52% | 4.82 | 2.69 | 79% | 6.98 | 2.69 | 159% |
| Margins | |||||||||
| Gross margin | 31.7% | 27.9% | 33.5% | 28.8% | 34.3% | 28.8% | |||
| Operating margin | 21.3% | 17.2% | 22.8% | 18.1% | 23.6% | 18.1% | |||
| Pretax margin | 22.1% | 17.1% | 22.7% | 18.0% | 23.5% | 18.0% | |||
| Net margin | 17.2% | 13.3% | 18.4% | 14.5% | 19.5% | 14.5% |
Source: Morgan Stanley Research estimates.
Price target and valuation methodology
We raise our 12-month price target to Rmb170.0 (24x 2028e EPS), up from Rmb74.0, on our higher earnings estimates for 2026-27 and the introduction of 2028 earnings estimates: Our base-case scenario value, which is also our price target, is derived from a residual income (RI) model.
Our key assumptions include a cost of equity of 7.3% (beta of 1.2, equity risk premium 5.0% and risk-free rate of 1.3% - unchanged), a medium-term growth rate of 10.0%, and a terminal growth rate of 3.0% (all unchanged).
Our bull- and bear-case values increase to Rmb245.00 and Rmb95.00, respectively:
This is in line with the magnitude of increase in our base-case value.
Exhibit 90: Residual income (RI) model
| RMB mn | 2027E | 2028E | 2029E | 2030E | 2031E | 2032E | 2033E | 2034E | 2035E | 2036E | 2037E |
|---|---|---|---|---|---|---|---|---|---|---|---|
| Total Equity | 31,471 | 41,353 | 51,041 | 61,699 | 73,421 | 86,317 | 100,501 | 116,105 | 133,268 | 149,836 | 166,901 |
| Net Profit | 11,708 | 16,947 | 18,641 | 20,505 | 22,556 | 24,811 | 27,293 | 30,022 | 33,024 | 34,015 | 35,035 |
| Return on Equity | 41.9% | 46.5% | 40.4% | 36.4% | 33.4% | 31.1% | 29.2% | 27.7% | 26.5% | 24.0% | 22.1% |
| Beta | 1.2 | 1.2 | 1.2 | 1.2 | 1.2 | 1.2 | 1.2 | 1.2 | 1.2 | 1.2 | 1.2 |
| Equity Risk Premium (Rm-Rf) | 5.0% | 5.0% | 5.0% | 5.0% | 5.0% | 5.0% | 5.0% | 5.0% | 5.0% | 5.0% | 5.0% |
| Risk Free Rate (Rf) | 1.3% | 1.3% | 1.3% | 1.3% | 1.3% | 1.3% | 1.3% | 1.3% | 1.3% | 1.3% | 1.3% |
| Cost of Equity | 7.3% | 7.3% | 7.3% | 7.3% | 7.3% | 7.3% | 7.3% | 7.3% | 7.3% | 7.3% | 7.3% |
| Beginning Equity Capital | 31,471 | ||||||||||
| PV of Forecast Period | 120,042 | ||||||||||
| PV of Continuing Value | 261,428 | ||||||||||
| Equity Value | 412,941 | ||||||||||
| No. of Shares | 2,429 | ||||||||||
| Projected Price (RMB) | 170.0 |
Source: Morgan Stanley Research estimates.
M
Exhibit 91: Shengyi Tech P/E chart
Source: Company data, Morgan Stanley Research estimates.
M
Shengyi Technology Financials
Exhibit 92: Shengyi Tech: Quarterly Earnings Estimates
| RMB mn | 1Q26 | 2Q26P | 3Q26E | 4Q26E | 1Q27E | 2Q27E | 3Q27E | 4Q27E | 2025A | 2026E | 2027E | 2028E |
|---|---|---|---|---|---|---|---|---|---|---|---|---|
| Net sales | 8,141 | 10,884 | 12,032 | 12,925 | 14,015 | 15,385 | 16,438 | 17,857 | 28,431 | 43,983 | 63,694 | 86,867 |
| COGS | (5,894) | (7,383) | (8,099) | (8,656) | (9,372) | (10,267) | (10,910) | (11,802) | (21,056) | (30,032) | (42,351) | (57,075) |
| Gross profit | 2,247 | 3,501 | 3,934 | 4,270 | 4,643 | 5,118 | 5,528 | 6,055 | 7,375 | 13,952 | 21,344 | 29,792 |
| Operating expenses | (806) | (1,067) | (1,287) | (1,409) | (1,498) | (1,606) | (1,759) | (1,946) | (3,075) | (4,570) | (6,809) | (9,302) |
| SG&A, R&D exp. | (806) | (1,067) | (1,287) | (1,409) | (1,498) | (1,606) | (1,759) | (1,946) | (3,075) | (4,570) | (6,809) | (9,302) |
| Employee bonus | 13 | 14 | 15 | 16 | 16 | 16 | 16 | 16 | 1 | 2 | 3 | 3 |
| Operating income | 1,441 | 2,434 | 2,646 | 2,861 | 3,145 | 3,512 | 3,769 | 4,109 | 4,300 | 9,382 | 14,535 | 20,490 |
| Non-operating income | 89 | 257 | (15) | (15) | (15) | (15) | (15) | (15) | 116 | 317 | (58) | (58) |
| Interest income | (52) | (137) | (75) | (75) | (75) | (75) | (75) | (75) | (258) | (338) | (298) | (298) |
| Investment income | 9 | 10 | 10 | 10 | 10 | 10 | 10 | 10 | 143 | 39 | 40 | 40 |
| Disposal of investment | 0 | 0 | 0 | 0 | 0 | 0 | 0 | 0 | 0 | 0 | 0 | 0 |
| Exchange gain | 0 | 0 | 0 | 0 | 0 | 0 | 0 | 0 | 0 | 0 | 0 | 0 |
| Other | 132 | 384 | 50 | 50 | 50 | 50 | 50 | 50 | 231 | 616 | 200 | 200 |
| Pre-tax income | 1,530 | 2,691 | 2,632 | 2,846 | 3,131 | 3,498 | 3,754 | 4,094 | 4,416 | 9,699 | 14,477 | 20,432 |
| Income tax | (198) | (305) | (289) | (375) | (405) | (385) | (413) | (540) | (524) | (1,168) | (1,742) | (2,458) |
| Minority interest | (174) | (257) | (257) | (257) | (257) | (257) | (257) | (257) | (558) | (944) | (1,027) | (1,027) |
| Net income | 1,158 | 2,129 | 2,085 | 2,215 | 2,469 | 2,856 | 3,085 | 3,298 | 3,334 | 7,587 | 11,708 | 16,947 |
| Adj.wtd.avg.shrs (mn) | 2,429 | 2,429 | 2,429 | 2,429 | 2,429 | 2,429 | 2,429 | 2,429 | 2,429 | 2,429 | 2,429 | 2,429 |
| EPS (RMB) | 0.48 | 0.88 | 0.86 | 0.91 | 1.02 | 1.18 | 1.27 | 1.36 | 1.37 | 3.12 | 4.82 | 6.98 |
| Fully diluted shares (mn) | 2,429 | 2,429 | 2,429 | 2,429 | 2,429 | 2,429 | 2,429 | 2,429 | 2,429 | 2,429 | 2,429 | 2,429 |
| Diluted EPS (RMB) | 0.48 | 0.88 | 0.86 | 0.91 | 1.02 | 1.18 | 1.27 | 1.36 | 1.37 | 3.12 | 4.82 | 6.98 |
| Margins (%) | ||||||||||||
| Gross Margin | 27.6 | 32.2 | 32.7 | 33.0 | 33.1 | 33.3 | 33.6 | 33.9 | 25.9 | 31.7 | 33.5 | 34.3 |
| Operating Margin | 17.7 | 22.4 | 22.0 | 22.1 | 22.4 | 22.8 | 22.9 | 23.0 | 15.1 | 21.3 | 22.8 | 23.6 |
| Pretax Margin | 18.8 | 24.7 | 21.9 | 22.0 | 22.3 | 22.7 | 22.8 | 22.9 | 15.5 | 22.1 | 22.7 | 23.5 |
| Net Margin | 14.2 | 19.6 | 17.3 | 17.1 | 17.6 | 18.6 | 18.8 | 18.5 | 11.7 | 17.2 | 18.4 | 19.5 |
| QoQ Growth (%) | ||||||||||||
| Sales | 4 | 34 | 11 | 7 | 8 | 10 | 7 | 9 | ||||
| Gross Profit | 15 | 56 | 12 | 9 | 9 | 10 | 8 | 10 | ||||
| Operating Profit | 30 | 69 | 9 | 8 | 10 | 12 | 7 | 9 | ||||
| Pretax Profit | 29 | 76 | -2 | 8 | 10 | 12 | 7 | 9 | ||||
| Net Profit | 30 | 84 | -2 | 6 | 11 | 16 | 8 | 7 | ||||
| YoY Growth (%) | ||||||||||||
| Sales | 45 | 54 | 52 | 65 | 72 | 41 | 37 | 38 | 39 | 55 | 45 | 36 |
| Gross Profit | 66 | 88 | 79 | 118 | 107 | 46 | 41 | 42 | 69 | 89 | 53 | 40 |
| Operating Profit | 106 | 126 | 87 | 159 | 118 | 44 | 42 | 44 | 115 | 118 | 55 | 41 |
| Pretax Profit | 113 | 140 | 89 | 140 | 105 | 30 | 43 | 44 | 114 | 120 | 49 | 41 |
| Net Profit | 105 | 147 | 105 | 149 | 113 | 34 | 48 | 49 | 92 | 128 | 54 | 45 |
Source: Company Data, Morgan Stanley Research estimates.
M
Exhibit 93: Shengyi Tech: Consolidated Financial Summary
| Consolidated Income Statement | Consolidated Income Statement | Consolidated Income Statement | Consolidated Income Statement | Consolidated Income Statement | Consolidated Cash Flow Statement | Consolidated Cash Flow Statement | Consolidated Cash Flow Statement | Consolidated Cash Flow Statement | Consolidated Cash Flow Statement | Consolidated Cash Flow Statement |
|---|---|---|---|---|---|---|---|---|---|---|
| RMBmn (Year End Dec 31) | 2025A | 2026E | 2027E | 2028E | RMBmn (Year End Dec 31) | 2025A | 2026E | 2027E | 2028E | 2028E |
| Net sales | 28,431 | 43,983 | 63,694 | 86,867 | Operating Cashflow | 5,274 | 13,713 | 10,771 | 15,880 | 15,880 |
| COGS | (21,056) | (30,032) | (42,351) | (57,075) | Net Profits | 3,334 | 7,587 | 11,708 | 16,947 | 16,947 |
| Gross profit | 7,375 | 13,952 | 21,344 | 29,792 | Depreciation & Amort. | 0 | 0 | 0 | 0 | 0 |
| Operating expenses | (3,075) | (4,570) | (6,809) | (9,302) | Investment losses/(income) | (143) | (39) | (40) | (40) | (40) |
| Operating income | 4,300 | 9,382 | 14,535 | 20,490 | Working capital change | (798) | 5,353 | (798) | (911) | (911) |
| Non-operating income | 116 | 317 | (58) | (58) | Other adjustments | 2,880 | 812 | (99) | (116) | (116) |
| Interest income | (258) | (338) | (298) | (298) | Investing Cashflow | (2,933) | (432) | (626) | (854) | (854) |
| Investment income | 143 | 39 | 40 | 40 | Capex | (2,376) | (440) | (637) | (869) | (869) |
| Disposal of investment | - | - | - | - | Change of L/T investment | (616) | 0 | 0 | 0 | 0 |
| Exchange gain | - | - | - | - | Change of S/T investment | 0 | 0 | 0 | 0 | 0 |
| Other | 231 | 616 | 200 | 200 | Other adjustments | 54 | 0 | 0 | 0 | 0 |
| Pre-tax income | 4,416 | 9,699 | 14,477 | 20,432 | Financing Cashflow | (2,616) | (1,622) | (3,944) | (6,310) | (6,310) |
| Income tax | (524) | (1,168) | (1,742) | (2,458) | Increase in L/T debt | 136 | 0 | 0 | 0 | 0 |
| Minority interests | (558) | (944) | (1,027) | (1,027) | Increase in S/T debt | 0 | 0 | 0 | 0 | 0 |
| Net income | 3,334 | 7,587 | 11,708 | 16,947 | Issuance of stock | 0 | (102) | 0 | 0 | 0 |
| Adj. wtd. Avg. shrs (m) | 2,429 | 2,429 | 2,429 | 2,429 | Cash dividends | (2,727) | (2,000) | (4,552) | (7,025) | (7,025) |
| Reported EPS (Rmb) | 1.37 | 3.12 | 4.82 | 6.98 | Other adjustments | (25) | 480 | 608 | 715 | 715 |
| Diluted shrs (m) | 2,429 | 2,429 | 2,429 | 2,429 | FX adjustment | 2 | 0 | 0 | 0 | 0 |
| Diluted EPS (Rmb) | 1.37 | 3.12 | 4.82 | 6.98 | Net change in cash | (273) | 11,659 | 6,201 | 8,716 | 8,716 |
| Consolidated Balance Sheet | Consolidated Financial Ratios | Consolidated Financial Ratios | ||||||||
| RMBmn (Year End Dec 31) | 2025A | 2026E | 2027E | 2028E | 2025A | 2026E | 2027E | 2028E | 2028E | |
| Cash | 1,731 | 13,390 | 19,591 | 28,306 | Margins (%) | |||||
| Mkt securities | - | - | - | - | Gross margin | 25.9 | 31.7 | 33.5 | 34.3 | 34.3 |
| AR/NR | 10,839 | 4,838 | 7,006 | 9,555 | Operating margin | 15.1 | 21.3 | 22.8 | 23.6 | 23.6 |
| Inventory | 5,786 | 4,505 | 6,353 | 8,561 | Pretax margin | 15.5 | 22.1 | 22.7 | 23.5 | 23.5 |
| Others | 1,032 | 220 | 318 | 434 | Net margin | 11.7 | 17.2 | 18.4 | 19.5 | 19.5 |
| Current | 19,389 | 22,953 | 33,268 | 46,857 | YoY growth (%) | |||||
| Assets Long-term investments | 812 | 812 | 812 | 812 | Sales | 39.4 | 54.7 | 44.8 | 36.4 | 36.4 |
| Fixed assets | 11,083 | 11,515 | 12,142 | 12,996 | Operating profits | 115.2 | 118.2 | 54.9 | 41.0 | 41.0 |
| Other assets | 1,486 | 1,486 | 1,486 | 1,486 | Pretax profits | 113.6 | 119.6 | 49.3 | ||
| Net profits | 91.8 | 127.6 | 41.1 | 41.1 | ||||||
| Total Assets | 32,770 | 36,766 | 47,708 | 62,151 | 54.3 | |||||
| S/T borrowings | 2,305 | 2,305 | 2,305 | 2,305 | Others | |||||
| AP/NP | 7,222 | 4,204 | 5,929 | 7,991 | Cash dividend payout (%) | 60 | 60 | 60 | 60 | 60 |
| Other ST liabilities | 2,553 | 3,641 | 5,135 | 6,920 | Cash div (Rmb) | 0.8 | 1.9 | 2.9 | ||
| Total Current Liabilities | 12,080 | 10,151 | 13,369 | 17,216 | Yield (%) | 1 | 1 | 2 | 3 | 3 |
| L/T debt | 903 | 903 | 903 | 903 | Net Debt/Equity (%) | 8 | (42) | (52) | (61) | (61) |
| Other LT libilities | 877 | 1,357 | 1,965 | 2,679 | Liabilities/Equity (%) | 73 | 51 | 52 | 50 | 50 |
| Total Liabilities | 13,859 | 12,410 | 16,236 | 20,798 | Liabilities/Assets (%) | 42 | 34 | 34 | 33 | 33 |
| Common shares | 2,429 | 2,327 | 2,327 | 2,327 | ROAE (%) | 19 | 35 | 42 | 47 | 47 |
| Retained Earnings | 6,539 | 12,086 | 19,202 | 29,084 | ROAA (%) | 11 | 22 | 28 | 31 | 31 |
| Other SH' Equity | 9,942 | 9,942 | 9,942 | 9,942 | AR/NR Turnover (days) | 127 | 65 | 34 | ||
| Total Shareholders' Equity | 18,910 | 24,356 | 31,471 | 41,353 | Inventory Turnover (days) | 95 | 63 | 47 | 48 | 48 |
| Total Liab./SH's Equity | 32,770 | 36,766 | 47,708 | 62,151 | AP/NP Turnover (days) | 106 | 69 | 44 | 45 | 45 |
| Cash conversion cycle | 115 | 58 | 37 |
Source: Company Data, Morgan Stanley Research estimates.
M
Risk Reward - Shengyi Technology Co Ltd. (600183.SS) Risk Reward - Shengyi Technology Co Ltd. (600183.SS)
2026 a year of share gains for CCL business, but valuation keeps us EW
Rmb170.00 PRICE TARGET
Base case, derived from a residual income (RI) model. Key assumptions include a cost of equity of 7.3% (beta of 1.2, equity premium of 5% and risk-free rate of 1.3%), 10% mediumterm growth rate and 3% terminal growth rate.
Rmb179.85
| Consensus Price Target Distribution | Rmb74.00 | Rmb249.00 |
|---|---|---|
| MS PT | ||
| Source: Refinitiv, Morgan Stanley Research | Morgan Stanley Estimates Mean |
Source: Refinitiv, Morgan Stanley Research
BULL CASE
35x 2028e P/E
We assume a 80-90% revenue CAGR, 202528, with a 120-130% earnings CAGR over the same period. This means we are projecting operating margin to expand from 15.1% in 2025 to 30%+ by 2028.
Rmb245.00
BASE CASE
24x 2028e P/E
We forecast a 45% revenue CAGR, 2025-28, with a 65-70% operating profit CAGR over the same period. This means we are projecting operating margin to improve from 15.1% in 2025 to ~24% by 2028.
Rmb170.00
EQUAL-WEIGHT THESIS
- Shengyi continues to improve its CCL mix, while PCB revenue and UTR continue to rise. ▪
- However, we should always be mindful of the cost headwinds from price hikes of
- PCB/CCL raw materials such as copper, gold, glass cloth and resin.
- We expect Shengyi's CCL business to enjoy share gains in the AI server market.
▪
Adoption of PTFE resin in next-generation
CCL used in AI systems should be positive for Shengyi.
- Valuation looks fair, in our view, so we are EW.
BEAR CASE
14x 2028e P/E
We assume a 0-10% revenue CAGR, 202528, with only 5-15% earnings CAGR over the same period. This means we are projecting operating margin to increase slightly from 15.1% in 2025 to 16-17% by 2028.
Rmb95.00
M
Risk Reward - Shengyi Technology Co Ltd. (600183.SS)
KEY EARNINGS INPUTS
| Drivers | Dec 2025 | Dec 2026e | Dec 2027e | Dec 2028e |
|---|---|---|---|---|
| CCL sales y/y (%) (%) | 20 | 68 | 51 | 40 |
| PCB sales y/y (%) (%) | 104 | 33 | 36 | 29 |
| CCL GM (%) (%) | 23.9 | 31.7 | 34.3 | 35.2 |
| PCB GM (%) (%) | 28.6 | 31.3 | 31.3 | 31.8 |
INVESTMENT DRIVERS
- 5G base station deployment schedule
- Supplier share allocation
- China's data center demand
- PTFE
GLOBAL REVENUE EXPOSURE
Source: Morgan Stanley Research Estimate View explanation of regional hierarchies here
MS ALPHA MODELS
3/5 MOST
3 Month Horizon
Source: Refinitiv, FactSet, Morgan Stanley Research; 1 is the highest favored Quintile and 5 is the least favored Quintile
RISKS TO PT/RATING
RISKS TO UPSIDE
- Accelerated demand for 5G and data center CCL/PCB.
- Further share gains for 5G and data center CCL/PCB.
- Meaningful penetration into IC substrate CCL, benefiting from China's semiconductor localization.
RISKS TO DOWNSIDE
- Rising competition for 5G and data center CCL/PCB.
- Delay in 5G network deployment.
- Escalating US-China trade tensions.
OWNERSHIP POSITIONING
Inst. Owners, % Active
73.9%
Source: Refinitiv, Morgan Stanley Research
MS ESTIMATES VS. CONSENSUS
M
Copper-Clad Laminates (CCL) Primer
Introduction: What are copper-clad laminates (CCL)?
CCL is the major determinant foundation of all PCBs (printed circuit boards). It dictates signal integrity, reliability, manufacturability, and cost across all PCBs, ranging from consumer electronics to automotive to AI infrastructure hardware (server, storage, networking, etc). CCL is a composite.
In the hierarchy of electronics supply chain, CCL serves as the fundamental building block for printed circuit boards (PCBs). It is a composite material created by reinforcing a resin matrix with a filler (typically fiberglass cloth) and cladding it with electrolytic copper foil on one or both sides. CCL is a critical proxy for downstream demand in high-growth sectors such as AI servers, 5G infrastructure and automotive electronics.
Core composition and manufacturing
The performance of a CCL is dictated by its three primary components:
- Copper foil: This is the conductive layer that is etched to create electrical pathways for signals and currents. The industry is shifting toward ultra-low-profile copper foils for high-speed or high-frequency CCLs to minimize signal loss (ie. HVLP3+).
- Reinforcement materials: In most cases, electronic-grade fiberglass cloth serves as the reinforcement material in a CCL, which provides mechanical strength and dimensional stability.
- Resin system: This is the "glue" of the laminate and mainly where the CCL suppliers differentiate from each other. In some high-speed applications, standard FR-4 (epoxy) is replaced by specialized resins like polytetrafluoroethylene (PTFE) or polyphenylene ether (PPE) to achieve lower dielectric constant (Dk) and dissipation factor (Df).
RESIN SYSTEM
Insulation layer to determine
-Heat resistance
-Dimensional stability
-Low CTE
-Low Dk, Df
Сашал. ПололкІ
COPPER FOIL
M
Exhibit 94: Cross-section of a CCL
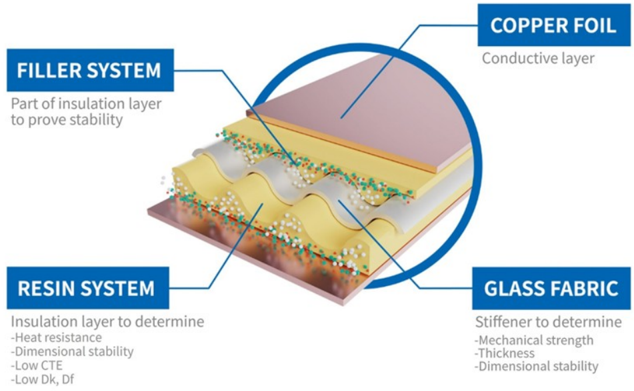
Source: Doosan.
CCL powerhouses: Who's leading the market?
There are three key specifications that determine a CCL supplier's tier in the supply chain:
- Dielectric constant (Dk) measures the ability of the material to store electrical energy. Lower Dk allows for faster signal transmission.
- Dissipation factor (Df) represents the energy "lost" as heat. For AI and highfrequency applications, ultra-low loss materials, which have very low Df, are the common standard and command higher ASPs.
- Glass transition temperature (Tg) is the temperature at which the material shifts from a rigid to a rubbery state. High-Tg materials are essential for reliability in heat-intensive environments like within servers.
The global CCL market is led by KB Laminates and Shengyi Technology in China; Elite Materials (EMC) , Nan Ya , ITEQ , TUC , and Chang Chun in Taiwan; Panasonic in Japan; Doosan in Korea; and Isola in the US. KB Laminates and Shengyi together account for roughly one-third of global CCL capacity, but both remain heavily weighted toward conventional grade CCL. We estimate that less than 5% of KB Laminates' capacity is allocated to M6+ products, compared with approximately 5-10% for Shengyi.
In high-speed CCL, EMC , TUC , and Doosan have gained share from Panasonic in recent years. The shift began in servers and high-end networking around 2020 and accelerated from 2023 as these suppliers secured early qualifications for AI-related reference designs. We estimate that EMC, TUC, Doosan, and Panasonic each allocate more than 50% of their capacity to M6+ grades.
M
Exhibit 95: Global CCL suppliers' market share by capacity (2026E)
Source: Company data, Morgan Stanley Research estimates.
Exhibit 96: Global CCL suppliers' market share by capacity (2023-2028E)
Global CCL Capacity (M Sheets/Month)
Source: Company data, Morgan Stanley Research estimates.
Why higher-grade CCL is disproportionately harder to produce
Advancing CCL performance is not a matter of upgrading a single input - it requires simultaneously re-engineering copper foil, resin, and glass fiber, each of which becomes progressively harder to produce and integrate as electrical requirements tighten.
Resin - two competing requirements in one material system. As copper foil surfaces are smoothed to reduce signal loss, resin formulation must solve two problems at once rather than one. Lower Dk/Df increasingly requires low-polarity resin chemistries, but the same low polarity that improves electrical performance also reduces the resin's natural ability to bond to copper and glass. With the mechanical grip previously provided by rough foil
Three constituent materials in glass-reinforced CCLs
Copper foil, glass reinforcement, and the cured resin system work together to determine laminate performance.
Material interfaces and the lamination/cure process are equally important.
M
• High conductivity and tight thickness tolerance:
• High tensile strength and modulus:
Delivers efficient current carrying capability and consistent electrical performance.
• Optimized surface profile:
Balances reliable resin adhesion with low high-frequency conductor loss.
• Adequate tensile strength and elongation:
Supports handling, processing, and resistance to mechanical stress.
• Heat-, chemical-, and oxidation-resistant surface treatment: Promotes strong, durable
adhesion and long-term reliability.
Provides mechanical strength and rigidity.
• Controlled glass style, weave, and areal weight:
Supports consistent thickness, flatness, and impedance control.
• Consistent dielectric properties:
Low-Dk glass may be selected where required
• Low in-plane CTE and good resin wet-out:
Restrains expansion, reduces warpage, and promotes uniform impregnation and bonding.
construction under heat and pressure.
including the resin content, glass style, copper profile, interfaces, and cure conditions.
Copper-resin adhesion
Glass-resin wet-out depends on surface treatment,
resin chemistry, and cure.
ensures void-free impregnation and consistent properties.
no longer available, adhesion must be re-engineered from scratch - through coupling agents, functional end-groups, and in some cases metallic interlayers. Because these two requirements pull in opposite directions within the same formulation, qualifying a new resin/foil combination at HVLP3/HVLP4 level is an inherently slow, iterative process.
electrical performance, reliability, and safety.
Glass fiber - trading a well-understood material for a harder one. The same dynamic applies to glass fiber reinforcement. Lowering Dk/Df means moving away from E-glass a chemically well-behaved, decades-optimized material - toward compositions that are either harder to melt and draw into fiber consistently (NE-/NER-glass) or harder to handle without breakage (quartz/Q-glass). In both cases, the sizing treatment that bonds glass to resin must also be redeveloped rather than carried over from lower grades.
Lamination - tighter process windows, less margin for error. These upstream changes converge at the CCL manufacturer's lamination step. Bonding a low-adhesion foil to resin using the same temperature, pressure, and cure-time profile used for standard foil risks voids or delamination. Producers must instead adjust lamination profiles and use resin systems specifically formulated for compatibility with low-profile foil - reinforcing why advancing an M-grade tier requires changing resin, foil, and glass together, rather than substituting a single component.
Net effect, structurally lower yields and a narrower supplier base. The cumulative result of these compounding constraints is lower production yields, longer and more iterative qualification cycles, and a small pool of suppliers capable of meeting spec reliably at scale. This explains both the substantial cost premium commanded by higher-grade CCL and the persistent lag between capacity additions and demand: the constraint is not simply building more production lines, but building lines capable of consistently meeting a materially tighter specification.
Exhibit 97: Three constituent materials in glass-reinforced CCL
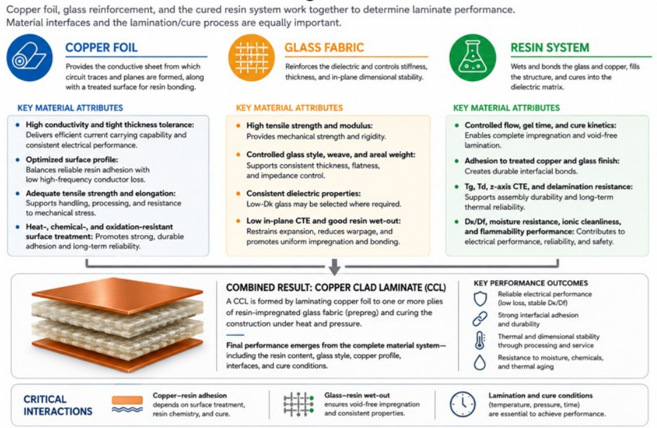
Source: Morgan Stanley Research.
CRITICAL
INTERACTIONS
M
Exhibit 98: PCB bill of materials (BoM) analysis
Source: Morgan Stanley Research.
Exhibit 99: CCL bill of materials (BoM) analysis
Source: Morgan Stanley Research.
The high bar for CCL qualification
Qualification for high-grade CCL, typically M7 and above, can take 12 to 18 months with major customers such as Nvidia, AWS, Google, and Meta. The process is demanding because it evaluates more than whether the laminate meets its datasheet specifications. A supplier's internal quality control typically measures properties such as Dk/Df, peel strength, and Tg on flat coupons from a controlled sample batch. Customer qualification, by contrast, tests the material after it has been drilled, plated, laminated, and built into the customer's actual board design using the designated PCB fabricator's process. Performance must also remain consistent across multiple production lots, rather than a single optimized sample.
This distinction matters because signal integrity and reliability in a finished board can differ materially from what flat-laminate testing suggests. Via-stub reflections, glassweave skew on the actual trace geometry, and voiding caused by narrow lamination windows may only emerge during board-level testing. Customers also apply tighter, application-specific acceptance criteria than standard industry specifications, reflecting the high cost of a field failure in an AI server.
CCL capacity is fungible, not equivalent
CCL capacity is fungible mainly because the manufacturing process is essentially grade-agnostic. Whatever the grade, you are doing the same three things:
- impregnating woven glass cloth with resin on a treater to make prepreg,
- stacking that prepreg with copper foil, and curing the stack under heat and pressure in a lamination press,
- then trimming and inspecting.
A standard FR-4 line and a low-loss line are the same machines in the same sequence. What differs is the recipe , not the architecture.
That means switching grades is closer to a bill-of-materials swap than a capital project . You change the resin system (epoxy for FR-4, PPE/PPO or hydrocarbon blends for low-
M
loss, higher-Tg or halogen-free chemistries for others), the glass cloth (E-glass versus lowDk NE- or Q-glass), and the copper foil (standard versus reverse-treat or HVLP/ULP for high-frequency loss budgets). You also retune press profiles, cure temperature, and vacuum. All of that lives in the process recipe and the purchasing order book, which is why CCL suppliers can and do reallocate lines toward whatever grade is earning the best profit.
The fungibility is asymmetric, though, and this matters. A line qualified for high-end material can trivially drop down and run commodity FR-4, despite it being over-qualified for the job. However, the reverse is not as straightforward. Upgrading a commodity line often requires better vacuum lamination, tighter thickness and resin-content control, cleaner handling to avoid particulate defects, and frequently a dedicated treater to prevent resin cross-contamination. So capacity flows downhill freely, and requires capex and time going uphill.
The most important consequence for output is that fungible does not mean equivalent. High-end grades consume more line time per unit of area: longer and hotter press cycles, thinner cores that mean more panels for the same copper area, more rigorous AOI and electrical testing, and materially lower first-pass yield during ramp. The same physical asset therefore produces meaningfully fewer square meters per month when it is running ultra-low-loss material than when it is running consumer FR-4 , the penalty is often on the order of tens of percent rather than a rounding error.
Layered on top is a commercial friction that is slower than the engineering one. CCL is qualified into an OEM's approved-vendor list at the level of a specific grade produced on a specific line at a specific site, with reliability testing behind it. Requalifying a line typically takes quarters, not weeks, and PCB fabricators themselves have to requalify their own process on the new laminate. So the theoretical swing capacity in an industry model is real but arrives with a lag, and it arrives unevenly across customers.
Fungibility at the CCL step also does not fix a bottleneck sitting upstream of it. The binding constraints in a high-end cycle are usually low-Dk glass cloth, HVLP copper foil, and specialty resin, inputs with concentrated supply, long qualification cycles, and 12- to 24-month capacity lead times. A producer can reallocate every press it owns toward highend product and still be capped by how much low-Dk cloth it can source. Adding CCL capacity into that situation raises utilization risk without raising effective supply.
Putting it altogether: Because capacity is fungible, a demand pull in one grade does not sit contained within that grade, it propagates. Reallocation toward high-end material shrinks industry area output measured in square meters while expanding revenue and gross-profit capacity, since price per square meter for advanced grades runs multiples of commodity. It simultaneously crowds out lower grades, which is why tightness that originates in AI server boards shows up as lead-time extension and price increases in unrelated end markets like automotive and consumer PCB. From a modeling perspective, area-based nameplate capacity can overstate effective supply during a product-mix shift. Press-hours, or area-equivalent capacity adjusted for grade-specific cycle times and yields, provide a better measure, although these inputs are company-specific and generally confidential.
Differences and similarities with this cycle vs. 2020-2022
M
The major differences
Structural versus pull-forward demand: AI infrastructure is a multi-year investment cycle; pandemic demand was driven by temporary work-from-home and consumerelectronics purchases.
This cycle is narrow and content-led, not broad and anonymous. 2021 was every consumer device shipping at once, reaching CCL through two layers of distributor and PCB inventory. This comes from a concentrated handful of hyperscalers and accelerator roadmaps that specify the grade directly: far better visibility, far worse concentration.
Capacity only counts if it is qualified. In 2021 any line relieved the shortage. Now it has to be a qualified position at grade (M8, M8.5, M9) with a 12-18 month qualification cycle, so the 2021 response of adding standard capacity does nothing for the tight part of the market.
The constraint sits further upstream and clears more slowly. Copper, resin and E-glass were tight in 2021 and cleared inside roughly 18 months. Low-Dk and HVLP foil are nearmonopoly inputs with new capacity in 2H27 at the earliest, behind CCL equipment on twoyear lead times.
Margins are dispersing rather than rising together. The pandemic lifted everyone's utilization. Profitability now turns on qualified mix and glass fabric allocation, which makes this a stock selection cycle rather than a sector one.
The similarities
Demand is again outrunning available supply in the most constrained product categories.
Strong demand visibility encourages capacity expansion by both CCL producers and upstream material suppliers.
Capacity takes time to respond; tightness is cascading into grades unrelated to the driver. Standard FR-4 inflated on generic input shortages then and is being squeezed by AI allocation now. Non-driver end markets pay for it, and that slice of the price gain reversed first last time.
Higher-end suppliers benefit disproportionately through better product mix, utilization and margins.
If it breaks, it breaks the same way. The cycle could ultimately overshoot, with aggressive investment and inventory building creating future oversupply and price pressure. A platform slip or de-spec would unwind through the 2H22 route: standard grades destock first, prices follow inputs down, and CCL feels it before the rest of the chain because it sits upstream of the PCB.
Exul 10u cupper lull by prouuutlun probess allu applicallull
Production process
Raw Material
• application → end product
Production
Process
Foil Type
Application & Board
M
Foil
Copper Foil
- Rigid PCB
Copper Foil Primer
RA
(Rolled & Annealed)
Rolled Copper Foil
FCCL (Flexible CCL)
→ Flexible PCB (FPC) |
Home appliance
Computer
Computer peripherals
Medical
Industrial|
Server
Vehicle electronics
Satellite
Communication (smartphones) |
What is electro-deposited copper foil?
Electro-deposited (ED), or electrolytic, copper foils are mainly used in lithium batteries (battery foil) and PCB/CCLs (circuit foil). The production process of electrolytic copper foil primarily involves dissolving copper into an electrolyte, depositing it as a very thin continuous sheet on a rotating drum, peeling it from the drum, surface-treat it and slit it to the customer's required width. The basic process platforms for circuit foil and battery foil are similar, but the downstream requirements are pretty different.
- Battery foil is coated with anode material and transports electrons during charging and discharging.
- Circuit foil is laminated to resin and glass fabric to make CCL, and then etched into conductive tracks for signals and currents.
Therefore, a circuit foil producer optimizes thickness, surface profile, adhesion and signal transmission. For high-speed/high-frequency applications, the focus shifts from simple conductivity to signal integrity and adhesion physics. As signal frequencies increase, the "skin effect" ( Exhibit 101 ) becomes the dominant challenge. At high frequencies, electrons no longer 'flow' through the center of copper but instead crowd toward the surface, which means the signal has to travel a longer, jagged physical distance if the surface is rough (resembling a mountain range under microscope), leading to significant signal loss.
Exhibit 100: Copper foil by production process and application
Source: Morgan Stanley Research.
→ foil type
End Product
Standard foil
M
More loss
Core carries almost no current
Low-profile foil
Smoothed surface, near-flat
Core carries almost no current
Current rides a thin skin along the surface, so rough means a longer trip
Exhibit 101: Copper foil skin effect
Source: Morgan Stanley Research.
The PCB/CCL BoM typically specifies one of the following grades based on the required profile, which is usually surface roughness, measured as Rz.
- HTE (High Temperature Elongation): The standard product. Good for 1-2L PCBs but too rough for high-speed PCBs/CCLs.
- RTF (Reversed Treated Foil): The rough side is flipped to face the bonding layer, while the signal-carrying side is smoother. This is a cost-effective middle ground, but the surface roughness typically cannot meet the requirements of very highspeed PCBs/CCLs.
- VLP (Very Low Profile): This is significantly smoother than the previous two but also more expensive.
- HVLP (Hyper Very Low Profile): This is the standard for AI server and high-end networking PCBs/CCLs, enabling sharp reduction of signal attenuation.
Key Technical Trade-offs: Rough-surfaced copper anchors into the resin system like a hook. When you move to HVLP copper foil, the physical bond weakens, making adhesion difficult. CCL suppliers must use chemical treatments to ensure the copper does not delaminate during soldering; the mastery of such treatment is a key testament to a CCL supplier's manufacturing capability.
Fast
Transmission speed
Slow
Low
High
?
M
HVLP3
HVLP2
HVLP
RTF
HTE
Exhibit 102: The hierarchy of circuit foil
Source: Morgan Stanley Research. Note: HTE stands for high-temperature-elongation; RTF stands for reverse-treated-foil; HVLP stands for hyper-very-low-profile. The surface roughness is measured as Rz.
M
Shareholding Structures and Management Profiles
Elite Material (2383.TW)
Exhibit 103: EMC: Major shareholders
| Name | Shareholding% |
|---|---|
| Yu Chang Investment Co., Ltd. (Representative: WuSu-Yueh) | 7.11% |
| NewLabor Pension Fund | 6.31% |
| Silver Top Investment Co., Ltd. (Representative: Si Run-Hong) | 4.81% |
| Yu Sheng Investment Co., Ltd. (Representative: WuSu-Yueh) | 3.61% |
| Chunghwa Post Co., Ltd. | 2.01% |
| Citibank N.A., as Custodian for Government of Singapore-GOS-EFMC | 1.61% |
| Yuanta Taiwan Top 50 ETF | 1.53% |
| Citibank (Taiwan) Limited, as Custodian for Norges Bank | 1.49% |
| Dong Ding-Yu | 1.47% |
| Labor Pension Fund (Old Scheme) | 1.44% |
Source: Company data, Morgan Stanley Research. Note: As of March 2026.
Exhibit 104: EMC: Management profiles
| Name | Title | Education / Past work experience | Current Positions in other companies |
|---|---|---|---|
| Dong Ding-Yu | Chairman | Ph.D. in Engineering, Stanford University, USA Assistant Professor, San Jose State University, USA | Department Stores Co., Ltd. Independent Director Hsin Ya Construction &Development Co., Ltd. Director |
| Yu Chang Investment Co., Ltd. Representative: Tsai Fei-Liang | Vice Chairman | Master in Chemical Engineering, National Tsing Hua University President, Taiwan Union Technology Corp. | None |
| Yu Chang Investment Co., Ltd. Representative: Lee Wen-Shiung | Director | Bachelor of Chemical Engineering, Tamkang University Director, Unimicron Corporation President, Isola Asia Pacific (Taiwan) Inc. | Consultant, Taiwan Printed Circuit Association |
| Hsieh MonChang | Director | Master in International Affairs, Columbia University Chairman, Food Industry Research and Development Institute Director, The Eisenhower Exchange Fellowships, Inc. | Chairman, Synmax Biochemical Co., Ltd. Vice Chairman, Royal Chef Co., Ltd. |
| Shen Bing | Director | MBA, Harvard University Financial Analyst, World Bank Chief Investment Officer, International Bank Corp. Executive Director, Morgan Stanley &Co. Vice President, China Development Industrial Bank President, CDIB Partners Investment Holding Corporation | Director, OUCCorporation Director,ECOVE |
| Cheng Duen Chian | Independent Director | Director, Appier Holdings Inc. Independent Director, Ta Ya Electric Wire &Cable Co., Ltd. Director, LuxNet Corp Chairman, Clientron Corp. President, UMCCapital Corporation Executive Director, Morgan Stanley Asia Ltd. Executive Director, Goldman Sachs Asia LLC | Chairman, TGVest Capital Co., Ltd. Chairman, TriKnight Capital Corporation Vice Chairman, LuxNet Corp. |
| Chen Hsi-Chia | Independent Director | Doctor of Law, National Taiwan University Doctor of Law, Peking University Member, Standing Committee of the ICC International Centre forADR (International Chamber of Commerce) Chairperson, Taiwan Branch of the Chartered Institute of Arbitrators (CIArb) Partner, Joint Head of China Offices, and Member of Asia Pacific Operations Committee at Pinsent Masons LLP Independent Director, Asia NewEnergy (Cayman) Co., Ltd. | Managing Partner, Jong Tsai International Law Firm Member, International Court of Arbitration, International Chamber of Commerce(ICC) Chairperson, Taiwan Chapter of ARIAS Asia (Asia Reinsurance and Insurance Arbitration Society) Member, Advisory Committee, Japan Commercial Arbitration Association (JCAA) Chairperson,ADR Committee, National Bar Association |
| Chern Kai-Yuan | Independent Director | Chief Secretary, Financial Supervisory Commission, F.S.C Deputy Director General, Financial Examination Bureau, F.S.C | Adjunct Associate Professor, National Chengchi University Vice President, Taiwan Insurance Law Association. |
Source: Company data, Morgan Stanley Research.
M
Exhibit 105: EMC: FINI holdings and share price
Source: TEJ, Morgan Stanley Research.
TUC (6274.TWO)
Exhibit 106: TUC: Major shareholders
| Name | Shareholding% |
|---|---|
| NewLabor Retirement Fund | 6.80% |
| Hsin, Chung-Herng | 3.80% |
| Desheng Technology DamFundSpecial Account | 3.40% |
| Deutsche Bank Taipei Branch entrusted with the custody of small amounts of the world | 3.10% |
| Ding Hing Fung Corporation (Representative: Hsieh, Su-E) | 2.80% |
| Hsin, Chung-Tao | 2.60% |
| HSBCBankCustody for Goldman Sachs International Company Investment Account | 2.00% |
| ChangYuHung Co., Ltd. (Representative: Xu Yingjuan) | 1.90% |
| Old System Labor Retirement Fund | 1.90% |
| Public Servants Retirement Pension Fund Management Committee | 1.70% |
Source: Company data, Morgan Stanley Research. Note: As of March 2026.
Exhibit 107: TUC: Management profiles
| Name | Title | Education / Past work experience | Current Positions in other companies |
|---|---|---|---|
| Hsin, Chung-Herng | Chairman | Department of Electrical Engineering, National Taiwan University Doctor of Science in Electrical Engineering, Drexel University, USA | None |
| Hsin, Yao-Hung | Director | Master in Electrical Engineering / Business Administration, University of California, USA Senior Software Engineer, Celera Genomics | President / Director, Shing Nan Bus Co., Ltd. |
| Hsin, Yao-Chi | Director | Department of Medicine, University of Missouri, USA Master of Business Administration, University of California, USA | Chief Strategy Officer of TUC |
| Yeh, Shu-Wen | Independent Director | Bachelor, Department of Accounting, National Taiwan University Master of Business Administration, San Jose State University, USA CPA of the Republic of China | CPA, C&SCertified Public Accountant Firm Director, Alliance Advisory Ltd. Director, Y&Y Alliance Advisory Ltd. |
| Chin-Tay Shih | Independent Director | Master of Science in Management, Stanford University Ph.D. in Electrical Engineering, Princeton University, USA 1994-2003 President, Industrial Technology Research Institute 2004-2010 Dean, College of Technology Management, National Tsing Hua University 2009-2012 Chairman, Institute for Information Industry | Independent Director, Vanguard International Semiconductor Corporation Independent Director, Sercomm Corporation Independent Director, FocalTech Systems Co., Ltd. Director, Qualife System Technology Corp. Supervisor, Tsing Entrepreneurship Consulting Co., Ltd. |
| Gene Su | Independent Director | Bachelor of Electrical Engineering, Massachusetts Institute of Technology, USA Master of Electrical Engineering, Cornell University, USA J.D., Santa Clara University, USA Attorney, State Bar of California (since 2001) United States Patent and Trademark Office licensed attorney (since 1999) Jones Day Intellectual Property Department, Quanta Computer Inc. Senior Engineer and Legal Consultant, Intel | Founder/Attorney, Ren-Sheng International IP Management Ltd. |
| Chen, Cheng-Yi | Independent Director (Resigned 17 Dec 2025) | Ph.D. in High Polymer, UMass-Lowell, USA Jun 1996-Jun 1998 Visiting Professor, Department of Materials Science, Chulalongkorn University, Thailand | None |
2003-2009 Vice President of R&D Dept., ITEQ Corporation
Source: Company data, Morgan Stanley Research.
M
Exhibit 108: TUC: FINI holdings and share price
Source: TEJ, Morgan Stanley Research.
Co-Tech (8358.TWO)
Exhibit 109: Co-Tech: Major shareholders
| Name | Shareholding% |
|---|---|
| Raymond Soong | 5.47% |
| Dasong Investment Co., Ltd. (Representative: Raymond Soong) | 4.95% |
| Hua Eng Wire &Cable Co., Ltd. (Representative: Liu Hsiu-Mei) | 3.09% |
| Yang GuanHeng | 2.12% |
| HSBCBank(Taiwan) Limited in Custody for Morgan Stanley &Co. International Plc Investment Account | 1.91% |
| Chen Tsu-Yuan | 1.82% |
| HSBCin Custody for Point72 Associates, LLC Account | 1.69% |
| Citibank in Custody for Norges Bank Investment Account | 1.55% |
| JPMorgan Chase Bank in Custody for J.P. Morgan Securities PLC Investment Account | 1.42% |
| Chan Chi-Che | 1.39% |
Source: Company data, Morgan Stanley Research. Note: As of March 2026.
M
Exhibit 110: Co-Tech: Management profiles
| Name | Title | Education / Past work experience | Current Positions in other companies |
|---|---|---|---|
| Lee Shih-Shen | Chairman and President | Bachelor of Business Administration, National Cheng Chi University | President, Shanghai Li-Yao Energy Technology Ltd. President, Network Power Business, Delta Greentech (China) Co., Ltd. Vice President of Networking& Access Business Unit, LITE-ON Technology Corp Vice President of Sales and Marketing, Delta Networks, Inc. (a subsidiary of Delta Electronics, Inc.) Chairman and President, Co-Tech Development Corp. |
| Raymond Soong | Director | Bachelor of Electronics Engineering, National Taipei University of Technology (previously Taipei Junior College of Engineering) Honorary Ph.D. in Management, National Taipei University of Technology Honorary Ph.D. in Management, National Chiao-Tung University | Founder, LITE-ON Technology Chairman, LITE-ON Group Founder, LITE-ON Taiwan Foundation Member of the Board of Councilors, Engineering College,USC ITRI Laureate Director: LITE-ON Technology, LITE-ON Taiwan Foundation |
| HuaEng Wire& Cable Co., Ltd. Representative: Liu Hsiu-Mei | Director | M.A. in Accounting, Long Island University,New York, USA | Director, HuaEng Wire& Cable Co., Ltd. Director, First Copper Technology Co., Ltd. Director, China Ecotek Corporation, Wafer Works Corporation and Bionime Corporation Supervisor, HuaHoEngineering Co., Ltd. Vice President of Management Department, HuaEng Wire& Cable Co., Ltd. |
| Tsai Hsung-Hsiung | Director | Ph.D. in Urban Planning, School of Architecture and Planning, Princeton University Master in Urban Planning, Massachusetts Institute of Technology Bachelor, Department of Law, National Taiwan University | CEO/Vice Chairman, National Policy Foundation Chairman, Council for Economic Planning and Development, Executive Yuan Minister, Environmental Protection Administration, Executive Yuan Independent Director, Taiwan On-Bright Electronics Corp. Independent Director, Kwong Lung Enterprise Co., Ltd. Director and President, Mao-Chia Co., Ltd. |
| Yu Ming-Chang | Director | Bachelor of Electronics Engineering, National Taipei University of Technology | Chairman, ThinFlex Corporation Independent Director, Lumax International Corporation Chairman and President, Ade Corporation |
| Soong Ming-Feng | Director | Bachelor of Electrical Engineering, University of Southern California EMBAProgram in International Business Management (Incomplete), National Taiwan University (NTU-Fudan EMBAProgram) | Special Assistant to the Chairman and Vice Chairman, LITE-ON Technology Corp. CEO, Smart Life and Applications Business Group, LITE-ON Technology Corp. President, LITE-ON Technology (Shanghai) CEO,New Mechanical Core Competency Business Group, LITE-ON Technology Corp. General Manager, Mechanical Core Competency Business Group, LITE-ON Technology Corp. General Manager, Networking& Communication Business Unit, LITE-ON Technology Corp. President, Zhong-Bao Transportation Limited Chairman and Chief Sustainability Officer, LITE-ON Technology Corp. Director: LITE-ON Singapore Pte. Ltd., LITE-ON China Holding Co. Ltd., LITE-ON |
| Liang Yann-Ping | Independent Director | Master of Science in Finance, The George Washington University, USA | Independent Director / Compensation& Audit Committee member, President Securities Corp. Assistant Professor-level Professional Technical Personnel, Dept. of Finance, Shih Hsin University Director, Office of Public Affairs, Shih Hsin University Chairperson, Dept. of Finance and Financial Management, MingDao University Adjunct Lecturer, Shih Hsin University VP, Asset Management Group, HuaNanSecurities Investment Trust / HuaNanFinancial Holdings VP, Discretionary Investment Management Dept., HuaNanSITC VP, Asset Management Dept., Futing SITE VP, Asset Management Dept., Polaris Securities Investment Trust Research Analyst, Dah Sun Securities Co., Ltd. Senior VP of Marketing Center, Elite Material Co., Ltd. Senior VP of Taiwan Plant, Elite Material Co., Ltd. |
| Wang Lii-Gang | Independent Director | Master of Science in Chemical Engineering, University of Nebraska-Lincoln, USA Bachelor of Science in Chemical Engineering, Chung Yuan Christian University, Taiwan | President of Marketing Zhongshan Plant, Elite Material Co., Ltd. VP, CCLand Masslam Business Units, Advance Materials Corporation VP, CCLDevelopment Headquarters, Achem OptoElectronic Corporation VP, Electronic Materials Business Unit, Achem OptoElectronic Corporation Manager / Senior Engineer / Senior Research Engineer, various Achem OptoElectronic units |
| HoChien-Lung | Independent Director | Master of Science in Microelectronic Engineering, University of Portland, USA Bachelor of Science in Electrical Engineering, University of Utah, USA | VP / Head of Thailand Plant Construction Team /GMof Thailand Plant, Taiwan Union Technology Corporation Group GMof Jiangxi Plant / GMSouthChina Region (Dongguan Humen, Guangzhou, Dongguan Huangjiang), ITEQ Corporation GMof Zhongshan Plant, Taiwan Union Technology Corporation MDCMKgbm(Dongguan), MDSuzhouKunshan Yuanmao Electronics,GMMagNCTech (Chongqing) Plant Construction Team, SYSTEX Corporation VP of System Product Operations (Huizhou Plant), Compeq Manufacturing Co., Ltd. GMof High-End Product Operations (Guangzhou Plant), Vero Veria Corporation VP Greater China Marketing& Sales / President Nanjing Plant / President Kunshan Zhangpu Town Plant Construction Team / GMKaiping Plant / VP Quality Assurance (HK HO), Elec& Eltek Group Multiple positions atCompeq Manufacturing (Salt Lake City Plant, USA) |
| Tseng Huan-Hsiung | Independent Director | Executive Master of Business Administration, National Yang Ming Chiao Tung University | CEO, LITE-ON IT Corporation CEO, Optoelectronics Business Group, LITE-ON Technology Corp. Chairman and CEO, Solid State Storage Technology Corp. |
Source: Company data, Morgan Stanley Research.
Exhibit 111: Co-Tech: FINI holdings and share price
Source: TEJ, Morgan Stanley Research.
M
Kingboard Laminates (1888.HK)
Exhibit 112: Kingboard Laminates: Major shareholders
| Name | Shareholding% |
|---|---|
| Hallgain Management Limited ('Hallgain') (interest of controlled corporations) | 71.10% |
| Kingboard Holdings Limited ('KHL', HKEX: 0148) (beneficial owner 3.75%; interest of controlled corporations 67.35%) | 71.10% |
| Mr. Cheung Kwok Wa(Chairman; beneficial owner / interest of spouse) | 0.34% |
| Mr. LamKaPo(Executive Director; beneficial owner) | 0.14% |
| Mr. Cheung Kwok Ping (Executive Director; beneficial owner) | 0.11% |
| Mr. Cheung Kwok Keung (Managing Director; beneficial owner) | 0.11% |
Source: Company data, Morgan Stanley Research. Note: As of March 2026.
M
Exhibit 113: Kingboard Laminates: Management profiles
| Name | Title | Education / Past work experience Joined Kingboard Holdings Limited ('KHL', HKEX: 0148), the Group's | Current Positions in othercompanies |
|---|---|---|---|
| Mr.CheungKwokWa | Chairman andExecutive Director | ultimate holding company, in 1988 Over 37 years' experience in the marketing of a wide range of industrial products Responsible for the overall strategic planning of the Group andsets its general direction andgoals Appointedan executive Director in July 2006 Brother of Mr.Cheung Kwok Keung andMr.Cheung Kwok Ping; uncle of Mr. | Director, Hallgain ManagementLimited Director, Kingboard Investments Limited |
| Mr.Cheung Kwok Keung | Managing Director and Executive Director | JoinedKHL in 1991 Over 34 years' experience in the laminate industry Responsible for the overall implementation of the strategic plans andgoals of the Group Appointedan executive Director in July 2006 Brother of Mr.Cheung Kwok WaandMr.Cheung Kwok Ping; uncle of Mr. Cheung Ka Ho | None disclosed |
| Mr.Cheung Kwok Ping | Executive Director | JoinedKHL in 1988 Over 37 years' experience in marketing Mainly responsible for the Group's marketing operations General manager of the laminate factories in Fogang andShaoguan, the PRC Appointedan executive Director inMay 2006 Brother of Mr.Cheung Kwok WaandMr.Cheung Kwok Keung; uncle of Mr. Cheung Ka Ho | Director, Hallgain ManagementLimited Director, Kingboard Investments Limited |
| Mr.LamKaPo | Executive Director | Co-founder of KHL Over 37 years' experience in the sales anddistribution of laminates Appointedan executive Director in November 2006 | Director, Hallgain ManagementLimited Director, Jamplan (BVI) Limited |
| Mr.Cheung Ka Ho | Executive Director | JoinedKHL in 2004 Involved in laminate marketing operations for the southern region of China General manager of the glass epoxy laminate factory in Thailand Appointedan executive Director in July 2006 Nephewof Mr.Cheung Kwok Wa,Mr.Cheung Kwok Keung andMr.Cheung Kwok Ping | None disclosed |
| Mr. Zhou Pei Feng | Executive Director | Bachelor's Degree in Mechanical Engineering, Chongqing University Master's Degree in Material Processing Engineering, Jilin Industrial University (now Jilin University) JoinedKHL in 1999 General manager of four glass epoxy laminate facilities in Shenzhen, Fogang, Jiangmen andJiangyin, the PRC Appointedan executive Director in November 2006 | None disclosed |
| Mr. Lo Ka Leong | Non-Executive Director | Bachelor's Degree in Professional Accountancy, The Chinese University of Hong Kong Fellowmember,Hong Kong Institute of Certified Public Accountants Formerly an accountant at an international accounting firm JoinedKHL inMay 1999; in charge of KHL'scompany secretarial work Appointed a non-executive Director in July 2006 Member of the audit committee | None disclosed |
| Mr. Zhang Lu Fu | Independent Non- Executive Director | Master's Degree in Philosophy, Beijing Normal University; research associate thereat Workedfor the Chinese government from 1987, including the XinHua NewsAgency branch network inHong Kong (Liaison Office of the Central People's Government) Since 2000, servedHong Kong listed companies andcharitable organisations as chief representative / consultant for Chinese affairs, chief secretary for Chinese affairs andchief executive Part-time professor,Hong Kong Academy of ManagementandHong Kong Financial Services Institute (from 2011) Former independent non-executive director, CTEnvironmental Group Limited (to August 2020) | Independent non-executive director, Sino Biopharmaceutical Limited (HKEX Main Board), since April 2015 Director-general, Friends of Hong Kong Association, since 2008 Member, 4th Shenzhen Committee of the CPPCC,since 2008 Council member,China Overseas Friendship Association, since 2013 Council member,Shenzhen Overseas Friendship Association and Guangdong Overseas Friendship Association, since 2015 |
| Mr. Kung, Peter | Independent Non- Executive Director | Graduated from the University of Liverpool in 1984 Associate Member, Institute of Chartered Accountants in Englandand Wales; Fellow,Hong Kong Institute of Certified Public Accountants; Fellow, Taxation Institute of Hong Kong (President, 2007-2009) KPMG:partner (1997),Headof China Tax for Hong Kong andSouthern China (2001), Senior Partner - Shenzhen (2006), Senior Partner - Southern China (2010), Vice Chairman of KPMGChina (2013-2017), Senior Advisor toKPMGChina (2018-2019) Appointedan independent non-executive Director on 7 June 2021 Chairman of the audit committee;member of the nomination and remuneration committees | ORIX Asia Limited, since 2020 Boardmember andchairman of the audit committee, eBRAM,since 2021 Independent non-executive director andaudit committee member, SmarTone Telecommunications Holdings Limited, since March 2022 Independent non-executive director andchairman of the audit committee, CCBInternational (Holdings) Limited, since June 2023 Council Member, The Chinese University of Hong Kong (CUHK), since December 2023 Director,CUHKMedical Centre Limited, since August 2024; chairman of the audit andrisk managementcommittee ofbothCUHKandCUHK Medical Centre Limited Vice President, Council for the Promotion of Guangdong-Hong Kong- |
| Mr.HoKwok Ming | Independent Non- Executive Director | Executive MBA, Kellogg School of ManagementatNorthwestern University andThe Hong Kong University of Science andTechnology, 2004 Bachelor's Degree in Business Administration, The Chinese University of Hong Kong, 1987 More than 34 years' experience in corporate andcommercial banking Standard Chartered Bank for over 24 years (1991-1994 and2000-2021): Managing Director, Co-Headof Client Coverage - Corporate, Commercial andInstitutional Banking,Hong Kong (2020-2021); Managing Director, Regional Headof Commercial Banking - Greater China andNorth Asia (2015-2020); Managing Director,Headof Local Corporatesand International Corporates (2012-2014) Appointedan independent non-executive Director on 1 January 2022 Chairman of the nomination committee;member of the audit and remuneration committees | Vice-Chairman, Crystal Climate Charity Foundation, since November 2022 |
| Ms. Yung Hoi Yan | Independent Non- Executive Director | Barrister-at-Law; Justice of the Peace Member of the Legislative Council of the Hong Kong SAR for theNew Territories East constituency (2016-2021); re-elected in 2021 representing the Election Committee constituency Appointedan independent non-executive Director on31December 2025 Chairman of the remuneration committee;member of the audit and nomination committees | Community Relations Director, China Resources Building Materials Technology Holdings Limited (HKEX: 1313), since December 2022 Practising Greater Bay Area Lawyer, King &WoodMallesons(Guangzhou), since 2022 Independent non-executive director, chairman of the nomination committee andmember of the audit andremuneration committees,Pan Asia Data Holdings Inc. (HKEX: 1561), since 27 June 2024 Member of the board of directors,Hong Kong Science andTechnology Parks Corporation, since 1 July 2024 Member, Committee on Innovation, Technology andIndustry Development Member, Shanghai Municipal Committee of theCPPCC Vice-president, NewPeople's Party |
| Mr.Chang GuoQiang | Senior Management- General Manager, Glass Fabric Operations | Bachelor's Degree in Textiles,HunanChang Sha University Over 16 years' experience in the glass fabric industry prior to joining KHL JoinedKHL in 2002 General manager of the glass fabric factories in Qingyuan, Lianzhou and Shaoguan, the PRC | None disclosed |
| Ms.Ng MeiKamKennis | Senior Management- Company Secretary | Bachelor's Degree in Accountancy, University of Sunderland, United Kingdom Fellowmember,The Association of Chartered Certified Accountants; member,Hong Kong Institute of Certified Public Accountants Formerly financial controller of Elec &Eltek International Holdings Limited Over 31 years' work experience in accounting Joined the Group in 2004 | None disclosed |
Source: Company data, Morgan Stanley Research.
M
Exhibit 114: KB Laminates' share price vs Southbound stake as a percentage of free float
Source: Wind, Morgan Stanley Research.
M
Risk Reward Reference links
-
View explanation of Options Probabilities methodology -
-
Options_Probabilities_Exhibit_Link.pdf
-
View descriptions of Risk Rewards Themes - RR_Themes_Exhibit_Link.pdf
-
View explanation of regional hierarchies - GEG_Exhibit_Link.pdf
-
View explanation of Theme/Exposure methodology -
-
ESG_Sustainable_Solutions_External_Link.pdf
-
View explanation of HERS methodology - ESG_HERS_External_Link.pdf
M
Disclosure Section
The information and opinions in Morgan Stanley Research were prepared or are disseminated by Morgan Stanley Asia Limited (which accepts the responsibility for its contents) and/or Morgan Stanley Asia (Singapore) Pte. (Registration number 199206298Z) and/or Morgan Stanley Asia (Singapore) Securities Pte Ltd (Registration number 200008434H), regulated by the Monetary Authority of Singapore (which accepts legal responsibility for its contents and should be contacted with respect to any matters arising from, or in connection with, Morgan Stanley Research), and/or Morgan Stanley Taiwan Limited and/or Morgan Stanley & Co International plc, Seoul Branch, and/or Morgan Stanley Australia Limited (A.B.N. 67 003 734 576, holder of Australian financial services license No. 233742, which accepts responsibility for its contents), and/or Morgan Stanley Wealth Management Australia Pty Ltd (A.B.N. 19 009 145 555, holder of Australian financial services license No. 240813, which accepts responsibility for its contents), and/or Morgan Stanley India Company Private Limited having Corporate Identification No (CIN) U22990MH1998PTC115305, regulated by the Securities and Exchange Board of India ('SEBI') and holder of licenses as a Research Analyst (SEBI Registration No. INH000001105); Stock Broker (SEBI Stock Broker Registration No. INZ000244438), Merchant Banker (SEBI Registration No. INM000011203), and depository participant with National Securities Depository Limited (SEBI Registration No. IN-DP-NSDL-567-2021) having registered office at Altimus, Level 39 & 40, Pandurang Budhkar Marg, Worli, Mumbai 400018, India; Telephone no. +91-22-61181000; Compliance Officer Details: Mr. Tejarshi Hardas, Tel. No.: +91-22-61181000 or Email: tejarshi.hardas@morganstanley.com; Grievance officer details: Mr. Tejarshi Hardas, Tel. No.: +91-22-61181000 or Email: msic-compliance@morganstanley.com which accepts the responsibility for its contents and should be contacted with respect to any matters arising from, or in connection with, Morgan Stanley Research, and their affiliates (collectively, "Morgan Stanley"). Morgan Stanley India Company Private Limited (MSICPL) may use AI tools in providing research services. All recommendations contained herein are made by the duly qualified research analysts.
For important disclosures, stock price charts and equity rating histories regarding companies that are the subject of this report, please see the Morgan Stanley Research Disclosure Website at www.morganstanley.com/eqr/disclosures/webapp/generalresearch, or contact your investment representative or Morgan Stanley Research at 1585 Broadway, (Attention: Research Management), New York, NY, 10036 USA.
For valuation methodology and risks associated with any recommendation, rating or price target referenced in this research report, please contact the Client Support Team as follows: US/Canada +1 800 303-2495; Hong Kong +852 2848-5999; Latin America +1 718 754-5444 (U.S.); London +44 (0)20-7425-8169; Singapore +65 6834-6860; Sydney +61 (0)2-9770-1505; Tokyo +81 (0)3-6836-9000. Alternatively you may contact your investment representative or Morgan Stanley Research at 1585 Broadway, (Attention: Research Management), New York, NY 10036 USA.
Analyst Certification
The following analysts hereby certify that their views about the companies and their securities discussed in this report are accurately expressed and that they have not received and will not receive direct or indirect compensation in exchange for expressing specific recommendations or views in this report: Sota Harashima; Yoshihito Hasegawa; Howard Kao; Ryan Kim; Andy Meng, CFA; Shoji Sato; Yu Shirakawa; Tomonobu Tsunoyama; Ryoichi Watanabe; Kazuo Yoshikawa, CFA; Rachel L Zhang.
.
Global Research Conflict Management Policy
Morgan Stanley Research has been published in accordance with our conflict management policy, which is available at www.morganstanley.com/institutional/research/conflictpolicies. A Portuguese version of the policy can be found at www.morganstanley.com.br
Important Regulatory Disclosures on Subject Companies
The analyst or strategist (or a household member) identified below owns the following securities (or related derivatives): Yu Shirakawa - Resonac Holdings(common or preferred stock). As of August 31, 2026, Morgan Stanley beneficially owned 1% or more of a class of common equity securities of the following companies covered in Morgan Stanley Research: AAC Technologies Holdings, Accelink Technologies Co. Ltd., Acer Inc., AirTAC International, Auras Technology Co Ltd, Bizlink, Catcher Technology, Chenbro, Co-Tech Development Corp., Compal Electronics, Delta Electronics Inc., E Ink Holdings Inc., Elite Material Co., Eoptolink Technology Inc Ltd, Genius Electronic Optical Co. Ltd., Giga-Byte Technology Co. Ltd., Gold Circuit Electronics Ltd., Hiwin Technologies Corp., Ibiden, LandMark Optoelectronics Corporation, Largan Precision, Lens Technology, LianChuang Electronic Technology Co Ltd, Lingyi Itech Guangdong Co, Lite-On Technology, Lotes Co. Ltd., Meiko Electronics, Mitsui Kinzoku, Nan Ya PCB, Nitto Boseki, OFILM Group Co Ltd, Quanta Computer Inc., Sunny Optical, Suzhou TFC Optical Communication Co Ltd., Taiwan Union Technology Corporation, Unimicron, Visual Photonics Epitaxy Co Ltd, Wistron Corporation, Wiwynn Corp, Xiaomi Corp, Yageo Corp., Yangtze Optical Fibre and Cable JSC Ltd, Zhejiang Crystal-Optech Co Ltd, Zhen Ding, Zhongji Innolight Co Ltd.
Within the last 12 months, Morgan Stanley managed or co-managed a public offering (or 144A offering) of securities of Unimicron, Wistron Corporation, Wiwynn Corp, Zhen Ding, Zhongji Innolight Co Ltd.
Within the last 12 months, Morgan Stanley has received compensation for investment banking services from Lenovo, Unimicron, Wistron Corporation, Wiwynn Corp, Xiaomi Corp, Yageo Corp., Zhen Ding, Zhongji Innolight Co Ltd.
In the next 3 months, Morgan Stanley expects to receive or intends to seek compensation for investment banking services from AAC Technologies Holdings, Accton Technology Corporation, Acer Inc., Advantech, AirTAC International, Ajinomoto, Asustek Computer Inc., AU Optronics, Bizlink, Catcher Technology, Chenbro, Compal Electronics, Delta Electronics Inc., E Ink Holdings Inc., Elite Material Co., Ennostar Inc, Eoptolink Technology Inc Ltd, FIT Hon Teng Ltd, Giga-Byte Technology Co. Ltd., GoerTek Inc, Gold Circuit Electronics Ltd., Hon Hai Precision, Ibiden, Innolux, Lenovo, Lens Technology, Lingyi Itech Guangdong Co, Lite-On Technology, Luxshare Precision Industry Co., Ltd., Meiko Electronics, Mitsui Kinzoku, Nitto Boseki, Pegatron Corporation, Q Technology (Group) Company Ltd, Quanta Computer Inc., Resonac Holdings, Shanghai Conant Optical Co Ltd, Shenzhen Transsion Holdings Co Ltd, Suzhou TFC Optical Communication Co Ltd., TCL Corp., Unimicron, Wistron Corporation, Wiwynn Corp, Xiaomi Corp, Yageo Corp., Yangtze Optical Fibre and Cable JSC Ltd, Zhen Ding, Zhongji Innolight Co Ltd.
Within the last 12 months, Morgan Stanley has received compensation for products and services other than investment banking services from AAC Technologies Holdings, Accton Technology Corporation, Acer Inc., Asustek Computer Inc., AU Optronics, BYD Electronics, Compal Electronics, E Ink Holdings Inc., Eoptolink Technology Inc Ltd, Giga-Byte Technology Co. Ltd., GoerTek Inc, Hon Hai Precision, Innolux, Lenovo, Lingyi Itech Guangdong Co, Quanta Computer Inc., Xiaomi Corp, Yageo Corp..
Within the last 12 months, Morgan Stanley has provided or is providing investment banking services to, or has an investment banking client relationship with, the following company: AAC Technologies Holdings, Accton Technology Corporation, Acer Inc., Advantech, AirTAC International, Ajinomoto, Asustek Computer Inc., AU Optronics, Bizlink, Catcher Technology, Chenbro, Compal Electronics, Delta Electronics Inc., E Ink Holdings Inc., Elite Material Co., Ennostar Inc, Eoptolink Technology Inc Ltd, FIT Hon Teng Ltd, Giga-Byte Technology Co. Ltd., GoerTek Inc, Gold Circuit Electronics Ltd., Hon Hai Precision, Ibiden, Innolux, Lenovo, Lens Technology, Lingyi Itech Guangdong Co, Lite-On Technology, Luxshare Precision Industry Co., Ltd., Meiko Electronics, Mitsui Kinzoku, Pegatron Corporation, Q Technology (Group) Company Ltd, Quanta Computer Inc., Resonac Holdings, Shanghai Conant Optical Co Ltd, Shenzhen Transsion Holdings Co Ltd, Suzhou TFC Optical Communication Co Ltd., TCL Corp., Unimicron, Wistron Corporation, Wiwynn Corp, Xiaomi Corp, Yageo Corp., Yangtze Optical Fibre and Cable JSC Ltd, Zhen Ding, Zhongji Innolight Co Ltd.
Within the last 12 months, Morgan Stanley has either provided or is providing non-investment banking, securities-related services to and/or in the past has entered into an agreement to provide services or has a client relationship with the following company: AAC Technologies Holdings, Accton Technology Corporation, Acer Inc., Asustek Computer Inc., AU Optronics, BYD Electronics,
M
Compal Electronics, E Ink Holdings Inc., Eoptolink Technology Inc Ltd, Giga-Byte Technology Co. Ltd., GoerTek Inc, Hon Hai Precision, Innolux, Lenovo, Lingyi Itech Guangdong Co, Quanta Computer Inc., Xiaomi Corp, Yageo Corp., Zhen Ding.
The equity research analysts or strategists principally responsible for the preparation of Morgan Stanley Research have received compensation based upon various factors, including quality of research, investor client feedback, stock picking, competitive factors, firm revenues and overall investment banking revenues. Equity Research analysts' or strategists' compensation is not linked to investment banking or capital markets transactions performed by Morgan Stanley or the profitability or revenues of particular trading desks.
Morgan Stanley and its affiliates do business that relates to companies/instruments covered in Morgan Stanley Research, including market making, providing liquidity, fund management, commercial banking, extension of credit, investment services and investment banking. Morgan Stanley sells to and buys from customers the securities/instruments of companies covered in Morgan Stanley Research on a principal basis. Morgan Stanley may have a position in the debt of the Company or instruments discussed in this report. Morgan Stanley trades or may trade as principal in the debt securities (or in related derivatives) that are the subject of the debt research report.
Certain disclosures listed above are also for compliance with applicable regulations in non-US jurisdictions.
STOCK RATINGS
Morgan Stanley uses a relative rating system using terms such as Overweight, Equal-weight, Not-Rated or Underweight (see definitions below). Morgan Stanley does not assign ratings of Buy, Hold or Sell to the stocks we cover. Overweight, Equal-weight, Not-Rated and Underweight are not the equivalent of buy, hold and sell. Investors should carefully read the definitions of all ratings used in Morgan Stanley Research. In addition, since Morgan Stanley Research contains more complete information concerning the analyst's views, investors should carefully read Morgan Stanley Research, in its entirety, and not infer the contents from the rating alone. In any case, ratings (or research) should not be used or relied upon as investment advice. An investor's decision to buy or sell a stock should depend on individual circumstances (such as the investor's existing holdings) and other considerations.
Global Stock Ratings Distribution
(as of August 31, 2026)
The Stock Ratings described below apply to Morgan Stanley's Fundamental Equity Research and do not apply to Debt Research produced by the Firm.
For disclosure purposes only (in accordance with FINRA requirements), we include the category headings of Buy, Hold, and Sell alongside our ratings of Overweight, Equal-weight, Not-Rated and Underweight. Morgan Stanley does not assign ratings of Buy, Hold or Sell to the stocks we cover. Overweight, Equal-weight, Not-Rated and Underweight are not the equivalent of buy, hold, and sell but represent recommended relative weightings (see definitions below). To satisfy regulatory requirements, we correspond Overweight, our most positive stock rating, with a buy recommendation; we correspond Equal-weight and Not-Rated to hold and Underweight to sell recommendations, respectively.
| Coverage Universe | Coverage Universe | Investment Banking Clients (IBC) | Investment Banking Clients (IBC) | Investment Banking Clients (IBC) | Other Material Investment Services Clients (MISC) | Other Material Investment Services Clients (MISC) | |
|---|---|---|---|---|---|---|---|
| Stock Rating Category | Count | %of Total | Count | %of Total IBC | %of Rating Category | Count | %of Total Other MISC |
| Overweight/Buy | 1555 | 42% | 450 | 48% | 29% | 767 | 44% |
| Equal-weight/Hold | 1577 | 43% | 395 | 42% | 25% | 770 | 44% |
| Not-Rated/Hold | 3 | 0% | 1 | 0% | 33% | 1 | 0% |
| Underweight/Sell | 559 | 15% | 93 | 10% | 17% | 216 | 12% |
| Total | 3,694 | 939 | 1754 |
Data include common stock and ADRs currently assigned ratings. Investment Banking Clients are companies from whom Morgan Stanley received investment banking compensation in the last 12 months. Due to rounding off of decimals, the percentages provided in the "% of total" column may not add up to exactly 100 percent.
Analyst Stock Ratings
Overweight (O). The stock's total return is expected to exceed the average total return of the analyst's industry (or industry team's) coverage universe, on a risk-adjusted basis, over the next 12-18 months.
Equal-weight (E). The stock's total return is expected to be in line with the average total return of the analyst's industry (or industry team's) coverage universe, on a risk-adjusted basis, over the next 12-18 months.
Not-Rated (NR). Currently the analyst does not have adequate conviction about the stock's total return relative to the average total return of the analyst's industry (or industry team's) coverage universe, on a risk-adjusted basis, over the next 12-18 months.
Underweight (U). The stock's total return is expected to be below the average total return of the analyst's industry (or industry team's) coverage universe, on a risk-adjusted basis, over the next 12-18 months.
Unless otherwise specified, the time frame for price targets included in Morgan Stanley Research is 12 to 18 months.
Analyst Industry Views
Attractive (A): The analyst expects the performance of his or her industry coverage universe over the next 12-18 months to be attractive vs. the relevant broad market benchmark, as indicated below.
In-Line (I): The analyst expects the performance of his or her industry coverage universe over the next 12-18 months to be in line with the relevant broad market benchmark, as indicated below. Cautious (C): The analyst views the performance of his or her industry coverage universe over the next 12-18 months with caution vs. the relevant broad market benchmark, as indicated below. Benchmarks for each region are as follows: North America - S&P 500; Latin America - relevant MSCI country index or MSCI Latin America Index; Europe - MSCI Europe; Japan - TOPIX; Asia relevant MSCI country index or MSCI sub-regional index or MSCI AC Asia Pacific ex Japan Index.
Stock Price, Price Target and Rating History (See Rating Definitions)
240000
220000
200000
180000
160000
140000
120000
100000
80000
60000
40000
20000
09/01
2025
1/0/26 : 114000; 8/16/26 : 140000
Industry View: Attractive dAb In-line dID Cautious No Rating Effective January 10, 2014, the stocks covered by Morgan Stanley Asia Pacific will be rated relative to the analyst's industry cor industry team'si courage. Effective January 15, 2014, the industry view benchmarks for Morgan Stanley Asia Pacific are as follous! relevant MSCI country
ex Japan Index.
index or MSCI sub-regional index or MSCI AC Asia Pacific
Important Disclosures for Morgan Stanley Smith Barney LLC Customers
Important disclosures regarding any material conflict of interest that can reasonably be expected to have influenced Morgan Stanley Smith Barney LLC's choice of a third-party research provider or the subject company of a third-party research report, are available on the Morgan Stanley Wealth Management disclosure website at www.morganstanley.com/online/researchdisclosures. For Morgan Stanley specific disclosures, you may refer to https://www.morganstanley.com/eqr/disclosures/webapp/generalresearch.
Each Morgan Stanley research report is reviewed and approved on behalf of Morgan Stanley Smith Barney LLC. This review and approval is conducted by the same person who reviews the research report on behalf of Morgan Stanley. This could create a conflict of interest.
Other Important Disclosures
Morgan Stanley Research policy is to update research reports as and when the Research Analyst and Research Management deem appropriate, based on developments with the issuer, the sector, or the market that may have a material impact on the research views or opinions stated therein. In addition, certain Research publications are intended to be updated on a regular periodic basis (weekly/monthly/quarterly/annual) and will ordinarily be updated with that frequency, unless the Research Analyst and Research Management determine that a different publication schedule is appropriate based on current conditions.
Morgan Stanley is not acting as a municipal advisor and the opinions or views contained herein are not intended to be, and do not constitute, advice within the meaning of Section 975 of the Dodd-Frank Wall Street Reform and Consumer Protection Act.
Morgan Stanley produces an equity research product called a "Tactical Idea." Views contained in a "Tactical Idea" on a particular stock may be contrary to the recommendations or views expressed in research on the same stock. This may be the result of differing time horizons, methodologies, market events, or other factors. For all research available on a particular stock, please contact your sales representative or go to Matrix at http://www.morganstanley.com/matrix.
Morgan Stanley Research is provided to our clients through our proprietary research portal on Matrix and also distributed electronically by Morgan Stanley to clients. Certain, but not all, Morgan Stanley Research products are also made available to clients through third-party vendors or redistributed to clients through alternate electronic means as a convenience. For access to all available Morgan Stanley Research, please contact your sales representative or go to Matrix at http://www.morganstanley.com/matrix.
Any access and/or use of Morgan Stanley Research is subject to Morgan Stanley's Terms of Use (http://www.morganstanley.com/terms.html). By accessing and/or using Morgan Stanley Research, you are indicating that you have read and agree to be bound by our Terms of Use (http://www.morganstanley.com/terms.html). In addition you consent to Morgan Stanley processing your personal data and using cookies in accordance with our Privacy Policy and our Global Cookies Policy (http://www.morganstanley.com/privacy_pledge.html), including for the purposes of setting your preferences and to collect readership data so that we can deliver better and more personalized service and products to you. To find out more information about how Morgan Stanley processes personal data, how we use cookies and how to reject cookies see our Privacy Policy and our Global Cookies Policy (http://www.morganstanley.com/privacy_pledge.html). Please use the provided link to review the Terms and Conditions and Most Important Terms and Conditions for Morgan Stanley India Company Private Limited (https://www.morganstanley.com/assets/ pdfs/about-us-global-offices/india/Terms_and_conditions.pdf) and the following link to review the audit report (https://ny.matrix.ms.com/eqr/research/webapp/researchdocs/ MSICPL_Morgan_Stanley_Research_Audit_Report.pdf).
If you do not agree to our Terms of Use and/or if you do not wish to provide your consent to Morgan Stanley processing your personal data or using cookies please do not access our research. Morgan Stanley Research does not provide individually tailored investment advice. Morgan Stanley Research has been prepared without regard to the circumstances and objectives of those who receive it. Morgan Stanley recommends that investors independently evaluate particular investments and strategies, and encourages investors to seek the advice of a financial adviser.
Isu Petasys Co. Ltd. (007660.KS) - As of 09/11/26 GMT in KRW
Industry : S. Korea Technology
M
-
0/1
-
0/A
140000
M
Foundation
The appropriateness of an investment or strategy will depend on an investor's circumstances and objectives. The securities, instruments, or strategies discussed in Morgan Stanley Research may not be suitable for all investors, and certain investors may not be eligible to purchase or participate in some or all of them. Morgan Stanley Research is not an offer to buy or sell or the solicitation of an offer to buy or sell any security/instrument or to participate in any particular trading strategy. The value of and income from your investments may vary because of changes in interest rates, foreign exchange rates, default rates, prepayment rates, securities/instruments prices, market indexes, operational or financial conditions of companies or other factors. There may be time limitations on the exercise of options or other rights in securities/instruments transactions. Past performance is not necessarily a guide to future performance. Estimates of future performance are based on assumptions that may not be realized. If provided, and unless otherwise stated, the closing price on the cover page is that of the primary exchange for the subject company's securities/instruments.
The fixed income research analysts, strategists or economists principally responsible for the preparation of Morgan Stanley Research have received compensation based upon various factors, including quality, accuracy and value of research, firm profitability or revenues (which include fixed income trading and capital markets profitability or revenues), client feedback and competitive factors. Fixed Income Research analysts', strategists' or economists' compensation is not linked to investment banking or capital markets transactions performed by Morgan Stanley or the profitability or revenues of particular trading desks.
The "Important Regulatory Disclosures on Subject Companies" section in Morgan Stanley Research lists all companies mentioned where Morgan Stanley owns 1% or more of a class of common equity securities of the companies. For all other companies mentioned in Morgan Stanley Research, Morgan Stanley may have an investment of less than 1% in securities/instruments or derivatives of securities/instruments of companies and may trade them in ways different from those discussed in Morgan Stanley Research. Employees of Morgan Stanley not involved in the preparation of Morgan Stanley Research may have investments in securities/instruments or derivatives of securities/instruments of companies mentioned and may trade them in ways different from those discussed in Morgan Stanley Research. Derivatives may be issued by Morgan Stanley or associated persons.
With the exception of information regarding Morgan Stanley, Morgan Stanley Research is based on public information. Morgan Stanley makes every effort to use reliable, comprehensive information, but we make no representation that it is accurate or complete. We have no obligation to tell you when opinions or information in Morgan Stanley Research change apart from when we intend to discontinue equity research coverage of a subject company. Facts and views presented in Morgan Stanley Research have not been reviewed by, and may not reflect information known to, professionals in other Morgan Stanley business areas, including investment banking personnel.
Morgan Stanley Research personnel may participate in company events such as site visits and are generally prohibited from accepting payment by the company of associated expenses unless pre-approved by authorized members of Research management.
Morgan Stanley may make investment decisions that are inconsistent with the recommendations or views in this report.
To our readers based in Taiwan or trading in Taiwan securities/instruments: Information on securities/instruments that trade in Taiwan is distributed by Morgan Stanley Taiwan Limited ("MSTL"). Such information is for your reference only. The reader should independently evaluate the investment risks and is solely responsible for their investment decisions. Morgan Stanley Research may not be distributed to the public media or quoted or used by the public media without the express written consent of Morgan Stanley. Any non-customer reader within the scope of Article 7-1 of the Taiwan Stock Exchange Recommendation Regulations accessing and/or receiving Morgan Stanley Research is not permitted to provide Morgan Stanley Research to any third party (including but not limited to related parties, affiliated companies and any other third parties) or engage in any activities regarding Morgan Stanley Research which may create or give the appearance of creating a conflict of interest. Information on securities/instruments that do not trade in Taiwan is for informational purposes only and is not to be construed as a recommendation or a solicitation to trade in such securities/instruments. MSTL may not execute transactions for clients in these securities/instruments.
Certain information in Morgan Stanley Research was sourced by employees of the Shanghai Representative Office of Morgan Stanley Asia Limited for the use of Morgan Stanley Asia Limited. Morgan Stanley is not incorporated under PRC law and the research in relation to this report is conducted outside the PRC. Morgan Stanley Research does not constitute an offer to sell or the solicitation of an offer to buy any securities in the PRC. PRC investors shall have the relevant qualifications to invest in such securities and shall be responsible for obtaining all relevant approvals, licenses, verifications and/or registrations from the relevant governmental authorities themselves. Neither this report nor any part of it is intended as, or shall constitute, provision of any consultancy or advisory service of securities investment as defined under PRC law. Such information is provided for your reference only.
Morgan Stanley Research is disseminated in Brazil by Morgan Stanley C.T.V.M. S.A. located at Av. Brigadeiro Faria Lima, 3600, 6th floor, São Paulo - SP, Brazil; and is regulated by the Comissão de Valores Mobiliários; in Mexico by Morgan Stanley México, Casa de Bolsa, S.A. de C.V which is regulated by Comision Nacional Bancaria y de Valores. Paseo de los Tamarindos 90, Torre 1, Col. Bosques de las Lomas Floor 29, 05120 Mexico City; in Japan by Morgan Stanley MUFG Securities Co., Ltd. and, for Commodities related research reports only, Morgan Stanley Capital Group Japan Co., Ltd; in Hong Kong by Morgan Stanley Asia Limited (which accepts responsibility for its contents) and by Morgan Stanley Bank Asia Limited; in Singapore by Morgan Stanley Asia (Singapore) Pte. (Registration number 199206298Z) and/or Morgan Stanley Asia (Singapore) Securities Pte Ltd (Registration number 200008434H), regulated by the Monetary Authority of Singapore (which accepts legal responsibility for its contents and should be contacted with respect to any matters arising from, or in connection with, Morgan Stanley Research) and by Morgan Stanley Bank Asia Limited, Singapore Branch (Registration number T14FC0118J); in Australia to "wholesale clients" within the meaning of the Australian Corporations Act by Morgan Stanley Australia Limited A.B.N. 67 003 734 576, holder of Australian financial services license No. 233742, which accepts responsibility for its contents; in Australia to "wholesale clients" and "retail clients" within the meaning of the Australian Corporations Act by Morgan Stanley Wealth Management Australia Pty Ltd (A.B.N. 19 009 145 555, holder of Australian financial services license No. 240813, which accepts responsibility for its contents; in Korea by Morgan Stanley & Co International plc, Seoul Branch; in India by Morgan Stanley India Company Private Limited having Corporate Identification No (CIN) U22990MH1998PTC115305, regulated by the Securities and Exchange Board of India ('SEBI') and holder of licenses as a Research Analyst (SEBI Registration No. INH000001105); Stock Broker (SEBI Stock Broker Registration No. INZ000244438), Merchant Banker (SEBI Registration No. INM000011203), and depository participant with National Securities Depository Limited (SEBI Registration No. IN-DP-NSDL-567-2021) having registered office at Altimus, Level 39 & 40, Pandurang Budhkar Marg, Worli, Mumbai 400018, India; Telephone no. +91-22-61181000; Compliance Officer Details: Mr. Tejarshi Hardas, Tel. No.: +91-22-61181000 or Email: tejarshi.hardas@morganstanley.com; Grievance officer details: Mr. Tejarshi Hardas, Tel. No.: +91-22-61181000 or Email: msic-compliance@morganstanley.com. Morgan Stanley India Company Private Limited (MSICPL) may use AI tools in providing research services. All recommendations contained herein are made by the duly qualified research analysts; in Germany and the European Economic Area where required by Morgan Stanley Europe S.E., authorised and regulated by Bundesanstalt fuer Finanzdienstleistungsaufsicht (BaFin) under the reference number 149169; in the US by Morgan Stanley & Co. LLC, which accepts responsibility for its contents. Morgan Stanley & Co. International plc, authorized by the Prudential Regulation Authority and regulated by the Financial Conduct Authority and the Prudential Regulation Authority, disseminates in the UK research that it has prepared, and research which has been prepared by any of its affiliates, only to persons who (i) are investment professionals falling within Article 19(5) of the Financial Services and Markets Act 2000 (Financial Promotion) Order 2005 (as amended, the 'Order'); (ii) are persons who are high net worth entities falling within Article 49(2)(a) to (d) of the Order; or (iii) are persons to whom an invitation or inducement to engage in investment activity (within the meaning of section 21 of the Financial Services and Markets Act 2000, as amended) may otherwise lawfully be communicated or caused to be communicated. RMB Morgan Stanley Proprietary Limited is a member of the JSE Limited and A2X (Pty) Ltd. RMB Morgan Stanley Proprietary Limited is a joint venture owned equally by Morgan Stanley International Holdings Inc. and RMB Investment Advisory (Proprietary) Limited, which is wholly owned by FirstRand Limited. Morgan Stanley Research is disseminated in Canada by Morgan Stanley Canada Limited and Morgan Stanley Wealth Management Canada Inc., members of the Canadian Investment Regulatory Organization (CIRO). The information in Morgan Stanley Research is being disseminated by Morgan Stanley Saudi Arabia, regulated by the Capital Market Authority in the Kingdom of Saudi Arabia, and is directed at Sophisticated investors only.
M
Morgan Stanley Hong Kong Securities Limited is the liquidity provider/market maker for securities of AAC Technologies Holdings, BYD Electronics, FIT Hon Teng Ltd, Hon Hai Precision, Kingboard Laminates Holdings Ltd., Lenovo, Lens Technology, Luxshare Precision Industry Co., Ltd., Sunny Optical, Xiaomi Corp, Yangtze Optical Fibre and Cable JSC Ltd, Zhongji Innolight Co Ltd, ZTE Corporation listed on the Stock Exchange of Hong Kong Limited. An updated list can be found on HKEx website: http://www.hkex.com.hk.
The information in Morgan Stanley Research is being communicated by Morgan Stanley & Co. International plc (DIFC Branch), regulated by the Dubai Financial Services Authority (the DFSA) or by Morgan Stanley & Co. International plc (ADGM Branch), regulated by the Financial Services Regulatory Authority Abu Dhabi (the FSRA), and is directed at Professional Clients only, as defined by the DFSA or the FSRA, respectively. The financial products or financial services to which this research relates will only be made available to a customer who we are satisfied meets the regulatory criteria of a Professional Client. A distribution of the different MS Research ratings or recommendations, in percentage terms for Investments in each sector covered, is available upon request from your sales representative.
The information in Morgan Stanley Research is being communicated by Morgan Stanley & Co. International plc (QFC Branch), regulated by the Qatar Financial Centre Regulatory Authority (the QFCRA), and is directed at business customers and market counterparties only and is not intended for Retail Customers as defined by the QFCRA.
As required by the Capital Markets Board of Turkey, investment information, comments and recommendations stated here, are not within the scope of investment advisory activity. Investment advisory service is provided exclusively to persons based on their risk and income preferences by the authorized firms. Comments and recommendations stated here are general in nature. These opinions may not fit to your financial status, risk and return preferences. For this reason, to make an investment decision by relying solely to this information stated here may not bring about outcomes that fit your expectations.
The trademarks and service marks contained in Morgan Stanley Research are the property of their respective owners. Third-party data providers make no warranties or representations relating to the accuracy, completeness, or timeliness of the data they provide and shall not have liability for any damages relating to such data. The Global Industry Classification Standard (GICS) was developed by and is the exclusive property of MSCI and S&P.
Morgan Stanley Research, or any portion thereof may not be reprinted, sold or redistributed without the written consent of Morgan Stanley.
Indicators and trackers referenced in Morgan Stanley Research may not be used as, or treated as, a benchmark under Regulation EU 2016/1011, or any other similar framework.
The issuers and/or fixed income products recommended or discussed in certain fixed income research reports may not be continuously followed. Accordingly, investors should regard those fixed income research reports as providing stand-alone analysis and should not expect continuing analysis or additional reports relating to such issuers and/or individual fixed income products. Morgan Stanley may hold, from time to time, material financial and commercial interests regarding the company subject to the Research report.
Registration granted by SEBI and certification from the National Institute of Securities Markets (NISM) in no way guarantee performance of the intermediary or provide any assurance of returns to investors. Investment in securities market are subject to market risks. Read all the related documents carefully before investing.
INDUSTRY COVERAGE: Greater China Technology Hardware
| Company (Ticker) | Rating (As Of) | Price* (09/11/2026) |
|---|---|---|
| Andy Meng, CFA | ||
| AAC Technologies Holdings (2018.HK) | O (01/29/2024) | HK$42.00 |
| Accelink Technologies Co. Ltd. (002281.SZ) | U (05/12/2022) | Rmb177.36 |
| BYD Electronics (0285.HK) | O (04/28/2023) | HK$23.86 |
| China TransInfo Technology Co Ltd (002373.SZ) | E (07/18/2023) | Rmb7.42 |
| Dahua Technology Co. Ltd. (002236.SZ) | E (12/12/2024) | Rmb15.92 |
| Eoptolink Technology Inc Ltd (300502.SZ) | O (02/27/2026) | Rmb423.00 |
| Genius Electronic Optical Co. Ltd. (3406.TW) | U (09/10/2026) | NT$1,060.00 |
| GoerTek Inc (002241.SZ) | E (08/14/2026) | Rmb22.24 |
| Gosuncn Technology Group Co Ltd (300098.SZ) | U (11/07/2022) | Rmb4.38 |
| HIKVision Digital Technology (002415.SZ) | E (12/12/2024) | Rmb33.25 |
| Largan Precision (3008.TW) | E (09/10/2026) | NT$6,660.00 |
| LianChuang Electronic Technology Co Ltd (002036.SZ) | U (06/12/2024) | Rmb6.33 |
| Lingyi Itech Guangdong Co (002600.SZ) | U (04/23/2025) | Rmb13.10 |
| Lingyi Itech Guangdong Co (1688.HK) | O (08/14/2026) | HK$6.47 |
| Luxshare Precision Industry Co., Ltd. (2475.HK) | O (08/14/2026) | HK$59.00 |
| Luxshare Precision Industry Co., Ltd. (002475.SZ) | O (10/24/2016) | Rmb55.39 |
| OFILM Group Co Ltd (002456.SZ) | U (06/12/2024) | Rmb7.00 |
| Q Technology (Group) Company Ltd (1478.HK) | U (03/23/2026) | HK$5.45 |
| Quectel Wireless Solutions Co Ltd (603236.SS) | E (10/09/2024) | Rmb58.91 |
| Shanghai Conant Optical Co Ltd (2276.HK) | O (04/10/2026) | HK$42.54 |
| Shenzhen Transsion Holdings Co Ltd (688036.SS) | E (03/23/2026) | Rmb52.73 |
| Sunny Optical (2382.HK) | E (03/23/2026) | HK$69.10 |
| Suzhou TFC Optical Communication Co Ltd. (300394.SZ) | E (11/06/2025) | Rmb261.96 |
| Wingtech Technology Co Ltd (600745.SS) | U (05/18/2026) | Rmb17.13 |
| Xiaomi Corp (1810.HK) | O (04/14/2021) | HK$26.36 |
| Yangtze Optical Fibre and Cable JSC Ltd (601869.SS) | U (10/13/2021) | Rmb473.99 |
M
| Yangtze Optical Fibre and Cable JSC Ltd (6869.HK) | O (07/15/2026) | HK$183.50 |
|---|---|---|
| Yongxin Optics Co Ltd (603297.SS) | E (11/15/2022) | Rmb102.68 |
| Zhejiang Crystal-Optech Co Ltd (002273.SZ) | O (11/15/2022) | Rmb24.67 |
| Zhongji Innolight Co Ltd (300308.SZ) | O (09/07/2026) | Rmb926.00 |
| Zhongji Innolight Co Ltd (3308.HK) | O (09/07/2026) | HK$1,170.00 |
| ZTE Corporation (0763.HK) | O (06/04/2026) | HK$22.98 |
| ZTE Corporation (000063.SZ) | E (06/04/2026) | Rmb32.17 |
| Derrick Yang | ||
| Accton Technology Corporation (2345.TW) | O (06/06/2024) | NT$1,885.00 |
| Advantech (2395.TW) | O (01/20/2021) | NT$674.00 |
| AirTAC International (1590.TW) | O (04/16/2025) | NT$1,285.00 |
| Asia Vital Components Co. Ltd. (3017.TW) | O (07/30/2024) | NT$3,370.00 |
| AU Optronics (2409.TW) | E (02/10/2026) | NT$30.20 |
| Auras Technology Co Ltd (3324.TWO) | E (05/04/2023) | NT$1,360.00 |
| Bizlink (3665.TW) | O (03/10/2025) | NT$1,875.00 |
| BOE Technology (000725.SZ) | O (09/06/2019) | Rmb5.33 |
| Chenbro (8210.TW) | O (07/23/2025) | NT$900.00 |
| Chroma Ate Inc. (2360.TW) | O (10/05/2021) | NT$2,160.00 |
| Delta Electronics Inc. (2308.TW) | O (07/13/2017) | NT$1,620.00 |
| E Ink Holdings Inc. (8069.TWO) | E (08/10/2026) | NT$146.00 |
| Ennostar Inc (3714.TW) | U (09/23/2022) | NT$61.70 |
| Fositek Corp (6805.TW) | O (06/25/2025) | NT$2,150.00 |
| Hiwin Technologies Corp. (2049.TW) | O (03/30/2026) | NT$359.00 |
| Innolux (3481.TW) | E (04/07/2025) | NT$47.70 |
| King Slide Works Co. Ltd. (2059.TW) | O (11/08/2023) | NT$12,080.00 |
| Lens Technology (300433.SZ) | E (07/22/2020) | Rmb33.27 |
| Lite-On Technology (2301.TW) | E (01/15/2025) | NT$277.00 |
| TCL Corp. (000100.SZ) | E (04/07/2025) | Rmb4.64 |
| Tianma Microelectronics (000050.SZ) | U (01/24/2018) | Rmb6.45 |
| Wuhan Jingce Electronic Group Co Ltd (300567.SZ) | E (11/26/2021) | Rmb189.80 |
| Howard Kao | ||
| Acer Inc. (2353.TW) | U (04/23/2025) | NT$31.10 |
| Asustek Computer Inc. (2357.TW) | U (11/16/2025) | NT$924.00 |
| Catcher Technology (2474.TW) | U (11/17/2025) | NT$204.00 |
| Compal Electronics (2324.TW) | U (04/23/2025) | NT$37.80 |
| Co-Tech Development Corp. (8358.TWO) | O (09/13/2026) | NT$485.00 |
| Elite Material Co. (2383.TW) | O (09/13/2026) | NT$5,365.00 |
| FIT Hon Teng Ltd (6088.HK) | O (11/03/2025) | HK$5.28 |
| Foxconn Industrial Internet Co. Ltd. (601138.SS) | O (07/10/2019) | Rmb64.07 |
| Giga-Byte Technology Co. Ltd. (2376.TW) | E (11/16/2025) | NT$349.00 |
| Gold Circuit Electronics Ltd. (2368.TW) | O (10/06/2022) | NT$1,030.00 |
| Hon Hai Precision (2317.TW) | O (03/15/2024) | NT$248.00 |
| Inspur Electronic Information (000977.SZ) | E (08/28/2023) | Rmb70.54 |
| Kingboard Laminates Holdings Ltd. (1888.HK) | O (09/13/2026) | HK$47.90 |
| LandMark Optoelectronics Corporation (3081.TWO) | E (03/26/2026) | |
| Lenovo (0992.HK) | O (07/10/2026) | NT$2,810.00 HK$31.30 |
| Lotes Co. Ltd. (3533.TW) | E (05/12/2025) | NT$1,580.00 |
| Nan Ya PCB (8046.TW) | O (02/23/2026) | NT$1,080.00 |
| Pegatron Corporation (4938.TW) | E (03/25/2026) | NT$91.00 |
| Quanta Computer Inc. (2382.TW) | O (05/01/2023) | NT$336.50 |
| Shengyi Technology Co Ltd. (600183.SS) | E (05/26/2022) | Rmb148.43 |
| Shennan Circuits Co Ltd (002916.SZ) | E (08/24/2023) | Rmb396.68 |
| Taiwan Union Technology Corporation (6274.TWO) | O (09/13/2026) | NT$1,365.00 |
| Unimicron (3037.TW) | O (02/23/2026) | NT$977.00 |
| Visual Photonics Epitaxy Co Ltd (2455.TW) | E (09/11/2023) | NT$515.00 |
M
| Wistron Corporation (3231.TW) | O (07/12/2023) | NT$185.50 |
|---|---|---|
| Wiwynn Corp (6669.TW) | O (11/10/2025) | NT$2,310.00 |
| Yageo Corp. (2327.TW) | O (10/28/2025) | NT$544.00 |
| Zhen Ding (4958.TW) | ++ | NT$495.00 |
Stock Ratings are subject to change. Please see latest research for each company.
- Historical prices are not split adjusted.