PDF 原檔:報告_JPM_亞洲半導體月營收追蹤_20261012_original.pdf
圖片清單(已驗證 2026-10-13)
ingest 時逐張 Read 的圖片索引;lib/ 嵌圖只從此挑「真資料圖」。
| 檔名 | size | 分類 | 親眼所見內容 |
|---|---|---|---|
報告_JPM_亞洲半導體月營收追蹤_20261012_001.png |
314KB | 真資料圖 | WSTS 六圖合一:Figure 1 不含記憶體半導體營收 YoY(Sep-24 起,Aug-26 為 45%)、Figure 2 記憶體營收 YoY(Jul-26 435%、Aug-26 412%)、Figure 3 半導體月營收(US$mn)與 YoY、Figure 4 半導體出貨量與 YoY、Figure 5 半導體 ASP 與 YoY、Figure 6 不含記憶體營收與 YoY(來源 WSTS);含財務數據 |
報告_JPM_亞洲半導體月營收追蹤_20261012_002.png |
45KB | 真資料圖 | Figure 7:不含記憶體半導體出貨量(Mn)與 YoY,2002-08 至 2026-08 長條加折線 |
報告_JPM_亞洲半導體月營收追蹤_20261012_003.png |
51KB | 真資料圖 | Figure 9:記憶體月營收(US$mn)與 YoY,2026 年急升至約 10 萬 US$mn、YoY 約 400%+ |
報告_JPM_亞洲半導體月營收追蹤_20261012_004.png |
44KB | 真資料圖 | Figure 11:記憶體 ASP 與 YoY,2026 年急升 |
報告_JPM_亞洲半導體月營收追蹤_20261012_005.png |
45KB | 真資料圖 | Figure 8:不含記憶體半導體 ASP 與 YoY |
報告_JPM_亞洲半導體月營收追蹤_20261012_006.png |
51KB | 真資料圖 | Figure 10:記憶體出貨量(Mn)與 YoY |
報告_JPM_亞洲半導體月營收追蹤_20261012_007.png |
326KB | 真資料圖 | 揭露頁:SK hynix 股價走勢圖與 JPM 評等/目標價沿革表(OW,PT 自 W160,000 至 W3,000,000/W2,750,000),及 Tokyo Electron 股價與評等沿革(OW,PT 至 ¥17,000);財務/股價類,不嵌公司頁 |
分類只有三類:
真資料圖/裝飾·logo·banner/文字卡。
原始內容
J PMORGAN
Asian Semis
August WSTS: Logic growth accelerates on AI compute momentum; memory maintains elevated pricing
Overall semi revenues rose 156% YoY in August (vs 131% YoY in July), with logic semis increasing 45% YoY (vs 37% YoY in July) and memory increasing 412% YoY (vs 435% YoY in July). Key drivers include: 1) robust logic momentum supported by surging AI accelerator and CPU demand, with continued capacity expansion, broader price hikes in 2027, and TSMC indicating AI demand visibility now extending into 2029-30; 2) memory's sustained strength underpinned by structurally tight HBM supply-demand through 2028E; and 3) continued AI capex momentum, with major US hyperscalers reporting accelerating cloud revenue growth and leverage ratios remaining low at 13% net debt to equity.
Logic semi revenue rose 45% YoY (vs 37% in July), marking 36 consecutive months of YoY growth. On leading edge, N3 supply-demand tightness is expected to worsen in 2027 as major AI accelerators remain on N3 (NVIDIA Rubin, Google TPU v8, AWS Trainium 3). N2 capacity is ramping faster than prior expectations (reaching 118k/210k wfpm by end-27/28) to support flagship accelerator and CPU programs in the coming years. We now expect TSMC capex to reach $86/$100bn in 2027/28 (from prior $81/$90bn), with 9 leading-edge fab phases expected to come online over the next 3 years for N2. For mature foundries, pricing momentum continues to strengthen in 8" capacity given AI-peripheral applications, with further upside expected in 2027.
Overall semi units increased 19% YoY (vs 16% YoY in July). Memory units increased 65% YoY (vs 80% YoY in July), and logic semi units rose 16% YoY (vs 14% YoY in July). Within memory, ASIC is expected to overtake NVIDIA as the largest HBM consumer in 2027 (ASIC 48% vs NVIDIA 43% of total HBM bit demand), driven by substantial ASIC system unit growth (+102% YoY vs NVIDIA +15%). We continue to expect HBM wafer allocation to reach 31% of total DRAM capacity by 2028E-end, with 58% of the incremental DRAM capacity (930k WSPM increase from 2025-end to 2028-end) allocated to HBM-grade frontend wafer fabrication. Logic unit growth was supported by continued AI compute demand across accelerators, datacenter CPUs, and networking, partially offset by weak consumer electronics.
Overall semi ASPs were up 116% YoY (vs 99% YoY in July), with memory ASPs rising 210% YoY (vs 198% YoY in July). Memory ASPs continue to accelerate on structurally tight supply-demand and increasing HBM mix within shipments. We have revised up our HBM ASP growth assumptions to 54%/25% in 2027E/28E (vs prior 43% for 2027E), reflecting tighter-than-expected supply-demand. For DRAM, we expect ASP to rise 29%/7% in 2027E/28E, while for NAND, we expect ASP to rise 23% in 2027E before declining 4% in 2028E due to the diverging price trend between eSSD and consumer-grade SSD. Logic semi ASPs rose 25% YoY (vs 21% YoY in July), supported by continued mix shift towards advanced nodes (higher N3 mix and early N2 ramp) and sustained 100%+ utilization at N5/N3. We expect broader TSMC price hikes in 2027 (~10% for N3/N2, low-to-mid single digit for mature nodes (N7 and above) - the first mature node increase in this upcycle), alongside strengthening 8" pricing at mature foundries driven by AIperipheral demand.
See page 5 for analyst certification and important disclosures, including non-US analyst disclosures.
[讀者資訊已遮蔽]
Technology and Telecoms
Gokul Hariharan AC
(852) 2800-8564 gokul.hariharan@jpmorgan.com J.P. Morgan Securities (Asia Pacific) Limited/ J.P. Morgan Broking (Hong Kong) Limited
Jennifer Hsieh
(886-2) 2725-9868 jennifer.hsieh@jpmorgan.com J.P. Morgan Securities (Taiwan) Limited
David Chou
(886-2) 2725-9618 david.chou@jpmorgan.com J.P. Morgan Securities (Taiwan) Limited
Jason Chen
(886-2) 2725-9864 jason.bh.chen@jpmorgan.com J.P. Morgan Securities (Taiwan) Limited
Subham Singhania
(91-22) 6157-3801 subham.singhania@jpmorgan.com J.P. Morgan India Private Limited, J.P. Morgan Tower, Santacruz(E), Mumbai - 400098, SEBI Registration: INH000001873, (91-22) 6157-3000.
Gokul Hariharan AC (852) 2800-8564 gokul.hariharan@jpmorgan.com Asia Pacific Equity Research 12 October 2026
Looking ahead, we do not see fundamental indicators that signal meaningful weakness in the AI-driven semiconductor upcycle. The AI economics remain robust, with frontier model vendors achieving 60-80% inference gross margins and generating $20-40bn in annual revenue per GW (vs $10bn in 2025). Hyperscaler capex sustainability is supported by low leverage ratios (aggregate net debt/equity at ~13%) and accelerating public cloud revenue growth (+43% YoY in 2Q26), with aggregate CSP capex forecast to grow 65% in 2027. On the logic side, we expect TSMC to deliver 39% revenue growth in 2027, driven by N3 tightness and accelerating N2 ramp, maintaining 95%+ market share in N2/A16. Mature foundries should see continued ASP improvement and sustained AI-peripheral demand. On memory, HBM demand is expected to grow at 63% CAGR through 2028E, with ASIC expected to overtake NVIDIA as the largest consumer in 2027, and HBM TAM reaching $160bn/$282bn in 2027E/28E. We expect S-D shortage to continue with the degree of shortage worsening in 2027E followed by a slight improvement into 2028E.
Stock picks: We reiterate our top picks: TSMC, ASE, Unimicron, Aspeed, Hon Precision, SKH, Chroma, Advantest, and Tokyo Electron.
[讀者資訊已遮蔽]
Key charts
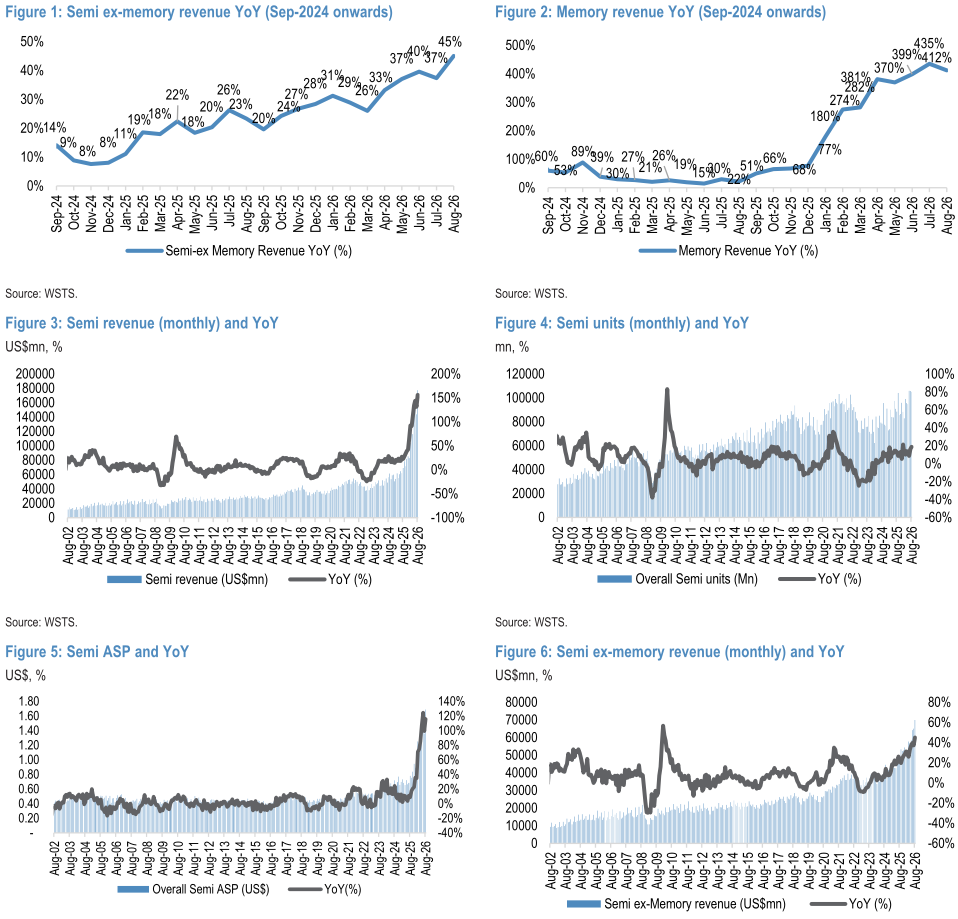
Source: WSTS.
Source: WSTS.
[讀者資訊已遮蔽]
J PMORGAN
Figure 7: Semi ex-memory units and YoY
Source: WSTS.
Source: WSTS.
Source: WSTS.
[讀者資訊已遮蔽]
J PMORGAN
Source: WSTS.
Source: WSTS.
Gokul Hariharan AC (852) 2800-8564 gokul.hariharan@jpmorgan.com Asia Pacific Equity Research
12 October 2026
Companies Discussed in This Report (all prices in this report as of market close on 12 October 2026, unless otherwise indicated)
ASE Technology Holding Co Ltd(3711.TW/NT$762.00/OW), ASPEED Technology Inc.(5274.TWO/NT$17,695.00/OW), Advantest (6857)(6857.T/¥41,610[09 October 2026]/OW), Chroma ATE(2360.TW/NT$2,365.00/OW), Hon. Precision(7769.TW/ NT$6,490.00/OW), SK hynix(000660.KS/W1,613,000/OW), TSMC(2330.TW/NT$2,540.00/OW), Tokyo Electron (8035) (8035.T/¥12,445[09 October 2026]/OW), Unimicron(3037.TW/NT$1,255.00/OW)
Analyst Certification: The Research Analyst(s) denoted by an 'AC' on the cover of this report certifies (or, where multiple Research Analysts are primarily responsible for this report, the Research Analyst denoted by an 'AC' on the cover or within the document individually certifies, with respect to each security or issuer that the Research Analyst covers in this research) that: (1) all of the views expressed in this report accurately reflect the Research Analyst's personal views about any and all of the subject securities or issuers; and (2) no part of any of the Research Analyst's compensation was, is, or will be directly or indirectly related to the specific recommendations or views expressed by the Research Analyst(s) in this report. For all Korea-based Research Analysts listed on the front cover, if applicable, they also certify, as per KOFIA requirements, that the Research Analyst's analysis was made in good faith and that the views reflect the Research Analyst's own opinion, without undue influence or intervention.
All authors named within this report are Research Analysts who produce independent research unless otherwise specified. In Europe, Sector Specialists (Sales and Trading) may be shown on this report as contacts but are not authors of the report or part of the Research Department.
評等沿革(SK hynix/Tokyo Electron,自完整解析版補回)
| Date | Rating | Price (W) | Price Target (W) |
|---|---|---|---|
| 07-Nov-23 | OW | 133000 | 160,000 |
| 25-Jan-24 | OW | 141500 | 175,000 |
| 22-Feb-24 | OW | 149000 | 185,000 |
| 28-Mar-24 | OW | 181200 | 260,000 |
| 16-Jul-24 | OW | 230000 | 300,000 |
| 08-Sep-24 | OW | 156400 | 240,000 |
| 24-Oct-24 | OW | 196000 | 260,000 |
| 10-Dec-24 | OW | 168900 | 210,000 |
| 23-Jan-25 | OW | 225500 | 280,000 |
| 03-Apr-25 | OW | 197900 | 300,000 |
| 24-Apr-25 | OW | 181000 | 285,000 |
| 25-Jun-25 | OW | 278500 | 360,000 |
| 24-Sep-25 | OW | 361000 | 460,000 |
| 23-Oct-25 | OW | 481000 | 650,000 |
| 29-Oct-25 | OW | 519000 | 700,000 |
| 14-Dec-25 | OW | 571000 | 800,000 |
| 16-Jan-26 | OW | 756000 | 1,000,000 |
| 29-Jan-26 | OW | 862000 | 1,250,000 |
| 22-Mar-26 | OW | 1006000 | 1,550,000 |
| 23-Apr-26 | OW | 1220000 | 1,800,000 |
| 17-May-26 | OW | 1848000 | 3,000,000 |
| 05-Aug-26 | OW | 1609000 | 2,750,000 |
| Date | Rating | Price (Y) | Price Target (Y) |
| 09-Feb-24 | OW | 5887 | 6,840 |
| 09-Jul-24 | OW | 7208 | 8,200 |
| 11-Dec-24 | OW | 4920 | 7,000 |
| 13-Jun-25 | OW | 5000 | 6,200 |
| 12-Sep-25 | OW | 4281 | 5,200 |
| 08-Nov-25 | OW | 6560 | 7,600 |
| 10-Jan-26 | OW | 7582 | 9,000 |
| 13-Mar-26 | OW | 7950 | 10,200 |
| 17-Jun-26 | OW | 14172 | 17,000 |
Source: Bloomberg Finance L.P. and J.P. Morgan; price data adjusted for stock splits and dividends. Initiated coverage Apr 04, 2001. All share prices are as of market close on the previous business day.