PDF 原檔:報告_GS_全球伺服器_20261018_original.pdf
圖片清單(已驗證 2026-10-19)
≥40KB 的 013/014/016 已逐張 Read,另補看 003/005;其餘 13 張(<40KB)依 trimmed 圖題對應,未逐張 Read,不嵌入 lib。
| 檔名 | size | 分類 | 親眼所見內容 |
|---|---|---|---|
報告_GS_全球伺服器_20261018_003.png |
11KB | 真資料圖 | Exhibit 5:AI 伺服器機櫃(NVL72)全球出貨按晶片平台,單位 k racks:NV racks 2025/2026E/2027E/2028E = 19/61/97/149,AMD racks 2026E/2027E/2028E = 2/13/15(2025 為 -) |
報告_GS_全球伺服器_20261018_005.png |
36KB | 真資料圖 | Exhibit 7:AI 伺服器機櫃(NV & AMD,NVL72)出貨市占雙環圖(外環 2028E、內環 2027E),分 Dell、SuperMicro、Other brands、Hon Hai、Quanta、Other ODM,Hon Hai 為最大扇區;中央文字「+75%/+49% YoY」,旁註 Hon Hai 預期憑研發、規模、美國與全球產能續增市占(圖上無百分比數字) |
報告_GS_全球伺服器_20261018_013.png |
49KB | 真資料圖 | Exhibit 15:全球伺服器價值 TAM(US$m)1Q21-1Q26 堆疊長條,x86 與 non-x86,疊 YoY 折線;圖內文字註明 x86 於 2025/1Q26 YoY +46%/-5%、non-x86 +191%/+109%,non-x86 占 2025 全球伺服器價值 TAM 37%、1Q26 為 50% |
報告_GS_全球伺服器_20261018_014.png |
55KB | 真資料圖 | Exhibit 16:全球伺服器價值 TAM(US$m)1Q21-1Q26 堆疊長條,Global brand/Chinese brand/ODM Direct,疊三條 YoY 折線;圖內文字註明 2025/1Q26 YoY:Global brand +31%/+103%、Chinese brand +47%/+19%、ODM Direct +133%/+2%,標示 49% 占比 |
報告_GS_全球伺服器_20261018_016.png |
42KB | 真資料圖 | Exhibit 18:台灣 ODM 與品牌廠近 12 個月營收 YoY(2015-01 至 2026 年中後),兩條線:Higher AI exposure(鴻海、廣達、緯穎、英業達、緯創、神達、技嘉)末值 +38%,Lower AI exposure(仁寶、和碩、宏碁、華碩、微星)末值 +15% |
原始內容
For the exclusive use of [讀者資訊已遮蔽]
Global Server: Raising both AI and General servers; better mix and higher memory costs drive CSP spending
We raise our global servers TAM by 31% / 45% in 2027 / 28E across general servers and AI servers to reflect the ongoing generative AI infrastructure investments and specification upgrades:
Allen Chang
+852-2978-2930 | allen.k.chang@gs.com Goldman Sachs (Asia) L.L.C.
Verena Jeng
+852-2978-1681 | verena.jeng@gs.com Goldman Sachs (Asia) L.L.C.
James Schneider, Ph.D.
+1(212)357-2929 | jim.schneider@gs.com Goldman Sachs & Co. LLC
Michael Ng, CFA
+1(212)902-8618 | michael.ng@gs.com Goldman Sachs & Co. LLC
Katherine Murphy
+1(212)902-1151 | katherine.a.murphy@gs.com Goldman Sachs & Co. LLC
Ronald Keung, CFA +852-2978-0856 | ronald.keung@gs.com Goldman Sachs (Asia) L.L.C.
Gabriela Borges, CFA
+1(212)902-7839 | gabriela.borges@gs.com Goldman Sachs & Co. LLC
Giuni Lee
+65-6889-1025 | giuni.lee@gs.com Goldman Sachs (Singapore) Pte
Anmol Makkar
+1(212)357-1366 | anmol.makkar@gs.com Goldman Sachs & Co. LLC
Daiki Takayama
+81(3)4587-9870 | daiki.takayama@gs.com Goldman Sachs Japan Co., Ltd.
Ting Song
+852-2978-6466 | ting.song@gs.com Goldman Sachs (Asia) L.L.C.
Selina Zhang
+1(212)357-9979 | selina.zhang@gs.com Goldman Sachs & Co. LLC
- (1) General servers: raised value by 17% / 11% in 2027 / 28E with both shipment and ASP raised. We expect general servers shipment to grow at 20% / 12% / 8% YoY in 2026-28E.
- (2) AI servers (NVL72, powered by NV & AMD): shipment raised by 5% / 1% to 110k / 164k racks in 2027 / 28E.
- (3) AI servers (8-GPU, powered by GPU & ASIC): shipment raised by 10% / 29% to 2.7m / 3.3m servers in 2027 / 28E. Our new AI servers shipment forecasts imply AI chip demand of 18m / 29m / 38m in 2026-28E, or a ~60% / ~50% ASIC penetration rate globally / global-tier in 2028E. We continue to see a rise across CSP capex, fabless shipment, and foundry capacity, driving an AI infrastructure upcycle.
AI servers supply chain: Buy Hon Hai / FII (ODM), Wiwynn / Wistron (ODM), Innolight (Optical module), Eoptolink (Optical module), Shengyi Tech (CCL), Victory Giant (PCB), FOCI (FAU), Largan (FAU), LandMark (Silicon photonics), VPEC (Silicon photonics), AVC / Fositek (liquid cooling), Auras (liquid cooling), King Slide (rail kits), EMC (CCL), GCE (PCB), TSMC (foundry), MPI (probe cards), WinWay (sockets), Aspeed (fabless), and Hon Precision (FT handler).
e92c7a75ab8b4efbba794e6b187208c8
For the exclusive use of [讀者資訊已遮蔽]
Exhibit 1: Raising our global servers TAM by 31% / 45% in
2027 / 28E on both higher General servers and AI servers Global server value TAM revision
Source: Company data, Goldman Sachs Global Investment Research
Related reports:
Global Tech: PCs, smartphones, servers: Quantifying market opportunities (launching Global TAMs on Oct 3, 2023)
Global Tech: Server TAM: Introducing rack-level AI server forecasts (Oct 29, 2024)
Global Tech: Server TAM updates: AI server shipment timeframe recalibrating (Feb 9, 2025)
Global Tech: Server TAM updates: Revising down AI Training Server outlook (Mar 24, 2025)
Global Tech: ASIC AI server TAM introduced; Server TAM update and baseboard-based AI servers raised (June 28, 2025)
Global Server: 2027E estimates introduced; Raising baseboard-based AI servers with rising ASIC penetration (Sep 27, 2025)
Global Server: ASIC servers expanding; AI full racks see diversifying chip platform (Jan 4, 2026)
Global Server: Higher mix of rack-level AI servers; Introducing 2028 forecasts (Apr 17, 2026)
Global Server: Raising both AI and General servers; better mix and higher memory costs drive CSP spending (Jun 24, 2026)
e92c7a75ab8b4efbba794e6b187208c8
For the exclusive use of [讀者資訊已遮蔽]
Servers: AI server rack shipments +238%/+75%/+49% YoY in 2026-28E
Global Server market opportunity
| (Shipments in k units/ k racks) | ||||||||||||||||
| Revenues by type | US$ m | 1Q25 64,889 | 2Q25 | 3Q25 | 4Q25 | 1Q26 | 2Q26 | 3Q26E 172,900 | 4Q26E 175,105 | 2025 324,969 | 2026E 604,976 | 2027E 1,114,623 | 2028E 1,602,489 | 2028E 1,602,489 | 2028E 1,602,489 | |
| Our Bottom up method | Global server revenues General servers | US$ m | 32,860 | 81,309 36,618 | 80,639 38,001 | 98,133 40,581 | 109,179 43,837 | 147,792 56,047 | 62,915 | 54,293 | 148,061 | 217,092 | 250,293 | 271,114 | 271,114 | 271,114 |
| Global server TAM = | AI server racks (NVL72) AI server training (8-GPU) (8-GPU) | US$ m US$ m | 5,655 19,910 | 10,325 29,172 | 12,015 24,935 | 27,750 25,296 | 37,695 22,446 | 46,676 35,501 | 49,980 49,143 | 59,319 55,745 49,415 | 193,670 99,313 | 156,505 37,710 | 598,899 203,276 62,155 | 237,482 | 237,482 | 237,482 |
| General server + AI server racks | AI server inferencing | US$ m | 6,463 1Q25 | 5,194 2Q25 | 5,688 | 4,505 | 5,201 | 9,568 | 10,862 | 12,079 | 21,850 | 2026E | 2027E | 80,948 | 80,948 | 80,948 |
| Mix | 3Q25 | 4Q25 | 1Q26 | 2Q26 | 3Q26E | 4Q26E | 2025 | 2028E | 2028E | 2028E | ||||||
| (NVL72) + AI server (8-GPU) | Total General servers | % | 100% | 100% | 100% | 100% | 100% 40% | 100% 38% | 100% 36% | 100% | 100% | 100% 36% | 100% 22% | 100% 17% | 100% 17% | 100% 17% |
| AI server racks (NVL72) server training (8-GPU) | % % | 51% | 45% 13% | 47% 15% | 41% 28% | 35% | 32% | 29% | 31% 34% | 46% 17% | 32% | 54% | 63% | 63% | 63% | |
| General server | AI server inferencing | % | 9% 31% | 36% | 31% | 26% | 21% | 24% | 28% | 28% | 31% | 26% | 18% | 15% | 15% | 15% |
| General server shipments = | AI (8-GPU) Revenues YoY | % | 10% 1Q25 | 6% 2Q25 | 7% 3Q25 | 5% 4Q25 | 5% 1Q26 | 6% 2Q26 | 6% 3Q26E | 7% 4Q26E | 7% 6% 2025 | 2026E 86% | 6% 2027E | 5% 2028E | 5% 2028E | 5% 2028E |
| shipments of Top 6 server brands | Total servers | % | 68% | 82% | 114% | 78% | 84% | 44% | 44% | 44% | ||||||
| + ODM direct + others | General server racks (NVL72) | % % | 33% 567% | 53% 352% | 66% | 34% | 47% | 15% | 8% | 8% | 8% | |||||
| General server revenues = | AI AI server training (8-GPU) | % | 13% | 22% | 316% | 114% 95% | 247% 58% | 209% 30% | 69% 17% | 69% 17% | 69% 17% | |||||
| AI server inferencing (8-GPU) | % | 97% | 30% | |||||||||||||
| shipments of each company x ASP | Revenues QoQ | 1Q25 | -20% | 84% | 91% | 168% 4Q26E | 73% | 65% | ||||||||
| of each company | Total | 2Q25 | 3Q25 | 4Q25 | 1Q26 | 2Q26 | 3Q26E | 1% | 2025 | 2026E | 2027E | 2028E | ||||
| % | 25% | -1% | 22% | 11% | 35% | 17% | ||||||||||
| General servers AI server racks (NVL72) | % | 11% | 4% | 7% | 8% | 28% | 12% | -14% 19% | ||||||||
| General servers revenues mix | AI server training (8-GPU) | % | 83% | 16% | 131% | 36% | 24% | 7% | ||||||||
| % | 47% | -15% | 1% | -11% | 58% | 38% | 1% | |||||||||
| 46% | AI server inferencing (8-GPU) | % Units | 1Q25 | -20% 2Q25 | 10% 3Q25 | -21% 4Q25 | 15% 1Q26 | 84% 2Q26 | 14% 3Q26E | 11% 4Q26E | 2025 | 2026E | 2027E | 2028E | ||
| 36% | Shipments by type Global server shipments | k units | 3,619 | 3,901 | 3,648 | 3,966 | 4,585 | 5,122 | 4,550 | 15,134 | 18,107 | 20,321 | 21,917 | 21,917 | 21,917 | |
| 22% | General servers AI server racks (NVL72) | k racks | 2 | 9 | 3,851 | 16 | 17 | 18 | 19 | 110 | 164 | 164 | 164 | |||
| 17% | k units | 154 | 3 | 4 | 13 | 240 | 329 | 337 | 660 | 63 1,082 | 1,533 | 1,858 | 1,858 | 1,858 | ||
| AI server training (8-GPU) | 141 | 162 | 170 | 174 | 176 81 | 146 | 213 | 208 | 417 | 648 | 1,122 | 1,447 | 1,447 | 1,447 | ||
| AI server inferencing (8-GPU) | k units | 91 | 111 3Q25 | 74 4Q25 | 1Q26 | 2Q26 | 3Q26E | 4Q26E | 2025 | 2026E | 2027E | 2028E | 2028E | 2028E | ||
| Shipments YoY General servers | % | 1Q25 | 2Q25 | 6% | 18% | 40% | 15% | 20% | 12% | 8% | ||||||
| 2025 2026E 2027E 2028E | AI server racks (NVL72) AI server training (8-GPU) | % | 567% | 352% | 318% | 94% 94% | 238% 64% | 42% | 75% | 75% | 49% 21% | |||||
| AI server | AI server inferencing (8-GPU) | % % | 14% -43% | 48% 60% | 94% 93% | 180% 4Q26E | 55% | 73% | 29% | |||||||
| AI server shipments = shipments | Shipments QoQ General servers | 1Q25 | 2Q25 8% | 3Q25 -6% | 4Q25 9% | 1Q26 -3% | 2Q26 19% | 3Q26E 12% | -11% | 2025 | 2026E | 2027E | 2027E | 2028E | ||
| of Top 6 server brands + ODM | AI server racks (NVL72) | % | 83% | 16% | 131% | 36% | 24% | 8% | 7% | |||||||
| direct + | % | |||||||||||||||
| others | AI server training (8-GPU) AI server inferencing | % | 5% | 5% | 3% | 1% | 36% | 38% | 2% | |||||||
| AI server revenue = shipments x | (8-GPU) Shipments by vendor | % | 1Q25 | -36% 2Q25 | 21% 3Q25 | -33% 4Q25 | 9% 1Q26 | 80% 2Q26 | 46% 3Q26E | -2% 4Q26E 4,550 | 2025 15,134 | 2026E 18,107 | 2027E 20,321 | 2028E 21,917 | 2028E 21,917 | 2028E 21,917 |
| AI server racks revenues mix ASP | General server shipments Dell | k units k units | 3,619 334 | 3,901 307 | 3,648 299 | 3,966 395 | 3,851 414 | 4,585 446 | 5,122 448 | 500 | 1,335 | 1,808 | 2,050 | 2,255 | 2,255 | 2,255 |
| HP | k units | 165 | 161 | 182 | 161 | 154 | 169 | 191 | 669 | 675 | 703 | 717 | 717 | 717 | ||
| Super Micro | k units | 156 | 161 173 | 134 | 130 | 165 | 135 | 135 | 142 | 592 | 578 | 557 | 579 | 579 | 579 | |
| 54% 63% | Lenovo | k units | 174 | 187 | 213 | 263 | 226 | 280 | 287 | 289 | 837 | 1,083 | 1,137 | 1,194 | 1,194 | 1,194 |
| Gigabyte | k units | 24 | 41 | 27 | 30 | 34 | 44 | 53 | 31 | 123 | 162 | 187 | 196 | 196 | 196 | |
| 32% | Quanta - ODM direct | k units | 576 | 650 | 483 | 541 | 639 | 747 | 627 | 703 | 2,249 | 2,717 | 2,826 | 2,882 | 2,882 | 2,882 |
| 17% | Hon Hai- ODM direct | k units | 207 | 256 | 221 | 211 | 218 | 255 | 229 | 242 | 895 | 944 | 971 | 971 | 971 | 971 |
| Wiwynn- ODM direct | k units | 455 | 527 | 596 | 588 | 638 | 895 | 1,353 | 823 | 2,166 | 3,709 | 4,724 | 5,432 | 5,432 | 5,432 | |
| Others | k units | 1,527 | 1,599 | 1,516 | 1,627 | 1,356 | 1,628 | 1,820 | 1,628 | 6,269 | 6,432 | 7,168 7,691 | 7,168 7,691 | 7,168 7,691 | 7,168 7,691 | |
| 2025 2026E 2027E 2028E | AI server - 8-GPU | k units | 296 9 | 253 33 | 280 28 | 248 44 | 257 | 385 83 | 543 94 | 545 110 | 1,077 113 | 1,730 364 | 2,655 437 | 3,305 491 | 3,305 491 | |
| Dell HP | k units k units | 2 | 2 | 1 | 77 3 | 6 | 6 | 5 | 9 | 21 | 12 | 12 | 12 | 12 | ||
| AI server (8-GPU) revenues 37% | Super | k units | 10 | 4 13 | 12 | 22 | 9 | 8 | 16 | 14 | 57 | 48 | 42 | 39 | 39 | 39 |
| mix 32% 24% 20% | Micro Lenovo | k units | 16 | 10 | 11 | 13 | 34 | 19 | 27 | 27 | 50 | 107 18 | 196 | 294 | 294 | 294 |
| Gigabyte | k units | 2 19 | 4 | 2 | 2 | 3 | 5 | 5 | 6 | 10 73 | 123 | 22 156 | 25 | 25 | 25 | |
| Quanta - ODM direct Hai- ODM direct | k units k units | 51 | 20 | 24 56 | 10 20 | 10 20 | 28 91 | 46 50 | 39 | 187 168 | 211 207 | 166 200 | 166 200 | 166 200 | ||
| Hon Wiwynn- ODM direct | k units | 21 | 60 41 | 52 | 54 | 45 | 45 | 52 | 50 66 | 200 287 | 362 | 362 | 362 | |||
| Others | k units | 166 | 83 | 56 | 100 | 247 | 228 | 410 19 | 1,716 | 1,716 | 1,716 | |||||
| AI server - full racks Dell | k racks | 2 | 68 | 93 4 | 9 | 13 | 16 | 17 | 18 | 3 | 631 63 13 | 1,302 110 15 | 164 18 | 164 18 | 164 18 | |
| HP | ** k racks | 0 | 3 | 1 | 3 | 3 | 4 | 4 | 2 | 2 | 2 | 2 | ||||
| 2025 2026E 2027E 2028E | Super Micro | k racks | 0 | 1 0 | 1 0 | 0 | 0 | 0 | 1 | 0 | 1 3 | 1 | 15 | 15 | 15 | |
| Lenovo | k racks | 0 - | 0 | 0 | 2 | 2 | 2 | 3 | 3 0 | - | 13 2 | 3 | 3 | 3 | ||
| Gigabyte Quanta - ODM direct | k racks k racks | - | - | - | - 0 | 0 | 0 | 0 | 0 | 0 | 10 | 1 | 1 | 1 | 1 | |
| 0 | 0 | 0 | 0 1 | |||||||||||||
| Hon Hai- ODM direct | k racks k racks | 1 | 0 1 | 1 | 1 4 | 3 5 | 0 5 | 2 | 1 | 11 | 13 59 | |||||
| Wiwynn- ODM direct | 0 | 6 | 7 | 7 | 4 7 | 17 101 | 17 101 | 17 101 | ||||||||
| Others | k racks k racks | 1 - | 2 - | - | - | - | - | 1 | 25 1 2 | 5 2 | 5 2 | 5 2 | ||||
| - 0 | 0 | 0 | - | 0 | 0 | |||||||||||
| 0 | 1 | - 1 |
Source: Company data, Goldman Sachs Global Investment Research
Exhibit 2: ASIC penetration rate up to ~60% / ~50% in 2028E globally / global-tier 1 hyperscalers
AI server shipment implied AI chips and ASIC penetration rate
| 2026E | 2027E | 2028E | |
|---|---|---|---|
| NEW | |||
| AI server shipment (k units) | |||
| Rack-level (NVL72) | 63 | 110 | 164 |
| 8-GPU | 1,730 | 2,655 | 3,305 |
| Implied AI chips | 18,361 | 29,171 | 38,275 |
| YoY | 84% | 59% | 31% |
| ASIC penetration rate | 55% | 57% | 58% |
| Global-tier | 47% | 48% | 49% |
| Chinese | 92% | 92% | 92% |
| CHG | |||
| AI server shipment (k units) | |||
| Rack-level (NVL72) | 13% | 5% | 1% |
| 8-GPU | -7% | 10% | 29% |
| Implied AI chips | -3% | 9% | 19% |
Source: Company data, Goldman Sachs Global Investment Research
Exhibit 3: Raising both our forecasts for Brand makers and ODM in 2027 / 28E
Global server value TAM revision
Source: Company data, Goldman Sachs Global Investment Research
e92c7a75ab8b4efbba794e6b187208c8
For the exclusive use of [讀者資訊已遮蔽]
AI servers ecosystem
Exhibit 4: AI servers ecosystem: revenues exposure to different chipset platforms / customers
| Company name | Ticker | Analyst | Rev exposures % to selected supply chain (2026E) - Nvidia GPU | Rev exposures % to selected supply chain (2026E) - AMD GPU | Rev exposures % to selected supply chain (2026E) - Google TPU | Rev exposures % to selected supply chain (2026E) - Amazon Trainium | Rev exposures % to selected supply chain (2026E) - Meta MTIA | Rev exposures % to selected supply chain (2026E) - Chinese GPUs/ ASICs | Rev exposures % to selected supply chain (2026E) - Oracle | Rev exposures % to selected supply chain (2026E) - Company product focus |
|---|---|---|---|---|---|---|---|---|---|---|
| ODM | ||||||||||
| Hon Hai | 2317.TW | Allen Chang | 30-35% | 5-10% | 5-10% | 0% | 0% | <5% | <10% | AI server ODM |
| Inspur | 000977.SZ | Allen Chang | <10% | <10% | 0% | 0% | 0% | 60-65% | 0% | AI server brand/ ODM |
| Ruijie Networks | 301165.SZ | Allen Chang | 0% | 0% | 0% | 0% | 0% | 55-60% | 0% | Data center switch |
| Wiwynn | 6669.TW | Allen Chang | 5-10% | 5-10% | <5% | 25-35% | <5% | 0% | 10-20% | AI server ODM |
| Quanta | 2382.TW | Allen Chang | 60-70% | <5% | <5% | 0% | <5% | 0% | <5% | AI server ODM |
| Huaqin Technology | 603296.SS | Verena Jeng | <10% | <5% | 0% | 0% | 0% | 30-35% | 0% | AI server ODM, Data center switch ODM |
| FII | 601138.SS | Verena Jeng | 45-50% | <10% | <10% | 0% | 0% | <10% | 10-20% | AI server ODM |
| Mitac | 3706.TW | Verena Jeng | <5% | 5-10% | 0% | 0% | 0% | 0% | 60-65% | Data center switch ODM, AI server ODM |
| Wistron | 3231.TW | Verena Jeng | 45-55% | <5% | 0% | 5-15% | <5% | <5% | 5-10% | AI server ODM |
| Inventec | 2356.TW | Verena Jeng | 15-20% | <5% | <5% | 0% | 0% | 0% | 0% | AI server ODM |
| UNIS | 000938.SZ | Verena Jeng | <5% | <5% | 0% | 0% | 0% | 40-50% | 0% | AI server brand/ ODM |
| Lenovo | 0992.HK | Verena Jeng | <10% | <10% | 0% | 0% | 0% | <10% | 0% | AI server brand/ ODM |
| Brands | ||||||||||
| Asus | 2357.TW | Allen Chang | 25-35% | <10% | 0% | 0% | 0% | 0% | 0% | AI server brand |
| Gigabyte | 2376.TW | Allen Chang | 65-75% | <10% | 0% | 0% | 0% | 0% | 0% | AI server brand |
| ZTE | 000063.SZ/ 0763.HK | Allen Chang | 0% | 0% | 0% | 0% | 0% | <10% | 0% | AI server brand |
| Components | ||||||||||
| AVC | 3017.TW | Allen Chang | 40-50% | <10% | <5% | 15-20% | 5-10% | <5% | <5% | Liquid cooling components, chassis |
| Auras | 3324.TWO | Verena Jeng | 40-50% | <10% | <10% | <20% | <10% | 0% | <10% | Coldplate, CDU, manifold, QD |
| Chenbro | 8210.TW | Verena Jeng | 30-35% | <5% | 0% | 30-35% | 0% | 10-15% | <10% | Chassis |
| Fositek | 6805.TW | Verena Jeng | 40-50% | <5% | <5% | 5-10% | <5% | <5% | <5% | QD, rail kits |
| King Slide | 2059.TW | Verena Jeng | 50-55% | <10% | <10% | <10% | <10% | <10% | <10% | Rial kits |
| Delta Electronics | 2308.TW | Chao Wang | 20-25% | <5% | <10% | <10% | <5% | 0% | <5% | PSU & DC/DC converter & CDU |
| PCB/ CCL | ||||||||||
| Shennan Circuits | 002916.SZ | Ting Song | <5% | 5-10% | 0% | 0% | 0% | 20-25% | 0% | PCB |
| NYPCB | 8046.TW | Chao Wang | 0% | 0% | <1% | <1% | <1% | <1% | 0% | ABF substrate |
| Elite Material | 2383.TW | Chao Wang | 10-15% | <5% | 15-20% | 10-15% | 5-10% | <1% | <1% | CCL |
| GCE | 2368.TW | Chao Wang | <5% | <5% | 10-15% | 30-35% | 20-25% | 0% | 0% | PCB |
| TUC | 6274.TWO | Chao Wang | <5% | <5% | 5-10% | 10-15% | <5% | <1% | 0% | CCL |
| ZDT | 4958.TW | Chao Wang | <5% | 0% | <5% | <5% | 0% | <5% | 0% | PCB & ABF substrates |
| Kinsus | 3189.TW | Chao Wang | <5% | <1% | <1% | 0% | 0% | 0% | 0% | ABF substrates |
| Unimicron | 3037.TW | Chao Wang | 5-10% | <5% | 5-10% | <5% | <5% | 0% | 0% | ABF substrate / HDI |
| Optical modules, | Lasers | |||||||||
| Innolight | 300308.SZ | Verena Jeng | 30-35% | <5% | 25-35% | 10-15% | 10-15% | <5% | <10% | Optical transceivers |
| Eoptolink | 300502.SZ | Ting Song | 30-35% | <5% | 10-15% | 25-30% | 5-10% | <5% | 0% | Optical transceiver |
| LandMark | 3081.TWO | Allen Chang | 30-35% | <5% | 30-35% | 10-15% | 10-15% | <5% | <10% | InP laser diode/ EPI wafer |
| YJ Semi | 688498.SS | Verena Jeng | 30-35% | <5% | 25-35% | 10-15% | 10-15% | <5% | <10% | InP laser diode/ EPI wafer |
| VPEC | 2455.TW | Verena Jeng | 15-20% | <5% | 10-15% | <5% | <5% | <5% | <5% | InP EPI wafer |
Source: Goldman Sachs Global Investment Research
e92c7a75ab8b4efbba794e6b187208c8
For the exclusive use of [讀者資訊已遮蔽]
Server TAM estimate revisions
AI server racks: We raise our forecast for AI server racks powered by NVIDIA to 61k / 97k / 149k in 2026 - 28E (vs. 50k / 92k / 148k previously), reflecting the increase in our forecasts for brand makers (Dell, SuperMicro, HP), leading to higher US CSP capex by 4% / 17% / 22% in 2026-28E, and NVIDIA chipset shipments (raised by 9% / 15% in 2027 / 28E), showing the ongoing upcycle of AI infrastructure. Overall, we expect the AI server rack global value TAM to grow at 163% CAGR in 2025-28E to US$1tn, or 63% of the global server value TAM by 2028E. By vendor, we continue to expect global leading CSPs to be the major customers, with leading ODM direct players as the major suppliers. We expect Hon Hai / FII to maintain the leading market position among ODMs and with continuous specification upgrade driving its global market share expansion.
Exhibit 5: AI server racks global shipment by chipset platforms
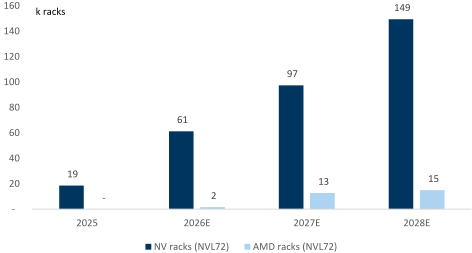
Exhibit 6: AI server rack shipments by ODM / OEMs
Source: Goldman Sachs Global Investment Research
Exhibit 7: AI server racks global shipment market share by vendors
Source: Goldman Sachs Global Investment Research
Exhibit 8: GPU for rack-level (72-GPU) vs for server-level (8-GPU)
Source: Goldman Sachs Global Investment Research
Source: Goldman Sachs Global Investment Research
AI servers: We raise AI server (8-GPU) equivalent shipment by 10% / 29% in 2027-28E to 2.7m / 3.3m in 2027-28E, mainly driven by rising ASIC-based AI server demand. The custom-design provides ASIC-based AI servers optimized for AI computation with better efficiency, such as lower latency, or memory savings via reduced expensive read/write cycles. We continue to see new generation ASICs launched by global leading CSPs, supporting AI server growth: we expect the AI servers (8-GPU) global value TAM to grow e92c7a75ab8b4efbba794e6b187208c8
For the exclusive use of [讀者資訊已遮蔽]
at 38% CAGR in 2025-28E to US$318bn, or 20% of global server value TAM by 2028E. We reduce 2026E shipment by 7% to 1.7m, reflecting a shift toward higher density AI server racks driven by leading US CSPs.
Source: Goldman Sachs Global Investment Research
Source: Goldman Sachs Global Investment Research
General servers: We raise general server revenue by 15% / 13% / 11% in 2026-28E driven by high memory costs and ongoing specification upgrades driving AI workloads. Intel launched its Intel Xeon 6+ processors at Computex 2026 (link) to facilitate Agentic AI workloads, positioning: CPU servers as the control plane, driving system-level performance and efficiency under rising agentic AI workloads, while supporting data movement and sustained inferencing. Intel presented Xeon 7 Diamond Rapids in Aug 2026 (link), with architectures for Agentic AI and Enterprise scale workloads, empowering efficient inference and edge computing. AMD has begun production ramp of its 6th Gen AMD EPYC CPUs (Venice) in May (link), which powers agentic AI and diverse workloads - running the agents, AI host nodes, and general purposes that turns intelligence into action with optimized TCO (total cost of ownership). We expect general servers' global value TAM to grow at 22% CAGR in 2025-28E to US$271bn, or 17% of global server value TAM by 2028E.
Exhibit 11: General server shipment vs. ASP YoY in 2026-28E
Exhibit 12: x86 server shipment vs. ASP YoY in 2021-25A and 1Q26A
Source: Goldman Sachs Global Investment Research
Source: IDC
CSP capex: Regarding customer spending, our US internet team forecasts that leading US cloud service providers (CSPs) in aggregate will grow their capex budgets by 84%/ 52%/ 13% YoY in 2026-28E, with our estimates being raised by 4% / 17% / 22% in 2026-28E to US$1,397bn by 2028E. Within the China internet space, we expect leading e92c7a75ab8b4efbba794e6b187208c8
For the exclusive use of [讀者資訊已遮蔽]
Chinese cloud platforms to grow capex by 105%/ 21%/ 14% YoY in 2026-28E, with our estimates being raised by 14% / 15% / 11% in 2026-28E. The strong increase in CSP capex reflects the high memory costs and growing demand on AI workloads. In terms of capex structure, we estimate chipsets (GPU, ASIC, CPU) remain the major contributors, along with memory (HBM), and followed by networking and other components (e.g. cooling, power, chassis, rail kits, etc.). Compared to global CSPs, we estimate China CSP spending on chipsets would be more diversified across GPU and ASICs considering various local fabless suppliers and customers' varying demand on AI scenarios / tasks. Read more: Microsoft, Amazon, Meta, Alphabet, Oracle, Baba, Tencent, Baidu.
Key highlights on the recent Maia 300 announcement from MSFT: (1) Microsoft to expand its Azure Maia system to multi-gigawatt deployments, making Maia the primary inference system for Microsoft products and services, and (2) Microsoft plans to have multi-gigawatt Maia deployment beginning in 2027, with reports indicating a potential plan to deploy >1M Maia 300 chips in 2027 (Microsoft is covered by Gabriela Borges).
Exhibit 13: US CSP Capex trend
Exhibit 14: China CSP capex trend
Data include Microsoft, Amazon, Meta, Alphabet and Oracle. For Microsoft, we use capex incl. financial lease. In FY24, 50% of the capex of Microsoft was spent on land and 50% on AI/Cloud.
Source: Company data, Goldman Sachs Global Investment Research Data include Bytedance, Tencent, Alibaba, Baidu. We calculate Bytedance's (private) relevant operating metrics by analyzing the industry and companies that our China Internet team cover, and then extrapolating them to Bytedance.
Source: Company data, Goldman Sachs Global Investment Research e92c7a75ab8b4efbba794e6b187208c8
For the exclusive use of [讀者資訊已遮蔽]
Server TAM historical trend
Exhibit 15: Global servers value TAM: x86 vs non-x86
Exhibit 16: Global server value TAM: ODM Direct vs Global brand vs Chinese brand
Source: IDC, Bloomberg
Exhibit 17: Global servers value TAM: top six market share in 2025 / 1Q26
Source: IDC, Bloomberg
Exhibit 18: Taiwan ODM and Brand makers: last 12 months revenues YoY
Source: IDC, Bloomberg
Source: TEJ
Exhibit 19: Taiwan ODM and Brand makers revenues MoM: Aug 2026 vs Sep 2026
Exhibit 20: Taiwan AI component suppliers revenues MoM: Aug 2026 vs Sep 2026
Source: TEJ
Source: TEJ
e92c7a75ab8b4efbba794e6b187208c8
For the exclusive use of [讀者資訊已遮蔽]
PCs: Shipments -14% / -5%/ 0% YoY in 2026E-28E
Global PCs market opportunity
(Shipments in m units)
Our Bottom up method
Global PCs shipments =
sum of shipments by brands
Global PCs revenues =
Desktops ASP x shipments +
Notebooks ASP x shipments +
Workstations ASP x shipments
PCs shipments by region (2025) Workstations
PCs shipments growth by region Others
Western Europe YoY
| Shipments by product | 1Q25 2Q25 3Q25 4Q25 1Q26 2Q26E 3Q26E 4Q26E 2023 2024 2025 2026E 2027E 2028E | 1Q25 2Q25 3Q25 4Q25 1Q26 2Q26E 3Q26E 4Q26E 2023 2024 2025 2026E 2027E 2028E | 1Q25 2Q25 3Q25 4Q25 1Q26 2Q26E 3Q26E 4Q26E 2023 2024 2025 2026E 2027E 2028E | 1Q25 2Q25 3Q25 4Q25 1Q26 2Q26E 3Q26E 4Q26E 2023 2024 2025 2026E 2027E 2028E | 1Q25 2Q25 3Q25 4Q25 1Q26 2Q26E 3Q26E 4Q26E 2023 2024 2025 2026E 2027E 2028E | 1Q25 2Q25 3Q25 4Q25 1Q26 2Q26E 3Q26E 4Q26E 2023 2024 2025 2026E 2027E 2028E | 1Q25 2Q25 3Q25 4Q25 1Q26 2Q26E 3Q26E 4Q26E 2023 2024 2025 2026E 2027E 2028E | 1Q25 2Q25 3Q25 4Q25 1Q26 2Q26E 3Q26E 4Q26E 2023 2024 2025 2026E 2027E 2028E | 1Q25 2Q25 3Q25 4Q25 1Q26 2Q26E 3Q26E 4Q26E 2023 2024 2025 2026E 2027E 2028E | 1Q25 2Q25 3Q25 4Q25 1Q26 2Q26E 3Q26E 4Q26E 2023 2024 2025 2026E 2027E 2028E | 1Q25 2Q25 3Q25 4Q25 1Q26 2Q26E 3Q26E 4Q26E 2023 2024 2025 2026E 2027E 2028E | 1Q25 2Q25 3Q25 4Q25 1Q26 2Q26E 3Q26E 4Q26E 2023 2024 2025 2026E 2027E 2028E | 1Q25 2Q25 3Q25 4Q25 1Q26 2Q26E 3Q26E 4Q26E 2023 2024 2025 2026E 2027E 2028E | 1Q25 2Q25 3Q25 4Q25 1Q26 2Q26E 3Q26E 4Q26E 2023 2024 2025 2026E 2027E 2028E | 1Q25 2Q25 3Q25 4Q25 1Q26 2Q26E 3Q26E 4Q26E 2023 2024 2025 2026E 2027E 2028E |
|---|---|---|---|---|---|---|---|---|---|---|---|---|---|---|---|
| Global PCs shipments (m units) | 66 | 68 | 61 | 63 | 63 | 260 | 269 | 297 | 255 | 243 | 244 | 244 | |||
| Desktops | 18 | 72 19 | 79 22 | 81 23 | 18 | 16 | 17 | 17 | 72 | 72 | 84 | 69 | 62 | 61 | 61 |
| Notebooks | 46 | 50 | 54 | 55 | 47 | 43 | 44 | 44 | 181 | 188 8 | 205 | 178 | 173 | 176 | 176 |
| Workstations YoY | 2 8% | 2 10% | 2 11% | 2 12% | 2 3% | 2 -15% | 2 -19% | 2 -22% | 7 -14% | 3% | 8 10% | 8 -14% | 7 -5% | 0% | 0% |
| Desktops | 10% | 12% | 19% | 19% | -2% | -16% | -23% | -26% | -16% | 0% | 15% | -18% | -10% | -3% | -3% |
| Notebooks | 9% | 9% | 8% | 10% | 4% | -15% | -18% | -20% | -13% | 4% | 9% | -13% | -3% -11% | 2% | 2% |
| Workstations Mix | -28% 100% | 5% 100% | 4% 100% | 11% 100% | 21% 100% | 4% 100% | -14% 100% | -24% 100% | -9% 100% | 21% 100% | -4% 100% | -4% 100% | 100% | 0% 100% | 0% 100% |
| Desktops | 28% | 27% | 28% | 29% | 27% | 27% | 27% | 27% | 28% | 27% | 28% | 27% | 26% | 25% | 25% |
| Notebooks | 69% | 70% | 69% | 68% | 70% | 70% | 70% | 70% | 70% | 70% | 69% | 70% | 71% | 72% | 72% |
| Workstations Revenues | 3% 1Q25 | 3% 2Q25 | 3% 3Q25 | 3% 4Q25 | 3% 1Q26 | 3% 2Q26E | 3% 3Q26E | 3% 4Q26E | 3% 2023 | 3% 2024 | 3% 2025 | 3% 2026E | 3% 2027E | 3% 2028E | 3% 2028E |
| by product Global PCs revenues (US$ m) | 60,032 | 65,945 | 73,876 | 76,757 | 68,768 | 61,822 | 65,214 | 65,622 | 222,164 | 240,238 | 276,610 | 261,426 | 255,904 | 262,519 | 262,519 |
| Desktops Notebooks | 13,251 42,735 | 13,959 47,789 | 15,930 53,513 | 16,602 | 14,152 48,862 | 12,775 44,275 | 13,421 47,659 | 13,302 48,126 | 49,894 157,767 | 50,658 173,821 | 59,742 199,144 | 53,650 188,922 | 50,004 188,852 | 51,745 193,513 | 51,745 193,513 |
| Workstations | 4,046 | 4,197 | 4,433 | 55,107 5,048 | 5,753 | 4,772 | 4,135 | 4,195 | 14,503 | 15,759 | 17,724 | 18,855 | 17,048 | 17,261 | 17,261 |
| YoY | 15% | -6% | -2% | ||||||||||||
| 1Q25 | 17% | 13% 3Q25 | 15% | 15% | -12% 3Q26E | -15% 4Q26E | -16% 2023 | 8% 2024 | 15% 2025 | -5% | 2027E | 3% 2028E | 3% 2028E | ||
| Shipments by vendor Global PCs shipments (m units) | 66 | 2Q25 72 | 79 | 4Q25 81 | 1Q26 68 | 2Q26E 61 | 63 | 63 | 260 | 269 | 297 | 2026E 255 | 243 | 244 | 244 |
| Lenovo HP | 15 13 | 17 | 19 | 19 | 16 | 16 | 18 11 | 18 | 59 54 | 62 | 70 | 68 47 | 73 46 | 76 47 | 76 47 |
| Dell Apple | 10 | 14 9 | 14 9 | 15 11 | 12 9 | 12 9 | 8 | 12 8 | 37 | 54 39 | 56 39 | 34 | 31 | 31 | 31 |
| ASUS | 6 4 | 6 5 | 7 6 | 7 5 | 6 4 | 7 4 | 8 5 | 8 4 | 22 17 | 23 18 | 26 19 | 29 18 | 33 19 | 34 19 | 34 19 |
| Samsung | 2 | 2 | 2 | 2 | 2 | 2 | 2 | 2 | 8 | 8 | 6 | 7 | 7 | ||
| Microsoft | 0 | 0 | 0 | 0 | 0 | 0 | 0 | 0 | 2 | 1 | 8 | 1 | 7 1 | 1 | 1 |
| LG | 0 | 0 | 0 | 0 | 0 | 0 | 0 | 0 | 1 | 1 | 1 1 | 1 | 1 | 1 | 1 |
| Xiaomi Others | 0 16 | 0 | 0 22 | 0 21 | 0 18 | 0 10 | 0 11 | 0 11 | 1 60 | 1 62 | 1 | 1 | 1 | 1 27 | 1 27 |
| YoY | 8% | 18 10% | 11% | 12% | 3% | -15% | -19% | -22% | -14% | 3% | 77 10% | 50 | 32 | 0% | 0% |
| Global market share Lenovo | 100% | 100% | 100% | 100% | 100% | 100% | 100% | 100% | 100% | 100% | 100% | -14% 100% | -5% 100% | 100% 31% | 100% 31% |
| 23% 20% | 24% 19% | 24% | 23% 19% | 23% | 27% | 29% 18% | 28% 19% | 23% 21% | 23% | 24% | 27% 19% | 30% 19% | 19% | 19% | |
| HP Dell | 14% | 12% | 17% 12% | 13% | 17% 14% | 20% 14% | 13% | 12% | 14% | 20% 15% | 19% 13% | 13% | 13% | 13% | 13% |
| Apple | 9% | 9% | 9% | 9% | 9% | 11% | 12% | 13% | 8% 6% | 9% 7% | 9% | 11% 7% | 14% | 14% | 14% |
| ASUS | 6% 3% | 6% 3% | 7% 3% | 6% 2% | 6% | 7% 3% | 8% 3% | 7% 3% | 3% | 3% | 6% 3% | 3% | 8% 3% | 8% 3% | 8% 3% |
| Samsung Microsoft | 1% | 0% | 0% | 2% | 0% | 1% | 1% | 1% | 0% | 0% | 0% | 0% | 0% | ||
| LG | 0% | 0% | 0% 0% | 0% | 1% 0% | 0% | 0% | 0% | 0% | 0% | 0% | 0% | 0% | ||
| Xiaomi | 0% | 0% 0% | 0% | 0% | 0% | ||||||||||
| 0% | 0% | 0% | 0% | 0% | 0% | 0% | |||||||||
| Others | 24% | 0% | |||||||||||||
| ASP | 0% | 0% | 16% | 17% | 17% | 23% | 0% | 0% | |||||||
| 26% 2Q25 | 26% | 27% | 2023 | 23% 2024 | 26% 2025 | 20% 2026E | 13% 2027E | 11% 2028E | 11% 2028E | ||||||
| Global PC ASP (US$) YoY AI PCs | 1Q25 911 7% 1Q25 | 919 7% 2Q25 | 28% 3Q25 941 3% 3Q25 | 4Q25 953 2% 4Q25 | 1Q26 1,013 11% 1Q26 | 2Q26E 1,011 10% 2Q26E | 3Q26E 1,031 10% 3Q26E 4Q26E | 4Q26E 1,044 9% | 854 -2% 2023 2024 | 893 5% | 933 4% 2025 | 1,025 10% 2026E | 1,055 3% 2027E | 1,077 2% 2028E | 1,077 2% 2028E |
| AI PC shipment (m units) YoY Penetration AI PC revenues (US$ m) | 18 27% 20,591 | 23 89% 32% 26,573 68% | 30 67% 39% 31,586 50% | 37 71% 46% 40,062 53% | 35 93% 51% 39,660 93% | 36 58% 59% 40,592 53% | 39 29% 62% 43,532 38% | 40 9% 64% 45,044 12% | 52 19% 62,898 | 108 109% 36% 118,811 89% | 150 39% 59% 168,828 42% | 175 17% 72% 194,672 15% | 82% 220,737 | 82% 220,737 | |
| YoY Penetration | 40% | 52% | 58% | 66% | 67% | 69% | 26% | 43% | 65% | 76% | 13% | 13% | |||
| Gaming PCs | 34% 7 | 2Q25 | 43% | 4Q25 | 1Q26 7 | 2Q26E | 3Q26E | 4Q26E | 2023 | 2025 31 | 2026E 26 | 2027E 27 | 84% 2028E | 84% 2028E | |
| Gaming PC shipment (m | 1Q25 | 8 | 3Q25 9 | 8 15% | 0% | 6 | 7 -22% | 6 | 2024 28 | 13% | -17% | 2% | 28 6% | 28 6% | |
| units) YoY Penetration | 9% 10% 10,531 | 16% 12,131 | 13% 11% 13,521 | 11% | 10% 12,073 | -18% 10% 11,139 | 11% 11,693 | -25% 10% 10,964 | 40,518 | 10% | 52,186 | 52,186 | |||
| Gaming PC revenues (US$ | 11% | 13,219 23% | -14% | 10% | 11% 22% | 11% 48,470 6% | 12% | 12% | |||||||
| m) YoY | 19% | 27% 18% | 20% | 17% | 15% 18% | -8% 18% | 18% | -17% 17% | 17% | 49,401 18% | 45,869 -7% 18% | 19% | 8% | 8% | |
| Penetration Shipments by markets Global PCs shipments (m units) | 18% 1Q25 62 | 2Q25 67 | 18% 3Q25 77 | 4Q25 78 | 1Q26 66 | 2Q26E 59 | 3Q26E 62 | 4Q26E 61 | 2023 253 | 2024 256 | 2025 284 | 2026E 247 | 2027E | 20% 2028E 237 | 20% 2028E 237 |
| Consumer PCs | 27 | 29 38 | 35 43 | 24 42 | 26 33 | 31 30 | 31 30 | 118 135 | 118 137 | 127 157 | 111 136 | 236 114 122 | 117 120 | 117 120 | |
| Commercial PCs | 36 | -12% | -14% | -5% | |||||||||||
| YoY Consumer PCs | 35 | 7% | 41 | -12% | -22% -12% | -15% | 1% 0% | 11% | 3% | ||||||
| Commercial | 6% | 13% | 16% | 6% -12% | -11% | -20% -12% -26% | -30% | -13% | -13% -12% | 0% 3% | 0% 3% | ||||
| PCs | 4% | 9% | 8% | 7% | 100% | 100% | 100% | 7% | |||||||
| Mix Consumer PCs | 8% 100% | 6% 100% | 18% 100% | 24% 100% | 20% 100% | 43% | 51% | 50% | 100% 47% | 2% 100% | 14% 100% 45% | -13% 100% | -11% 100% | -2% 49% | -2% 49% |
| Commercial PCs | 43% 57% | 44% 56% 2Q25 | 47% 53% | 45% 55% 4Q25 | 36% 64% | 57% 2Q26E | 49% 3Q26E | 50% 4Q26E | 53% 2023 | 46% 54% 2024 | 55% 2025 | 45% 55% 2026E | 48% 52% 2027E | 100% 51% | 100% 51% |
| Shipments by region Asia/Pacific (ex. Japan) | 1Q25 9 | 10 | 3Q25 13 | 10 12 | 1Q26 9 8 | 9 | 12 | 9 10 | 42 41 | 40 40 | 43 42 | 38 | 2028E 40 | 2028E 40 | |
| China | 9 | 10 | 6 | 4 | 9 4 | 10 5 | 14 | 20 | 38 19 | 39 19 | 39 19 | ||||
| Japan | 5 | 5 | 11 5 | 12 | |||||||||||
| USA | 18 | 15 | 15 | 5 15 | 64 | 66 | 38 19 63 | 39 46 | 65 | 65 | |||||
| Western | 16 | 12 | 17 13 | 17 14 | 11 | 10 | 15 12 | 13 | 44 | 45 | 68 49 | 61 46 | |||
| Europe Rest of World YoY | 11 12 | 13 | 14 | 19 | 18 | 11 | 9 | 9 -12% | 50 | 51 | 58 | 46 | 30 | 47 26 | 47 26 |
| Asia/Pacific (ex. Japan) | -5% | 2% | -3% -5% | -12% -11% | -12% -13% | -6% | 7% | 2% 2% | |||||||
| China | 6% | 12% | 14% 2% 47% | 16% 1% | -21% -15% | -10% -11% -7% | 5% | 3% 3% | 3% 3% | ||||||
| Japan USA | 55% 1% | 0% | 50% 0% | -3% -3% | -10% -15% | -13% -8% -12% | -2% 14% 3% | 2% 3% | 2% 3% | ||||||
| -3% | -8% -12% -8% | -13% | 4% | 15% | 1% | ||||||||||
| Western Europe Rest of World | 36% 15% 3% 0% | 8% 6% | 11% 9% | 15% 41% | 42% | -10% -9% | -8% -39% | -55% | -3% -14% -9% | 1% | 47% 3% 10% | -11% -7% -21% | 1% -34% | 1% -34% | -13% |
Shipments by markets do not include workstations.
Source: Company data, Goldman Sachs Global Investment Research
e92c7a75ab8b4efbba794e6b187208c8
For the exclusive use of [讀者資訊已遮蔽]
Smartphones: Shipments -10% / +2%/ +2% YoY in 2026-28E
Global Smartphone market opportunity
| (Shipments in m units) | Shipments by vendor | 1Q25 | 2Q25 | 3Q25 | 4Q25 | 1Q26 | 2Q26 | 3Q26E | 4Q26E | 2023 | 2024 | 2025 | 2026E | 2027E | 2028E | 2028E | 2028E | 2028E | 2028E | 2028E |
|---|---|---|---|---|---|---|---|---|---|---|---|---|---|---|---|---|---|---|---|---|
| (Revenues in m USD) | Global shipments | 303 | 297 | 326 | 338 | 294 | 276 | 281 54 | 288 71 | 1,164 | 1,237 | 1,264 | 1,140 | 1,162 242 | 1,182 247 | 1,182 247 | 1,182 247 | 1,182 247 | 1,182 247 | 1,182 247 |
| Apple Samsung | 59 61 | 48 58 | 60 61 | 85 61 | 61 62 | 56 63 | 64 | 61 | 234 226 | 233 224 | 252 242 | 242 250 | 255 | 260 | 260 | 260 | 260 | 260 | 260 | |
| Xiaomi | 42 | 42 | 43 | 38 23 | 34 | 31 | 31 | 28 | 146 95 | 168 107 | 165 98 | 124 81 | 124 100 | 128 | 128 | 128 | 128 | 128 | 128 | |
| Our Bottom up method | Transsion Lenovo | 21 13 | 25 14 | 29 16 | 16 | 21 14 | 19 13 | 20 14 | 21 12 | 47 | 56 | 47 | 113 47 | 113 47 | 53 | 59 | 113 47 | 113 47 | ||
| Global smartphone | ZTE | 3 | 3 | 3 | 3 | 3 | 3 | 3 | 3 | 6 | 7 1 | 12 1 | 12 1 | 12 1 | 12 | 12 | 12 | 12 | 12 | 12 |
| shipments = sum of shipment | Sony HTC | 0 0.0 | 0 0.0 | 0 | 0 0.0 | 0 0.0 | 0 0.0 | 0 0.0 | 0 0.0 | 2 0 | 0 | 0 | 0 | 1 0 | 1 0 | 1 0 | 0 | 1 0 | 1 0 | |
| by brand | Asus | 0.1 | 0.0 | 0.0 0.0 | 0.0 | 0.1 | 0.1 | 0.1 | 0.1 | 0 | 0 | 0 | 0 | 0 | 0 | 0 | 0 | 0 | 0 | |
| Others Shipments YoY | 103 1Q25 | 106 2Q25 | 114 3Q25 | 112 4Q25 | 98 1Q26 | 91 2Q26 | 95 3Q26E | 93 4Q26E | 409 2023 | 440 2024 | 377 2026E | 381 2027E | 374 2028E | 374 2028E | 374 2028E | 374 2028E | 374 2028E | 374 2028E | ||
| Global smartphone revenues = sum of revenues | Global | 1% | 2% | 4% | 3% | -3% | -7% | -14% | -15% | -3% | 6% | -10% | 2% | 2% | 2% | 2% | 2% | 2% | 2% | |
| by brand | Apple Samsung | 12% 2% | 6% 7% | 4% 7% | 9% 18% | 3% 2% | 15% 8% | -9% 5% | -17% -1% | 4% -14% | -1% -1% | 8% 8% | -4% 4% | 0% 2% | 2% 2% | 2% 2% | 2% 2% | 2% 2% | 2% 2% | 2% 2% |
| Xiaomi | 3% | 0% | 1% | -12% | -19% | -26% | -29% | -25% | -5% | 16% | -25% | 0% | 3% | 3% | 3% | 3% | 3% | 3% | ||
| Global smartphone | Transsion | -26% 2% | -2% 2% | 13% 5% | -16% | -1% | -24% | -31% -12% | -8% -28% | 31% 4% | 13% 20% | -8% 5% | -18% | 24% | 13% | 13% | 13% | 13% | 13% | 13% |
| revenues = shipments x ASP | Lenovo | 37% | 12% | 6% 0% | -4% 0% | 0% | 3% | 28% | 0% | -10% | -12% | 1% | 1% | 1% | 1% | 1% | 1% | |||
| ZTE Sony | 102% -42% | 97% -22% | -66% | 46% -15% | -21% | -41% | 0% -21% | -21% | -38% | -32% | 65% -38% | -28% | 0% -5% | 0% 0% | 0% 0% | 0% 0% | 0% 0% | 0% 0% | 0% 0% | |
| Smartphone shipments | HTC Asus | 69% | -6% | -50% | -44% | -62% | -60% | 141% 116% | 128% 199% | 27% -33% | -45% -18% | -13% -48% | 3% | 36% | 0% | 0% | 0% | 0% | 0% | 0% |
| by | Others | -30% -1% | -45% | -51% | -75% | -36% | 9% | -17% | -17% | -7% | 8% | -1% | 26% | 1% | 0% | 0% | 0% | 0% | 0% | 0% |
| brands (2024) | Shipments market share | 1Q25 | -3% 2Q25 | 0% 3Q25 | -1% 4Q25 | -4% 1Q26 | -14% 2Q26 | 3Q26E | 4Q26E | 2023 | 2024 | 2026E | -13% | 1% 2027E | -2% 2028E | -2% 2028E | -2% 2028E | 2025 | -2% 2028E | -2% 2028E |
| Apple Others 35% | Apple | 20% | 16% | 18% | 25% | 21% | 20% | 19% | 24% | 20% | 19% | 20% 19% | 21% | 21% | 21% | 21% | 21% | 21% | 21% | 21% |
| 19% | Samsung | 20% | 20% | 19% | 18% | 21% | 23% | 23% | 21% | 19% 13% | 18% | 22% | 22% | 22% | 22% | 22% | 22% | 22% | 22% | |
| Xiaomi | 14% 7% | 14% 8% | 13% 9% | 11% 7% | 12% 7% | 11% 7% | 11% 7% | 10% 7% | 8% | 14% 9% | 11% | 11% | 11% 10% | 11% 10% | 11% 10% | 11% 10% | 11% 10% | 11% 10% | ||
| Samsung | Transsion | 5% | 5% | 5% | 4% | 4% | 5% | 13% | 7% | 9% | 4% | 4% | 4% | 4% | 4% | 4% | ||||
| 18% | Lenovo ZTE | 4% 1% | 5% 1% | 1% | 5% 1% | 1% | 1% | 5% 1% | 1% | 0% | 1% | 8% 5% 1% | 5% 1% | 4% | 1% | 1% | 1% | 1% | 1% | 1% |
| Xiaomi 14% Transsion Lenovo 4% | Sony HTC | 0% 0% | 0% 0% | 0% 0% | 0% 0% | 0% 0% | 0% 0% | 0% 0% | 0% 0% | 0% 0% | 0% 0% | 0% 0% | 0% 0% | 0% 0% | 0% 0% | 0% 0% | 0% 0% | 0% 0% | 0% 0% | 0% 0% |
| 9% | Asus Others | 0% 34% | 0% 36% | 0% 35% | 0% 33% | 0% 34% | 0% 33% | 0% 34% | 0% 32% | 0% 35% | 0% 36% | 0% | 0% 33% | 0% 32% | 0% 32% | 0% 32% | 0% 32% | 0% 32% | 0% 32% | |
| Developed markets YoY | Shipments by price band Premium (Above US$600) | 1Q25 29% | 2Q25 | 3Q25 | 4Q25 34% | 1Q26 30% | 2Q26 25% | 3Q26E 32% | 4Q26E 40% | 2023 28% | 2024 | 2026E | 33% | 2027E 33% | 2028E 34% | 2028E 34% | 2028E 34% | 2028E 34% | 2028E 34% | 2028E 34% |
| 1% | Mid-end (US$200-600) US$200) | 30% | 24% 33% 44% | 28% 29% | 27% | 31% | 32% | 22% | 18% | 31% 44% | 27% 29% | 32% 26% 42% | 26% | 24% | 24% | 24% | 24% | 24% | 42% | |
| -2% -1% -4% | Entry level (Below Revenus by vendor Global revenues | 42% 1Q25 135,893 | 2Q25 121,581 | 43% 3Q25 143,664 | 39% 4Q25 174,953 | 39% 1Q26 152,488 | 43% 2Q26 139,378 | 45% 3Q26E 155,386 | 42% 4Q26E 176,335 | 42% 2023 520,767 | 2024 537,641 | 2026E 623,588 305,038 | 42% 2027E 655,274 327,871 | 674,090 337,358 | 674,090 337,358 | 674,090 337,358 | 674,090 337,358 | 674,090 337,358 | 674,090 337,358 | |
| -7% 2023 2024 2025 2026E2027E | Apple Samsung Xiaomi | 59,982 28,658 | 49,179 24,514 8,727 | 61,539 29,064 9,411 | 98,704 23,470 9,078 | 69,436 31,337 8,546 | 62,294 27,435 7,943 | 72,151 31,133 | 101,157 23,667 8,540 | 244,908 102,181 32,183 | 245,107 | 113,572 33,874 11,093 | 112,765 | 117,727 37,793 | 117,727 37,793 | 117,727 37,793 | 117,727 37,793 | 117,727 37,793 | 117,727 37,793 | |
| US YoY | Transsion | 9,398 2,451 | 2,864 | 2,905 | 8,844 | 97,604 36,477 | 35,899 14,115 | 36,614 | ||||||||||||
| 2,950 | 3,424 | 2,648 | 3,916 | 4,041 | 2,609 | 2,715 3,974 | 11,493 11,608 | 12,615 13,661 | 16,791 | 16,348 | 16,348 | 16,348 | 16,348 | 16,348 | 16,348 | |||||
| 0% 0% | Lenovo ZTE | 3,187 450 | 3,469 466 | 3,725 | 4,193 | 4,860 | 436 | 1,110 | 1,711 | 15,939 | 17,520 1,694 | 17,520 1,694 | 17,520 1,694 | 17,520 1,694 | 17,520 1,694 | 17,520 1,694 | ||||
| -2% | Sony | 116 | 265 | 497 | 441 | 408 79 | 376 | 492 89 | 107 | 1,089 1,219 | 893 | 14,574 1,854 617 | 469 | 1,694 446 | 460 | 460 | 460 | 460 | 460 | 460 |
| HTC | 4 | 4 | 107 2 | 128 2 | 2 | 194 1 | 5 51 | 13 | 17 | 16 | 16 | 16 | 16 | 16 | 16 | |||||
| Asus | 69 | 40 | 20 | 18 | 42 | 5 42 | 27 317 | 16 | ||||||||||||
| -7% -5% 2023 2024 2025 2026E | Others Revenues by price | 31,579 | 31,967 | 35,875 | 36,271 | 42 35,859 | 35,162 | 35,682 4Q26E | 115,741 | 283 129,876 | 13 148 135,692 2025 | 176 140,851 | 170 146,358 | 161 145,011 | 161 145,011 | 161 145,011 | 161 145,011 | 161 145,011 | 161 145,011 | |
| China YoY 2027E | band Premium (Above US$600) | 1Q25 67% | 2Q25 60% | 3Q25 66% 22% | 4Q25 71% | 1Q26 63% | 34,148 2Q26 55% | 3Q26E 64% | 74% | 2023 65% | 2024 65% 22% | 2026E 64% | 2027E 66% 25% | 2028E 70% | 2028E 70% | 2028E 70% | 66% | 2028E 70% | 2028E 70% | |
| 6% 0% | Mid-end (US$200-600) Entry level (Below US$200) Shipments by region | 21% 12% | 27% 13% 2Q25 | 12% 3Q25 | 20% 9% 4Q25 | 28% 10% | 34% 11% | 26% 10% 3Q26E | 18% 8% 4Q26E | 22% 12% | 13% 2024 | 22% 11% 2025 | 26% 10% 2026E | 9% | 21% 9% 2028E | 21% 9% 2028E | 21% 9% 2028E | 21% 9% 2028E | 21% 9% 2028E | 21% 9% 2028E |
| 0% 0% - | Global shipments Developed markets | 1Q25 303 | 297 | 326 67 | 338 | 1Q26 294 | 2Q26 276 | 281 64 | 288 78 | 2023 1,164 276 | 1,237 270 | 1,264 268 | 1,140 256 | 2027E 1,162 257 | 1,182 259 | 1,182 259 | 1,182 259 | 1,182 259 | 1,182 259 | 1,182 259 |
| -5% | 62 30 | 56 25 | 33 | 82 41 | 60 28 | 54 23 22 | 31 | 39 28 | 131 | 128 102 | 122 96 | 122 97 | 122 98 | 122 98 | 122 98 | 122 98 | 122 98 | 122 98 | ||
| -9% | USA Western Europe BRICs | 24 | 23 125 | 24 | 29 135 | 23 115 | 113 | 120 | 106 479 | 512 151 | 128 100 | 467 | 475 | 475 | 475 | 475 | 475 | 475 | ||
| India China | 124 33 | 38 | 135 48 | 38 | 28 | 32 | 23 119 41 | 35 | 146 | 518 156 | 136 | 473 142 | 142 | 142 | 142 | 142 | 142 | 142 | ||
| BRICs YoY | Rest of emerging markets Shipments YoY | 72 116 1Q25 | 69 117 2Q25 | 68 124 3Q25 | 76 121 | 69 120 1Q26 | 65 110 | 61 98 | 65 90 4Q26E | 271 409 2023 | 286 456 2024 | 285 478 2025 | 261 417 | 259 432 2027E | 260 448 2028E | 260 448 2028E | 260 448 2028E | 260 448 2028E | 260 448 2028E | 260 448 2028E |
| 7% 1% | Global Developed markets | 2% -2% | 4% 1% | 4Q25 3% 1% | -3% -4% | 2Q26 -7% -4% | 3Q26E | -15% -5% | -3% -7% | 6% -2% | 2026E -10% | |||||||||
| USA | 1% -4% | -1% | 2% | 2% | -5% | -5% | -14% -4% -5% | -5% | -7% | -2% | 2% -1% 0% | -4% -5% | 2% 1% 0% | 2% 1% 0% | 2% 1% 0% | 2% 1% 0% | 2% 1% 0% | 2% 1% 0% | 2% 1% 0% | |
| -4% 1% | Western Europe BRICs | -3% -5% | -3% 1% | -1% | -1% 1% | -4% -7% | -4% -9% | -4% | -4% -8% | -6% | -3% 4% | -2% 1% 3% | -4% | 1% 1% 4% | 1% 0% | 1% 0% | 1% 0% | 1% 0% | 1% 0% | |
| -10% | India China | 0% -5% | 8% -4% | 3% | 3% | -15% | -12% | -11% -14% | -4% | 7% 6% | -10% -13% | |||||||||
| 2023 2024 2025 2026E | Rest of | 3% 3% | 6% 0% | -1% | -4% | -15% -6% -6% | -15% -11% | -26% | 1% -5% 0% | 11% | 0% | -9% | 0% 4% | 0% 0% 4% | 0% 0% 4% | 0% 0% 4% | 0% 0% 4% | |||
| 2027E | emerging markets Shipments market share | 4% | 6% | 6% | 3% | -21% | 4Q26E | 5% 2025 | -13% | |||||||||||
| 1Q25 | 2Q25 100% | 3Q25 100% | 4Q25 100% 24% | 1Q26 100% 20% | 2Q26 100% | 3Q26E 100% | 100% | 2023 100% | 2024 100% | 2026E 100% 22% | 2027E 100% 22% | 2028E 100% 22% 10% | 2028E 100% 22% 10% | 2028E 100% 22% 10% | 2028E 100% 22% 10% | 2028E 100% 22% 10% | 2028E 100% 22% 10% | 2028E 100% 22% 10% | ||
| Rest of emerging mkt YoY | Global Developed markets USA | 100% 21% 10% | 19% 8% | 21% 10% | 12% | 10% | 23% 11% | 27% 14% | 24% 11% | 22% 10% | 100% 21% 10% | 11% | ||||||||
| 11% 5% | Western Europe | 8% | 8% | 7% | 9% | 8% | 19% 8% 8% | 8% | 10% | 8% | 8% | 10% | 8% | 8% | 8% | 8% | 8% | 8% | ||
| BRICs India | 41% 11% | 42% | 41% | 40% | 39% | 41% 12% | 42% 14% | 42% | 9% 41% | 41% | 8% 41% | 8% 41% | ||||||||
| 0% | 13% | 15% 21% | 11% | 9% | 12% 23% | 12% | 12% 23% | 12% 23% | 41% 12% 23% | 12% 22% | 40% 12% 22% | 40% 12% 22% | 40% 12% 22% | 40% 12% 22% | 40% 12% 22% | |||||
| -13% 4% | China Rest of | 24% 38% | 23% 39% 2Q25 | 38% 3Q25 | 22% 36% 4Q25 | 23% 41% 1Q26 | 24% 40% | 22% 35% | 31% 4Q26E | 23% 35% 2023 | 37% 2024 | 38% 2025 20.2 | 37% 2026E 35.0 | 37% 2027E 66.1 | 38% 2028E 76.6 | |||||
| 2023 2024 2025 2026E2027E | emerging markets Foldable phones Shipment | 1Q25 4.2 | 3.3 | 8.0 | 4.7 | 3.5 | 2Q26 3.0 | 3Q26E 13.2 | 15.4 | 18.2 | 18.7 1.5% | 5.7% | 6.5% | 6.5% | 6.5% | 6.5% | 6.5% | 6.5% | 6.5% | |
| Penetration rate Xiaomi Transsion | 1.4% 0.1 | 1.1% 0.1 0.0 | 2.4% 0.1 | 1.4% 0.1 | 0.1 | 1.1% 0.0 | 4.7% 0.2 | 5.3% 0.1 | 0.8 | 1.6% 0.5 0.1 | 0.8 1.5 | 3.1% 0.5 | 1.0 | 1.0 | 1.0 | 1.0 | ||||
| 0.0 | 0.0 | 1.2% 0.0 0.5 0.8 - | 0.0 | 0.0 | 1.6% 0.3 0.1 1.2 | 4.6 | 1.9 | 1.9 | 1.9 | 1.9 | 1.9 | 1.9 | 1.9 | 1.9 | 1.9 | |||||
| Lenovo Samsung | 0.8 0.5 | 0.6 0.4 | 0.6 | 0.0 0.7 1.4 | 0.5 0.5 | 0.9 | 0.0 0.7 | 10.0 | 0.2 2.7 6.4 | 2.7 7.0 | 0.1 2.7 7.1 13.3 | 7.7 10.0 | 8.3 32.6 | 36.1 | 36.1 | 36.1 | 36.1 | |||
| Apple Others | - 2.8 | - 2.2 | 4.8 - 2.5 | - - 3.9 6.5 10.0 | 2.0 | - 1.9 | 4.0 4.5 3.5 | 1.8 - 8.8 2.5 | - 8.7 | 1.8 - 8.8 2.5 | 1.8 - 8.8 2.5 | 1.8 - 8.8 2.5 | 1.8 - 8.8 2.5 | 1.8 - 8.8 2.5 | 1.8 - 8.8 2.5 | 11.3 | 1.8 - 8.8 2.5 | 18.3 | 19.9 |
Source: Company data, Goldman Sachs Global Investment Research
e92c7a75ab8b4efbba794e6b187208c8
For the exclusive use of [讀者資訊已遮蔽]