PDF 原檔:報告_GS_光通訊_20260811_original.pdf
內容說明
GS 光通訊政策風險分析:美國川普政府擬透過 FCC 立法限制中國製光模組進口美國,本篇整理三大投資人爭論(既有龍頭為何持續拿單/產能與成本效率/產地分散)。GS 對其「中國光通訊覆蓋(China optical coverage)」名單 FOCI、RoboTechnik、Landmark、Eoptolink、VPEC 全數維持 Buy。該名單 5 家中有 3 家是台股掛牌:FOCI=上詮 3363.TWO、Landmark=聯亞光電 3081.TWO、VPEC=全新 2455.TW;RoboTechnik=罗博特科 300757.SZ、Eoptolink=新易盛 300502.SZ 為中國掛牌(代號依 GS 自家 報告_GS_AI光網路_20260417 核對)。「China optical coverage」是 GS 大中華區覆蓋團隊的分類標籤,不是產地或中資判定,照字面解讀會誤判三家台廠的政策曝險方向。投資解讀見 分析_美國中國光模組進口限制_政策風險三大爭論_GS_20260811。
圖片清單(已驗證 2026-08-11)
| 檔名 | size | 分類 | 親眼所見內容 |
|---|---|---|---|
260811_gs_optical-networking_001.png |
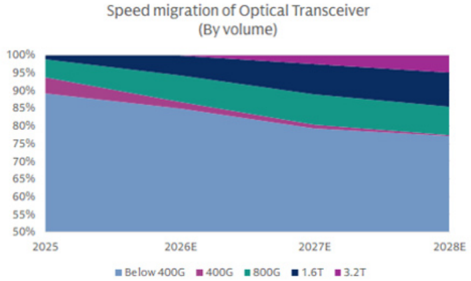
66KB | 真資料圖 | 堆疊面積圖「Speed migration of Optical Transceiver (By volume)」:Below 400G/400G/800G/1.6T/3.2T 出貨占比演進,橫軸 2025-2028E(Exhibit 1) |
260811_gs_optical-networking_002.png |
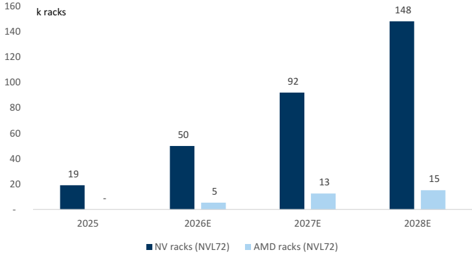
13KB | 真資料圖 | 長條圖「k racks」:NV racks (NVL72) vs AMD racks (NVL72) 出貨,2025/2026E/2027E/2028E 分別 19/50/92/148(NV)與 -/5/13/15(AMD)(Exhibit 3) |
260811_gs_optical-networking_003.png |
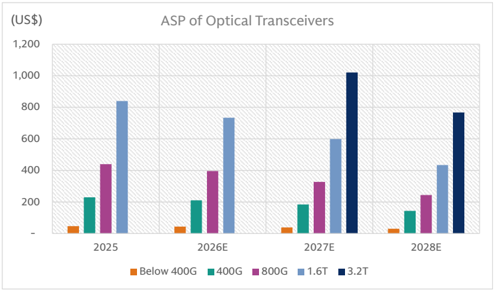
29KB | 真資料圖 | 分組長條圖「ASP of Optical Transceivers」:Below 400G/400G/800G/1.6T/3.2T 各世代 ASP(US$),2025-2028E(Exhibit 2) |
260811_gs_optical-networking_004.png |
26KB | 真資料圖 | 堆疊長條圖「Global server value TAM」(US\$mn):General servers/AI server racks (NVL72)/AI servers (8-GPU),2025-2028E,標示 2025-28E CAGR:一般伺服器 18%、AI server racks(NVL72) 118%、AI servers(8-GPU) 26%(Exhibit 4) |
四張圖尺寸均 <40KB,本次仍全數逐張 Read 驗證(非預設略過 logo);四張皆為與內文 Exhibit 1-4 對應的真資料圖,無裝飾/文字卡混入。
原始內容
Goldman
For the exclusive use of KEVINLU@LENOVO.COM
Research
Explore >
Optical Networking: Top 3 investor debates on impact of potential US import restrictions on Chinese optical transceiver modules
According to recent media reports (Link), the Trump administration is drafting a ban on US imports of Chinese data center components, with the Federal Communications Commission (FCC) working on measures to bar imports of Chinese made optical modules. Following this, three key debates have emerged in our investor conversations around the potential impact; mainly, why industry leaders continue to gain client traction, capacity and cost e ffi ciency implications, and production base diversi fi cation. While we take no view on any outcome, we remain positive on the industry leaders in our China optical coverage (FOCI, RoboTechnik, Landmark, Eoptolink, VPEC), given strong AI demand, tight raw material supply, and the rapid pace of technology migration leading customers to rely primarily on the existing leaders. Read more: Optical Networking thematic report, Optical module global TAM, Thailand / Vietnam tour top 6 takeaways.
In particular, the Chinese industry leaders have long experience working with CSP customers and the AI infrastructure supply chain, and we believe their early engagement with these customers better positions them to capture emerging changes in demand and the direction of product design well ahead of others. Early engagement is especially important given the various types of optical modules, their long development times, and that they continue to evolve across di ff erent speeds (e.g. 1.6T, 2.4T, 3.2T, etc.), form factors (e.g. pluggable, LPO, NPO, CPO, etc.), materials (e.g. SiPh, EML, Lithium Niobate, etc.), and fi ber types (e.g. single-mode, multi-mode, etc.), etc. The number and range of SKUs require strong R&D capabilities that further enhance the leaders' competitiveness. As a result, we expect the global leaders to extend their successful track record of launching the world's fi rst 400G (2018), 800G (2020), and 1.6T (2023) optical transceivers and see it strengthening as AI migration continues to build. Meanwhile, we see optical transceiver suppliers expanding manufacturing capacity in Thailand and other SEA regions in order to diversify supply chain risks and reduce the impact of macro uncertainties.
Buy ratings in optical networking: FOCI, RoboTechnik, Landmark, Eoptolink, VPEC.
Goldman Sachs does and seeks to do business with companies covered in its research reports. As a result, investors should be aware that the fi rm may have a con fl ict of interest that could a ff ect the objectivity of this report. Investors should consider this report as only a single factor in making their investment decision. For Reg AC certi fi cation and other important disclosures, see the Disclosure Appendix, or go to www.gs.com/research/hedge.html. Analysts employed by non-US a ffi liates are not registered/quali fi ed as research
Allen Chang
+852-2978-2930 | allen.k.chang@gs.com Goldman Sachs (Asia) L.L.C.
Verena Jeng
+852-2978-1681 | verena.jeng@gs.com Goldman Sachs (Asia) L.L.C.
Ting Song +852-2978-6466 | ting.song@gs.com Goldman Sachs (Asia) L.L.C.
e92c7a75ab8b4efbba794e6b187208c8
For the exclusive use of KEVINLU@LENOVO.COM
Key debates
- Why existing leaders continue to gain client traction? Fast technology migration, strong AI demand, tight raw material supply, and various SKUs requiring strong R&D capability
We believe it is di ffi cult for CSPs to diversify their AI server supply chains in an environment of rapid technology migration, strong AI demand, tight raw material supply, and high customization requirements across various SKUs. In our view, such a fast evolving technology environment only increases customers' reliance on existing leaders rather than reducing it, which adds to the di ffi culties in switching from existing leaders. As we highlighted in June (report link), global AI server racks continue to increase in complexity with ongoing changes in architecture, which would take new suppliers a longer time to prove their products' stability and re-align/integrate in the ecosystem, while working together with chipset suppliers, system providers, and other components suppliers to meet their quality and design speci fi cations.
- Capacity and Cost e ffi ciency? Besides strong R&D capability, existing leaders are also strong in capacity commitments, automated production, and manufacturing e ffi ciency
Seven out of the global top 10 optical module suppliers in terms of revenues are based in China and expanded market share in 2025 vs. 2024, echoing our positive view of the industry's increasing reliance on its existing leaders. Beside their strong R&D capabilities, we see these leaders are also strong in capacity commitments, automated production, and manufacturing e ffi ciency, resulting in fast product deployment at a competitive price. The leading global suppliers in optical modules for example, are not only expanding capacity substantially but are also diversifying production sites across di ff erent countries, and their self-designed production lines and proprietary equipment enable them to secure manufacturing e ffi ciencies and retain automated production know-how in house. Additionally, product speci fi cation upgrades toward 1.6T and above not only add di ffi culties in design but also in manufacturing, given that the size of optical modules is not increasing while at the same time requiring more fi bers / lasers per box to drive up the speed, adding di ffi culties to coupling and thermal dissipation. We believe the smaller vendors would take a longer time to reach the same level of manufacturing e ffi ciency given the fast evolving technology.
3. Production sites diversi fi cation? Diversifying production sites to SEA regions (e.g. Thailand) to reduce impact of macro uncertainties
Macro uncertainty is not a new news, and can date back to mid 2019 (geopolitical tension), 2020-2022 (the pandemic), and 2025 (additional tari ff increases). We see that the technology supply chain has responded over the last several years by diversifying production sites geographically in order to reduce macro uncertainty and, after starting the fi rst phase of mass production, continued to expand capacity. The leading suppliers are continuing to expand capacity at their production sites in Southeast Asia where they are able to produce high-end products (e.g. 1.6T optical modules), and also build capacity in other countries in order to further diversify their manufacturing base. Eoptolink, for example, is expanding phase 2 capacity in Thailand in 2026E with phase 1 already operating at full utilization rate.
e92c7a75ab8b4efbba794e6b187208c8
For the exclusive use of KEVINLU@LENOVO.COM
Global Optical module market opportunity
| US$m | 1Q25 | 2Q25 | 3Q25 | 4Q25 | 1Q26E | 2Q26E | 3Q26E | 4Q26E | 2025 | 2026E | 2027E | 2028E |
|---|---|---|---|---|---|---|---|---|---|---|---|---|
| Global Optical moduleTAM | Global Optical moduleTAM | Global Optical moduleTAM | Global Optical moduleTAM | Global Optical moduleTAM | Global Optical moduleTAM | Global Optical moduleTAM | Global Optical moduleTAM | Global Optical moduleTAM | Global Optical moduleTAM | Global Optical moduleTAM | Global Optical moduleTAM | Global Optical moduleTAM |
| GlobalTAM(US$m) | 6,570 | 7,969 | 9,607 | 10,066 | 10,142 | 12,047 | 12,770 | 15,925 | 34,211 | 50,883 | 72,593 | 69,135 |
| Below 400G | 4,195 | 4,315 | 4,286 | 4,031 | 4,077 | 4,432 | 4,283 | 4,093 | 16,827 | 16,886 | 16,166 | 13,196 |
| 400G | 1,804 | 1,023 | 950 | 432 | 359 | 422 | 523 | 441 | 4,209 | 1,745 | 969 | 287 |
| 800G | 571 | 2,120 | 2,902 | 3,725 | 2,706 | 3,457 | 3,557 | 3,810 | 9,318 | 13,530 | 14,715 | 10,761 |
| 1.6T | - | 511 | 1,469 | 1,877 | 3,000 | 3,736 | 4,406 | 7,581 | 3,857 | 18,722 | 27,403 | 23,264 |
| 3.2T | - | - | - | - | - | - | - | - | - | - | 13,340 | 21,625 |
| BySpeedMix | 100% | 100% | 100% | 100% | 100% | 100% | 100% | 100% | 100% | 100% | 100% | 100% |
| Below 400G | 64% | 54% | 45% | 40% | 40% | 37% | 34% | 26% | 49% | 33% | 22% | 19% |
| 400G | 27% | 13% | 10% | 4% | 4% | 4% | 4% | 3% | 12% | 3% | 1% | 0% |
| 800G | 9% | 27% | 30% | 37% | 27% | 29% | 28% | 24% | 27% | 27% | 20% | 16% |
| 1.6T | 0% | 6% | 15% | 19% | 30% | 31% | 35% | 48% | 11% | 37% | 38% | 34% |
| 3.2T | 0% | 0% | 0% | 0% | 0% | 0% | 0% | 0% | 0% | 0% | 18% | 31% |
| ByMaterialMix | 100% | 100% | 100% | 100% | 100% | 100% | 100% | 100% | 100% | 100% | 100% | 100% |
| SiPh | 14% | 24% | 32% | 36% | 38% | 40% | 42% | 48% | 28% | 43% | 56% | 62% |
| EML | 86% | 76% | 68% | 64% | 62% | 60% | 58% | 52% | 72% | 57% | 44% | 38% |
| 1Q25 2Q25 3Q25 4Q25 1Q26E 2Q26E 3Q26E 4Q26E 2025 2026E 2027E Global Optical module shipmentTAM | 1Q25 2Q25 3Q25 4Q25 1Q26E 2Q26E 3Q26E 4Q26E 2025 2026E 2027E Global Optical module shipmentTAM | 1Q25 2Q25 3Q25 4Q25 1Q26E 2Q26E 3Q26E 4Q26E 2025 2026E 2027E Global Optical module shipmentTAM | 1Q25 2Q25 3Q25 4Q25 1Q26E 2Q26E 3Q26E 4Q26E 2025 2026E 2027E Global Optical module shipmentTAM | 1Q25 2Q25 3Q25 4Q25 1Q26E 2Q26E 3Q26E 4Q26E 2025 2026E 2027E Global Optical module shipmentTAM | 1Q25 2Q25 3Q25 4Q25 1Q26E 2Q26E 3Q26E 4Q26E 2025 2026E 2027E Global Optical module shipmentTAM | 1Q25 2Q25 3Q25 4Q25 1Q26E 2Q26E 3Q26E 4Q26E 2025 2026E 2027E Global Optical module shipmentTAM | 1Q25 2Q25 3Q25 4Q25 1Q26E 2Q26E 3Q26E 4Q26E 2025 2026E 2027E Global Optical module shipmentTAM | 1Q25 2Q25 3Q25 4Q25 1Q26E 2Q26E 3Q26E 4Q26E 2025 2026E 2027E Global Optical module shipmentTAM | 1Q25 2Q25 3Q25 4Q25 1Q26E 2Q26E 3Q26E 4Q26E 2025 2026E 2027E Global Optical module shipmentTAM | 1Q25 2Q25 3Q25 4Q25 1Q26E 2Q26E 3Q26E 4Q26E 2025 2026E 2027E Global Optical module shipmentTAM | 1Q25 2Q25 3Q25 4Q25 1Q26E 2Q26E 3Q26E 4Q26E 2025 2026E 2027E Global Optical module shipmentTAM | 1Q25 2Q25 3Q25 4Q25 1Q26E 2Q26E 3Q26E 4Q26E 2025 2026E 2027E Global Optical module shipmentTAM |
| Global shipment (k units) | 98,631 | 101,929 | 103,907 | 98,580 | 103,818 | 114,888 | 113,138 | 120,425 | 403,046 | 452,269 | 528,286 | 556,429 |
| Below 400G | 89,489 | 92,054 | 91,433 | 85,999 | 91,563 | 99,529 | 96,186 | 97,013 | 358,975 | 384,292 | 419,238 | 428,689 |
| 400G | 7,845 | 4,448 | 4,129 | 1,880 | 1,673 | 1,968 | 2,439 | 2,214 | 18,301 | 8,295 | 5,268 | 2,007 |
| 800G | 1,297 | 4,819 | 6,596 | 8,466 | 6,666 | 8,514 | 8,760 | 10,243 | 21,178 | 34,183 | 44,993 | 44,047 |
| 1.6T | - | 608 | 1,749 | 2,235 | 3,916 | 4,877 | 5,753 | 10,955 | 4,591 | 25,500 | 45,719 | 53,525 |
| 3.2T | - | - | - | - | - | - | - | - | - | - | 13,067 | 28,162 |
| Mix | 100% | 100% | 100% | 100% | 100% | 100% | 100% | 100% | 100% | 100% | 100% | 100% |
| Below 400G | 91% | 90% | 88% | 87% | 88% | 87% | 85% | 81% | 89% | 85% | 79% | 77% |
| 400G | 8% | 4% | 4% | 2% | 2% | 2% | 2% | 2% | 5% | 2% | 1% | 0% |
| 800G | 1% | 5% | 6% | 9% | 6% | 7% | 8% | 9% | 5% | 8% | 9% | 8% |
| 1.6T | 0% | 1% | 2% | 2% | 4% | 4% | 5% | 9% | 1% | 6% | 9% | 10% |
| 3.2T | 0% | 0% | 0% | 0% | 0% | 0% | 0% | 0% | 0% | 0% | 2% | 5% |
| SiPh penetration rate | 4% 1Q25 | 5% 2Q25 | 7% 3Q25 | 8% 4Q25 | 8% 1Q26E | 9% 2Q26E | 10% 3Q26E | 13% 4Q26E | 6% 2025 | 10% 2026E | 15% 2027E | 18% 2028E |
| ASP (US$) | ASP (US$) | ASP (US$) | ASP (US$) | ASP (US$) | ASP (US$) | ASP (US$) | ASP (US$) | ASP (US$) | ASP (US$) | ASP (US$) | ASP (US$) | ASP (US$) |
| Byspeed(US$) | 71 | 81 | 94 | 97 | 103 | 116 | 111 | 141 | 85 | 113 | 137 | 124 |
| Below 400G | 50 | 48 | 47 | 44 | 47 | 48 | 43 | 43 | 47 | 44 | 39 | 31 |
| 400G | 234 | 130 | 214 | 105 | 191 | 252 | 266 | 181 | 230 | 210 | 184 | 143 |
| 800G | 456 | 1,635 | 602 | 565 | 320 | 519 | 418 | 435 | 440 | 396 | 327 | 244 |
| 1.6T | 2,416 | 1,073 | 1,342 | 954 | 904 | 1,318 | 840 | 734 | 599 | 435 | ||
| 3.2T | 3.2T | 3.2T | 3.2T | 3.2T | 3.2T | 3.2T | 3.2T | 3.2T | 3.2T | 3.2T | 3.2T | 768 |
| YoY | 45% | 44% | 18% | 45% | 33% | 22% | -10% | |||||
| Below 400G | -6% | 0% | -8% | -3% | -6% | -12% | -20% | |||||
| 400G | -18% | 93% | 25% | 72% | -9% | -13% | -22% | |||||
| 800G 1.6T | -30% | -68% | -31% -63% | -23% 23% | -10% -13% | -17% | -25% -27% | |||||
| 3.2T | -18% | -25% |
Source: Goldman Sachs Global Investment Research
e92c7a75ab8b4efbba794e6b187208c8
Wy 40<05
100%
95%
90%
85%
80%
75%
70%
65%
60%
55%
50%
2025
For the exclusive use of KEVINLU@LENOVO.COM
Speed migration of Optical Transceiver
Exhibit 1: Global Optical transceivers: 800G/ 1.6T/ 3.2T to account for 8%/ 10%/ 5% of the total transceiver volume by 2028E
Source: Goldman Sachs Global Investment Research
Exhibit 3: AI server racks global shipment by chipset platforms
Source: Goldman Sachs Global Investment Research
Exhibit 2: Global Optical transceivers: We assume an ASP decline YoY for like-for-like products
Source: Goldman Sachs Global Investment Research
Exhibit 4: Global server value TAM
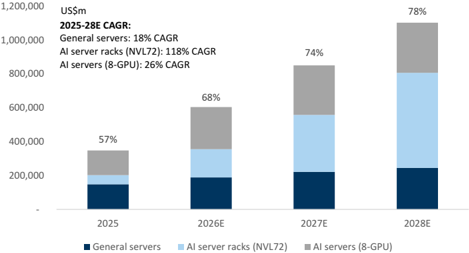
% in chart indicates AI server (8-GPU and NVL72) revenues mix
Source: Goldman Sachs Global Investment Research
e92c7a75ab8b4efbba794e6b187208c8
For the exclusive use of KEVINLU@LENOVO.COM