PDF 原檔:報告_Citi_旭隼6409_Initiation_20261013_original.pdf
圖片清單(已驗證 2026-10-14)
<40KB 圖未逐張 Read,僅依報告圖名標「未 Read」;ESG 以外之財務/股價/市場類圖不嵌 lib。
| 檔名 | size | 分類 | 親眼所見內容 |
|---|---|---|---|
報告_Citi_旭隼6409_Initiation_20261013_006.png |
134KB | 真資料圖(股價類) | 旭隼股價走勢(2018-01 至 2026-10,NT$),以紅框標註 2020-21、late 2022-2Q23、2024、2025-2026 四段行情與驅動因素文字 |
報告_Citi_旭隼6409_Initiation_20261013_007.png |
135KB | 真資料圖 | 兩座黑色直立機櫃照片:左櫃玻璃門/內部可見堆疊的黑色模組與底部電源模組、配線端子;右櫃前門含觸控顯示螢幕與透明窗(Citi 圖名 Figure 8,Voltronic power rack prototype) |
報告_Citi_旭隼6409_Initiation_20261013_008.png |
181KB | 真資料圖 | 展場拍攝三座黑色直立機櫃並排,各有小型顯示面板,右側機櫃內部可見多層模組,背景牆面可見 Voltr 字樣(Citi 圖名 Figure 9,Voltronic power rack prototype) |
報告_Citi_旭隼6409_Initiation_20261013_013.png |
42KB | 真資料圖(營收類) | Offline/Online UPS 銷售堆疊柱狀圖(NT$mn,2017-2028E)疊加兩者 YoY 折線,標註 2017-2028E CAGR:Online +9%、Offline +5% |
報告_Citi_旭隼6409_Initiation_20261013_020.png |
84KB | 真資料圖(財務類) | 左圖 ROE 趨勢(2018-2028E),右圖現金股利與配息率(2018-2028E) |
報告_Citi_旭隼6409_Initiation_20261013_025.png |
123KB | 真資料圖 | 兩台黑色桌上型 UPS 產品照,機身頂面有多孔插座與藍色顯示窗(Citi 圖名 Figure 33,Offline UPS) |
報告_Citi_旭隼6409_Initiation_20261013_026.png |
100KB | 真資料圖 | 四座黑色落地式模組化 UPS 機櫃並排(一座開門,內部可見多層電源模組),機櫃上有 LCD 顯示面板(Citi 圖名 Figure 34,Online Power Modular UPS) |
報告_Citi_旭隼6409_Initiation_20261013_028.png |
151KB | 真資料圖(估值類) | Bull/Base/Bear 情境:Bull NT$1,300(30x P/E,+52%)、Base NT$1,050(2027E 營收成長 5-10%、GPM 28-28.5%、25x,+23%)、Bear NT$800(19x,-6.3%),現價 NT$854(2026-10-13)與一年股價走勢 |
報告_Citi_旭隼6409_Initiation_20261013_015.png |
26KB | 真資料圖(客戶類) | 1H26 客戶占比圓餅:Schneider 18%、Vertiv 5%、Riello 5%、Eaton 3%、Others 70%(Citi 圖名 Figure 16) |
報告_Citi_旭隼6409_Initiation_20261013_023.png |
15KB | 真資料圖 | 圓餅圖:China 80%、Taiwan 10%、Vietnam 10%(圖內無標題;依版面順序對應 Citi Figure 31 Capacity Mix) |
報告_Citi_旭隼6409_Initiation_20261013_024.png |
17KB | 真資料圖(營收類) | 2025 年產品別營收圓餅:On-line UPS 37%、Off-line UPS 26%、Inverter 29%、CKD & others 8%(Citi 圖名 Figure 32) |
報告_Citi_旭隼6409_Initiation_20261013_001/002/003/004/005/009/010/011/012/014/016/017/018/019/021/022/027.png |
<40KB | 未 Read | 依報告圖名為股價表現、銷售組合、P/E 與獲利成長、同業比較、全球 UPS 市場規模、Online UPS 功率與用途分布、UPS 與全球成長對照、GPM 等財務/市場類圖,未逐張驗證,不嵌 lib |
原始內容
[讀者資訊已遮蔽] citi
13 Oct 2026 07:30:25 ET │ 36 pages
Voltronic Power (6409.TW)
Recharging Growth: UPS Recovery and HVDC Potential; Initiate at Buy
CITI'S TAKE
We initiate coverage on Voltronic with a Buy rating and NT$1,050 target price. Voltronic is a Taiwan-based UPS ODM, supplying to western power vendors including Schneider, Riello, Vertiv and Eaton. We view 2026E as the earnings trough, with improving online UPS mix and operating leverage driving 28% earnings rebound in 2027E. Structural outsourcing by western power vendors should support sustained share gains, while expansion into HVDC power racks offers a new stream for AIDC growth, supporting a potential re-rating. Our TP applies 25x 2027E EPS against earnings CAGR of 20% in 2026-2028E, broadly consistent with its L-T historical average.
Outsourcing and mix upgrade underpin the recovery - Western vendors' increasing focus on integrated AIDC infrastructure strengthens the rationale for outsourcing select UPS platforms. Voltronic's customization capabilities and flexible manufacturing position it to capture additional opportunities. A rising contribution from online and higher power UPS should support margins, driving EPS CAGR of 20% in 2026-2028E.
Power racks could materially broaden its growth opportunity - Voltronic's high voltage EV-charger experience and longstanding relationships with western power vendors support its entry into HVDC power solutions. It has progressed into customer sampling, with management indicating that HVDC power rack mass production could begin in 2H27E at the earliest. Successful commercialization could broaden its addressable market and support a valuation re-rating.
Earnings recovery and strong cash returns - We view 2026E as the earnings trough, followed by a recovery in 2027-2028E. A richer online UPS mix and operating leverage should lift GPM from 27.1% in 2026E to 28.1% and 29.0% in 2027E and 2028E, respectively. Its relatively asset-light business model, net cash position and high dividend payout should provide additional support for shareholder returns.
Initiate Buy with TP NT$1,050 on 25x 2027E EPS - Our target multiple is broadly consistent with Voltronic's average forward P/E since 2013, supported by its competitive position in UPS outsourcing and durable customer relationships. Clearer evidence of power-rack commercialization could offer further re-rating.
Earnings Summary
| Year to 31 Dec | Net Profit (NT$M) | Diluted EPS (NT$) | EPS growth (%) | P/E (x) | P/B (x) | ROE (%) | Yield (%) |
|---|---|---|---|---|---|---|---|
| 2024A | 4,204 | 48.13 | 15.9 | 17.7 | 7.5 | 46.0 | 4.8 |
| 2025A | 3,521 | 40.23 | -16.4 | 21.2 | 7.8 | 36.1 | 4.1 |
| 2026E | 2,894 | 33.00 | -18.0 | 25.9 | 10.4 | 34.5 | 3.4 |
| 2027E | 3,710 | 42.30 | 28.2 | 20.2 | 9.7 | 49.7 | 4.3 |
| 2028E | 4,144 | 47.25 | 11.7 | 18.1 | 9.1 | 51.9 | 4.8 |
Source: Powered by dataCentral
See Appendix A-1 for Analyst Certification, Important Disclosures and Research Analyst Affiliations.
| Buy Price (13 Oct 26 13:30) | NT$854.00 |
|---|---|
| Target price | NT$1,050.00 |
| Expected share price return | 23.0% |
| Expected dividend yield | 3.5% |
| Expected total return | 26.5% |
| Market Cap | NT$75,369M |
| US$2,359M |
Price Performance (RIC: 6409.TW, BB: 6409 TT)
Angela Hsu AC
+886-2-8726-9083 angela.hc.hsu@citi.com [讀者資訊已遮蔽] [讀者資訊已遮蔽]
| Profit & Loss (NT$m) | 6409.TW: Fiscal year end 31-Dec - 2024 | 2025 | 2026E | 2027E | 2028E | Valuation ratios | Price: NT$854.00; TP: NT$1,050.00; Market Cap: NT$75,369m; Recomm: Buy - 2024 | Price: NT$854.00; TP: NT$1,050.00; Market Cap: NT$75,369m; Recomm: Buy - 2025 | Price: NT$854.00; TP: NT$1,050.00; Market Cap: NT$75,369m; Recomm: Buy - 2026E | Price: NT$854.00; TP: NT$1,050.00; Market Cap: NT$75,369m; Recomm: Buy - 2027E | Price: NT$854.00; TP: NT$1,050.00; Market Cap: NT$75,369m; Recomm: Buy - 2028E |
|---|---|---|---|---|---|---|---|---|---|---|---|
| Sales revenue | 22,813 | 20,521 | 20,374 | 21,913 | 23,378 | PE (x) | 17.7 | 21.2 | 25.9 | 20.2 | 18.1 |
| Cost of sales | -15,790 | -14,561 | -14,860 | -15,758 | -16,609 | PB (x) | 7.5 | 7.8 | 10.4 | 9.7 | 9.1 |
| Gross profit | 7,023 | 5,960 | 5,514 | 6,155 | 6,768 | EV/EBITDA (x) | 13.3 | 15.4 | 18.5 | 14.6 | 13.1 |
| Gross Margin (%) | 30.8 | 29.0 | 27.1 | 28.1 | 29.0 | FCF yield (%) | 5.8 | 6.1 | 2.7 | 5.0 | 5.6 |
| EBITDA (Adj) | 5,274 | 4,491 | 3,730 | 4,704 | 5,208 | Dividend yield (%) | 4.8 | 4.1 | 3.4 | 4.3 | 4.8 |
| EBITDA Margin (Adj) (%) | 23.1 | 21.9 | 18.3 | 21.5 | 22.3 | Payout ratio (%) | 85 | 87 | 87 | 87 | 87 |
| Depreciation | -349 | -313 | -295 | -262 | -225 | ROE (%) | 46.0 | 36.1 | 34.5 | 49.7 | 51.9 |
| Amortisation | 0 | 0 | 0 | 0 | 0 | Cashflow (NT$m) | 2024 | 2025 | 2026E | 2027E | 2028E |
| EBIT (Adj) | 5,115 | 4,329 | 4,015 | 4,569 | 5,093 | EBITDA | 5,464 | 4,641 | 4,309 | 4,830 | 5,318 |
| EBIT Margin (Adj) (%) | 22.4 | 21.1 | 19.7 | 20.9 | 21.8 | Working capital | -413 | 786 | -773 | -119 | -103 |
| Net interest | 164 | 139 | 130 | 127 | 127 | Other | -647 | -811 | -1,456 | -859 | -950 |
| Associates | 0 | 0 | 0 | 0 | 0 | Operating cashflow | 4,404 | 4,617 | 2,080 | 3,852 | 4,265 |
| Non-Op/Except/Other Adj | -189 | -151 | -579 | -127 | -110 | Capex | -87 | -60 | -93 | -80 | -80 |
| Pre-tax profit | 5,090 | 4,317 | 3,566 | 4,569 | 5,110 | Net acq/disposals | -17 | -333 | -113 | 0 | 0 |
| Tax | -886 | -796 | -672 | -859 | -967 | Other | 0 | -2 | -7 | 0 | 108 |
| Extraord./Min.Int./Pref.div. | 0 | 0 | 0 | 0 | 0 Investing cashflow | -104 | -395 | -214 | na | 28 | |
| Reported net profit | 4,204 | 3,521 | 2,894 | 3,710 | 4,144 | Dividends paid | -3,290 | -3,772 | -2,518 | -3,227 | -3,605 |
| Net Margin (%) | 18.4 | 17.2 | 14.2 | 16.9 | 17.7 | Financing cashflow | -3,488 | -3,944 | -2,610 | -3,227 | -3,605 |
| Core NPAT | 4,204 | 3,521 | 2,894 | 3,710 | 4,144 | Net change in cash | 1,512 | -141 | -185 | 545 | 688 |
| Per share data | 2024 | 2025 | 2026E | 2027E | 2028E | Free cashflow to s/holders | 4,317 | 4,556 | 1,987 | 3,772 | 4,185 |
| Reported EPS ($) | 48.13 | 40.23 | 33.00 | 42.30 | 47.25 | ||||||
| Core EPS ($) | 48.13 | 40.23 | 33.00 | 42.30 | 47.25 | ||||||
| DPS ($) | 41.00 | 35.00 | 28.71 | 36.80 | 41.10 | ||||||
| CFPS ($) | 50.41 | 52.75 | 23.72 | 43.92 | 48.63 | ||||||
| FCFPS | 49.41 | 52.07 | 22.65 | 43.01 | |||||||
| ($) | 47.72 | ||||||||||
| BVPS ($) Wtd avg ord shares (m) | 113.66 87.4 | 109.16 87.5 | 82.39 87.7 | 87.89 87.7 | 94.04 87.7 | ||||||
| Wtd avg diluted shares (m) | 87.4 | 87.5 | 87.7 | 87.7 | 87.7 | ||||||
| Growth rates | 2024 | 2025 | 2026E | 2027E | 2028E | ||||||
| Sales revenue (%) | 20.4 | -10.0 | -0.7 | 7.6 | 6.7 | ||||||
| EBIT (Adj) (%) | 23.6 | -15.4 | -7.3 | 13.8 | 11.5 | ||||||
| Core NPAT (%) | 16.1 | -16.3 | -17.8 | 28.2 | 11.7 | ||||||
| Core EPS (%) | 15.9 | -16.4 | -18.0 | 28.2 | 11.7 | ||||||
| Balance Sheet (NT$m) | 2024 | 2025 | 2026E | 2027E | 2028E | ||||||
| Cash & cash equiv. | 6,556 | 6,738 | 6,685 | 7,230 | 7,918 | ||||||
| Accounts receivables | 3,450 | 3,387 | 2,896 | 3,125 | 3,348 | ||||||
| Inventory | 2,093 | 1,796 | 1,723 | 1,830 | 1,947 | ||||||
| Net fixed & other tangibles | 4,390 | 4,172 | 4,083 | 3,901 | 3,757 | ||||||
| Goodwill & intangibles | 446 | 535 | 701 | 701 | 593 | ||||||
| Financial & other assets | 386 | 456 | 422 | 422 | 422 | ||||||
| Total assets | 17,321 | 17,084 | 16,511 | 17,209 | 17,986 | ||||||
| Accounts payable | 4,350 | 4,796 | 3,485 | 3,701 | 3,939 | ||||||
| Short-term debt | 0 | 0 | 0 | 0 | 0 | ||||||
| Long-term debt | 636 | 538 | 489 | 489 | 489 | ||||||
| Provisions & other liab | 2,406 | 2,197 | 5,310 | 5,310 | 5,310 | ||||||
| 7,392 | 7,531 | 9,285 | 9,739 | ||||||||
| Total liabilities Shareholders' equity | 9,929 | 9,553 | 7,226 | 9,501 7,708 | 8,247 | ||||||
| Minority interests | 0 | 0 | 0 | 0 | 0 | ||||||
| Total equity | 9,929 | 9,553 | 7,226 | 7,708 | 8,247 | ||||||
| Net debt (Adj) | -5,920 | -6,200 | -6,196 | -6,741 | -7,429 | ||||||
| Net debt to equity (Adj) (%) | -59.6 | ||||||||||
| For definitions of the items in this table, | please click here. | -64.9 | -85.7 | -87.4 | -90.1 |
Contents
| Executive Summary | 4 |
|---|---|
| Valuation Comparison | 7 |
| Investment Thesis | 8 |
| Positive #1 - AIDC creates a new growth runway, with power-rack expansion potentially lifting Voltronic into broader power solutions | 8 |
| Positive #2 - UPS outsourcing provides a structural share-gain opportunity | 10 |
| Positive #3 - Online and high-power UPS mix upgrade should support structurally better growth | 14 |
| Financial Analysis | 17 |
| Valuation Methodology and Risks | 22 |
| Company Overview | 24 |
| Bull/Bear: Voltronic Power (6409.TW) | 27 |
| Voltronic Power | 28 |
| Company description | 28 |
| Investment strategy | 28 |
| Valuation | 28 |
| Risks | 28 |
| Appendix A-1 | 28 |
[讀者資訊已遮蔽]
Executive Summary
We initiate coverage of Voltronic with a Buy rating and target price of NT$1,050 (25x 2027E EPS), supported by structural UPS outsourcing, improving product mix and emerging opportunities in AI datacenter power infrastructure. Voltronic is a Taiwan-based ODM of uninterrupted power supplies ('UPS') and power conversion products for global brands. UPS system provides backup electricity and protection against power disturbances, helping critical equipment maintain operation during supply disruptions. UPS accounted for 63% of Voltronic's 2025 group sales. Its pure-play ODM model, customization capabilities and longstanding customer relationships underpin its competitive positioning.
Our positive stance on the shares is based on three major reasons:
- We see expansion into HVDC power racks as a potentially significant new growth opportunity. Its experience in high-voltage EV chargers provides relevant engineering capabilities, while its established relationships with western power vendors support access to customer development programs. Voltronic has progressed into customer sampling, with management indicating that HVDC power rack mass production could begin in 2H27E at the earliest. Successful commercialization could broaden its addressable market and support a valuation re-rating, although meaningful earnings contribution remains subject to qualification, design wins and production schedules.
- Structural UPS outsourcing should support sustained market share gains. Western power vendors are allocating more resources to integrated AIDC infrastructure and energy management, strengthening the rationale for outsourcing selected products. Voltronic's engineering expertise, flexible manufacturing and ability to handle a broad range of customized products in small batches make it well positioned to capture these opportunities.
- The shift toward online and higher power UPS should improve revenue quality and profitability. We expect online UPS to be the principal driver of the earnings recovery, with online UPS sales growing 12% CAGR in 2026-2028E as outsourcing opportunities and demand for higher power systems expand.
We view 2026E as the earnings trough, followed by a recovery in 2027-2028E. We forecast EPS of NT$33.00/NT$42.30/NT$47.25 in 2026E/2027E/2028E, implying earnings growth of 28% and 12% in 2027E and 2028E. A richer online UPS mix and operating leverage should lift GPM from 27.1% in 2026E to 28.1% and 29.0% in 2027E and 2028E, respectively. Its relatively asset-light business model, net cash position and high dividend payout should provide additional support for shareholder returns.
Our target price applies 25x forward P/E to 2027E EPS, broadly consistent with Voltronic's long tern average forward P/E since 2013. We believe its competitive position in UPS outsourcing, durable customer relationships and manufacturing capabilities justify this multiple, with clearer evidence of power rack commercialization offering potential for further re-rating.
[讀者資訊已遮蔽]
Figure 1. Voltronic: Sales Mix
© 2026 Citigroup Inc. No redistribution without Citigroup's written permission. Source: Company Reports, Citi Research, Citi Research Estimates
© 2026 Citigroup Inc. No redistribution without Citigroup's written permission. Source: Company Reports, Citi Research, Citi Research Estimates
Figure 3. Voltronic: Forward P/E vs. Earnings Growth
Figure 4. Peers Comp: Forward P/E vs. Earnings CAGR
© 2026 Citigroup Inc. No redistribution without Citigroup's written permission. Source: Citi Research, Citi Research Estimates
© 2026 Citigroup Inc. No redistribution without Citigroup's written permission. Source: Bloomberg, Citi Research, Citi Research Estimates [讀者資訊已遮蔽] [讀者資訊已遮蔽] Target Price
Figure 5. Voltronic: Historical Share Price Trend and Key Drivers
Figure 6. UPS Valuation Comp
Valuation Comparison
Mkt-Cap
3M ADT
P/E (x)
EV/EBITDA (x)
P/B (x)
Dividend yield (%)
26-28E 2yr EPS
ROE
Company RIC
Rating*
Curr Price
12-0ct US$M
US$M
FY26E
FY27E
FY28E
FY26E
FY27E
FY28E
FY26E
FY27E
FY28E
FY25E
FY26E
FY27E
FY28E
CAGR (%)
FY26E
FY27E
FY28E
Voltronic
6409.TW
1
TWD
1,050.0
875.0
2,418.3
14.7
26.5
20.7
18.5
16.5
14.6
13.2
10.6
10.0
9.3
4.0
3.3
4.2
4.7
19.7
34%
50%
52%
Taiwan
Delta
2308.TW
CyberPower
3617.TW
Lite-On
2301.TW
1
NR
TWD
TWD
2,280.0
1,900.0
154,557.6
686.7
49.9
32.9
20.1
27.0
17.7
11.0
11.1
8.6
6.2
0.6
1.0
1.6
2.6
57.7
25%
29%
36%
NR
TWD
na
258.5
767.1
4.2
na na na na na na na na na na na na na na na na na
na
288.0
20,889.4
218.6
26.4
18.9
13.7
17.7
12.1
9*
6.4
5.7
5.1
1.7
2.6
3.6
5.6
38.7
25%
31%
40%
Sub-Average
34.3
24.2
17.4
20.4
14.8
11.2
9.4
8.1
6.9
2.1
2.3
3.1
4.3
38.7
28%
37%
42%
Global
KSTAR
002518.SZ
NR
CNY
na
31.4
2,727.5
78.5
23.8
16.4
12.7
16.3
11.4
8.4
3.4
2.9
2.5
1.4
1.9
2.9
3.7
37.1
14%
18%
20%
Kehua
002335.SZ
NR
CNY
na
28.2
3,184.0
98.9
33.0
24.7
18.7
17.4
13.7
11.5
2.8
2.6
2.3
1.2
1.7
2.4
4.0
32.9
10%
13%
16%
Fuji Electric
6504.T
Vertiv VRT.N
Mitsubishi Electric
6503.T
JPY
7,200.0
5,143.0
66,486.3
205.1
25.9
18.8
17.3
14.5
10.1
9.4
2.4
21
1.9
1.0
1.1
1.2
1.3
20.9
10%
12%
11%
ABB
1
1
ABBN.S
2
CHF
JPY
18,000.0
15,015.0
13,844.5
72.3
22.6
17.8
16.7
10.7
9.0
8.1
2.8
2.6
2.4
1.1
1.3
1.6
1.7
16.0
13%
15%
15%
USD
358.0
242.8
93,467.4
307.4
36.3
26.8
20.9
27.3
18.7
14.2
14.9
9.9
6.9
na na na na
35.9
45%
42%
38%
Siemens Energy ENR1n.DE
85.0
79.8
175,233.6
211.8
28.6
25.6
22.7
22.0
17.7
15.7
8.4
7.2
6.0
1.2
1.3
1.3
1.3
(3.1)
43%
29%
28%
Schneider Electric SCHN.PA
2
EUR
185.0
146.8
141,559.8
325.6
30.6
21.6
16.6
18.4
13.1
10.3
11.2
9.7
7.1
0.5
1.5
2.0
2.7
38.0
35%
47%
49%
Eaton ETN.N
Sub-Average EUR
370.0
268.5
174,021.5
288.7
24.9
21.0
18.6
17.6
14.8
12.9
5.6
49
4.2
1.6
1.6
1.7
20
19.1
21%
23%
23%
USD
182.0
161.8
90,268.8
121.9
24.7
22.5
20.3
18.7
16.8
15.4
25.6
17.2
14.6
1.3
1.4
1.4
1.4
11.2
23%
70%
60%
Emerson Electric EMR.N
USD
485.0
429.7
166,876.1
232.2
31.7
26.8
23.3
23.0
19.7
17.6
7.6
7.1
6.4
0.9
1.0
1.0
1.1
24.5
20%
24%
26%
28.9
22.5
18.6
18.7
14.6
12.2
8.5
6.6
5.4
1.0
1.3
1.5
1.9
25.3
0.2
0.3
0.3
Average
31.6
23.3
18.0
19.6
14.7
11.7
8.9
7.4
6.1
1.6
1.8
2.3
3.1
32.0
26%
33%
36%
*Note:1=Buy, 2=Neutral, 3=Sell, H=High Risk
Source: Powered by DataCentral, Citi Research estimates andI/B/E/S estimates for Not-Rated (NR) Companies
© 2026 Citigroup Inc. No redistribution without Citigroup's written permission.
Source: Thomson Reuters, Citi Research, Citi Research Estimates
1
1
1
[讀者資訊已遮蔽]
Investment Thesis
Positive #1 - AIDC creates a new growth runway, with power-rack expansion potentially lifting Voltronic into broader power solutions
We see Voltronic's expansion into power racks as a potentially significant extension of its AIDC opportunity in the medium to long term, enabling the company to capture the broader share of datacenter power spending. We believe Voltronic's existing high-voltage engineering capabilities, established relationships with western power vendors and customer collaboration provide a credible foundation for winning business in HVDC power rack.
Rapid growth in AI workloads and rising rack density increase the power capacity required, alongside more demanding requirements for efficiency, reliability and load management. Nvidia's roadmap targets 800VDC infrastructure supporting racks of 1MW and beyond, while its latest architecture includes power racks that supply 800VDC to compute racks within existing AC-powered facilities. We believe this creates scope for greater power-infrastructure, even as the architecture consolidates conversion stages to improve efficiency.
EV-charger experience provides a relevant technical foundation for HVDC development
Voltronic already offers DC fast chargers ranging 30-240kW, with modular designs delivering constant power across a 300-100VDC range and charging controls developed internally. These products demonstrate existing experience with highvoltage conversion, protection, thermal management and modular power-system design. We believe these capabilities should support its development of 800VDC PSUs and reduce the engineering learning curve.
Established westerns customer relationships strengthen its route to market
Voltronic's UPS ODM business provides existing engineering relationships and familiarity with customers' quality, customization and manufacturing requirements. Its pure ODM business model also emphasizes avoiding competition with customers. We believe this positioning makes it a suitable partner for western vendors who are expanding their AI infrastructure offerings. Existing relationships should help Voltronic secure development opportunities and understand product roadmaps early, although each new platform still requires qualification.
Voltronic has already taken concrete steps toward this opportunity. The company has publicly introduced an HVDC PSU for power racks, while its broader development plan extends into solutions combining battery backup unit (BBUs). battery management systems (BMS), and DCDC converters through collaboration with power-system companies.
Management indicated discussions with two Tier 1 vendors with the intended solution ultimately servicing the service providers. This creates a potential path from supplying individual power products to participating in a larger, integrated power-rack offering.
[讀者資訊已遮蔽] Development has progressed into customer sampling, although specifications continue to evolve with customers' requirements. Management pointed out that shipment of 800VDC products possible from 2H27E at the earliest.
We view its existing relationships with global power-solution vendors as a key advantage, while its commitment to operating as a pure ODM without competing against customers under its own brand supports this partnership model.
That said, customer qualification, confirmed design wins and mass-production timing remain key milestones before we can confidently evaluate a material contribution. Sales potential also depends on Voltronic's scope of supply, which determines content per rack and the share of system value it captures. Progress toward commercial shipments could strengthen earnings visibility and support a re-rating as Voltronic establishes its position in AIDC power infrastructure.
Figure 7. Western Power Vendors' Positioning in 800VDC Power Racks
| Company | Schneider Electric | Eaton | ABB | Vertiv |
|---|---|---|---|---|
| Power Rack Product | NetShelter Power Rack - 800VDC | 800VDC/+-400VDC sidecarplatform | 800VDC powerarchitecture under development. | sidecar/standalone power center. PowerDirect 5000, a dedicated 800VDC power |
| Power Capacity | >660kW; broader sidecar architecture can support Al racks of up to 1.2MW | 900kWmax | na | 400-900kW perPowerDirect 500 sidecar. |
| Expected Timeline | Sidecar intended to be available ahead ofRubin Ultra/Kyberdeployments beginning in 2027E. | 2027production readiness target | na | 800VDC sidecars are under customervalidation in 2026 with deployment planned in 2027E. |
| Work with Nvidia? | Yes. Working directly with Nvidia on 800VDC sidecar | Yes, working with Nvidia on design, reference architectures, and 800VDC power mgmt solutions | Yes, ABB and Nvidia are jointly developing power solutions for 800VDC and gigawatt scale AIDC. | Yes,working closelywith Nvidia. Vertivhas aligned the product roadmap with Nvidia's next-gen platforms. |
| External Partners? | Yes. The mgmt said it will leverage some partners whenneeded. | Yes. The mgmt said it is actively seeking industry collaboration to refine an d deploy the prototype. | Yes at the ecosystem level. | Yes at the ecosystem level, but less explicit on outsourcing. |
| Relevant Mgmt Commentary | On 1Q26 call, Schneider said it is investing heavily in 800VDC; the sidecar is the solution that can be deployed quickly. Importantly, mgmt explicitly said Schneider doesn't need to do everything itself and would leverage partners where necessary. | Eaton describes 800VDC as a major part ofits "grid-to- The mgmt noted ABB was an earlyinvestor in UPS, DC and Vertiv said 800VDC should become animportant portion request for industry collaboration suggest Eaton is actively building an ecosystem around the product ratherthandevelopingeveryelement entirelyinternally. datacenterarchitecture. | chip" strategy. The detailed sidecar roadmap and explicit solid-state electronics, which theydescribe as a future potential demand driver, with its Nvidia collaboration putting these technologies at the center ofnext-gen | of the market from 2027E onward. Its programs were on schedule for launches, while mgmt was pleased with feedback from ongoing prototypes and validation activities. |
© 2026 Citigroup Inc. No redistribution without Citigroup's written permission.
Source: Company Reports, Citi Research
[讀者資訊已遮蔽]
Figure 8. Voltronic: Prototype of Power Racks
Figure 9. Voltronic: Prototype of Power Racks
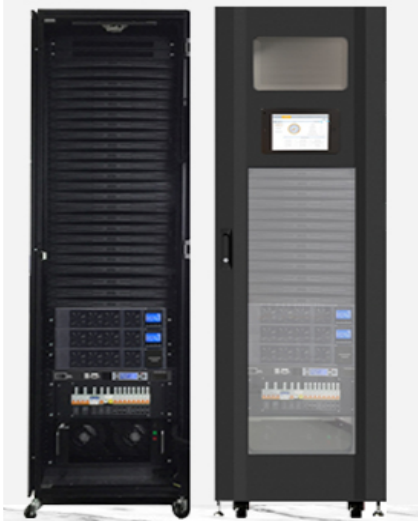
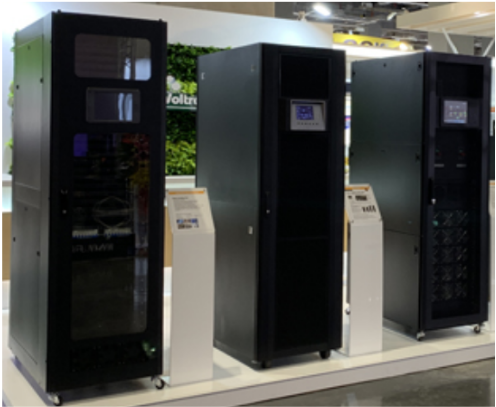
© 2026 Citigroup Inc. No redistribution without Citigroup's written permission. Source: Voltronic, Citi Research
Positive #2 - UPS outsourcing provides a structural sharegain opportunity
We see structural outsourcing as a durable growth driver for Voltronic, allowing its UPS business to outgrow underlying industry demand. Rising investment in digital infrastructure, commercial applications and industrial automation supports continued demand for power protection, while established brands have incentives to outsource selected hardware platforms.
Voltronic's dedicated ODM model, engineering capabilities and manufacturing efficiency position it to capture this opportunity. In our view, growth can come from both an expanding market and the transfer of existing production from customers' factories to qualified manufacturing partners.
UPS remains a structurally growing power-protection market
Global Market Insights estimates the worldwide UPS market at US$13bn in 2025, rising to US$14.5bn in 2026E and US$26.8bn by 2035E, implying a 7.1% CAGR over 2026-2035E. Although estimates vary by research provider and market definition, the underlying drivers include increasing dependency on electronic systems, growth in industrial automation and smart manufacturing, increasing power outages and grad instability, rising costs of downtime and greater requirements for reliable electricity.
[讀者資訊已遮蔽] Datacenters provide an important source of incremental demand, while commercial and industrial applications broaden the market beyond the AI investment cycle. Datacenters expansion supports demand for online, double conversion UPS systems, which continuously condition incoming power and protect critical equipment against supply disturbance. Commercial applications - including offices, retail networks and healthcare facilities - require protection for servers, communications equipment and other essential systems. Industrial demand comes from protecting sensitive control, automation equipment and critical processes where power interruptions can disrupt production.
The competitive landscape is led by established international suppliers. Per Global Market Insights 2025 analysis, Schneider Electric, Eaton, Vertiv are the three leading suppliers, with the top 5 collectively controlling approximately 60-65% of the global UPS market. Other peers include Huawei, KSTAR, Kehua, Delta and Riello.
This concentration matters for the outsourcing thesis - securing additional projects from a relatively small number of large brands can open substantial manufacturing opportunities.
Figure 10. Global UPS Market Size 2025-2035E
© 2026 Citigroup Inc. No redistribution without Citigroup's written permission. Source: Global Market Insights, Citi Research
© 2026 Citigroup Inc. No redistribution without Citigroup's written permission. Source: Global Market Insights, Citi Research [讀者資訊已遮蔽] Source: PW Consulting Group, Citi Research
Figure 12. Global Online UPS by Power Rating
Figure 13. Global Online UPS by End Use
© 2026 Citigroup Inc. No redistribution without Citigroup's written permission. Source: PW Consulting Group, Citi Research
Western brands' strategic priorities support further selective outsourcing
Per our industry checks, major UPS brands still manufacture a substantial portion of their UPS products internally, while increasingly moving toward energy management and committing resources to broader AIDC infrastructure. This could result in small and medium UPS products to be gradually outsourced as this transition develops. We view this as a multi-year opportunity, particularly where established platforms can be transferred to qualified ODMs while customers retain control over product specifications, branding and distribution.
We identify three economic reasons for this shift -
- Outsourcing can improve manufacturing and capital efficiency: A specialist ODM can aggregate demand across customers, consolidate component purchases and spread manufacturing overhead across a larger production base. For brands, this can reduce incremental factory investment and simplify capacity planning.
- Outsourcing can accelerate product development: access to ODMs' established platforms, component knowledge and manufacturing processes allows brands to adapt existing designs for additional markets and applications. Engineering resources can then concentrate on product differentiation.
- Broader system offerings create competing demands on vendors' resources. Leading UPS brands emphasize on monitoring, operational management and integrated solutions, strengthening the rationale for outsourcing selected hardware while allocating more resources to system integration, and software.
Voltronic's dedicated ODM model, engineering capabilities and manufacturing efficiency should position it to capture further UPS outsourcing [讀者資訊已遮蔽] Voltronic's ODM focus is evident from its commitment to operate without having a brand of its own to compete with its customers. This aligns its interests with customers and differentiates it from suppliers that combine branded sales with contract manufacturing. Long-standing relationships with leading vendors, including Schneider, Riello, Vertiv and Eaton, provide a foundation for securing additional projects. Its engineering capabilities enable it to meet diverse product specifications, while flexible manufacturing supports the small production batches and broad model range characteristic of the UPS industry.
Its track record in product qualification and certification also creates barriers, as moving established programs to other suppliers requires additional validation, audits and testing. We believe this combination of customer trust, execution and cost competitiveness positions Voltronic to secure more outsourcing orders, including higher-power online UPS, as western brands allocate greater resources to AIDC infrastructure and integrated power solutions.
Figure 14. Voltronic: Online UPS and Offline UPS Sales and Y/Y
Figure 15. Voltronic UPS Sales vs. Global UPS Sales Growth
© 2026 Citigroup Inc. No redistribution without Citigroup's written permission. Source: Company Reports, Citi Research, Citi Research Estimates
© 2026 Citigroup Inc. No redistribution without Citigroup's written permission.
Source: Omdia, IHS Markit, Citi Research, Citi Research Estimates [讀者資訊已遮蔽]
Figure 16. Voltronic: Customer Mix in 1H26
© 2026 Citigroup Inc. No redistribution without Citigroup's written permission.
Source: Company Reports, Citi Research
Positive #3 - Online and high-power UPS mix upgrade should support structurally better growth
We expect Voltronic's shift toward online and higher-power UPS to become an increasingly important driver of revenue growth and profitability. Moving up the product range increases power capacity and engineering content per system, supporting higher ASPs and greater differentiation. We forecast online UPS sales to rise at a 12% CAGR in 2026-2028E, ahead of offline UPS at 6%, with online UPS gross profit growing faster at 16% as product mix improves.
Offline UPS remains a stable revenue base, yet offers more limited differentiation. Offline UPS typically serves home offices, small businesses and basic power applications. These products feature relatively simple designs and lower costs.
We view this segment as increasingly mature and commoditized, with lower technical barriers exposing suppliers to greater pricing pressure, including competition from Chinese manufacturers. Scale, procurement efficiency and cost control hence are the key competitive factors, while opportunities for sustained ASP and margin expansion are more constrained, in our view. Our model assumes offline UPS gross margin to be at 24-26% in 2025-2028E.
Online UPS offers greater technical differentiation and stronger margin potential. Its double-conversion architecture continuously converts AC power into DC and back into AC, providing stable voltage and frequency, avoiding power disturbances and enabling zero transfer time to battery operation.
It is particularly suited to complex, power-sensitive applications such as datacenters, industrial automation and precision control systems, where even brief interruptions or power quality disturbances can disrupt operations. The business also exhibits high-mix, low-volume characteristics, particularly in customized [讀者資訊已遮蔽] commercial and industrial applications, where customers require different power ratings, redundancy configuration and battery interfaces etc. Our model assumes online UPS gross margin to be at 31-34% in 2025-2028E.
We believe this creates opportunities for an experienced ODM partner such as Voltronic to differentiate through customization and reliable delivery, while sharing development and procurement resources across customers and product platforms. Together with demanding certification, customer qualification and reliability testing, these capabilities raise entry barriers and switching costs, supporting higher ASPs, strong customer retention and better margin potential as Voltronic expands into higher power systems.
We project online UPS sales to increase 12% CAGR in 2026-2028E, lifting its contribution to group sales from 37% in 2025 to c.44% in 2028E. The underlying driver comes from a stronger outsourcing opportunity thanks to the AIDC boom. Western vendors, including Schneider, Vertiv are expanding their focus on integrated AIDC infrastructure, power distribution, and infrastructure management. Meanwhile, rising power requirements within conventional ACbased datacenters support demand for higher power UPS systems, prompting vendors to expand UPS production capacity. We believe the combination of stronger demand and competing resource requirements can strain available engineering and manufacturing capabilities, increasing the appeal of qualified ODM partners to supplement internal production. Voltronic's customization capabilities and flexible manufacturing position it to capture this opportunity.
Figure 17. Online UPS vs Offline UPS
| Offline UPS | Online UPS | |
|---|---|---|
| Voltronic Sales Mix (2025) | 26% | 37% |
| Voltronic GPM (2025) | 25-26% | 31-32% |
| OperatingPrinciple | Utilitypower normally feeds the load directly; battery/inverter activates when input power fails or moves our ofrange | Input AC is continuously converted AC-DC-AC, with inverter continuouslysupplyingthe load |
| Transfer Time | Short transfer time, afew milliseconds | Near-zerotransfertime |
| Typical Power Range | More concentrated in lower-power applications | More prevalent in medium and high power applications |
| Product Characteristics | More standardized,high volume products | More customized and project based products |
| TechnicalComplexity | Lower | Higher |
| Typical Applications | PCs,home office,POS systems,small networkingequipment | Datacenters,serverrooms,telecom,industrialequipment, medicaland criticalinfra |
| Cost | Lower | Higher |
| Maintenance Needs | Lower | Higher |
| Main Advantage | Cost effective and efficient for non-critical loads | Best power qualityand highest protection for mission-critical loads |
© 2026 Citigroup Inc. No redistribution without Citigroup's written permission.
Source: Citi Research [讀者資訊已遮蔽]
Figure 18. Voltronic: Sales Mix
Figure 19. Voltronic: Online UPS vs. Offline UPS Sales Growth
© 2026 Citigroup Inc. No redistribution without Citigroup's written permission. Source: Company Reports, Citi Research, Citi Research Estimates
© 2026 Citigroup Inc. No redistribution without Citigroup's written permission. Source: Company Reports, Citi Research, Citi Research Estimates
Figure 20. Voltronic: GPM by Product
© 2026 Citigroup Inc. No redistribution without Citigroup's written permission. Source: Company Reports, Citi Research, Citi Research Estimates
© 2026 Citigroup Inc. No redistribution without Citigroup's written permission. Source: Company Reports, Citi Research, Citi Research Estimates [讀者資訊已遮蔽]
Financial Analysis
Income statement - 2026E marks the earnings trough; online UPS drives the recovery from 2027E
Voltronic delivered an 8.7% sales CAGR and 9.9% net profit CAGR over 2018-2025, although earnings have become more volatile in recent years due largely to swings in the inverter business. We forecast sales to decrease 1% y/y to NT$20.4bn in 2026E, before recovering 8% y/y and 7% y/y to NT$21.9bn and NT$23.4bn in 2027E and 2028E respectively. The key driver is the higher value online UPS.
We forecast online UPS sales to grow 10%/13%/10% y/y in 2026E/2027E/2028E, lifting its sales contribution from 37% in 2025 to 44% by 2028E. Together with offline UPS, we estimate UPS products to make up 72% of group sales in 2028E vs 2025's 63%. Conversely, we forecast inverter sales to decline 27% y/y in 2026E and remain broadly flat thereafter, reducing their sales contribution from 29% in 2025 to 18% in 2028E.
We expect gross margin to bottom at 27.1% in 2026E vs. 29.0% in 2025, reflecting negative impact from material cost inflation and weaker inverter profitability. Thereafter, we forecast gross margin to recover to 28.1% and 29.0% in 2027E and 2028E, supported by a richer online UPS mix and improving segment margins. We estimate online UPS gross margin to increase from 30.8% in 2026E to 33.4% in 2028E driven rising contribution from high power online UPS, while its rising sales mix could provide increasing contribution to group gross profits.
Operating leverage should further support profitability. Opex fell from 8.0% of sales in 2025 to 7.4% in 2026E and could remain at 7.2% thereafter, while R&D investment is maintained at 4.2% of sales. We therefore forecast OPM to recover from 19.7% in 2026E to 20.9% and 21.8% in 2027E and 2028E.
We estimate net profit to decrease 18% y/y in 2026E, partly hampered by a larger FX loss, before rebounding 28% y/y and 12% y/y in 2027E and 2028E. We forecast EPS to register NT$33.00/NT$42.30/NT$47.25 in 2026E/2027E/2028E.
We attribute Voltronic's earnings decline in 2025 and our forecast for a further decline in 2026E to persistent inverter weakness and additional cost and supply pressures. In 2025, adverse weather in Pakistan shortened the inverter peak season and weakened demand, while intensifying Chinese competition pressured pricing and profitability. The weakness extended into 2026E as the Middle East conflict disrupted logistics and delayed shipments, alongside continued customers destocking in Pakistan. In 1H26, RMB appreciation further weighed on margins. Meanwhile, raw material shortages constrained shipments and higher metal and key component prices eroded gross margins. We therefore forecast earnings to decline 18% y/y in 2026E before improving 28% y/y in 2027E.
[讀者資訊已遮蔽] [讀者資訊已遮蔽]
Figure 22. Voltronic: Income Statement
| Income Statement (NT$m) | 2018 | 2019 | 2020 | 2021 | 2022 | 2023 | 2024 | 2025 | 2026E | 2027E | 2028E |
|---|---|---|---|---|---|---|---|---|---|---|---|
| Net Sales | 11,408 | 12,936 | 13,653 | 16,957 | 22,725 | 18,951 | 22,813 | 20,521 | 20,374 | 21,913 | 23,378 |
| COGS | -8,303 | -9,151 | -9,634 | -12,646 | -15,588 | -12,982 | -15,790 | -14,561 | -14,860 | -15,758 | -16,609 |
| Gross Profit | 3, 1 05 | 3,785 | 4,018 | 4,31 1 | 7, 1 37 | 5 ,968 | 7,023 | 5,960 | 5,514 | 6,155 | 6,768 |
| Operating Exp. | -994 | -1,228 | -1,288 | -1,386 | -1,849 | -1,831 | -1,908 | -1,632 | -1,499 | -1,586 | -1,675 |
| Operating Exp.-Promotion | -269 | -322 | -351 | -387 | -434 | -372 | -385 | -305 | -262 | -282 | -301 |
| Operating Exp.-ADM | -308 | -339 | -362 | -398 | -509 | -525 | -561 | -482 | -386 | -382 | -384 |
| Operating Exp.-R&D | -418 | -567 | -574 | -601 | -906 | -933 | -962 | -845 | -851 | -922 | -990 |
| Operating income | 2 ,111 | 2 ,557 | 2,730 | 2,925 | 5 ,288 | 4, 1 38 | 5 ,115 | 4,329 | 4,015 | 4,569 | 5,093 |
| Total non-operating Inc. | 1 45 | 59 | -81 | - 34 | 115 | 245 | -25 | - 12 | - 449 | 0 | 17 |
| Net Interest Inc. | 26 | 5 | 19 | 31 | -7 | 83 | 164 | 139 | 130 | 127 | 127 |
| Disposal of Fixed Asset | -1 | -5 | 0 | -1 | 0 | -2 | -1 | -7 | 0 | 0 | 0 |
| Exchange Gain (Loss) | 53 | 18 | -154 | -92 | 88 | 101 | -204 | -171 | -702 | 0 | 0 |
| Others Income (Loss) | 67 | 41 | 54 | 28 | 34 | 63 | 15 | 27 | 123 | -127 | -110 |
| Pre-tax Income | 2 ,256 | 2,616 | 2,650 | 2,890 | 5 ,403 | 4,382 | 5,090 | 4,317 | 3,566 | 4,569 | 5,110 |
| Income Tax | -443 | -485 | -452 | -531 | -970 | -760 | -886 | -796 | -672 | -859 | -967 |
| Net Income | 1 ,814 | 2 , 1 31 | 2 ,197 | 2 ,359 | 4,433 | 3,623 | 4,204 | 3,521 | 2,894 | 3,710 | 4,144 |
| Extraordinary gain (losses), minority interest | 0 | 0 | 0 | 0 | 0 | 0 | 0 | 0 | 0 | 0 | 0 |
| Net profit after extraordinary items | 1 ,814 | 2 , 1 31 | 2 ,197 | 2 ,359 | 4,433 | 3,623 | 4,204 | 3,521 | 2,894 | 3,710 | 4,144 |
| Adj.wtd.avg.shrs (m) | 78 | 82 | 87 | 87 | 87 | 87 | 87 | 88 | 88 | 88 | 88 |
| EPS (NT$) | 23. 18 | 25 .87 | 25 . 31 | 27. 13 | 50.90 | 41 .52 | 48 . 1 3 | 40.23 | 33.00 | 42.30 | 47.25 |
| Effective tax rate | -20% | -19% | -17% | -18% | -18% | -17% | -17% | -18% | -19% | -19% | -19% |
| Depreciation & Amortization | 537 | 346 | 238 | 299 | 327 | 362 | 349 | 313 | 295 | 262 | 225 |
| EB I TDA | 2 , 767 | 2 ,957 | 2 ,869 | 3, 1 59 | 5 , 736 | 4,661 | 5 ,2 74 | 4,491 | 3,730 | 4,704 | 5,208 |
| Ma rg i ns | |||||||||||
| Gross Margin | 27.2% | 29.3% | 29.4% | 25.4% | 31.4% | 31.5% | 30.8% | 29.0% | 27.1% | 28.1% | 29.0% |
| Operating Margin | 18.5% | 19.8% | 20.0% | 17.2% | 23.3% | 21.8% | 22.4% | 21.1% | 19.7% | 20.9% | 21.8% |
| Pretax Margin | 19.8% | 20.2% | 19.4% | 17.0% | 23.8% | 23.1% | 22.3% | 21.0% | 17.5% | 20.9% | 21.9% |
| Net Margin | 15.9% | 16.5% | 16.1% | 13.9% | 19.5% | 19.1% | 18.4% | 17.2% | 14.2% | 16.9% | 17.7% |
| EBITDA margin | 24.3% | 22.9% | 21.0% | 18.6% | 25.2% | 24.6% | 23.1% | 21.9% | 18.3% | 21.5% | 22.3% |
| OPEX | -8.7% | -9.5% | -9.4% | -8.2% | 8.1% | 9.7% | 8.4% | 8.0% | 7.4% | 7.2% | 7.2% |
| YoY % | |||||||||||
| Turnover | 15.7% | 13.4% | 5.5% | 24.2% | 34.0% | -16.6% | 20.4% | -10.0% | -0.7% | 7.6% | 6.7% |
| Operating Profits | 15.4% | 21.1% | 6.8% | 7.1% | 80.8% | -21.8% | 23.6% | -15.4% | -7.3% | 13.8% | 11.5% |
| Pretax Profits | 36.3% | 15.9% | 1.3% | 9.1% | 86.9% | -18.9% | 16.1% | -15.2% | -17.4% | 28.1% | 11.8% |
| Net Profits | 33.0% | 17.5% | 3.1% | 7.4% | 87.9% | -18.3% | 16.1% | -16.3% | -17.8% | 28.2% | 11.7% |
| EPS | 32.8% | 11.6% | -2.2% | 7.2% | 87.6% | -18.4% | 15.9% | -16.4% | -18.0% | 28.2% | 11.7% |
| OPEX | 14.8% | 23.5% | 4.9% | 7.7% | 33.4% | -1.0% | 4.2% | -14.5% | -8.1% | 5.8% | 5.6% |
| © 2026 Citigroup Inc. No redistribution without Citigroup's written permission. | © 2026 Citigroup Inc. No redistribution without Citigroup's written permission. | © 2026 Citigroup Inc. No redistribution without Citigroup's written permission. | © 2026 Citigroup Inc. No redistribution without Citigroup's written permission. | © 2026 Citigroup Inc. No redistribution without Citigroup's written permission. | © 2026 Citigroup Inc. No redistribution without Citigroup's written permission. | © 2026 Citigroup Inc. No redistribution without Citigroup's written permission. | © 2026 Citigroup Inc. No redistribution without Citigroup's written permission. | © 2026 Citigroup Inc. No redistribution without Citigroup's written permission. | © 2026 Citigroup Inc. No redistribution without Citigroup's written permission. | © 2026 Citigroup Inc. No redistribution without Citigroup's written permission. | © 2026 Citigroup Inc. No redistribution without Citigroup's written permission. |
| Source: Company Reports, Citi Research, Citi Research Estimates | Source: Company Reports, Citi Research, Citi Research Estimates | Source: Company Reports, Citi Research, Citi Research Estimates | Source: Company Reports, Citi Research, Citi Research Estimates | Source: Company Reports, Citi Research, Citi Research Estimates | Source: Company Reports, Citi Research, Citi Research Estimates | Source: Company Reports, Citi Research, Citi Research Estimates | Source: Company Reports, Citi Research, Citi Research Estimates | Source: Company Reports, Citi Research, Citi Research Estimates | Source: Company Reports, Citi Research, Citi Research Estimates | Source: Company Reports, Citi Research, Citi Research Estimates | Source: Company Reports, Citi Research, Citi Research Estimates |
Figure 23. Voltronic: Our Sales and GPM Assumptions
| Revenue Assumptions | 2018 | 2019 | 2020 | 2021 | 2022 | 2023 | 2024 | 2025 | 2026E | 2027E | 2028E |
|---|---|---|---|---|---|---|---|---|---|---|---|
| FX (USD/TWD) | 30.1 | 30.9 | 29.5 | 27.8 | 29.8 | 31.8 | 32.3 | 31.0 | 31.6 | 31.6 | 31.6 |
| Sa les | |||||||||||
| Off-line UPS | 4,261 | 4,479 | 4,332 | 5,751 | 6,090 | 5,249 | 6,233 | 5,293 | 5,710 | 6,058 | 6,361 |
| On-line UPS | 4,726 | 5,138 | 4,998 | 6,002 | 7,124 | 6,586 | 7,567 | 7,587 | 8,359 | 9,456 | 10,402 |
| Inverter | 1,592 | 2,409 | 3,453 | 4,080 | 7,920 | 5,320 | 7,202 | 5,928 | 4,336 | 4,233 | 4,233 |
| CKD & others | 828 | 910 | 869 | 1,124 | 1,591 | 1,796 | 1,811 | 1,713 | 1,969 | 2,166 | 2,383 |
| Tot a l | 11,408 | 12,936 | 13,653 | 16,957 | 22,725 | 18,951 | 22,813 | 20,521 | 20,374 | 21,913 | 23,378 |
| YoY% | |||||||||||
| Off-line UPS | 10% | 5% | -3% | 33% | 6% | -14% | 19% | -15% | 8% | 6% | 5% |
| On-line UPS | 24% | 9% | -3% | 20% | 19% | -8% | 15% | 0% | 10% | 13% | 10% |
| Inverter | 7% | 51% | 43% | 18% | 94% | -33% | 35% | -18% | -27% | -2% | 0% |
| CKD & others | 20% | 10% | -4% | 29% | 42% | 13% | 1% | -5% | 15% | 10% | 10% |
| Tot a l | 16% | 13% | 6% | 24% | 34% | -17% | 20% | -10% | -1% | 8% | 7% |
| GPM | |||||||||||
| Off-line UPS | 21.5% | 22.5% | 20.8% | 17.9% | 22.9% | 25.0% | 25.1% | 25.1% | 24.4% | 25.4% | 26.4% |
| On-line UPS | 29.7% | 30.7% | 29.7% | 25.5% | 28.9% | 30.6% | 31.3% | 31.7% | 30.8% | 32.3% | 33.4% |
| Inverter | 43.4% | 44.8% | 42.7% | 37.6% | 43.3% | 41.0% | 35.9% | 30.9% | 25.5% | 25.5% | 25.5% |
| CKD & others | 11.5% | 12.8% | 17.8% | 19.3% | 16.0% | 25.4% | 27.7% | 23.3% | 22.3% | 22.3% | 22.3% |
| Total GM% | 27.2% | 29.3% | 29.4% | 25.4% | 31.4% | 31.5% | 30.8% | 29.0% | 27.1% | 28.1% | 29.0% |
© 2026 Citigroup Inc. No redistribution without Citigroup's written permission. Source: Company Reports, Citi Research, Citi Research Estimates
Balance Sheet - Asset light model and net cash suggest high returns
Voltronic maintains a relatively asset-light balance sheet with fixed assets making up 24% of total assets in 2025 despite its sizable sales scale. We estimate the company to remain in a net cash position throughout 2026-2028E. We forecast cash and cash equivalent assets to account for 36-39% of total assets in 20262028E while there are no meaningful short-term borrowings and long-term debt.
We forecast ROE to rise from 37% in 2025 to 40% in 2026E and 48% in 2027E. The high ROE is not driven by financial leverage, but primarily by its asset-light business model, strong operating margins and high capital distribution.
Voltronic also maintains high shareholder-return policy. We assume an 87% cash dividend payout ratio through 2026-2028E, implying cash dividends of NT$29/NT$37/NT$41 per share.
[讀者資訊已遮蔽]
Figure 24. Voltronic: Balance Sheet
| Balance Sheet (NT$mn) | 2018 | 2019 | 2020 | 2021 | 2022 | 2023 | 2024 | 2025 | 2026E | 2027E | 2028E |
|---|---|---|---|---|---|---|---|---|---|---|---|
| Cash | 2,629 | 4,003 | 4,886 | 5,155 | 5,353 | 5,045 | 6,556 | 6,415 | 6,230 | 6,775 | 7,463 |
| Bank Deposit (over 3 mths) | - | - | - | - | - | - | - | 323 | 455 | 455 | 455 |
| AR/NR (reported) | 2,198 | 2,278 | 2,346 | 2,838 | 3,117 | 2,949 | 3,450 | 3,387 | 2,896 | 3,125 | 3,348 |
| Inventories | 973 | 1,030 | 1,294 | 1,787 | 2,019 | 1,412 | 2,093 | 1,796 | 1,723 | 1,830 | 1,947 |
| Others | 246 | 251 | 272 | 262 | 328 | 252 | 324 | 354 | 324 | 324 | 324 |
| Current Assets | 6 ,047 | 7,562 | 8,798 | 10,042 | 10,816 | 9,657 | 12,423 | 12,276 | 11,629 | 12,509 | 13,538 |
| Long-term Investments | - | - | - | - | - | 42 | 61 | 101 | 98 | 98 | 98 |
| Fixed Assets | 1,964 | 2,168 | 2,428 | 2,730 | 4,474 | 4,420 | 4,390 | 4,172 | 4,083 | 3,901 | 3,757 |
| Right of Use Assets | - | 397 | 489 | 390 | 463 | 368 | 301 | 286 | 316 | 316 | 316 |
| Other Assets | 275 | 213 | 206 | 222 | 332 | 269 | 145 | 249 | 385 | 385 | 277 |
| Total Assets | 8,286 | 10,340 | 11,921 | 13,384 | 16,085 | 14,756 | 17,321 | 17,084 | 16,511 | 17,209 | 17,986 |
| S-t Borrowings | 397 | 1,091 | 1,768 | 2,380 | - | - | - | - | - | - | - |
| AP/NP | 2,370 | 3,003 | 3,322 | 3,615 | 4,173 | 3,687 | 4,350 | 4,796 | 3,485 | 3,701 | 3,939 |
| Other ST liabilities | 1,068 | 1,173 | 1,234 | 1,500 | 2,454 | 1,798 | 2,276 | 2,086 | 5,078 | 5,078 | 5,078 |
| Total Current Liabilities | 3,835 | 5 ,267 | 6 ,324 | 7,495 | 6,627 | 5,485 | 6,626 | 6,881 | 8,563 | 8,780 | 9,017 |
| L-t Debt | - | - | - | - | 832 | 734 | 636 | 538 | 489 | 489 | 489 |
| Other Liabilities | 1 | 193 | 259 | 181 | 283 | 180 | 130 | 111 | 232 | 232 | 232 |
| Total Liabilities | 3,836 | 5,460 | 6,583 | 7,676 | 7,742 | 6,398 | 7,392 | 7,531 | 9,285 | 9,501 | 9,739 |
| Common Shares | 787 | 833 | 874 | 874 | 878 | 877 | 877 | 877 | 883 | 883 | 883 |
| Other Shareholders' Equity | 3,663 | 4,047 | 4,464 | 4,833 | 7,466 | 7,480 | 9,052 | 8,676 | 6,343 | 6,826 | 7,365 |
| Total Equity | 4,450 | 4,880 | 5,339 | 5,708 | 8 ,343 | 8,358 | 9,929 | 9,553 | 7,226 | 7,708 | 8,247 |
| Total Liab./Shrhldr's Equity | 8,286 | 10,340 | 11,921 | 13,384 | 16,085 | 14,756 | 17,321 | 17,084 | 16,511 | 17,209 | 17,986 |
© 2026 Citigroup Inc. No redistribution without Citigroup's written permission.
Source: Company Reports, Citi Research, Citi Research Estimates
Figure 25. Voltronic: Cash Flow Statement
| Cash Flow (NT$ mn) | 2018 | 2019 | 2020 | 2021 | 2022 | 2023 | 2024 | 2025 | 2026E | 2027E | 2028E |
|---|---|---|---|---|---|---|---|---|---|---|---|
| Cashflow from Operations | 1 ,865 | 2 ,997 | 2,626 | 2,299 | 5 ,619 | 4,083 | 4,404 | 4,617 | 2 ,080 | 3,852 | 4,265 |
| Net profits | 1,814 | 2,131 | 2,197 | 2,359 | 4,433 | 3,623 | 4,204 | 3,521 | 2,894 | 3,710 | 4,144 |
| Depreciation & Amortization | 79 | 178 | 238 | 299 | 327 | 362 | 349 | 313 | 295 | 262 | 225 |
| Inv. Gain/Loss ( Equity ) | 81 | 110 | 182 | 26 | 164 | 359 | 212 | 85 | 28 | 0 | 0 |
| Disposal of Investment | 0 | 0 | 0 | 0 | 0 | 0 | 0 | 0 | 0 | 0 | 0 |
| Working Capital Change | -468 | 454 | -26 | -715 | 5 | 173 | -413 | 786 | -773 | -119 | -103 |
| Dec(Inc)-A/R | -402 | -111 | -81 | -512 | -313 | 72 | -371 | 63 | 480 | -229 | -223 |
| Dec(Inc)-Inventory | -75 | -68 | -264 | -496 | -240 | 587 | -705 | 278 | 58 | -107 | -118 |
| Inc(Dec)-A/P | 9 | 633 | 319 | 293 | 558 | -486 | 663 | 446 | -1,311 | 216 | 238 |
| Other adjustments | 359 | 124 | 35 | 329 | 690 | -434 | 52 | -88 | (364) | - | - |
| Cashflow from Investing | - 702 | - 438 | - 41 1 | - 5 32 | - 1 ,975 | - 232 | - 104 | -395 | -214 | -80 | 28 |
| (Purchases) Sale of fixed asset / (capex) | -700 | -431 | -387 | -520 | -1,974 | -182 | -87 | -60 | (93) | (80) | (80) |
| (Purchases) Sale of LT investment | 0 | 0 | 0 | 0 | 0 | 0 | 0 | 0 | - | - | - |
| (Purchases) Sale of ST investment | 0 | 0 | 0 | 0 | 0 | -45 | -17 | -333 | (113) | - | - |
| Other adjustments | -3 | -7 | -24 | -12 | 0 | -6 | 0 | -2 | (7) | - | 108 |
| Cashflow from financing | - 1 , 1 75 | -998 | -1,301 | - 1 ,524 | -3,791 | -4,009 | -3,488 | -3,944 | -2,610 | -3,227 | -3,605 |
| Increase in L-T debt | 0 | 0 | 0 | 0 | 930 | -98 | -98 | -98 | -49 | 0 | 0 |
| Increase in S-T debt | 398 | 707 | 705 | 622 | -2,569 | 0 | 0 | 0 | 0 | 0 | 0 |
| Cash Dividend Paid | -1,574 | -1,652 | -1,933 | -2,055 | -2,054 | -3,818 | -3,290 | -3,772 | -2,518 | -3,227 | -3,605 |
| Issuance of stock | 0 | 0 | 0 | 0 | 0 | 0 | 0 | 0 | 0 | 0 | 0 |
| Other adjustments | 0 | -52 | -73 | -91 | -98 | -93 | -101 | -74 | -43 | 0 | 0 |
| Exchange rate adjustment | -53 | -188 | -31 | 26 | 345 | -151 | 700 | -419 | 559 | 0 | 0 |
| Net change in cash | -66 | 1 ,374 | 883 | 269 | 198 | - 308 | 1 ,512 | - 1 41 | - 185 | 5 45 | 688 |
© 2026 Citigroup Inc. No redistribution without Citigroup's written permission.
Source: Company Reports, Citi Research, Citi Research Estimates [讀者資訊已遮蔽] [讀者資訊已遮蔽]
Valuation Methodology and Risks
We value Voltronic using a forward target P/E of 25x our 2027E EPS to derive a target price of NT$1,050, broadly in line with its long-term average forward P/E since 2013. We believe forward P/E is appropriate given the company's established earnings base and the importance of product mix and operating leverage to its profitability. Using 2027E EPS captures a fuller year of anticipated earnings recovery following the softer 2026E base, alongside the ongoing transition toward online and higher power UPS. This also aligns our valuation with the earnings outlook investors are likely to focus on as the recovery progresses.
Our target multiple of 25x is supported by Voltronic's competitive position in UPS outsourcing. Its established relationship with western power vendors and ability to accommodate high mix, low volume production creates a solid foundation for the intact share gains, supporting the durability of its earnings and hence justify a valuation broadly consistent with its historical average. Stronger evidence of power rack commercialization and sustained UPS mix improvement could support a further re-rating.
Figure 28. Voltronic: Forward P/E vs. Earnings Growth
Figure 29. Peers Comp: Forward P/E vs. Earnings CAGR
© 2026 Citigroup Inc. No redistribution without Citigroup's written permission. Source: Citi Research, Citi Research Estimates
© 2026 Citigroup Inc. No redistribution without Citigroup's written permission. Source: Bloomberg, Citi Research, Citi Research Estimates
Figure 30. Valuation Comp Table for UPS
| Company Talwan Valtranic Delta Lite-On | RIC 6409.TW 2308.TW 2301.TW | Rating Curr NR 1 1 TWD TWD TWD | Target Price 2,280.0 1,050.0 | Price 12-0ct 1,900.0 875.0 | Mkt-Cap US$M 154,557.6 2,418.3 | 3M ADT US$M 686.7 14.7 | FY26E 26.5 49.9 | P/E (x) FY27E 20.7 32.9 | FY28E 18.5 20.1 | FY26E 16.5 27.0 | EV/EBITDA (x) FY27E 14.6 17.7 | FY28E 13.2 11.0 | FY26E 10.6 1L1 | P/B (x) FY27E 10.0 8.6 | FY28E 9.3 6.2 | FY25E 4.0 0.6 | Dividend yleld (%) FY26E 3.3 10 | FY27E FY28E 4.2 1.6 | 2.6 4.7 | 26- 28E 2yr EP5 CAGR (%) 19.7 57.7 | ROE FY26E FY27E FY28E 25% 25% 34% |
|---|---|---|---|---|---|---|---|---|---|---|---|---|---|---|---|---|---|---|---|---|---|
| 50% 29% 52% 36% | |||||||||||||||||||||
| fà | 288.0 | 20,889.4 | 26.4 | 18.9 | 137 | 6.4 | 5.7 | 2.6 | 36 | 38.7 | 31% 40% | ||||||||||
| CyberPower | 3617.TW | NR TWD | na | 258.5 | 767.1 | 218.6 42 | na | nà | na | 17.7 | 121 | 9.3 nà | na | na | 5.1 ná | 1.7 na | nà | 5.6 na | na | na | nà na |
| Sub-Average | 34.3 | 24.2 | 17.4 | 20.4 na | 14.8 na | 11.2 | 9.4 | 8.1 | 6.9 | 2.1 | 2.3 | 3.1 na 4.3 | 30.7 | 20% | 37% 42% | ||||||
| Global | 002335.SZ | NR CNY | na | 28.2 | 3,184.0 | 98.9 | 33.0 | 24.7 | 18.7 | 17.4 | 12.7 | 11.5 | 28 | 2.6 | 2.3 | 12 | 1.7 | 2.4 4.0 | 32.9 | 10% | 13% 16% |
| KSTAR Kehua | 002518.SZ | NR CNY | na | 31.4 | 2,727.5 | 78.5 | 21.0 | 16.4 | 127 | 16.3 | 11.4 | 8.4 | 34 | 2.9 | 25 | 1.4 | 19 | 29 17 | 37.1 | 14% | 18% 20% |
| Fujl Electric | 6504T | 1 JPY | 18,000.0 | 15,015.0 | 13,844.5 | 723 | 22.6 | 17.8 | 16.7 | 10.7 | 9.0 | 8.1 | 28 | 2.6 | 2.4 | i1 | 1.3 | 1.6 1.7 | 16.0 | 13% | 15% 15% |
| Mitsubishi Electric | 6503T | 1 JPY | 7,200.0 | 5,143.0 | 66,486.3 | 205.1 | 25.9 | 18.8 | 17.3 | 145 | 10.1 | 9.4 | 2.4 | 21 | 1.9 | 1.0 | 11 | 12 1.3 | 20.9 | 10% | 12% 11% |
| Vertiv | VRT.N 1 | USD | 358.0 | 242.8 | 93,457.4 | 307.4 | 36.3 | 26.8 | 20.9 | 27.3 | 18.7 | 14.2 | 14.9 | 9.9 | 6.9 | ná | ná nà | 35.9 | 45% | 42% %8€ | |
| ADD | ABBN.S | CHF | 85.0 | 79.8 | 175,233.6 | 211.8 | 20.6 | 25.6 | 22.7 | 22.0 | 17.7 | 15.7 | 8.4 | 7.2 | 6.0 | 12 | 1.3 | 1.3 | (a) | 43% | 29% 20% |
| Slemens Energy | 2 ENRin.DE 2 | EUR | 185.0 | 145.8 | 141,559.8 | 325.6 | 30.6 | 21.6 | 16.6 | 18.4 | 13.1 | 11.2 | 9.7 | 7.1 | 0.5 | 13 15 20 | 27 | 38.0 | 35% | 47% 49% | |
| SchnelderElectric | SCHN.PA 1 | EUR | 370.0 | 268.5 | 174,021.5 | 288.7 | 24.9 | 210 | 18.6 | 17.6 | 14.8 | 129 | 5.6 | 4.9 | 42 | 1.6 | 17 | 20 | 19.1 | 21% | 23% 23% |
| Eaton | ETN.N | 1 USD | 485.0 | 429.7 | 166,876.1 | 232.2 | 31.7 | 26.8 | 23.0 | 19.7 | 17.6 | 7.6 | 71 | 6.4 | 0.9 | 16 10 | u1 | 24.5 | 20% | 24% 26% | |
| Emerson Electric | EMR.N | 1 U5D | 182.0 | 161.8 | 90,268.8 | 121.9 | 247 | 22.5 | 20.3 | 18.7 | 16.8 | 15.4 | 25.6 | 17.2 | 14.6 | 1.3 | 1.4 | 1.0 14 1.4 | 11.2 | 23% | 70% 60% |
| Sub-Average | 28.9 | 22.5 | 18.6 | 18.7 | 14.6 | 6.6 | 5.4 | 1.0 | 1.3 | 1.5 1.9 | 25.3 | 0.2 | £°0 0.3 | ||||||||
| 31.6 | 23.3 | 18.0 | 19.6 | 14.7 | 12.2 11.7 | 88 8.9 | 7.4 | 6.1 | 1.6 1.8 | 2.3 | 3.1 | 26% | 33% 36% |
*Note: 1=Buy, 2=Neutral, 3=Sell, H=High Risk
Average
32.0
Source: Powered by DataCentral, Citi Researchestimatesand l/B/E/S estimatesfor Not-Rated (NR)Companies
© 2026 Citigroup Inc. No redistribution without Citigroup's written permission. Source: Bloomberg, Citi Research, Citi Research Estimates [讀者資訊已遮蔽] Key downside risks to our Buy rating and target price include:
- Slower UPS demand or outsourcing gain. Weaker commercial and industrial spending, delayed datacenter projects or customer inventory adjustments could weigh on orders.
- Less favorable product mix and margin pressure. A slower transition toward online and high-power UPS, more aggressive pricing or higher component costs could limit margin improvement.
- Persistent PV inverter competition. Aggressive pricing by Chinese suppliers, weaker residential solar demand or unfavorable subsidy changes could pressure inverter sales and profitability.
Our quantitative model assigns a High Risk rating to Voltronic. However, we believe such a rating is not warranted due to: 1) its established franchise and longstanding relationships with leading power vendors, with demanding qualification requirements and high customization supporting customer retention and repeat business; 2) its track record of profitability and positive operating cash flow enables internally funded investment and reduces reliance on external financing; and 3) the company has a strong balance sheet and has been in net cash position.
[讀者資訊已遮蔽]
Figure 31. Voltronic: Capacity Mix
Company Overview
Established in 2008 and listed on the Taiwan Stock Exchange in 2014, Voltronic Power is a Taiwan-based design and manufacturing service (DMS) provider specializing in uninterrupted power supplies (UPS) and power-conversion products. The company is headquartered in Taipei and operates manufacturing facilities in Taiwan, China and Vietnam, with approximately 5,000 employees.
Voltronic adopts a pure-play ODM business model and does not market products under its own brand. This avoids direct competition with customers and has helped the company establish long-term relationships with most global Tier-1 UPS brands, as well as numerous regional brand owners.
The company provides customers with product design, R&D, sourcing, manufacturing and system integration services, with a focus on high-mix, relatively low-volume and customized products.
Voltronic's core products include offline UPS systems ranging from 400VA to 3kVA and on-line UPS systems ranging from 1kVA to 3MVA. The company has progressively expanded from conventional single phase UPS products into threephase, high-power and modular UPS systems. It has also diversified into off-grid and hybrid solar inverters, energy storage systems, and EV chargers.
In 2025, online UPS contributed 37% of group sales, offline UPS 26%, inverters 29% and others 8%. By geo, Asia accounted for 60% of group sales, followed by Americas 22%, EU 16% and others 2%.
Figure 32. Voltronic: Sales by Product (2025)
© 2026 Citigroup Inc. No redistribution without Citigroup's written permission.
Source: Company Reports, Citi Research
© 2026 Citigroup Inc. No redistribution without Citigroup's written permission. Source: Company Reports, Citi Research
[讀者資訊已遮蔽]
Figure 33. Voltronic: Photo of Offline UPS
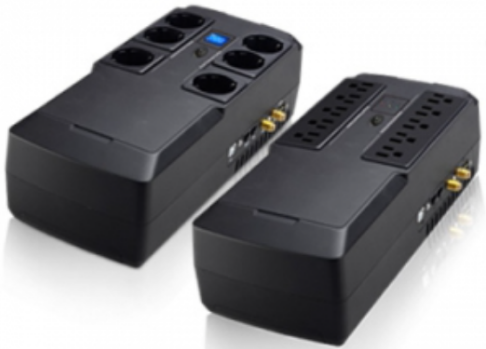
Figure 34. Voltronic: Photo of Online Power Modular UPS
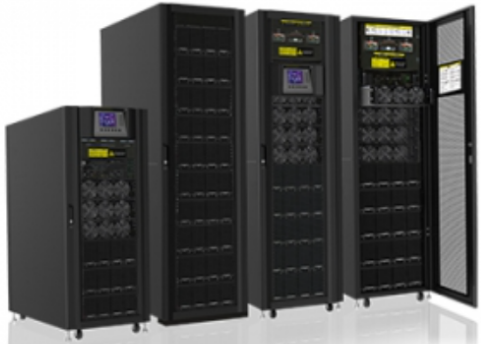
© 2026 Citigroup Inc. No redistribution without Citigroup's written permission. Source: Voltronic, Citi Research
© 2026 Citigroup Inc. No redistribution without Citigroup's written permission. Source: Voltronic, Citi Research
Shareholder Structure
As of March 2026, founder, chairman and general manager Alex Hsieh was the largest individual shareholder, holding 9.6% of outstanding shares. Based on disclosed direct, family-related and investment company holdings, we estimate the founder and related parties collectively controlled c.30% of outstanding shares.
Key Management Team
- nAlex Hsieh - Founder, Chairman and General Manager: Mr. Hsieh has led Voltronic since its establishment in 2008. He holds a bachelor's degree in business management from Tatung University and previously served as Chairman and General Manager of Centralion Industrial and as a director of Phoenixtec Power. His extensive experience in the UPS industry underpins Voltronic's pure-play ODM strategy.
- nMonica Wang - Vice General Manager: Ms. Wang joined Voltronic at its establishment in 2008. She previously worked as a manager at Centralion Industrial.
- nChih-Hsin Chin - Vice General Manager: Mr. Chin joined Voltronic in 2008. Before joining the company, he worked as a manager at Phoenixtec Power.
[讀者資訊已遮蔽] Others, 41%
Figure 35. Voltronic: Shareholder Mix
Local
Fund,
7%
Local Prop , 0%
© 2026 Citigroup Inc. No redistribution without Citigroup's written permission. Source: TEJ, Citi Research
© 2026 Citigroup Inc. No redistribution without Citigroup's written permission. Source: TEJ, Citi Research
Companies Mentioned:
ABB (ABBN.S; SFr80.02; 2; 12 Oct 26; 17:30) | Delta Electronics (2308.TW; NT$1775.0; 1; 13 Oct 26; 13:30) | Eaton Corp (ETN.N; US$426.69; 1; 12 Oct 26; 16:00) | Emerson Electric Co. (EMR.N; US$162.46; 1; 12 Oct 26; 16:00) | Fuji Electric (6504.T; ¥14610.0; 1; 13 Oct 26; 15:30) | Mitsubishi Electric (6503.T; ¥5177.0; 1; 13 Oct 26; 15:30) | Schneider Electric (SCHN.PA; €265.35; 1; 12 Oct 26; 17:30) | Siemens Energy AG (ENR1n.DE; €146.78; 2; 12 Oct 26; 17:30) | Vertiv Holdings Co (VRT.N; US$239.36; 1; 12 Oct 26; 16:00)
FINI, 52%
[讀者資訊已遮蔽]
Bull/Bear: Voltronic Power (6409.TW)
[讀者資訊已遮蔽]
Voltronic Power
Company description
Established in 2008 and listed on the Taiwan Stock Exchange in 2014, Voltronic is a Taiwan-based design and manufacturing service (DMS) provider specializing in uninterrupted power supplies (UPS) and power-conversion products. Voltronic adopts a pure-play ODM business model, which avoids direct competition with customers and has helped the company establish long-term relationships with most global Tier-1 UPS brands. The company is headquartered in Taipei and operates manufacturing facilities in Taiwan, China and Vietnam.
Investment strategy
We have a Buy rating on Voltronic, supported by an earnings recovery, structural UPS outsourcing and emerging opportunities in AIDC power infrastructure. Its customization capabilities and longstanding relationships with western power vendors position it to capture additional outsourcing orders and expand into higher power products. HVDC power racks offer a L-T growth opportunity and potential re-rating catalyst. We view 2026E as earnings trough, with a richer online UPS mix and operating leverage driving a 28% earnings rebound in 2027E.
Valuation
We value Voltronic using a forward target P/E of 25x our 2027E EPS to derive a target price of NT$1050, broadly in line with its long term average forward P/E since 2013. We believe forward P/E is appropriate given the company's established earnings base and the importance of product mix and operating leverage to its profitability.
Risks
Key downside risks to our Buy rating and target price include: 1) Slower UPS demand or outsourcing gain. 2) Less favorable product mix and margin pressure. 3) Persistent PV inverter competition. 4) Weaker macro economy
If you are visually impaired and would like to speak to a Citi representative regarding the details of the graphics in this document, please call USA 1-888-500-5008 (TTY: 711), from outside the US +1-210-677-3788