PDF 原檔:Rippling Effect of Capacity Shift Will be Large_original.pdf
原始內容
37466
Passive Components
No
Skye Chen
+852 3470 0011
CNY
USD
at CATHAY LIFE INSURANCE Alvin Wu For the exclusive use of #AI#EV#Hardware Companies: Murata, Taiyo Yuden, TDK, Yageo, Walsin Technology, Hollystone, PSA, Nippon Chemi-con & SEMCO George Chang +852 3470 0011 george.chang@aletheia-capital.com Skye.chen@aletheia-capital.com Rippling Effect of Capacity Shift Will be Large Murata's potential 10 -20% capacity shift could remove JPY100-200bn of supply from commodity MLCCs -roughly equivalent to the combined FY25 MLCC sales of Yageo and Walsin Tech. We believe this could tighten supply, trigger price hikes first among Asian suppliers, and ultimately force Japanese suppliers to reconsider pricing strategy. Even excluding price hikes, we forecast Murata/Taiyo Yuden OP to grow at 50%/90% CAGRs to JPY1tr/JPY140bn by FY3/29. We raise our Murata/Taiyo Yuden TPs to JPY15,000/JPY23,000, based on 35x/30x FY3/29 PER. We believe Yageo will be a major beneficiary in high voltage and commodity MLCC. From 30% to 80% CAGR for data center MLCC demand Our checks indicate Murata ' s upgrade to its FY25-30 data center MLCC growth outlook -from 30% to 80% -reflects larger-than-expected CSP spending, higher Vera Rubin MLCC content (2x volume), and especially TPU demand for training. Non-data center demand is also picking up on allocation fears. March MLCC orders at Murata and Taiyo Yuden hit historical highs, and we expect momentum to continue in 1QFY26 on potential price increases and shortage concerns. Current FY26 MLCC order books are already 70% above FY25 production, based on our checks. Data centers soaking up capacity Data center MLCCs consume roughly 10x the capacity of commodity MLCCs because their higher capacitance requires larger sizes and more layers. Lower yields for high-end products such as X6S and X7R further amplify the capacity burden , as we believe that even Murata's yield rate hovers at only 70% level. Despite unprecedented demand growth for a single MLCC application, suppliers remain reluctant to expand capacity beyond current 10-15% plans. We think this will be insufficient for FY27 and beyond, when data centers could become the largest MLCC end market at 40% of demand. Capacity shift will have a large impact on supply/demand We believe Murata is considering a 10-20% capacity shift. Given its ~JPY1tr in annual MLCC sales, this could remove JPY100-200bn of capacity from commodity MLCCs -roughly equal to the combined FY25 MLCC sales of Taiwan's two largest suppliers, Yageo and Walsin Technology. Yageo ' s MLCC utilization is now around 75%, but its B/B ratio has surged to 1.3, implying utilization could exceed 90% by 4QFY26. Murata's shift could create a supply vacuum, push up spot prices, and eventually prompt Asian suppliers to raise prices as demand accelerates. Japanese companies will need to reconsider pricing strategy Murata remains reluctant to raise prices (Taiyo Yuden basically follows), given its focus on longterm customer relationships. However, if industry-wide price hikes emerge, it may be unable to keep prices lower without triggering more orders than it can absorb. A widening price gap would also create arbitrage opportunities for distributors, which account for less than 10% of Murata sales but remain meaningful relative to Taiwanese suppliers' sales. PEER VALUATION COMPARISON
37466
| Murata | Taiyo Yuden | TDK | SEMCO | Yageo | |
|---|---|---|---|---|---|
| Stock code | 6981 JP | 6976 JP | 6762 JP | 009150 KS | 2327 TT |
| Rating | BUY | BUY | HOLD | Not Rated | Not Rated |
| M. Cap (US$ bn) | 101.7 | 13.0 | 43.1 | 86.0 | 56.0 |
| Share price (L.C.) | ¥ 8,556 | ¥ 15,725 | ¥ 3,504 | ₩ 1,747k | TWD 855 |
| TP (L.C.) | ¥ 15,000 | ¥ 23,000 | ¥ 3,300 | N.M. | N.M. |
| FY26E PER | 43.4 | 66.9 | 28.5 | 97.4 | 47.6 |
| FY27E PER | 29.9 | 35.1 | 26.6 | 53.3 | 32.6 |
| FY28E PER | 20.4 | 20.9 | 25.2 | 38.7 | 23.8 |
Source: Bloomberg, Aletheia Capital/TAG
Title twit er icon circleçåçæå°çµæ

0.089
0.135
JPY bn
FY23
Data center MLCC demand -CAGR from 30% to 80%
We have written extensively on how a CAGR of 60-70% in the TDP (thermal design power) roadmap would drive a similar demand growth for decoupling MLCC (we had assumed a 50% CAGR for simplicity) as capacitance requirement is a function of delta change in current and spec change (the duration of transient response time and change in voltage droop).
FIGURE 1 -MURATA MLCC SALES BREAKDOWN AND YOY GROWTH
3,000
2,500
2,000
1,500
1,000
500
0
FY24
FY25
FY26E
Other MLCC
FY27E
Source: Company data, Aletheia Capital/TAG
Alvin Wu
FY28E
FY29E
Server MLCC
MLCC sales growth
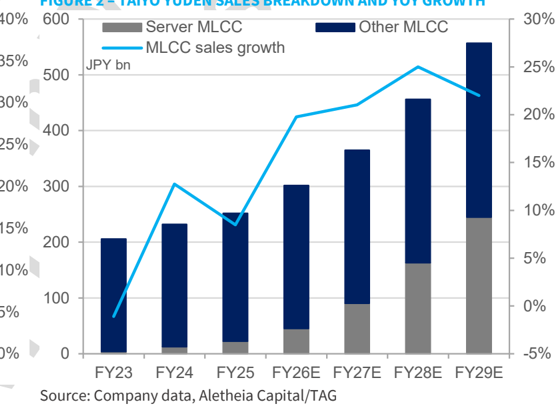
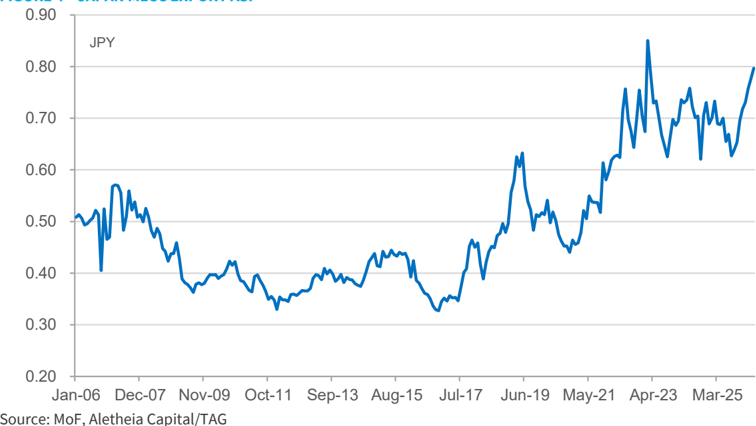
at CATHAY LIFE INSURANCE For the exclusive use of Our checks indicate that Murata ' s recent upward revision of its outlook for data center growth (from 30% to 80% for FY25-30) is due to 1) larger-than-expected CSP spending; 2) larger-than-expected MLCC content for Vera Rubin (2x MLCC volume); and in particular 3) the MLCC content in TPUs, in particular TPUs for training purposes. Murata ' s forecast was also echoed by Taiyo Yuden at its small meeting post-FY3/26 results. For FY26-27, we think the assumption for 80% is on the conservative side, as PSU and semiconductor suppliers have already guided for 100%+ growth. Furthermore, companies also indicate that growth guidance is constrained by supply rather than demand as each supplier is capped by the capacity availability. Based on an 80-90% CAGR for data center MLCC (we think Murata should grow faster due to its wider product portfolio in decoupling and powerline) and 8% CAGR for non-MLCC applications, the figures below are our MLCC forecasts for Murata and Taiyo Yuden. We estimate data centers will account for 50% of Murata ' s MLCC sales by FY28 from the low single digits in FY24. FIGURE 2 -TAIYO YUDEN SALES BREAKDOWN AND YOY GROWTH Source: Company data, Aletheia Capital/TAG Of Murata ' s guidance for 80-100% sales for data center MLCC in FY3/27, volume is expected to rise by 30%-40%, with the rest of 50-60% due to a mixed ASP change. As Vera Rubin begins to ramp and TPU production increases, data center MLCC growth should begin to accelerate in 2HFY. As a result, we should see a mixed ASP continue to trend up (Figure 4).
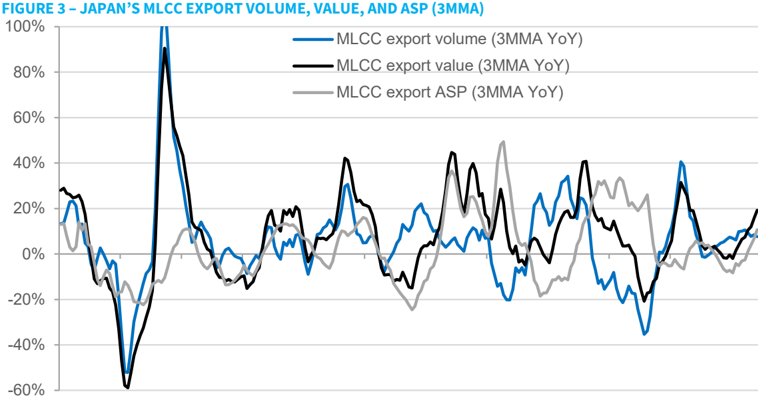
Source: MoF, Aletheia Capital/TAG Apr-07 Dec-08 Aug-10 Apr-12 Dec-13 Aug-15 Apr-17 Dec-18 Aug-20 Apr-22 Dec-23 Aug-25
FIGURE 4 -JAPAN MLCC EXPORT ASP
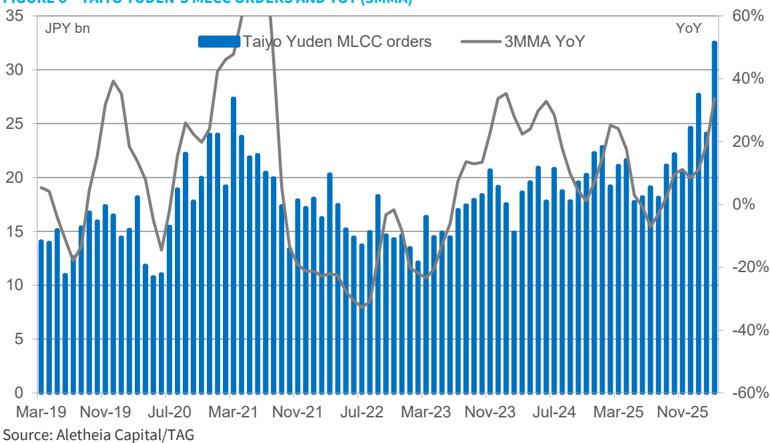
Recall that Murata began to talk about the potential for a ' squeezingout' effect at the end of 2025, as it saw non-data center demand also beginning to pick up, out of fear of an allocation shortage. As shown in the charts below, we estimate that monthly orders for MLCC began to rise from the end of FY25 and further accelerated into March as both companies posted historically high orders for MLCC. We think that order momentum is continuing in 1QFY26 on expectations of a potential price increase. If we were to use 100 as the base for Murata's FY25 MLCC production volume, current order book for FY26 already stands at 170, based on our check.
Passive Components
Rippling Effect of Capacity Shift Will be Large
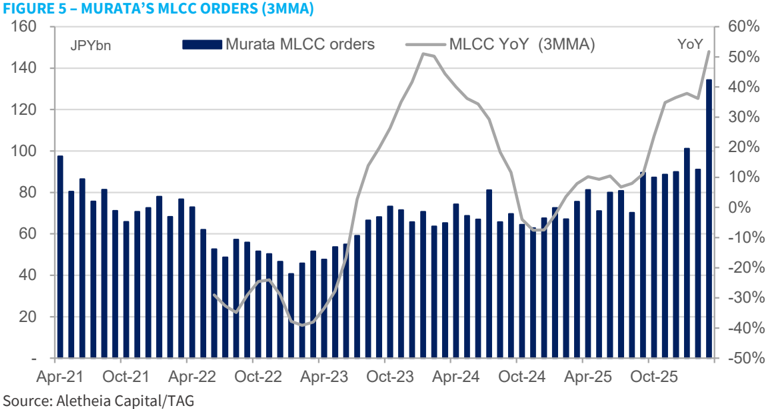
FIGURE 6 -TAIYO YUDEN ' S MLCC ORDERS AND YOY (3MMA)
Rippling Effect of Capacity Shift Will be Large
Shifting production up to 20% will have a large impact on the industry
Given the diversified nature of the MLCC market (similar to analog semiconductors), the data center growth that we are witnessing is unprecedented, so companies are also adapting as they see how demand changes. We think this is also one of the reasons for suppliers ' reluctance to sharply expand capacity vs. the current guidance of 10-15% for Murata and 10% for Taiyo Yuden.
FIGURE 7 -MLCC APPLICATION BY END MARKETS
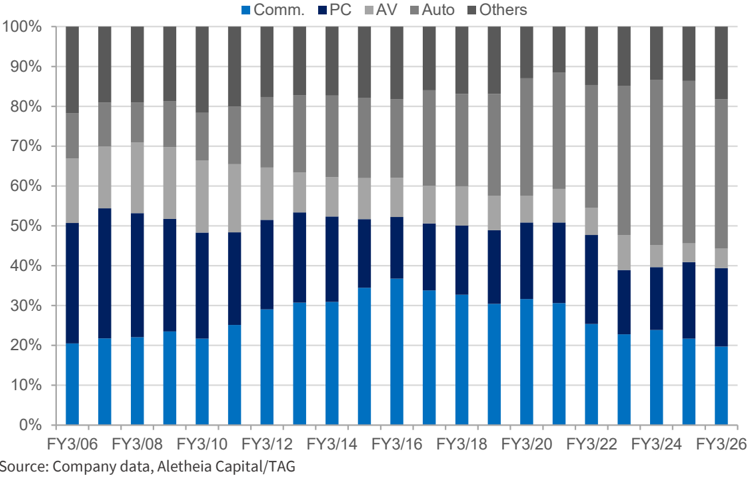
So instead of sharply increasing capacity, as Murata indicated at the small meeting, it is considering shifting production for other applications to data centers. But we believe the other reasons are a 10:1 ratio in capacity consumption for data center MLCC vs. regular MLCC, as well as a low yield rate for data center MLCC.
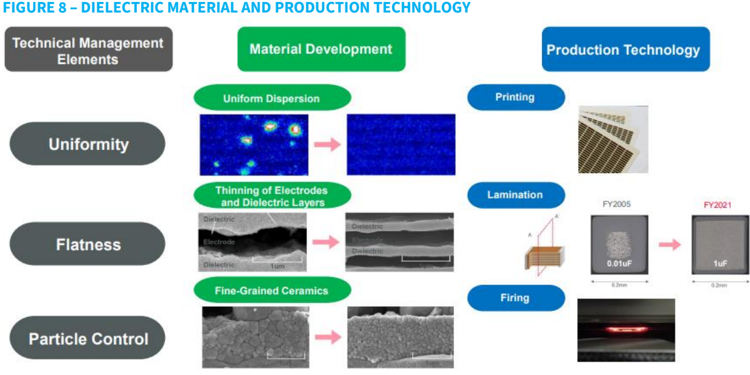
We estimate that the yield rate for some data center MLCC is only 70% vs. 95%+ for commodity MLCC due to stringent specs that require tight crystals in dielectric layers to be tightly compacted to prevent capacitance drift in higher temperatures for products such as X6S and X7R (X stands for -55°C, and 6 stands for tolerance up to 105°C and 7 is up to 125°C, and S and R stand for capacitance change within 15% or 25%). We think this is why Murata and Taiyo Yuden have recently been stressing the importance of internal materials and inhouse production equipment.
FIGURE 8 - DIELECTRIC MATERIAL AND PRODUCTION TECHNOLOGY
Technical Management
Elements
Flatness
Particle Control
Source: Murata
Material Development
Thinning of Electrodes and Dielectric Layers
Dielectric
Electrode
Dielectric
Fine-Grained Ceramics
Source: Murata
Printing
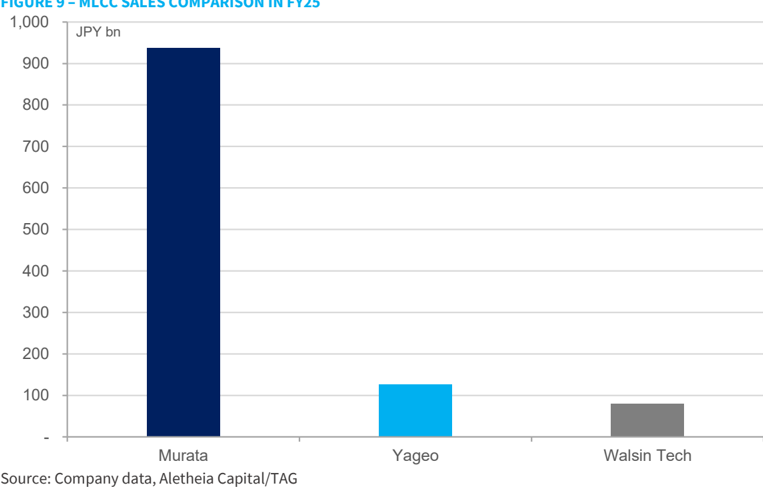
We believe Murata is considering shifting 10-20% capacity (more likely towards 20%). Given Murata's ~JPY1tr in annual MLCC sales, this represents a potential JPY100-200bn shift in capacity from the commodity market. The impact on the industry will be enormous, as the combined sales of the two largest MLCC suppliers in Taiwan, Yageo and Walsin Tech, add up to about JPY200bn in FY25.
FIGURE 9 -MLCC SALES COMPARISON IN FY25
Source: Company data, Aletheia Capital/TAG
We believe Yageo ' s MLCC utilization rate is at 75%, but our checks indicate its B/B ratio has also surged to 1:3, so the utilization rate should reach +90% by 4QFY25. Taiwanese suppliers have so far exercised caution about raising MLCC prices due to their current yield rate as well as clients ' backlash after 2017-18 price hikes. But the supply vacuum resulting from Murata ' s production shift could trigger an increase in spot MLCC prices and eventually prompt Asian suppliers to raise prices as they see a tsunami of demand.
We believe Murata is still reluctant to raise prices, considering its stance on maintaining longterm relationships. But if we see an industry-wide price hike, Murata cannot maintain a lower price as this will prompt further order surges that it will not be able to handle (we are already hearing cases of Murata declining orders). Furthermore, this will also create arbitrage
Production Technology
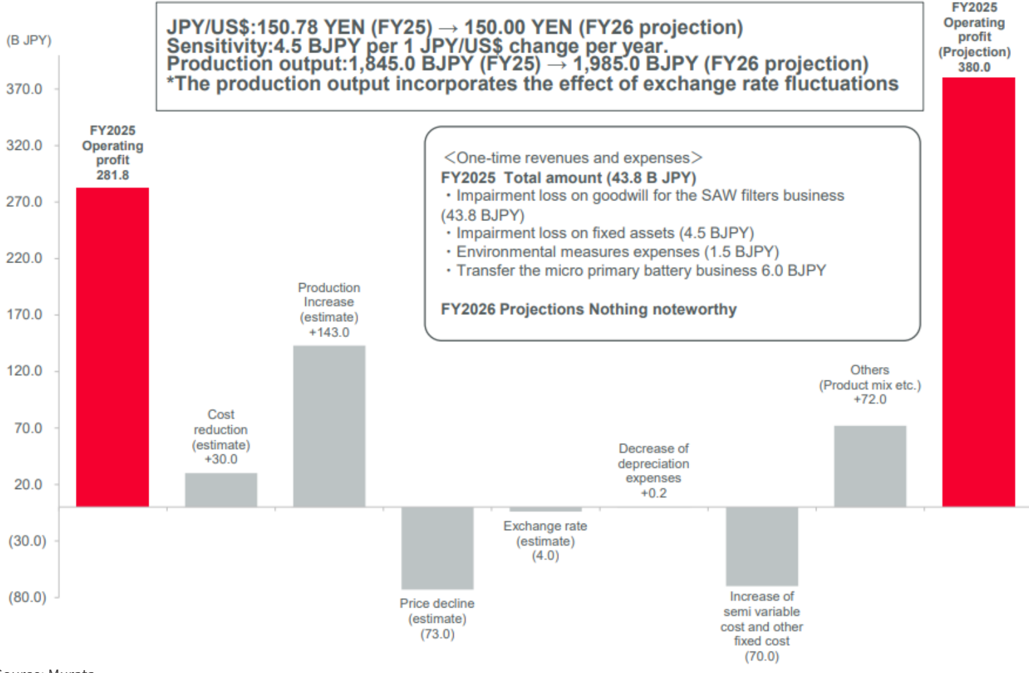
FIGURE 10 - MURATA'S OP WATERFALL GUIDANCE FOR FY3/27
JPY/US$:150.78 YEN (FY25) → 150.00 YEN (FY26 projection)
FY2025
Operating profit
281.8
320.0
270.0
220.0
170.0
120.0 -
70.0
20.0
(30.0)
(80.0)
<One-time revenues and expenses>
opportunities for distributors (we estimate distributors account for <10% of Murata sales, but still a large number vs. Taiwanese companies ' sales).
We are not incorporating price hikes for Murata and Taiyo Yuden in our forecasts. But we think Murata will eventually be forced to reconsider its pricing strategy and could eventually be forced to raise prices -not unlike the 2018 price hikes. One should also note price hikes in the previous cycle was selective -we think Apple was not subject to price hikes given their large volume. Meanwhile, the current demand surge is not anything that the industry has ever seen.
Others
Marginal profit differences between Murata and Taiyo Yuden
Our forecasted 50/90% CAGR in OP for Murata/Taiyo Yuden is based on the high marginal profit of these companies. As shown in the figures below, the two largest drivers to profits are utilization rate and ASP pressure. Murata's marginal profit on production value change (utilization rate profit is a function of production value rather than sales so OPM tend to expand as companies built up inventories on a upcycle and vice versa) is consistently at about 65% . Note that Murata's FY3/27 OP waterfall analysis in cludes JPY72bn positive impact in others category of which JPY43.8bn is attributed to one-offs in FY3/26 and the remaining JPY28.2bn is due to product mix change -i.e. about 1.5% OP margin improvement due to better MLCC product mix. cost and other fixed cost
FIGURE 10 -MURATA'S OP WATERFALL GUIDANCE FOR FY3/27
(70.0)
Source: Murata
Cost reduction
(estimate)
+30.0
FY2025
Operating profit
Passive Components
Rippling Effect of Capacity Shift Will be Large
FIGURE 11 - MARGINAL PROFIT ANALYSIS FOR MURATA
| JPYm | FY3/22 | FY3/23 | FY3/24 | FY3/25 | FY3/26 | FY3/27COE |
|---|---|---|---|---|---|---|
| Reported production value | 1,880,000 | 1,744,000 | 1,568,000 | 1,726,000 | 1,845,000 | 1,985,000 |
| JPY/USD | 112.38 | 135.48 | 144.62 | 152.57 | 150.78 | 150.00 |
| Forex sales sensitivity | 12,000 | 10,000 | 10,000 | 9,000 | 9,000 | 9,000 |
| Forex impact on production value | 75,840 | 230,975 | 91,450 | 71,527 | (16,110) | (7,020) |
| Reported production value change strip out forex | 243,000 | (136,000) | (176,000) | 158,000 | 119,000 | 140,000 |
| Production value change (forex adjusted) | 167,160 | (366,975) | (267,450) | 86,473 | 135,110 | 147,020 |
| Utilization profit change | 117,000 | (215,000) | (129,000) | 115,000 | 156,000 | 143,000 |
| Marginal profit on production value change | 70% | 59% | 48% | 133% | 115% | 97% |
| ASP pressure factor | (32,000) | (21,000) | (67,000) | (90,000) | (105,000) | (73,000) |
| YoY change in production value (add back ASP pressure) | 199,160 | (345,975) | (200,450) | 176,473 | 240,110 | 216,000 |
| Marginal profit including ASP pressure | 59% | 62% | 64% | 65% | 65% | 65% |
| ASP pressure | -1.8% | -1.2% | -4.1% | -5.4% | -6.1% | -3.9% |
| OP impact per 1%ASP pressure | 18,125 | 16,868 | 16,402 | 16,534 | 17,259 | 18,870 |
| Mixed change | 1.5% |
Source: Company data, Aletheia Capital/TAG
As shown in the figure below, we estimate that the marginal profit for Taiyo Yuden has ranged between from 20~90% in past years as Taiyo Yuden's utilization profit number includes inventory change, sales change, and product mix change (our analysis strips out inventory change). The low 22% marginal profit in FY3/24 was due to a surge of Chinese smartphone demand that was of relatively lower margin. As the strength for Taiyo Yuden is in the largesize, high-cap MLCC (as well asl ultra small-size MLCC for iPhone application), decoupling MLCC for data center application plays into Taiyo Yuden's strength. Taiyo Yuden's high marginal profit also makes it a high beta stock in this upturn.
FIGURE 12 - MARGINAL PROFIT ANALYSIS FOR TAIYO YUDEN
| JPYbn | FY3/21 | FY3/22 | FY3/23 | FY3/24 | FY3/25 | FY3/26 | FY3/27COE |
|---|---|---|---|---|---|---|---|
| Reported sales change | 18.59 | 48.72 | (30.13) | 3.14 | 18.79 | 13.90 | 28.7 |
| Sales change due to forex | (5.30) | 15.40 | 37.60 | 13.10 | 15.40 | (4.10) | - |
| Yen change YoY | (3.09) | 5.59 | 22.64 | 9.12 | 9.29 | (2.62) | 0.01 |
| sales sensitivity to yen | 1.72 | 2.75 | 1.66 | 1.44 | 1.66 | 1.56 | 1.56 |
| Actual sales change strip out forex | 23.9 | 33.3 | (67.7) | (10.0) | 3.4 | 18.0 | 28.7 |
| Utilization profit | 36.7 | 41.6 | (45.5) | (2.1) | 35.5 | 30.7 | 32.9 |
| Inventory change | (1.9) | 9.5 | (7.4) | (6.1) | 7.5 | (1.8) | 1.8 |
| actual sales change, mix | 38.6 | 32.1 | (38.1) | 4.0 | 28.0 | 32.5 | 31.2 |
| Marginal profit on sales change (not including ASP) | 161% | 96% | 56% | -40% | 826% | 180% | 109% |
| Sales change including (add back ASP pressure) | 49.8 | 39.9 | (53.0) | 18.4 | 29.4 | 38.2 | 47.6 |
| ASP pressure factor to OP | (25.9) | (6.6) | (14.7) | (28.4) | (26.0) | (20.2) | (18.9) |
| Marginal profit on sales change (including ASP) | 77% | 80% | 72% | 22% | 95% | 85% | 65% |
| ASP pressure | -7.9% | -1.9% | -4.4% | -8.1% | -7.1% | -5.4% | -4.7% |
| OP impact per 1%ASP pressure | 3.27 | 3.56 | 3.34 | 3.51 | 3.64 | 3.76 | 4.03 |
| Taiyo Yuden'sOP | 40.8 | 68.2 | 32.0 | 9.1 | 10.5 | 20.0 | 30.0 |
| ASP pressure 's impact to OP (as a %of OP) | -64% | -10% | -46% | -313% | -249% | -101% | -63% |
Source: Company data, Aletheia Capital/TAG
Taiwan MLCC supply chain
GPU -based AI server systems are exceptionally MLCC -intensive. A single GPU in the HGX (Blackwell) form factor requires over 3,000 MLCCs, while the NVL72 rack -scale (GB200/GB300) configuration drives this further to around 6,000 MLCCs per GPU -representing roughly 3× and 6× the MLCC content of a typical general -purpose server, respectively. We see three structural trends that will continue to drive overall MLCC demand in AI servers -especially for high -capacitance MLCCs, where content growth is most pronounced.
- GPU migration toward higher compute density is materially increasing MLCC content, particularly for devices above 1 µF. For NVIDIA's next -generation Vera Rubin platform, MLCC demand per GPU is expected to exceed 13,000 units, roughly 2× the MLCC content of Grace Blackwell in the NVL72 rack -scale configuration.
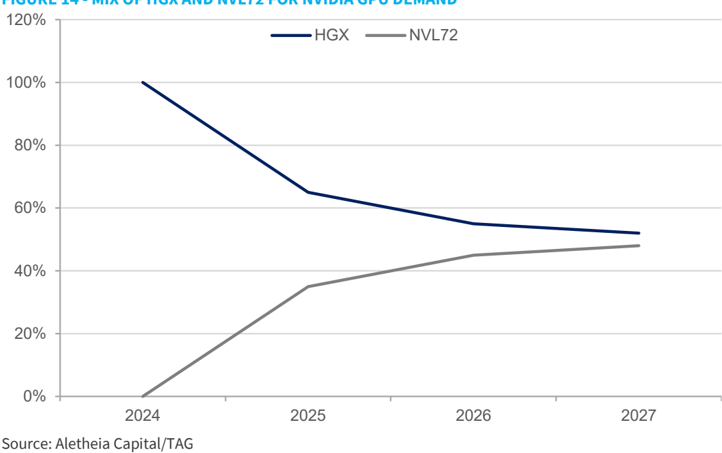
- NVIDIA's introduction of rack -scale architectures to improve GPU utilization has also driven a significant increase in MLCC density. MLCC content per GPU rises from roughly 3,000 units in the HGX configuration to about 6,000 units in rack -scale systems. Importantly, the share of high -capacitance MLCCs also increases, reaching ~85% penetration in rack -scale designs versus ~80% in HGX.
FIGURE 13 - MLCC DEMAND IN VARIOUS AI SERVERS AND GENERAL SERVERS
| General Server | Blackwell GPU - HGX | GB200/300 - NVL72 | VR100 - NVL72 | |
|---|---|---|---|---|
| Silicon solution | 2 of CPUs | 8 of Blackwell GPU | 2GPUs + 1CPU (Bianca module) | 2GPUs + 1CPU (Strata module) |
| MLCC demand per module | 25,000 | 9,000 | 17,000-18,000 | |
| MLCC per system | 2,000 | 440,000 per rack (excluding power shelf) | >900,000 per rack (excluding power shelf) | |
| MLCC per CPU/GPU | 1,000 | 3,125 | 6,111 | 13,194 |
| MLCC mix: | ||||
| <1uF | 25% | 15-20% | <15% | <10% |
| >1uF | 75% | 80% | 85% | 90% |
Source: Aletheia Capital/TAG
FIGURE 14 - MIX OF HGX AND NVL72 FOR NVIDIA GPU DEMAND
Source: Aletheia Capital/TAG
- Earlier adoption of HVDC 800V in Vera Rubin will increase high-voltage (NP0) MLCC demand by 60%-100% per rack
Supplier and market share for AI passive components
Within GPU racks, MLCCs are capturing a significantly larger share of total passive component value. For NVIDIA's Vera Rubin platform, MLCC value contribution is expected to rise to ~65%, up from 35 -40% in the GB200/GB300 generation -driven primarily by the continued shift toward high -capacitance MLCCs. MLCCs are broadly categorized into three segments: commodity MLCCs, high -voltage MLCCs (NP0), and high -capacitance MLCCs.
FIGURE 15 - PASSIVE COMPONENT VALUE MIX AND SUPPLIER FOR NVIDIA RACK SCALE CONFIGURATION
| GB200/GB300 | VR100 | Suppliers | |
|---|---|---|---|
| MLCC - commodity | Yageo | ||
| MLCC - high voltage | 37% (more than half is high capacitance) | 65% (more than 70% is high capacitance) | Yageo, Holystone, PSA, TDK |
| MLCC - high capacitance | Murata, Semco, Taiyo Yuden, TDK, Yageo | ||
| Tantalum | 35% | 10% | Kemet (Yageo), Panasonic |
| Resistors | 1% | <2% | Yageo, KOA, TFT |
| Inductor | 26% | 25% | Cyntec, Lianzhen, Pulse (Yageo) |
Source: Aletheia Capital/TAG
- Commodity MLCC: This is mainly supplied by Taiwanese suppliers such as Yageo and Walsin Technology. We see that its demand volume could continue to grow by 30% while migrating to the Vera Rubin GPU from the Grace Blackwell GPU.
- High-capacitance MLCC: This segment is primarily supplied by Murata, Samsung Electro -Mechanics (Semco), Taiyo Yuden, and TDK. Within GPU racks, high -capacitance MLCCs are taking an increasingly dominant share of total MLCC value -exceeding 50% in GB200/GB300 systems and rising to ~70% in the Vera Rubin NVL72 rack.
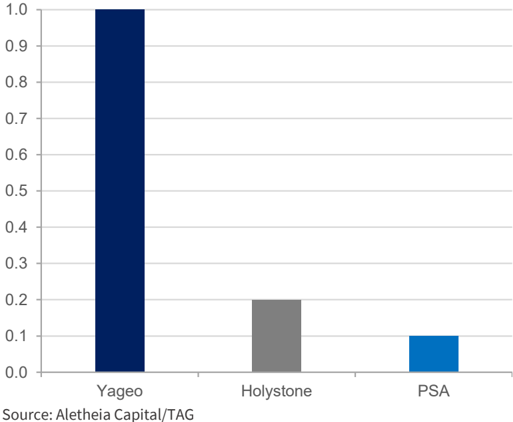
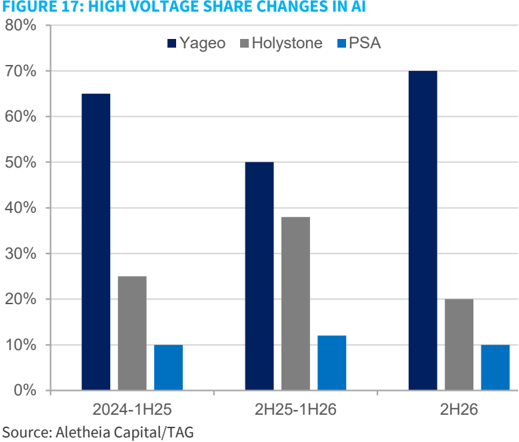
- High-voltage MLCC (>500 Voltage): This category is positioned for solid content -value growth as adoption of 400 V and 800 V DC architectures increases will require 60-100% highvoltage MLCC growth per rack. We believe Yageo holds the largest capacity in high -voltage MLCCs, with Hollystone and PSA (that is, Walsin Technology group companies including Prosperity Dielectric and Kamaya Electric) operating at roughly 20% and 10% of Yageo Group ' s capacity scale, respectively. Tightening supply conditions could enable Yageo to regain share, getting back to 70% in 2H26 from below ~65% in 1H26, with the potential to return to 70-75% in 2027 given its substantial capacity advantage.
FIGURE 16: HIGH VOLTAGE CAPACITY COMPARISON IN TAIWAN
Source: Aletheia Capital/TAG
Murata
Hardware #AI #Auto #EV
Price:
JPY 8,556
Target Price:
JPY 15,000
No
CNY
George Chang
+852 3470 0011 george.chang@aletheia-capital.com
Murata
Bloomberg
6981 JP
RIC
6981.T
Market cap (USDbn)
101.7
Average daily T/O (USD|m)
902.0
USD
Entering the JPY1tr OP Club
We believe Murata may transfer up to 20% capacity to support surging data center demand. While Murata is not considering price hikes, it may be ultimately forced to reconsider pricing strategy when other suppliers begin to raise prices, in a similar fashion to 2017-18. Without factoring a price hike, we estimate Murata ' s OP will grow at 50% CAGR to reach JPY1tr by FY3/29 driven by 90% growth in data center MLCC. We raise our FY3/27-29 OP estimate by 1772% and TP from JPY5,200 (25x FY3/28 PER) to JPY15,000 (35x FY3/29 PER).
Capacity shift will likely have large impact on supply/demand
We believe Murata is likely to considering shifting 10-20% of its capacity. Given its annual MLCC sales of ~JPY1tr, this represents a potential JPY100-200bn market vacuum. The impact on the industry will be large, as Yageo's 2026 MLCC sales are on track to ~JPY150bn (NT$30bn). This could trigger an increase in commodity prices and eventually prompt Asian suppliers to raise prices as they see a tsunami of demand, on top of the already 1.3x B/B ratio as reported by Yageo. We understand Murata is unwilling to raise prices, but it might eventually be forced to review its pricing strategy to prevent arbitrage -not unlike the FY17-18 cycle.
Non-MLCC is a mixed bag
Of Murata's sales guidance of JPY325bn for data centers in FY3/27, MLCC accounts for 74%, followed by 8% in power supplies (PMIC and PSU) and 6% in battery for BBU. Murata forecasts RF communication sales to decline 4% YoY in FY3/27 due to 15% decline in MetroCirc sales on ASP pressure and lower usage. RF module sales are expected to be flattish YoY -socket gains in Rx and Tx modules are as expected but this is also offset by another socket loss. SAW filter sales are expected to increase on further xBAR penetration within Apple. Energy power sales are expected to increase slightly by 2% on about JPY26bn PSU and PMIC (for Google) sales, but this is also offset by JPY12bn decrease in micro battery sales (sold to Maxell) and price pressure on power tool battery, despite BBU sales growth. But power supply business should turn profitable by 4QFY3/27 from our estimated JPY12bn loss in FY3/26 as new businesses pick up.
OP to reach JPY1tr in FY3/29 when data center MLCC sales exceed JPY1tr
Without incorporating price hike, we model MLCC sales to grow by a 30% CAGR from FY25-30 based on 90% for data centers and 9% for non-data center applications. As data center MLCC becomes 50% of MLCC sales by FY3/29 , we estimate Murata's OP will reach JPY1tr. An area in which Murata lags is silicon capacitors due to a lack of silicon supply (capacity from the IPDiA acquisition is insufficient), so how Murata secures additional foundry capacity would be key to monitor.
KEY FINANCIAL AND VALUATION MATRIX
| FYEMar (¥ bn) | FY24A | FY25A | FY26A | FY27E | FY28E | FY29E | FY30E |
|---|---|---|---|---|---|---|---|
| Revenue | 1,640 | 1,743 | 1,831 | 2,130 | 2,560 | 3,202 | 3,897 |
| OP | 215 | 280 | 282 | 459 | 674 | 1,001 | 1,362 |
| Pre tax profit | 239 | 304 | 309 | 482 | 699 | 1,027 | 1,389 |
| Net profit | 181 | 234 | 234 | 361 | 524 | 770 | 1,042 |
| FDEPS (¥) | 95.7 | 123.8 | 123.8 | 197.2 | 286.1 | 420.4 | 568.7 |
| DPS (¥) | 52.0 | 57.0 | 65.0 | 70.0 | 85.0 | 110.0 | 130.0 |
| PER(x) | 89.4 | 69.1 | 69.1 | 43.4 | 29.9 | 20.4 | 15.0 |
| PB (x) | 6.3 | 6.3 | 5.9 | 5.3 | 4.7 | 4.0 | 3.3 |
| EV/EBITDA (x) | 35.3 | 32.9 | 30.5 | 23.4 | 17.0 | 12.0 | 9.0 |
| ROE(%) | 6.9% | 9.1% | 8.6% | 12.2% | 15.6% | 19.4% | 21.7% |
| Cash yield (%) | 0.6% | 0.7% | 0.8% | 0.8% | 1.0% | 1.3% | 1.5% |
Source: Aletheia Capital/TAG
Upside:
75.3%
Total return:
76.1%
Risk: High
0.089
0.135
FIGURE 1 -EARNINGS REVISION FOR MURATA
| JPYm | FY3/27E (new) | FY3/27E (old) | FY3/28E (new) | FY3/28E (old) | FY3/29E (new) | FY3/29E (old) |
|---|---|---|---|---|---|---|
| Sales | ||||||
| Component | 1,446,270 | 1,278,041 | 1,808,638 | 1,413,386 | 2,391,400 | 1,566,841 |
| Capacitors | 1,201,224 | 1,036,221 | 1,547,105 | 1,155,277 | 2,111,591 | 1,293,910 |
| Inductors/EMI filter | 245,046 | 241,819 | 261,533 | 258,109 | 279,809 | 272,931 |
| Device module | 668,111 | 697,684 | 736,215 | 765,914 | 795,042 | 799,496 |
| RF, communication | 385,591 | 387,221 | 404,200 | 409,844 | 413,070 | 418,609 |
| Energypower | 167,951 | 200,186 | 209,426 | 240,279 | 253,254 | 259,306 |
| Functional device | 114,569 | 110,277 | 122,589 | 115,791 | 128,718 | 121,581 |
| Others | 15,156 | 14,259 | 15,156 | 14,259 | 15,156 | 142,529 |
| Total | 2,129,538 | 1,989,984 | 2,560,009 | 2,193,558 | 3,201,598 | 2,380,595 |
| COGS | 1,189,483 | 1,138,097 | 1,380,750 | 1,221,572 | 1,670,132 | 1,316,241 |
| GP | 940,054 | 851,886 | 1,179,260 | 971,987 | 1,531,467 | 1,064,354 |
| GPM | 44.1% | 42.8% | 46.1% | 44.3% | 47.8% | 44.7% |
| YoY | 21.3% | 12.1% | 25.4% | 14.1% | 29.9% | 10.0% |
| OPEX | 481,470 | 458,649 | 505,544 | 470,798 | 530,821 | 483,278 |
| SG&A | 311,479 | 297,519 | 327,053 | 306,445 | 343,406 | 315,638 |
| R&D | 169,991 | 161,130 | 178,490 | 164,353 | 187,415 | 167,640 |
| OP | 458,584 | 393,237 | 673,716 | 501,189 | 1,000,646 | 581,076 |
| OPM | 21.5% | 19.8% | 26.3% | 22.8% | 31.3% | 24.0% |
| YoY | 62.7% | 45.8% | 46.9% | 27.5% | 48.5% | 16.0% |
Source: Aletheia Capital/TAG estimates
FIGURE 2 -MURATA ' S MONTHLY ORDERS AND YOY (3MMA)
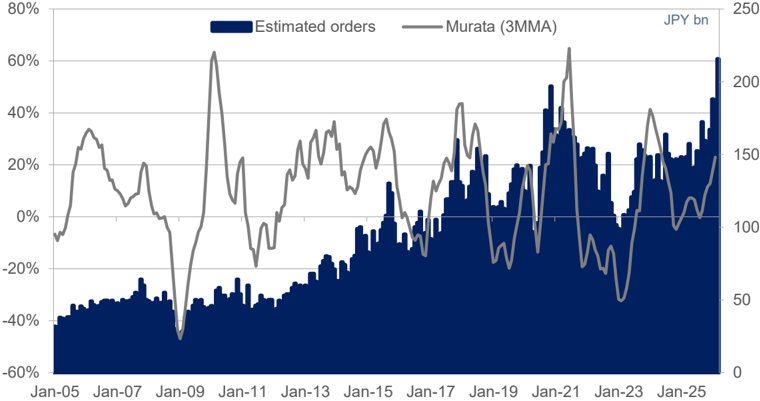
Source: Aletheia Capital/TAG estimates
FIGURE 3 MURATA'S MLCC ORDERS AND YOY (3MMA)
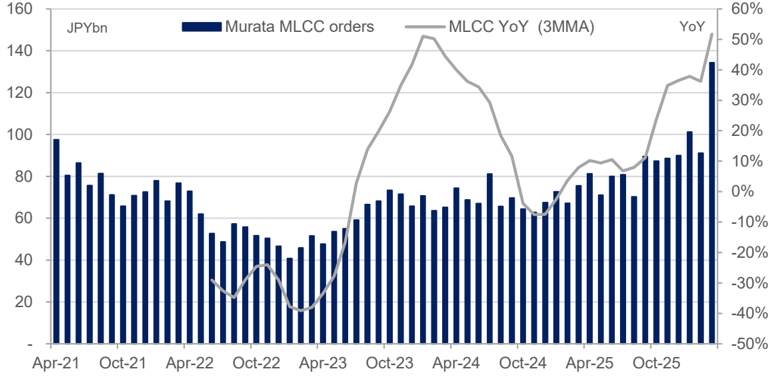
Source: Aletheia Capital/TAG estimates
Murata
Entering the JPY1tr OP Club
FIGURE 4 -QUARTERLY, HALF-YEAR, AND ANNUAL FORECAST FOR MURATA
| JPYm | 1QFY3/27E | 2QFY3/27E | 1HFY3/27E | 3QFY3/27E | 4QFY3/27E | 2HFY3/27E | FY3/27E | 1QFY3/28E | 2QFY3/28E | 1HFY3/28E | 3QFY3/28E | 4QFY3/28E | 2HFY3/28E | FY3/28E |
|---|---|---|---|---|---|---|---|---|---|---|---|---|---|---|
| Component | 333,746 | 367,011 | 700,757 | 373,429 | 372,085 | 745,514 | 1,446,270 | 412,887 | 462,643 | 875,530 | 470,438 | 462,670 | 933,108 | 1,808,638 |
| Capacitors | 276,009 | 304,092 | 580,101 | 310,848 | 310,275 | 621,123 | 1,201,224 | 350,532 | 395,320 | 745,851 | 404,103 | 397,151 | 801,254 | 1,547,105 |
| Inductors/EMI filter | 57,737 | 62,919 | 120,655 | 62,581 | 61,810 | 124,391 | 245,046 | 62,356 | 67,323 | 129,679 | 66,336 | 65,519 | 131,854 | 261,533 |
| Device module | 147,689 | 183,896 | 331,585 | 172,738 | 163,788 | 336,526 | 668,111 | 161,819 | 201,900 | 363,719 | 191,328 | 181,168 | 372,496 | 736,215 |
| RF, communication | 83,840 | 115,239 | 199,079 | 100,231 | 86,282 | 186,513 | 385,591 | 87,661 | 122,135 | 209,796 | 106,076 | 88,328 | 194,404 | 404,200 |
| Energy power | 37,310 | 39,355 | 76,666 | 43,543 | 47,742 | 91,285 | 167,951 | 45,761 | 48,412 | 94,173 | 54,261 | 60,992 | 115,253 | 209,426 |
| Functional device | 26,539 | 29,302 | 55,841 | 28,964 | 29,764 | 58,728 | 114,569 | 28,397 | 31,353 | 59,750 | 30,991 | 31,848 | 62,839 | 122,589 |
| Others | 3,702 | 3,663 | 7,365 | 3,720 | 4,071 | 7,791 | 15,156 | 3,702 | 3,663 | 7,365 | 3,720 | 4,071 | 7,791 | 15,156 |
| Total | 485,137 | 554,570 | 1,039,707 | 549,887 | 539,944 | 1,089,831 | 2,129,538 | 578,408 | 668,206 | 1,246,614 | 665,486 | 647,909 | 1,313,395 | 2,560,009 |
| COGS | 277,251 | 306,038 | 583,289 | 304,828 | 301,366 | 606,194 | 1,189,483 | 321,354 | 355,662 | 677,016 | 358,279 | 345,455 | 703,734 | 1,380,750 |
| GP | 207,886 | 248,532 | 456,418 | 245,059 | 238,578 | 483,637 | 940,054 | 257,054 | 312,544 | 569,598 | 307,207 | 302,454 | 609,661 | 1,179,260 |
| GPM | 42.9% | 44.8% | 43.9% | 44.6% | 44.2% | 44.4% | 44.1% | 44.4% | 46.8% | 45.7% | 46.2% | 46.7% | 46.4% | 46.1% |
| YoY | 20% | 19% | 20% | 26% | 20% | 23% | 21% | 24% | 26% | 25% | 25% | 27% | 26% | 25% |
| OPEX | 117,528 | 111,121 | 228,649 | 119,536 | 133,285 | 252,822 | 481,470 | 123,404 | 116,677 | 240,081 | 125,513 | 139,950 | 265,463 | 505,544 |
| SG&A | 74,922 | 70,272 | 145,194 | 77,013 | 89,272 | 166,285 | 311,479 | 78,668 | 73,786 | 152,454 | 80,864 | 93,736 | 174,600 | 327,053 |
| R&D | 42,606 | 40,848 | 83,455 | 42,523 | 44,013 | 86,536 | 169,991 | 44,737 | 42,891 | 87,627 | 44,649 | 46,214 | 90,863 | 178,490 |
| OP | 90,358 | 137,412 | 227,769 | 125,523 | 105,292 | 230,815 | 458,584 | 133,650 | 195,868 | 329,517 | 181,694 | 162,504 | 344,198 | 673,716 |
| OPM | 19% | 25% | 22% | 23% | 20% | 21% | 22% | 23% | 29% | 26% | 27% | 25% | 26% | 26% |
| YoY | 47% | 33% | 38% | 231% | 34% | 98% | 63% | 48% | 43% | 45% | 45% | 54% | 49% | 47% |
Source: Aletheia Capital/TAG estimates
FIGURE 5 - ANNUAL FORECASTS FOR MURATA
| JPYm | FY3/22 | FY3/23 | FY3/24 | FY3/25 | FY3/26 | FY3/27E | FY3/28E | FY3/29E | FY3/30E |
|---|---|---|---|---|---|---|---|---|---|
| Sales | |||||||||
| Component | 984,299 | 914,165 | 933,771 | 1,033,118 | 1,159,734 | 1,446,270 | 1,808,638 | 2,391,400 | 3,040,935 |
| Capacitors | 788,539 | 738,841 | 753,520 | 831,845 | 936,418 | 1,201,224 | 1,547,105 | 2,111,591 | 2,745,069 |
| Inductors/EMI filter | 195,760 | 175,324 | 180,251 | 201,273 | 223,316 | 245,046 | 261,533 | 279,809 | 295,866 |
| Device module | 815,040 | 760,980 | 695,236 | 697,165 | 655,966 | 668,111 | 736,215 | 795,042 | 841,197 |
| RF, communication | 528,217 | 453,646 | 440,142 | 443,602 | 394,829 | 385,591 | 404,200 | 413,070 | 422,300 |
| Energy power | 180,438 | 214,556 | 164,393 | 155,741 | 154,063 | 167,951 | 209,426 | 253,254 | 283,742 |
| Functional device | 106,385 | 92,778 | 90,701 | 97,822 | 107,074 | 114,569 | 122,589 | 128,718 | 135,154 |
| Others | 13,182 | 11,651 | 11,151 | 13,069 | 15,156 | 15,156 | 15,156 | 15,156 | 15,156 |
| Total | 1,812,521 | 1,686,796 | 1,640,158 | 1,743,352 | 1,830,856 | 2,129,538 | 2,560,009 | 3,201,598 | 3,897,288 |
| COGS | 1,044,292 | 1,010,948 | 1,003,361 | 1,025,650 | 1,056,030 | 1,189,483 | 1,380,750 | 1,670,132 | 1,977,904 |
| GP | 768,229 | 675,848 | 636,797 | 717,702 | 774,826 | 940,054 | 1,179,260 | 1,531,467 | 1,919,384 |
| GPM | 42.4% | 40.1% | 38.8% | 41.2% | 42.3% | 44.1% | 46.1% | 47.8% | 49.2% |
| YoY | 23% | -12% | -6% | 13% | 8% | 21% | 25% | 30% | 25% |
| OPEX | 344,169 | 377,961 | 375,695 | 426,955 | 455,517 | 481,470 | 505,544 | 530,821 | 557,362 |
| SG&A | 232,872 | 253,722 | 243,193 | 277,681 | 296,647 | 311,479 | 327,053 | 343,406 | 360,576 |
| R&D | 111,297 | 124,239 | 132,502 | 149,274 | 158,870 | 169,991 | 178,490 | 187,415 | 196,786 |
| OP | 424,060 | 297,887 | 215,447 | 279,702 | 281,835 | 458,584 | 673,716 | 1,000,646 | 1,362,022 |
| OPM | 23% | 18% | 13% | 16% | 15% | 22% | 26% | 31% | 35% |
| YoY | 35% | -30% | -28% | 30% | 1% | 63% | 47% | 49% | 36% |
Source: Aletheia Capital/TAG estimates
Murata
Entering the JPY1tr OP Club
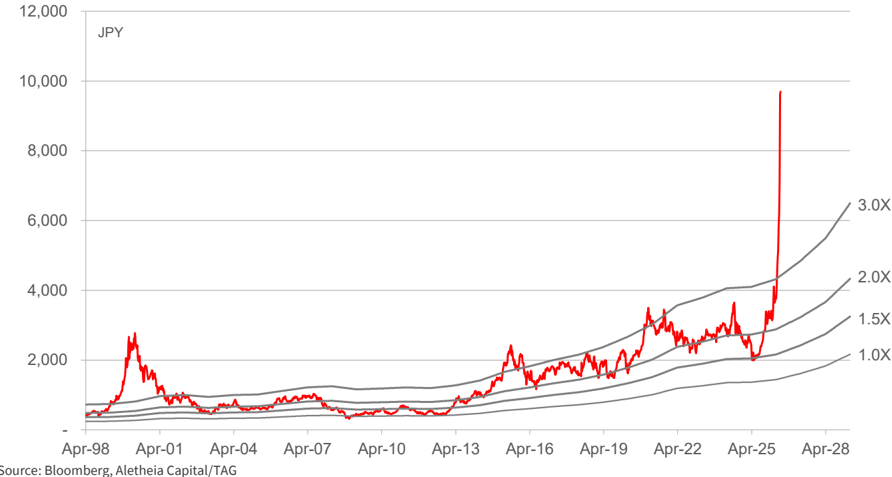
FIGURE 6 -MURATA'S PER TRADING RANGE
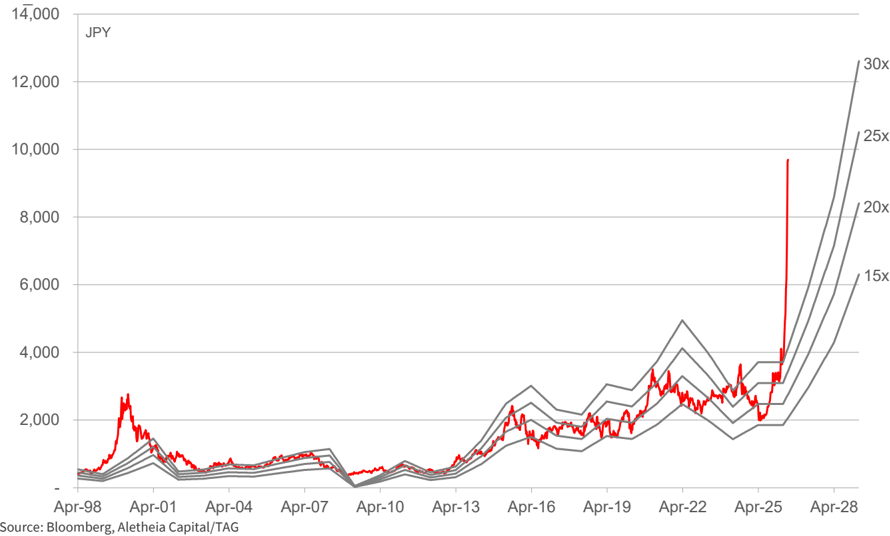
FIGURE 7 -MURATA'S P BR TRADING RANGE
Financial Statements
| INCOME STATEMENT | INCOME STATEMENT | INCOME STATEMENT | INCOME STATEMENT | INCOME STATEMENT | INCOME STATEMENT | INCOME STATEMENT | BALANCE SHEET | BALANCE SHEET | BALANCE SHEET | BALANCE SHEET | BALANCE SHEET | BALANCE SHEET | BALANCE SHEET |
|---|---|---|---|---|---|---|---|---|---|---|---|---|---|
| FYE Mar (¥ bn) | FY25A | FY26A | FY27E | FY28E | FY29E | FY30E | FYE Mar (¥ bn) | FY25A | FY26A | FY27E | FY28E | FY29E | FY30E |
| Revenue | 1,743 | 1,831 | 2,130 | 2,560 | 3,202 | 3,897 | Fixed Assets | 1,184 | 1,301 | 1,376 | 1,519 | 1,725 | 2,002 |
| Depreciation | 173 | 178 | 180 | 190 | 210 | 230 | Other LT Assets | 306 | 266 | 266 | 266 | 266 | 266 |
| EBITDA | 453 | 460 | 639 | 864 | 1,211 | 1,592 | LT investments | 40 | 50 | 50 | 50 | 50 | 50 |
| SG&A | 278 | 297 | 311 | 327 | 343 | 361 | Cash/eqvl. | 676 | 678 | 732 | 828 | 1,000 | 1,310 |
| OPNprofit | 280 | 282 | 459 | 674 | 1,001 | 1,362 | A/R | 294 | 328 | 382 | 459 | 574 | 699 |
| Non-op | 25 | 27 | 23 | 25 | 26 | 27 | Inventory | 483 | 520 | 586 | 681 | 823 | 975 |
| Pre-Tax Profit | 304 | 309 | 482 | 699 | 1,027 | 1,389 | Others | 96 | 79 | 79 | 79 | 79 | 79 |
| Tax expenses | 71 | 75 | 120 | 175 | 257 | 347 | Total Assets | 3,028 | 3,199 | 3,448 | 3,858 | 4,494 | 5,358 |
| Net Profit | 234 | 234 | 361 | 524 | 770 | 1,042 | |||||||
| FD EPS (¥) | 123.8 | 123.8 | 197.2 | 286.1 | 420.4 | 568.7 | A/P | 31 | 43 | 43 | 43 | 43 | 43 |
| Share counts (m) | 1,889 | 1,889 | 1,832 | 1,832 | 1,832 | 1,832 | STDebt | 1 | 2 | 2 | 2 | 2 | 2 |
| Revenue chg. (%) | 6.3 | 5.0 | 16.3 | 20.2 | 25.1 | 21.7 | LT Debt | 2 | 2 | 2 | 2 | 2 | 2 |
| EBITDA chg. (%) | 2.0 | 3.0 | 4.0 | 5.0 | 6.0 | 7.0 | Other LT Liabilities | 170 | 163 | 163 | 163 | 163 | 163 |
| OPNprofit chg. (%) | 29.8 | 0.8 | 62.7 | 46.9 | 48.5 | 36.1 | Total Liability | 447 | 480 | 490 | 505 | 527 | 550 |
| Net profit chg. (%) | 29.3 | 0.0 | 54.4 | 45.1 | 46.9 | 35.3 | Equity | 2,581 | 2,719 | 2,957 | 3,353 | 3,967 | 4,808 |
| FD EPS chg. (%) | 2.0 | 3.0 | 4.0 | 5.0 | 6.0 | 7.0 | Liabilities + Equity | 3,028 | 3,199 | 3,448 | 3,858 | 4,494 | 5,358 |
| CASH FLOWSTATEMENT | CASH FLOWSTATEMENT | CASH FLOWSTATEMENT | CASH FLOWSTATEMENT | CASH FLOWSTATEMENT | CASH FLOWSTATEMENT | CASH FLOWSTATEMENT | RATES, RATIOS & PER SHARE DATA | RATES, RATIOS & PER SHARE DATA | RATES, RATIOS & PER SHARE DATA | RATES, RATIOS & PER SHARE DATA | RATES, RATIOS & PER SHARE DATA | RATES, RATIOS & PER SHARE DATA | RATES, RATIOS & PER SHARE DATA |
| FYE Mar (¥ bn) | FY25A FY26A FY27E FY28E FY29E FY30E | FY25A FY26A FY27E FY28E FY29E FY30E | FY25A FY26A FY27E FY28E FY29E FY30E | FY25A FY26A FY27E FY28E FY29E FY30E | FY25A FY26A FY27E FY28E FY29E FY30E | FY25A FY26A FY27E FY28E FY29E FY30E | FYE Mar | FY25A | FY25A | FY25A | FY26A FY27E FY28E | FY29E | FY30E |
| Net profit | 234 | 234 | 361 | 524 | 770 | 1,042 | EBITDA margin (%) | 26.0 | 25.1 | 30.0 | 33.7 | 37.8 | 40.8 |
| Depreciation | 173 | 178 | 180 | 190 | 210 | 230 | OPNmargin(%) | 16.0 | 15.4 | 21.5 | 26.3 | 31.3 | 34.9 |
| Chang inWC | 24 | -18 | -109 | -157 | -236 | -253 | Net Profit Margin (%) | 13.4 | 12.8 | 17.0 | 20.5 | 24.0 | 26.7 |
| Others | 20 | 31 | 0 | 0 | 0 | 0 | TaxRate% | 23.2 | 24.2 | 25.0 | 25.0 | 25.0 | 25.0 |
| OPNcashflow | 452 | 425 | 432 | 557 | 744 | 1,019 | ROE (%) | 9.1 | 8.6 | 12.2 | 15.6 | 19.4 | 21.7 |
| ROIC (%) | 9.1 | 8.6 | 12.2 | 15.6 | 19.4 | 21.7 | |||||||
| Capex | -183 | -245 | -256 | -333 | -416 | -507 | 7.7 | 7.3 | 10.5 | 13.6 | 17.1 | 19.4 | |
| M&A | 9 | 10 | 11 | 12 | ROA (%) Current ratio (X) | 5.6 | 5.1 | 5.4 | 6.0 | 6.8 | 7.9 | ||
| Others | -25 | 51 | 0 | 0 | 13 0 | 14 0 | Debt/equity (%) | 0.1 | 0.1 | 0.1 | 0.1 | 0.1 | 0.1 |
| CF from investing | -208 | -194 | -256 | -333 | -416 | -507 | Net gearing (%) | (26) | (25) | (25) | (25) | (25) | (27) |
| Free cash | 278 | 191 | 187 | 236 | 341 | 526 | ARdays | 62 | 65 | 65 | 65 | 65 | 65 |
| Debt raised/(repaid) | -50 | 1 | 0 | 0 | 0 | 0 | AP days Inventory days | 25 172 | 28 180 | 28 180 | 28 180 | 28 180 | 28 180 |
| Equity raised/(repaid) | 0 | 0 | 0 | 0 | 0 | 0 | Capex/revenue (%) | 10.5 | 13.4 | 12.0 | 13.0 | 13.0 | 13.0 |
| Dividend paid | -102 | -111 | -123 | ||||||||||
| -93 | -128 | -156 | -201 | ||||||||||
| Others | -89 | 0 | 0 | 0 | 0 | FD EPS (¥) | 124 | 124 | 197 | 286 | 420 | 569 | |
| CF from financing | -241 | -203 | -123 | -128 | -156 | -201 | BVPS (¥) | 1,366 | 1,439 | 1,614 | 1,831 | 2,166 | 2,625 |
| Chg in cash | 3 | 29 | 54 | 96 | 172 | 311 | OPNCFPS | 239 | 225 | 236 | 304 | 406 | 556 |
| Year beginning CF | 622 | 625 | 654 | 707 | 803 | 976 | FCFPS (¥) | 142 | 96 | 96 | 122 | 179 | 280 |
| Year end CF | 625 | 654 | 707 | 803 | 976 | 1,286 | DPS (Gross ¥) | 57 | 65 | 70 | 85 | 110 | 130 |
Source: Company data, Aletheia Capital/TAG
Taiyo Yuden
Hardware #AI #Auto #EV
Price:
JPY 15,725
Target Price:
JPY 23,000
Upside:
46.3%
Total return:
46.9%
Risk: High
No
CNY
George Chang
+852 3470 0011 george.chang@aletheia-capital.com
Taiyo Yuden
Bloomberg
6976 JP
RIC
6976.T
Market cap (USDbn)
12.9
Average daily T/O (USD|m)
686.7
USD
Rising Sun
We estimate Taiyo Yuden ' s OP will grow by ~90% CAGR to reach JPY140bn by FY3/29. Its higher operating leverage makes it a classic high beta stock which explains the stock ' s outperformance YTD vs. Murata. One key difference between the two is Taiyo Yuden ' s low exposure to commodity markets -this means that if commodity MLCC prices were to rise first, Taiyo Yuden is unlikely to benefit much. We raise our FY3/27-29 OP estimate by 20~87% and our TP from JPY5,800 (20x FY3/28) to JPY23,000 (30x FY3/29 PER).
Data Center growth driver is similar but with some variations
While Murata ' s FY3/26 MLCC sales are 3.7x larger than Taiyo Yuden 's , the gap widens to 5.4x for data Center MLCC due to Murata ' s wider product portfolio. Furthermore, one should also note that Taiyo Yuden is relatively weaker in high-voltage MLCC (for powerlines) which has been widely used in automotive applications. Although Taiyo Yuden has made substantial progress in gaining share for automotive applications in recent years, the share gains have been more in infotainment applications as Murata and TDK remain the stronger competitors in legacy powertrain applications. Furthermore, Taiyo Yuden does not manufacture silicon capacitors. Opportunities for growth in data centers for Taiyo Yuden is largely in decoupling applications.
But low MLCC margin means large upside to improvement
We estimate Taiyo Yuden ' s MLCC OPM was only 7% in 2HFY26 vs. Murata ' s 27%. But this also means that there is more room for the margin to improve vs. its 27% peak in past cycles due to its higher operating leverage. Figure 1 shows Taiyo Yuden ' s marginal profit, which ranged from 22%-90% in past years -product mix plays a large part in determining its marginal profit. Note that Murata ' s marginal profit has been consistent at 65%, but this is due to how each company calculates marginal profit (Murata attributes a product mix change to the others category in its OP waterfall breakdown). As such, we think Taiyo Yuden's assumption of 65% for FY3/27 is conservative, as well as its ASP pressure assumption.
OP to reach JPY140bn by FY3/29
Taiyo Yuden shifted its integrated devices division into other components from FY3/27. Of its guidance for sales of JPY37bn for other components, 60% is aluminium capacitors (under ELNA) and 25% is filters. We estimate this division will post a JPY4bn loss in FY3/27 vs. a JPY6bn loss in FY3/26. We think ELNA has little growth opportunity as its focus is on polymer hybrid aluminium capacitors for auto applicative. ELNA does not appear to supply large-size aluminium capacitor for PSU applications, which is dominated by three other Japanese companies. We estimate MLCC sales will post 20%+ to drive a CAGR of 90% in total OP as MLCC OPM exceeds its previous peak in FY3/29.
KEY FINANCIAL AND VALUATION MATRIX
| FYE Mar (¥ bn) | FY24A | FY25A | FY26A | FY27E | FY28E | FY29E | FY30E |
|---|---|---|---|---|---|---|---|
| Revenue | 322.6 | 341.4 | 355.3 | 404.9 | 470.3 | 563.6 | 666 |
| OP | 9.1 | 10.5 | 20 | 44 | 83 | 138.8 | 200 |
| Pre tax profit | 13.8 | 10.5 | 24.1 | 44.2 | 83.3 | 139.1 | 200.3 |
| Net profit | 8.3 | 2.3 | 14.8 | 32 | 60.9 | 102.2 | 147.5 |
| FD EPS (¥) | 61.1 | 17.1 | 108.8 | 235 | 447.6 | 750.8 | 1084 |
| DPS (¥) | 90 | 90 | 90 | 90 | 100 | 130 | 200 |
| PER (x) | 257.3 | 919.2 | 144.5 | 66.9 | 35.1 | 20.9 | 14.5 |
| PB (x) | 6.5 | 6.7 | 6.2 | 5.9 | 5.2 | 4.3 | 3.4 |
| EV/EBITDA (x) | 43.8 | 38.9 | 32.1 | 24 | 16.1 | 11 | 8 |
| ROE (%) | 2.5 | 0.7 | 4.3 | 8.8 | 14.8 | 20.4 | 23.4 |
| ROA (%) | 1.4 | 0.4 | 2.4 | 5 | 8.8 | 13.1 | 16.1 |
| Dividend yield (%) | 0.6 | 0.6 | 0.6 | 0.6 | 0.6 | 0.8 | 1.3 |
Source: Aletheia Capital/TAG
0.089
0.135
Taiyo Yuden
FIGURE 1 -ANALYSIS OF TAIYO YUDEN ' S MARGINAL PROFIT AND ASP SENSITIVITY
| JPYbn | FY3/21 | FY3/22 | FY3/23 | FY3/24 | FY3/25 | FY3/26 | FY3/27COE |
|---|---|---|---|---|---|---|---|
| Reported sales change | 18.59 | 48.72 | (30.13) | 3.14 | 18.79 | 13.90 | 28.7 |
| Sales change due to forex | (5.30) | 15.40 | 37.60 | 13.10 | 15.40 | (4.10) | - |
| Yen change YoY | (3.09) | 5.59 | 22.64 | 9.12 | 9.29 | (2.62) | 0.01 |
| sales sensitivity to yen | 1.72 | 2.75 | 1.66 | 1.44 | 1.66 | 1.56 | 1.56 |
| Actual sales change strip out forex | 23.9 | 33.3 | (67.7) | (10.0) | 3.4 | 18.0 | 28.7 |
| Utilization profit | 36.7 | 41.6 | (45.5) | (2.1) | 35.5 | 30.7 | 32.9 |
| Inventory change | (1.9) | 9.5 | (7.4) | (6.1) | 7.5 | (1.8) | 1.8 |
| actual sales change, mix | 38.6 | 32.1 | (38.1) | 4.0 | 28.0 | 32.5 | 31.2 |
| Marginal profit on sales change (not including ASP) | 161% | 96% | 56% | -40% | 826% | 180% | 109% |
| Sales change including (add back ASP pressure) | 49.8 | 39.9 | (53.0) | 18.4 | 29.4 | 38.2 | 47.6 |
| ASP pressure factor to OP | (25.9) | (6.6) | (14.7) | (28.4) | (26.0) | (20.2) | (18.9) |
| Marginal profit on sales change (including ASP) | 77% | 80% | 72% | 22% | 95% | 85% | 65% |
| ASP pressure | -7.9% | -1.9% | -4.4% | -8.1% | -7.1% | -5.4% | -4.7% |
| OP impact per 1%ASP pressure | 3.27 | 3.56 | 3.34 | 3.51 | 3.64 | 3.76 | 4.03 |
| Taiyo Yuden'sOP | 40.8 | 68.2 | 32.0 | 9.1 | 10.5 | 20.0 | 30.0 |
| ASP pressure 's impact to OP (as a %of OP) | -64% | -10% | -46% | -313% | -249% | -101% | -63% |
Source: Company data, Aletheia Capital/TAG
FIGURE 2 -EARNINGS FORECAST REVISION FOR TAIYO YUDEN
| JPYbn | FY3/27E (new)FY3/27E (old) | FY3/27E (new)FY3/27E (old) | FY3/28E (new) | FY3/28E (old) | FY3/29E (new) | FY3/29E (old) |
|---|---|---|---|---|---|---|
| Capacitors | 301.560 | 273.075 | 364.975 | 301.023 | 456.218 | 332.651 |
| Inductors | 66.249 | 65.480 | 68.236 | 67.445 | 70.283 | 69.468 |
| Other electronics components | 37.051 | 37.769 | 37.051 | 37.887 | 37.051 | 38.008 |
| Total sales | 404.859 | 376.325 | 470.261 | 406.354 | 563.552 | 440.126 |
| Capacitors | 38.627 | 32.131 | 76.676 | 48.900 | 131.422 | 67.876 |
| Inductors | 9.334 | 8.403 | 10.328 | 9.385 | 11.352 | 10.397 |
| Other electronics components | (4.000) | (3.990) | (4.000) | (4.029) | (4.000) | (4.068) |
| Total OP | 43.961 | 36.544 | 83.004 | 54.255 | 138.774 | 74.205 |
| OPM | ||||||
| Capacitors | 12.8% | 11.8% | 21.0% | 16.2% | 28.8% | 20.4% |
| Inductors | 14.1% | 12.8% | 15.1% | 13.9% | 16.2% | 15.0% |
| Other electronics components | -10.8% | -8.1% | -10.8% | -8.0% | -10.8% | -7.9% |
| Total OP | 10.9% | 9.7% | 17.7% | 13.4% | 24.6% | 16.9% |
Source: Aletheia Capital/TAG estimates
FIGURE 3 -QUARTERLY, HALF-ANNUAL, AND ANNUAL FORECST FOR TAIYO YUDEN
| JPYbn | 1QFY3/27E | 2QFY3/27E | 1HFY3/27E | 3QFY3/27E | 4QFY3/27E | 2HFY3/27E | FY3/27E | 1QFY3/28E | 2QFY3/28E | 1HFY3/28E | 3QFY3/28E | 4QFY3/28E | 2HFY3/28E | FY3/28E |
|---|---|---|---|---|---|---|---|---|---|---|---|---|---|---|
| Capacitors | 68.625 | 77.773 | 146.397 | 77.129 | 78.034 | 155.162 | 301.560 | 82.349 | 93.327 | 175.677 | 94.097 | 95.201 | 189.298 | 364.975 |
| Inductors | 15.284 | 17.153 | 32.437 | 17.646 | 16.166 | 33.812 | 66.249 | 15.743 | 17.667 | 33.410 | 18.175 | 16.651 | 34.826 | 68.236 |
| Other electronics components | 8.685 | 9.119 | 17.804 | 9.575 | 9.671 | 19.246 | 37.051 | 8.685 | 9.119 | 17.804 | 9.575 | 9.671 | 19.246 | 37.051 |
| Total sales | 92.594 | 104.045 | 196.638 | 104.350 | 103.870 | 208.220 | 404.859 | 106.777 | 120.114 | 226.891 | 121.848 | 121.523 | 243.371 | 470.261 |
| OP | ||||||||||||||
| Capacitors | 5.598 | 11.086 | 16.684 | 10.700 | 11.243 | 21.943 | 38.627 | 13.832 | 20.419 | 34.252 | 20.881 | 21.543 | 42.424 | 76.676 |
| Inductors | 1.695 | 2.629 | 4.323 | 2.875 | 2.135 | 5.011 | 9.334 | 1.924 | 2.886 | 4.810 | 3.140 | 2.378 | 5.518 | 10.328 |
| Other electronics components | (1.000) | (1.000) | (2.000) | (1.000) | (1.000) | (2.000) | (4.000) | (1.000) | (1.000) | (2.000) | (1.000) | (1.000) | (2.000) | (4.000) |
| Total OP | 6.292 | 12.715 | 19.007 | 12.576 | 12.378 | 24.954 | 43.961 | 14.756 | 22.305 | 37.062 | 23.021 | 22.921 | 45.943 | 83.004 |
| OPM | ||||||||||||||
| Capacitors | 8.2% | 14.3% | 11.4% | 13.9% | 14.4% | 14.1% | 12.8% | 16.8% | 21.9% | 19.5% | 22.2% | 22.6% | 22.4% | 21.0% |
| Inductors | 11.1% | 15.3% | 13.3% | 16.3% | 13.2% | 14.8% | 14.1% | 12.2% | 16.3% | 14.4% | 17.3% | 14.3% | 15.8% | 15.1% |
| Other electronics components | -11.5% | -11.0% | -11.2% | -10.4% | -10.3% | -10.4% | -10.8% | -11.5% | -11.0% | -11.2% | -10.4% | -10.3% | -10.4% | -10.8% |
| Total OP | 6.8% | 12.2% | 9.7% | 12.1% | 11.9% | 12.0% | 10.9% | 13.8% | 18.6% | 16.3% | 18.9% | 18.9% | 18.9% | 17.7% |
Source: Aletheia Capital/TAG estimates
Taiyo Yuden
Rising Sun
FIGURE 4 -ANNUAL FORECASTS FOR TAIYO YUDEN
| JPYbn | FY3/19 | FY3/20 | FY3/21 | FY3/22 | FY3/23 | FY3/24 | FY3/25 | FY3/26 | FY3/27E | FY3/28E | FY3/29E | FY3/30E |
|---|---|---|---|---|---|---|---|---|---|---|---|---|
| Capacitors | 170.633 | 176.457 | 195.198 | 230.383 | 208.115 | 205.829 | 232.066 | 251.771 | 301.560 | 364.975 | 456.218 | 556.587 |
| Inductors | 40.595 | 38.770 | 41.564 | 48.925 | 52.866 | 55.566 | 61.546 | 64.319 | 66.249 | 68.236 | 70.283 | 72.392 |
| Integrated modules & devices | 47.930 | 49.808 | 46.930 | 48.799 | 32.581 | 34.934 | 22.986 | 14.796 | - | - | - | - |
| Other electronics components | 15.189 | 17.292 | 17.227 | 21.527 | 25.941 | 26.317 | 24.838 | 24.453 | 37.051 | 37.051 | 37.051 | 37.051 |
| Total sales | 274.347 | 282.327 | 300.919 | 349.634 | 319.503 | 322.646 | 341.436 | 355.339 | 404.859 | 470.261 | 563.552 | 666.029 |
| Capacitors | 38.960 | 39.480 | 39.360 | 60.000 | 26.700 | 4.120 | 7.080 | 17.000 | 38.627 | 76.676 | 131.422 | 191.643 |
| Inductors | 1.400 | 0.300 | 2.100 | 7.290 | 9.600 | 6.400 | 8.100 | 8.800 | 9.334 | 10.328 | 11.352 | 12.406 |
| Integrated modules & devices | (2.310) | 1.000 | 2.500 | 2.900 | (2.210) | (0.500) | (3.600) | (4.100) | - | - | - | - |
| Other electronics components | (2.800) | (3.600) | (3.200) | (2.000) | (2.000) | (1.000) | (0.974) | (1.700) | (4.000) | (4.000) | (4.000) | (4.000) |
| Total OP | 35.250 | 37.180 | 40.760 | 68.190 | 32.090 | 9.020 | 10.606 | 20.000 | 43.961 | 83.004 | 138.774 | 200.049 |
| OPM | ||||||||||||
| Capacitors | 22.8% | 22.4% | 20.2% | 26.0% | 12.8% | 2.0% | 3.1% | 6.8% | 12.8% | 21.0% | 28.8% | 34.4% |
| Inductors | 3.4% | 0.8% | 5.1% | 14.9% | 18.2% | 11.5% | 13.2% | 13.7% | 14.1% | 15.1% | 16.2% | 17.1% |
| Integrated modules & devices | -4.8% | 2.0% | 5.3% | 5.9% | -6.8% | -1.4% | -15.7% | -27.7% | - | - | - | - |
| Other electronics components | -18.4% | -20.8% | -18.6% | -9.3% | -7.7% | -3.8% | -3.9% | -7.0% | -10.8% | -10.8% | -10.8% | -10.8% |
| Total OP | 12.8% | 13.2% | 13.5% | 19.5% | 10.0% | 2.8% | 3.1% | 5.6% | 10.9% | 17.7% | 24.6% | 30.0% |
Source: Company data, Aletheia Capital/TAG estimates. OP breakdown is our estimate. Integrated modules & devices are combined with other electronic components from FY3/27.
FIGURE 5 -TAIYO YUDEN'S PER TRADING RANGE
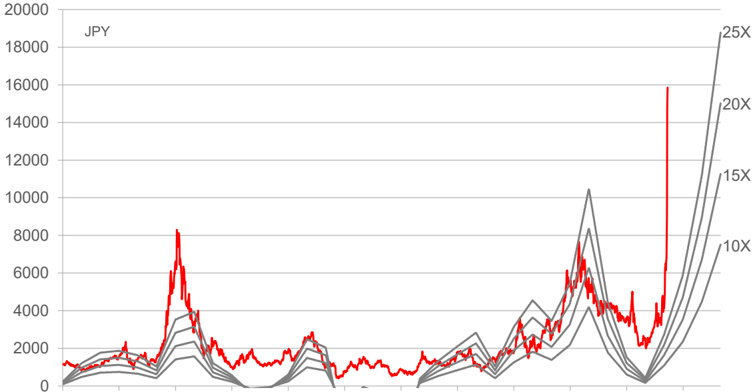
Source: Bloomberg, Aletheia Capital Apr-94 Apr-97 Apr-00 Apr-03 Apr-06 Apr-09 Apr-12 Apr-15 Apr-18 Apr-21 Apr-24 Apr-27
FIGURE 6 -TAIYO YUDEN'S P BR TRADING RANGE
Source: Bloomberg, Aletheia Capital
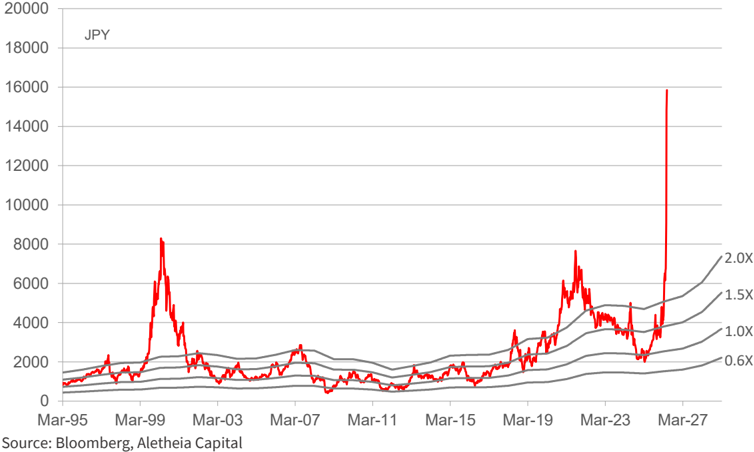
Taiyo Yuden
Rising Sun
Financial Statements
INCOME STATEMENT
FYE Mar (¥ bn)
Revenue
Depreciation
EBITDA
SG&A
OPN profit
Non-op
Pre-Tax Profit
Tax expenses
Net Profit
FD EPS (¥)
Share counts (m)
Revenue chg.
EBITDA chg.
OPN profit chg.
Net profit chg.
FD EPS chg.
FY25A
341.4
46.3
56.7
61.1
10.5
-2.1
8.4
6.0
2.3
17.1
136.1
6
1
15
-72
0
FY26A
355.3
49.1
69.1
61.9
20.0
0.1
20.1
5.3
14.8
108.8
136.1
4
1
91
536
6
CASH FLOW STATEMENT
FY27E
404.9
48.0
92.0
64.4
44.0
-0.8
43.2
11.2
32.0
235.0
136.1
14
1
120
116
2
FY28E
470.3
53.0
136.0
67.0
83.0
-0.7
82.3
21.4
60.9
447.6
136.1
16
1
89
90
2
FY29E
563.6
57.0
195.8
69.7
138.8
-0.7
138.1
35.9
102.2
750.8
136.1
20
1
67
68
2
FY30E
666.0
60.0
260.0
72.5
200.0
-0.7
199.3
51.8
147.5
1,084.0
136.1
18
1
44
44
1
| FYE Mar (¥ bn) | FY25A | FY26A | FY27E | FY28E | FY29E | FY30E |
|---|---|---|---|---|---|---|
| Net profit | 2.3 | 14.8 | 32 | 60.9 | 102.2 | 147.5 |
| Depreciation | 46.3 | 49.1 | 48 | 53 | 57 | 60 |
| Chang in WC | -13.5 | -8.6 | -20.4 | -24.5 | -35.3 | -38.9 |
| Others | -1.2 | 2.8 | 0 | 0 | 0 | 0 |
| OPN cash flow | 33.9 | 58.1 | 59.6 | 89.4 | 123.8 | 168.7 |
| Capex | -62.7 | -41.1 | -40 | -60 | -60 | -60 |
| M&A | 2 | 3 | 4 | 5 | 6 | 7 |
| Others | -0.8 | 15.4 | 0 | 0 | 0 | 0 |
| CF from investing | -63.5 | -25.7 | -40 | -60 | -60 | -60 |
| Free cash | -26.8 | 20.1 | 23.6 | 34.4 | 69.8 | 115.7 |
| Debt raised/(repaid) | 15.7 | 6.5 | 0 | 0 | 0 | 0 |
| Equity raised/(repaid) | 0 | 0 | 0 | 0 | 0 | 0 |
| Dividend paid | -11.2 | -11.2 | -12.2 | -12.2 | -13.6 | -17.7 |
| Others | 0.4 | -5.8 | 0 | 0 | 0 | 0 |
| CF from financing | 5 | -10.5 | -12.2 | -12.2 | -13.6 | -17.7 |
| Chg in cash | -24.6 | 21.9 | 7.3 | 17.1 | 50.2 | 91 |
| Year beginning CF | 102.8 | 78.2 | 100.1 | 107.4 | 124.5 | 174.7 |
| Year end CF | 78.2 | 100.1 | 107.4 | 124.5 | 174.7 | 265.7 |
Source: Company data, Aletheia Capital/TAG
BALANCE SHEET
FYE Mar (¥ bn)
Fixed Assets
Other LT Assets
LT investments
Cash/eqvl.
A/R
Inventory
Others
Total Assets
A/P
ST Debt
Other ST Liabilities
LT Debt
Other LT Liabilities
Total Liability
Equity
FY25A
286.8
7.0
0.0
78.2
80.5
110.0
10.5
573.2
2.1
19.7
57.9
144.7
29.7
254.0
319.2
FY26A
290.0
7.3
0.0
100.1
86.4
125.8
6.0
615.5
2.5
35.2
56.1
136.0
41.4
271.1
344.4
Liabilities + Equity
573.2
615.5
RATES, RATIOS & PER SHARE DATA
FYE Mar
FY25A
EBITDA margin (%)
OPN margin (%)
Net Profit Margin (%)
Tax Rate %
ROE (%)
ROIC (%)
ROA (%)
Current ratio (X)
Debt/equity (%)
Net gearing (%)
AR days
AP days
Inventory days
Capex/revenue (%)
FD EPS (¥)
BVPS (¥)
SPS (¥)
OPN CFPS
FCFPS (¥)
DPS (Gross ¥)
16.6
3.1
0.7
72.2
0.7
0.5
0.4
3.5
51.5
27
86
37
149
18.4
17
2,345
2,509
249
(211)
90
FY26A
19.5
5.6
4.2
26.2
4.3
2.9
2.4
3.4
49.7
21
89
35
168
11.6
109
2,531
2,611
427
125
90
FY27E
282.0
7.3
0.0
107.4
98.4
136.5
6.0
637.5
2.5
35.2
58.3
136.0
41.4
273.4
364.1
637.5
FY27E
22.7
10.9
7.9
26.0
8.8
6.0
5.0
3.6
47.0
18
89
35
168
9.9
235
2,676
2,975
438
144
90
FY28E
FY29E
FY30E
289.0
7.3
0.0
124.5
114.3
147.4
6.0
688.5
2.5
35.2
60.6
136.0
41.4
275.7
412.8
688.5
FY28E
28.9
17.7
13.0
26.0
14.8
10.4
8.8
4.0
41.5
11
89
35
168
12.8
448
3,033
3,456
657
216
100
292.0
7.3
0.0
174.7
137.0
163.4
6.0
780.4
2.5
35.2
64.0
136.0
41.4
279.0
501.4
780.4
FY29E
34.7
24.6
18.1
26.0
20.4
15.2
13.1
4.7
34.1
(1)
89
35
168
10.6
751
3,684
4,141
910
469
130
292.0
7.3
0.0
265.7
161.9
181.1
6.0
913.9
2.5
35.2
67.7
136.0
41.4
282.7
631.2
913.9
FY30E
39.0
30.0
22.1
26.0
23.4
18.4
16.1
5.8
27.1
(15)
89
35
168
9.0
1,084
4,638
4,894
1,239
798
200
TDK #Hardware #AI #Auto #EV
Price:
JPY 3,504
Target Price:
JPY 3,300
No
CNY
George Chang
+852 3470 0011 george.chang@aletheia-capital.com
TDK
Bloomberg
6762 JP
RIC
6762.T
Market cap (USDbn)
43.1
Average daily T/O (USD|m)
432.9
USD
Hold
Total return:
-4.7%
0.089
Risk: High
0.135
Non-China Battery Supply Chain Strategy is the Key
TDK ' s lack of sales exposure to data centers outside of HDD components is the main reason for its underperformance YTD vs. Murata/Taiyo Yuden. The catalyst to watch is how CATL/ATL construct a non-China battery supply chain addressing the data center market in which it has little presence. We raise our FY3/27-28 OP estimate by 8%/13% and our TP from JPY2,300 (20x FY3/28 PER) to JPY3,300 (25x FY3/28 PER). Maintain a HOLD rating.
Data Center sales are still mostly HDD
Of TDK ' s JPY250bn in data center sales in FY3/26 (or 10% of sales), we estimate JPY230bn came from recording devices (HDD heads and suspensions), with passive components accounting for <JPY10bn, and the remainder being batteries for ESS/UPS. We estimate recording device sales will grow 40%/10% in FY3/27-28 driven by outsourcing from captive clients to increase TDK ' s market share in heads from 16% in FY3/26 to 25% by FY3/28. Of the JPY10bn in passive components sales, we estimate aluminium capacitors made up JPY7-8bn, followed by MLCC and inductors. TDK ' s aluminum capacitor sales totalled JPY93bn in FY3/26 (3.7% of sales) and contributed JPY5bn OP (1.7% of OP). In comparison, the industry leader Nippon Chemi-Con posted JPY120bn in aluminium capacitor sales in FY3/26, of which JPY11.5bn came from data centers. Aluminium capacitor for data center is likely to post 90-100% CAGR in the next few years, but the contribution to profits is insignificant. For MLCC and inductors, data center sales are classified under industrial & others. While we note that industrial application growth began to accelerate in 4QFY, it only accounts 10%/18% within MLCC/inductors.
How CATL/ATL build a non-China cell production for ESS/BBU is key
Based on TDK ' s FY3/31 plan, energy applications are targeted to make up JPY250-300bn of data center sales for ESS/BBU applications. Among the three battery suppliers to Delta Electronics (Panasonic, Murata, and TDK), TDK is the smallest supplier due to the preference by CSP clients for non-China production sites. TDK ' s mid-size battery sales totalled >JPY80bn (about 10% OPM) and are projected to grow 30% YoY in FY3/27. But to achieve its FY3/31 target, TDK will also need to work with CATL, which controls their cell production JV. How CATL/ATL construct non-China production targeting data Center applications is key to drive battery growth.
Steady growth vs. explosive growth
We see TDK ' s profit increasing steadily on the back of gradual growth in passive components and higher outsourcing opportunities from captive HDD makers -in contrast to Murata/Taiyo Yuden ' s explosive profit growth driven by data Center MLCC. While aluminium capacitors for data centers will grow, this is a traditionally low margin business, so the contribution will be limited. There is usually upside on TDK ' s guidance for batteries, but the key to monitor is data Center business development.
KEY FINANCIAL AND VALUATION MATRIX
| Mar 31 ( ¥ bn) | FY22A | FY23A | FY24A | FY25A | FY26A | FY27E | FY28E | FY29E |
|---|---|---|---|---|---|---|---|---|
| Revenue | 1,902 | 2,181 | 2,104 | 2,205 | 2,505 | 2,852 | 3,038 | 3,214 |
| OP | 167 | 169 | 173 | 224 | 272 | 330 | 352 | 381 |
| Pre tax profit | 234 | 167 | 179 | 238 | 277 | 339 | 363 | 381 |
| Net Profit | 178 | 114 | 125 | 167 | 196 | 239 | 256 | 270 |
| EPS, ¥ | 91 | 59 | 64 | 86 | 101 | 123 | 131 | 139 |
| DPS, ¥ | 14 | 21 | 23 | 30 | 36 | 40 | 44 | 48 |
| PER (X) | 38.4 | 59.7 | 54.6 | 40.7 | 34.8 | 28.5 | 26.6 | 25.2 |
| PB (X) | 5.1 | 4.7 | 4.0 | 3.8 | 3.1 | 2.9 | 2.7 | 2.5 |
| EV/EBITDA | 15.8 | 16.3 | 16.4 | 13.9 | 12.2 | 9.9 | 9.4 | 9.1 |
| ROE (%) | 13.2 | 7.8 | 7.3 | 9.2 | 8.9 | 10.1 | 10.0 | 9.9 |
| ROA(%) | 5.8 | 3.6 | 3.7 | 4.7 | 4.4 | 5.1 | 5.2 | 5.2 |
| Dividend yield (%) | 0.4 | 0.6 | 0.7 | 0.9 | 1.0 | 1.1 | 1.3 | 1.4 |
Source: Aletheia Capital/TAG
Upside:
-5.8%
TDK
FIGURE 1 -EARNINGS FORECAST REVISION FOR TDK
| JPYbn | FY3/27E (new) | FY3/27E (old) | FY3/28E (new) | FY3/28E (old) |
|---|---|---|---|---|
| Passive components | 676.2 | 608.9 | 718.1 | 625.8 |
| Capacitors | 303.8 | 269.0 | 338.0 | 278.8 |
| Inductors | 247.9 | 219.7 | 253.4 | 224.6 |
| Other passives | 124.5 | 120.2 | 126.7 | 122.4 |
| Sensors | 260.4 | 237.9 | 247.0 | 244.4 |
| Magnetic application products | 357.6 | 324.2 | 383.1 | 347.0 |
| Energy application products | 1,506.1 | 1,460.5 | 1,637.3 | 1,589.4 |
| Others | 52.0 | 52.0 | 52.0 | 52.0 |
| Consolidated sales | 2,852.2 | 2,683.6 | 3,037.5 | 2,858.6 |
| Passive components | 77.5 | 49.5 | 94.0 | 55.9 |
| Capacitors | 45.4 | 33.1 | 59.1 | 37.0 |
| Inductors | 26.1 | 10.2 | 28.4 | 12.2 |
| Other passives | 6.0 | 6.2 | 6.6 | 6.8 |
| Sensors | 25.9 | 28.4 | 21.7 | 30.1 |
| Magnetic application products | 48.2 | 42.1 | 51.8 | 46.4 |
| Energy application products | 241.4 | 244.8 | 251.8 | 241.7 |
| Others | (4.0) | (4.0) | (4.0) | (4.0) |
| Total OP | 329.8 | 305.1 | 352.2 | 310.8 |
| Restructuring charges | - | - | - | - |
| One-off profit | - | - | - | - |
| Normalized OP | 329.8 | 305.1 | 352.2 | 310.8 |
Source: Aletheia Capital/TAG
FIGURE 2 - QUARTERLY, HALF-YEAR, AND ANNUAL FORECAST FOR TDK
| 1QFY3/27E | 2QFY3/27E | 1HFY3/27E | 3QFY3/27E | 4QFY3/27E | 2HFY3/27E | FY3/27E | 1QFY3/28E | 2QFY3/28E | 1HFY3/28E | 3QFY3/28E | 4QFY3/28E | 2HFY3/28E | FY3/28E | |
|---|---|---|---|---|---|---|---|---|---|---|---|---|---|---|
| Passive components | 161.5 | 169.3 | 330.8 | 172.2 | 173.2 | 345.4 | 676.2 | 170.5 | 180.5 | 351.0 | 183.7 | 183.4 | 367.1 | 718.1 |
| Capacitors | 73.2 | 75.0 | 148.1 | 76.7 | 79.0 | 155.7 | 303.8 | 80.0 | 84.3 | 164.3 | 86.3 | 87.3 | 173.7 | 338.0 |
| Inductors | 57.9 | 62.7 | 120.7 | 63.6 | 63.6 | 127.2 | 247.9 | 59.7 | 64.0 | 123.7 | 64.9 | 64.8 | 129.8 | 253.4 |
| Other passives | 30.4 | 31.6 | 62.0 | 31.8 | 30.6 | 62.5 | 124.5 | 30.8 | 32.2 | 63.0 | 32.5 | 31.2 | 63.7 | 126.7 |
| Sensors | 56.2 | 68.0 | 124.2 | 72.2 | 64.0 | 136.2 | 260.4 | 53.6 | 64.8 | 118.3 | 67.9 | 60.7 | 128.6 | 247.0 |
| Magnetic application products | 83.2 | 90.5 | 173.6 | 92.7 | 91.2 | 183.9 | 357.6 | 93.9 | 96.3 | 190.2 | 98.5 | 94.4 | 192.9 | 383.1 |
| Recording devices | 72.2 | 80.1 | 152.4 | 83.8 | 80.2 | 164.0 | 316.4 | 83.0 | 86.0 | 168.9 | 89.7 | 83.4 | 173.0 | 342.0 |
| Magnets | 10.9 | 10.3 | 21.3 | 8.9 | 11.0 | 19.9 | 41.2 | 10.9 | 10.3 | 21.3 | 8.9 | 11.0 | 19.9 | 41.2 |
| Energy application products | 346.6 | 383.9 | 730.5 | 404.0 | 371.5 | 775.6 | 1,506.1 | 375.4 | 417.0 | 792.3 | 439.4 | 405.6 | 845.0 | 1,637.3 |
| Battery | 320.1 | 354.3 | 674.4 | 377.4 | 347.1 | 724.5 | 1,398.9 | 348.1 | 385.9 | 734.0 | 411.4 | 380.0 | 791.4 | 1,525.4 |
| Power supply | 26.5 | 29.6 | 56.1 | 26.7 | 24.4 | 51.1 | 107.1 | 27.3 | 31.1 | 58.3 | 28.0 | 25.6 | 53.6 | 111.9 |
| Others | 13.0 | 13.0 | 26.0 | 13.0 | 13.0 | 26.0 | 52.0 | 13.0 | 13.0 | 26.0 | 13.0 | 13.0 | 26.0 | 52.0 |
| Consolidated sales | 660.5 | 724.7 | 1,385.1 | 754.1 | 712.9 | 1,467.0 | 2,852.2 | 706.3 | 771.5 | 1,477.8 | 802.6 | 757.1 | 1,559.7 | 3,037.5 |
| OP | ||||||||||||||
| Passive components | 16.5 | 19.5 | 36.0 | 20.5 | 21.0 | 41.6 | 77.5 | 20.2 | 23.8 | 44.1 | 25.0 | 24.9 | 49.9 | 94.0 |
| Capacitors | 10.2 | 11.0 | 21.2 | 11.7 | 12.6 | 24.2 | 45.4 | 13.0 | 14.7 | 27.7 | 15.5 | 15.9 | 31.4 | 59.1 |
| Inductors | 4.9 | 6.8 | 11.7 | 7.2 | 7.2 | 14.4 | 26.1 | 5.8 | 7.3 | 13.1 | 7.6 | 7.6 | 15.2 | 28.4 |
| Other passives | 1.4 | 1.7 | 3.1 | 1.7 | 1.3 | 3.0 | 6.0 | 1.5 | 1.8 | 3.3 | 1.8 | 1.4 | 3.3 | 6.6 |
| Sensors | 3.8 | 7.3 | 11.1 | 8.6 | 6.2 | 14.7 | 25.9 | 3.0 | 6.3 | 9.3 | 7.2 | 5.1 | 12.4 | 21.7 |
| Magnetic application products | 10.0 | 12.3 | 22.3 | 12.9 | 13.0 | 25.9 | 48.2 | 12.3 | 12.9 | 25.2 | 13.9 | 12.7 | 26.5 | 51.8 |
| Recording devices | 12.0 | 14.3 | 26.3 | 15.4 | 15.5 | 30.9 | 57.2 | 14.8 | 15.4 | 30.2 | 16.4 | 15.2 | 31.5 | 61.8 |
| Magnets | (2.0) | (2.0) | (4.0) | (2.5) | (2.5) | (5.0) | (9.0) | (2.5) | (2.5) | (5.0) | (2.5) | (2.5) | (5.0) | (10.0) |
| Energy application products | 53.2 | 65.2 | 118.4 | 72.1 | 50.9 | 123.0 | 241.4 | 53.1 | 66.4 | 119.5 | 74.0 | 58.3 | 132.3 | 251.8 |
| Battery | 53.7 | 65.7 | 119.4 | 72.6 | 51.4 | 124.0 | 243.4 | 53.6 | 66.9 | 120.5 | 74.5 | 58.8 | 133.3 | 253.8 |
| Power supply | (0.5) | (0.5) | (1.0) | (0.5) | (0.5) | (1.0) | (2.0) | (0.5) | (0.5) | (1.0) | (0.5) | (0.5) | (1.0) | (2.0) |
| Others | (1.0) | (1.0) | (2.0) | (1.0) | (1.0) | (2.0) | (4.0) | (1.0) | (1.0) | (2.0) | (1.0) | (1.0) | (2.0) | (4.0) |
| Eliminations | (13.2) | (14.5) | (27.7) | (15.1) | (16.4) | (31.5) | (59.2) | (14.1) | (15.4) | (29.6) | (16.1) | (17.4) | (33.5) | (63.0) |
| Total OP | 69.4 | 88.8 | 158.1 | 98.0 | 73.7 | 171.7 | 329.8 | 73.6 | 92.9 | 166.5 | 103.0 | 82.6 | 185.7 | 352.2 |
| One-off charge/(profit) | ||||||||||||||
| Profit before restructuring charge | 69.4 | 88.8 | 158.1 | 98.0 | 73.7 | 171.7 | 329.8 | 73.6 | 92.9 | 166.5 | 103.0 | 82.6 | 185.7 | 352.2 |
Source: Aletheia Capital/TAG estimates
TDK
Non-China Battery Supply Chain Strategy is the Key
FIGURE 3 - ANNUAL SALES AND OP FORECAST FOR TDK
| FY3/18 | FY3/19 | FY3/20 | FY3/21 | FY3/22 | FY3/23 | FY3/24 | FY3/25 | FY3/26 | FY3/27E | FY3/28E | FY3/29E | |
|---|---|---|---|---|---|---|---|---|---|---|---|---|
| Passive components | 438 | 433 | 395 | 407 | 505 | 576 | 566 | 560 | 593 | 676 | 718 | 755 |
| Capacitors | 157 | 173 | 154 | 158 | 198 | 240 | 245 | 234 | 257 | 304 | 338 | 367 |
| Ceramic capacitors | 88 | 106 | 100 | 105 | 127 | 148 | 154 | 150 | 165 | 196 | 221 | 241 |
| Aluminum & film capacitors | 69 | 67 | 54 | 53 | 71 | 92 | 91 | 84 | 93 | 108 | 117 | 126 |
| Inductors | 158 | 159 | 138 | 140 | 180 | 198 | 192 | 204 | 216 | 248 | 253 | 259 |
| Other passives | 123 | 101 | 104 | 109 | 127 | 138 | 129 | 121 | 120 | 124 | 127 | 129 |
| Sensors | 78 | 76 | 78 | 81 | 131 | 170 | 181 | 189 | 225 | 260 | 247 | 254 |
| Traditional sensors | 25 | 26 | 27 | 26 | 33 | 37 | 40 | 42 | 43 | 46 | 48 | 49 |
| Magnetic sensors | 27 | 29 | 27 | 29 | 54 | 78 | 92 | 100 | 117 | 124 | 129 | 135 |
| MEMS (InvenSense) | 26 | 22 | 24 | 26 | 43 | 55 | 48 | 48 | 65 | 90 | 70 | 70 |
| Magnetic application products | 333 | 273 | 220 | 199 | 248 | 201 | 184 | 224 | 263 | 358 | 383 | 396 |
| Recording devices | 238 | 237 | 193 | 175 | 221 | 162 | 148 | 191 | 227 | 316 | 342 | 355 |
| HDD head | 180 | 178 | 139 | 116 | 150 | 109 | 101 | 128 | 141 | 213 | 235 | 245 |
| Suspension | 58 | 60 | 54 | 60 | 72 | 52 | 47 | 63 | 86 | 103 | 107 | 110 |
| Others | 95 | 35 | 27 | 24 | 27 | 39 | 36 | 33 | 36 | 41 | 41 | 41 |
| Energy application products | 371 | 538 | 598 | 740 | 965 | 1,173 | 1,122 | 1,176 | 1,370 | 1,506 | 1,637 | 1,757 |
| Battery | 371 | 464 | 540 | 699 | 921 | 1,105 | 1,013 | 1,068 | 1,265 | 1,399 | 1,525 | 1,640 |
| Power supply | 54 | 58 | 41 | 44 | 68 | 108 | 109 | 105 | 107 | 112 | 117 | |
| Others | 52 | 62 | 72 | 51 | 52 | 61 | 52 | 56 | 54 | 52 | 52 | 52 |
| Consolidated sales | 1,272 | 1,382 | 1,363 | 1,479 | 1,902 | 2,181 | 2,104 | 2,205 | 2,505 | 2,852 | 3,038 | 3,214 |
| FY3/18 | FY3/19 | FY3/20 | FY3/21 | FY3/22 | FY3/23 | FY3/24 | FY3/25 | FY3/26 | FY3/27E | FY3/28E | FY3/29E | |
| Passive components Capacitors | 46.3 13.7 | 58.4 26.3 | 39.1 18.6 | 40.2 16.3 | 77.7 36.8 | 95.5 49.7 | 53.9 42.0 | 34.1 25.1 | 41.8 21.8 | 77.5 45.4 | 94.0 59.1 | 108.0 70.6 |
| Ceramic capacitor | 10.0 | 20.6 | 19.2 | 16.9 | 30.6 | 40.4 | 37.0 | 21.4 | 17.1 | - | - | - |
| Aluminium and film capacitor | 3.7 | 5.7 | (0.6) | (0.6) | 6.2 | 9.3 | 4.9 | 3.8 | 4.7 | - | - | - |
| Inductors | 16.4 | 17.4 | 7.7 | 9.4 | 24.3 | 31.2 | 11.6 | 20.1 | 17.7 | 26.1 | 28.4 | 30.3 |
| Other passives | 16.3 | 15.0 | 12.8 | 14.5 | 16.9 | 14.4 | 0.3 | (11.3) | 2.3 | 6.0 | 6.6 | 7.1 |
| Amortization | (0.7) | (0.5) | - | - | (0.4) | - | - | - | - | - | - | - |
| Sensors | (19.4) | (22.1) | (25.0) | (24.9) | 2.7 | 10.7 | 6.0 | 5.0 | 20.7 | 25.9 | 21.7 | 23.6 |
| Traditional sensors | 0.8 | - | (0.7) | 0.4 | 1.9 | (0.4) | 1.4 | 0.4 | (1.3) | (0.0) | 0.3 | 0.6 |
| Magnetic sensors | (3.4) | (1.9) | (3.2) | (3.4) | 9.9 | 16.1 | 22.6 | 20.4 | 21.8 | 19.0 | 20.4 | 22.0 |
| MEMS (InvenSense) | (15.8) | (20.2) | (21.1) | (21.8) | (9.0) | (4.9) | (18.0) | (15.8) | 0.2 | 6.9 | 0.9 | 0.9 |
| Magnetic application products | 20.9 | 17.0 | 0.4 | (2.4) | 4.6 | (56.4) | (35.6) | 3.4 | 27.0 | 48.2 | 51.8 | 56.6 |
| Recording devices | 19.7 | 28.5 | 22.1 | 6.0 | 13.4 | (45.0) | (23.5) | 15.0 | 33.7 | 57.2 | 61.8 | 66.6 |
| HDD head | 24.9 | 30.5 | 21.8 | 3.7 | 14.2 | (8.2) | (16.3) | 2.6 | 12.1 | 30.7 | 39.8 | 44.6 |
| Suspension | (5.2) | (1.9) | 0.3 | 2.3 | (0.8) | (36.8) | (7.2) | 12.5 | 21.5 | 26.5 | 21.0 | 21.0 |
| Others | 1.2 | (11.4) | (21.7) | (8.4) | (8.8) | (11.4) | (12.0) | (11.7) | (6.7) | (9.0) | (10.0) | (10.0) |
| Energy application products | 70.4 | 91.0 | 124.1 | 147.4 | 123.2 | 147.4 | 195.7 | 234.4 | 246.7 | 241.4 | 251.8 | 263.8 |
| Battery | 128.0 | 150.2 | 237.6 | 255.0 | 253.8 | 265.8 | ||||||
| Power | 70.4 | 90.9 | 131.3 | 147.2 | 190.5 | 243.4 | ||||||
| supply | 0.1 | (2.8) | (2.3) | (7.6) | 0.2 | 5.2 | (3.2) | (8.3) | (2.0) | (2.0) | (2.0) | |
| Other applied film | - | |||||||||||
| Others | (2.4) | (6.7) | (8.6) | (16.1) | (5.6) | (0.4) | (1.8) | (4.4) | (10.2) | (4.0) | (4.0) | (4.0) |
| Eliminations | (30.1) | (29.8) | (32.2) | (32.7) | (35.8) | (28.0) | (45.3) | (48.3) | (53.6) | (59.2) | (63.0) | (66.7) |
| Total OP | 85.6 | 107.8 | 97.9 | 111.5 | 166.7 | 168.8 | 172.9 | 224.2 | 272.4 | 329.8 | 352.2 | 381.3 |
| Restructuring charge | 0.7 | - | 18.3 | 17.6 | 13.8 | 36.9 | 18.8 | 19.9 | 13.1 | - | - | - |
| One-off profit | 4.5 | 4.0 | 1.0 | 2.4 | - | 12.0 | 1.0 | 4.3 | - | - | - | - |
| Profit before restructuring charge | 81.8 | 103.8 | 115.2 | 126.7 | 180.5 | 193.7 | 190.7 | 239.8 | 285.5 | 329.8 | 352.2 | 381.3 |
Source: Aletheia Capital/TAG estimates. Detailed sales and OP breakdown is our estimate.
TDK Non-China Battery Supply Chain Strategy is the Key
FIGURE 4 -TDK'S PER TRADING RANGE
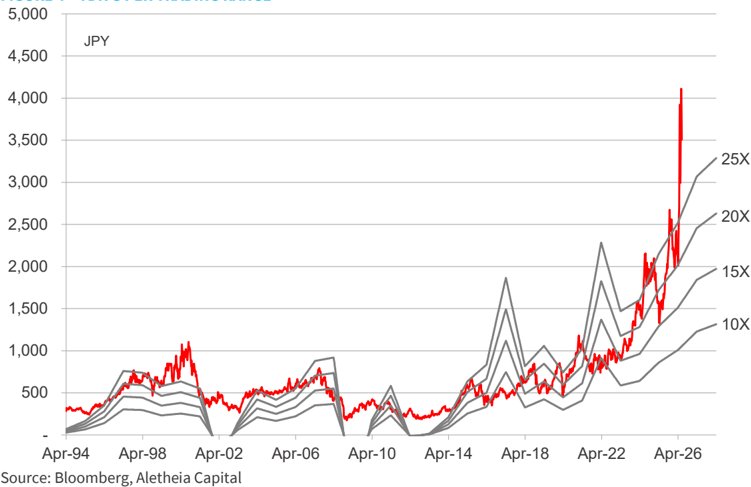
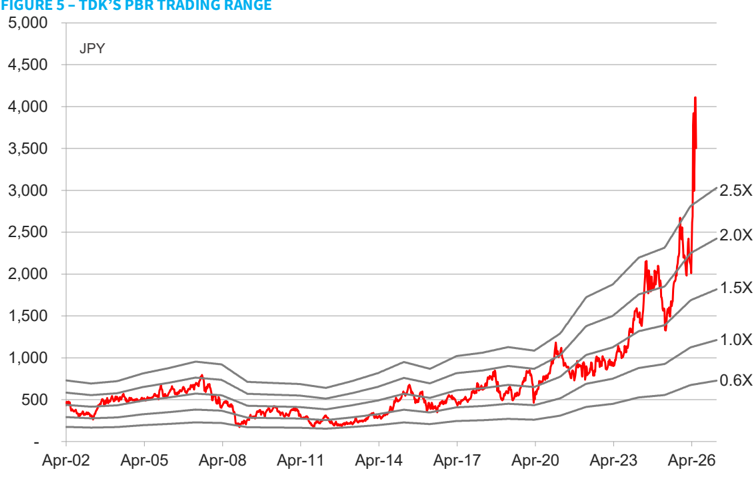
Source: Bloomberg, Aletheia Capital
TDK
Non-China Battery Supply Chain Strategy is the Key
Financial Statements
INCOME STATEMENT
| FYE Mar (¥ bn) | FY24A | FY25A | FY26A | FY27E | FY28E | FY29E |
|---|---|---|---|---|---|---|
| Revenue | 2,103.9 | 2,204.8 | 2,504.8 | 2,852.2 | 3,037.5 | 3,213.8 |
| Depreciation | 190.5 | 196.2 | 204.2 | 240.0 | 247.4 | 247.4 |
| EBITDA | 363.4 | 420.4 | 476.6 | 569.8 | 599.6 | 628.7 |
| SG&A | 430.1 | 463.9 | 511.0 | 518.8 | 526.8 | 534.9 |
| OPNprofit | 172.9 | 224.2 | 272.4 | 329.8 | 352.2 | 381.3 |
| Non-op | 6.3 | 13.6 | 4.4 | 8.8 | 11.3 | -0.1 |
| Pre-Tax Profit | 179.2 | 237.8 | 276.8 | 338.6 | 363.5 | 381.2 |
| Tax expenses | 54.6 | 70.6 | 81.1 | 99.8 | 107.9 | 111.2 |
| Net Profit | 124.7 | 167.2 | 195.7 | 238.7 | 255.6 | 270.0 |
| FD EPS (¥) | 64.1 | 86.0 | 100.7 | 122.8 | 131.5 | 138.9 |
| Share counts (m) | 1,943.9 | 1,943.9 | 1,943.9 | 1,943.9 | 1,943.9 | 1,943.9 |
| Revenue chg. (%) | -3.5 | 4.8 | 13.6 | 13.9 | 6.5 | 5.8 |
| EBITDA chg. (%) | -3.1 | 15.7 | 13.4 | 19.6 | 5.2 | 4.9 |
| OPNprofit chg. (%) | 2.4 | 29.7 | 21.5 | 21.1 | 6.8 | 8.3 |
| Net profit chg. (%) | 9.2 | 34.1 | 17.1 | 22.0 | 7.1 | 5.6 |
| FD EPS chg. (%) | 9.2 | 34.1 | 17.1 | 22.0 | 7.1 | 5.6 |
CASH FLOW STATEMENT
| FYE Mar (¥ bn) | FY24A | FY25A | FY26A | FY27E | FY28E | FY29E |
|---|---|---|---|---|---|---|
| Net profit | 124.7 | 167.2 | 195.7 | 238.7 | 255.6 | 270 |
| Depreciation | 190.5 | 196.2 | 204.2 | 240 | 247.4 | 247.4 |
| Chang inWC | 90.2 | 2.5 | -8.9 | -88.4 | -46.8 | -45.1 |
| Others | 41.6 | 80 | 116.7 | 0 | 0 | 0 |
| OPNcash flow | 447 | 445.8 | 507.7 | 390.3 | 456.1 | 472.3 |
| Capex | -218.6 | -225.3 | -298.6 | -370.8 | -303.8 | -321.4 |
| Others | 2 | -19.6 | -79.2 | 0 | 0 | 0 |
| CF from investing | -216.6 | -244.8 | -377.8 | -370.8 | -303.8 | -321.4 |
| Free cash | 228.4 | 220.5 | 209.1 | 19.6 | 152.4 | 150.9 |
| Debt raised/(repaid) | -93.4 | -81.3 | 9.9 | 0 | 0 | 0 |
| Equity raised/(repaid) | 0 | 0 | 0 | 0 | 0 | 0 |
| Dividend paid | -42.2 | -48.5 | -60.7 | -70 | -77.8 | -85.5 |
| Others | 48.9 | -23.9 | 66.4 | 0 | 0 | 0 |
| CF from financing | -86.6 | -153.7 | 15.5 | -70 | -77.8 | -85.5 |
| Chg in cash | 143.8 | 47.3 | 145.5 | -50.4 | 74.6 | 65.4 |
| Year beginning CF | 506.2 | 650 | 697.3 | 842.8 | 792.4 | 867 |
| Year end CF | 650 | 697.3 | 842.8 | 792.4 | 867 | 932.4 |
Source: Company data, Aletheia Capital/TAG
| BALANCE SHEET FYE Mar (¥ bn) | FY24A | FY25A | FY26A | FY27E | FY28E | FY29E |
|---|---|---|---|---|---|---|
| Fixed Assets | 991.1 | 1,030.1 | 1,225.8 | 1,356.5 | 1,412.9 | 1,486.9 |
| Other LT Assets | 474.8 | 448.4 | 507.4 | 507.4 | 507.4 | 507.4 |
| LT investments | 221.4 | 226.0 | 226.8 | 226.8 | 226.8 | 226.8 |
| Cash/eqvl. | 650.0 | 697.3 | 842.8 | 792.4 | 867.0 | 932.4 |
| A/R | 558.3 | 583.1 | 780.6 | 888.8 | 946.6 | 1,001.5 |
| Inventory | 406.1 | 410.0 | 585.4 | 681.4 | 734.1 | 781.4 |
| Others | 113.6 | 146.4 | 246.4 | 246.4 | 246.4 | 246.4 |
| Total Assets | 3,415.3 | 3,541.4 | 4,415.2 | 4,699.7 | 4,941.2 | 5,182.8 |
| A/P | 351.9 | 392.5 | 706.7 | 822.6 | 886.2 | 943.2 |
| ST Debt | 212.9 | 187.1 | 211.0 | 211.0 | 211.0 | 211.0 |
| Other ST Liabilities | 452.0 | 518.8 | 656.9 | 656.9 | 656.9 | 656.9 |
| LT Debt | 400.3 | 346.0 | 332.7 | 332.7 | 332.7 | 332.7 |
| Other LT Liabilities | 283.2 | 285.7 | 304.4 | 304.4 | 304.4 | 304.4 |
| Total Liability | 1,700.4 | 1,730.2 | 2,211.6 | 2,327.5 | 2,391.1 | 2,448.1 |
| Equity | 1,714.9 | 1,811.3 | 2,203.5 | 2,372.3 | 2,550.1 | 2,734.6 |
| Liabilities + Equity | 3,415.3 | 3,541.4 | 4,415.2 | 4,699.7 | 4,941.2 | 5,182.8 |
RATES, RATIOS & PER SHARE DATA
| FYE Mar | FY24A | FY25A | FY26A | FY27E | FY28E | FY29E |
|---|---|---|---|---|---|---|
| EBITDA margin (%) | 17.3 | 19.1 | 19.0 | 20.0 | 19.7 | 19.6 |
| OPNmargin (%) | 8.2 | 10.2 | 10.9 | 11.6 | 11.6 | 11.9 |
| Net Profit Margin (%) | 5.9 | 7.6 | 7.8 | 8.4 | 8.4 | 8.4 |
| TaxRate% | 30.4 | 29.7 | 29.3 | 29.5 | 29.7 | 29.2 |
| ROE (%) | 7.3 | 9.2 | 8.9 | 10.1 | 10.0 | 9.9 |
| ROCE (%) | 5.4 | 7.1 | 7.1 | 8.2 | 8.3 | 8.2 |
| ROA (%) | 3.7 | 4.7 | 4.4 | 5.1 | 5.2 | 5.2 |
| Current ratio (X) | 1.7 | 1.7 | 1.6 | 1.5 | 1.6 | 1.6 |
| Debt/equity (%) | 35.8 | 29.4 | 24.7 | 22.9 | 21.3 | 19.9 |
| Net gearing (%) | (2) | (9) | (14) | (10) | (13) | (14) |
| ARdays | 97 | 97 | 114 | 114 | 114 | 114 |
| AP days | 86 | 94 | 150 | 150 | 150 | 150 |
| Inventory days | 99 | 99 | 124 | 124 | 124 | 124 |
| Capex/revenue (%) | 10.4 | 10.2 | 11.9 | 13.0 | 10.0 | 10.0 |
| FD EPS (¥) | 64 | 86 | 101 | 123 | 131 | 139 |
| BVPS (¥) | 882 | 932 | 1,134 | 1,220 | 1,312 | 1,407 |
| SPS (¥) | 1,082 | 1,134 | 1,289 | 1,467 | 1,563 | 1,653 |
| OPNCFPS | 230 | 229 | 261 | 201 | 235 | 243 |
| FCFPS (¥) | 118 | 113 | 108 | 10 | 78 | 78 |
| DPS (Gross ¥) | 23 | 30 | 36 | 40 | 44 | 48 |
Alētheia Research Team
| Macro/Strategy | LEAD ANALYST | LEAD ANALYST | Sector LEAD ANALYST | Sector LEAD ANALYST |
|---|---|---|---|---|
| Global Strategy | ata Jonathan Wilmot Technology Hardware | Warren Lau | ||
| Asianomics | Dr. Jim Walker Consumer & Internet | Nirgunan Tiruchelvam | ||
| Tech Thematic Strategy | Keith Woolcock China Technology | Eric Wen | ||
| Asia Equity Strategy | David Scott Telecoms | Chris Hoare | ||
| China Strategy | Vincent Chan CrossASEAN | Angus Mackintosh | ||
| Tactical Alpha Strategy | Justin Collazo India | Maulik Patel | ||
| Global Commodities | Steven Schlegel MENA | Jaap Meijer |
Product Marketing Teams
Serving 300+ clients, 8,000+ touch points, in 20+ geographies with $15tr+ AUM

| • Al Park 1201 962 0529 al. park@aletheia-capital.com AMERICAS - NEW YORK | • Linda Gustafsson 447919197345 linda@nordlinkcapital.com EUROPE - NORDICS | • Michael Chambers 65 9858 9759 michael.chambers@aletheia-capital.com ASIA - SINGAPORE | • Graeme Bateman R52 2534 7437 graeme.bateman@aletheia-capital.com ASIA - HONG KONG |
|---|---|---|---|
| • Wayne Chang 040 mo so wavne.chana@aletheia-cavital.com AMERICAS - NEW YORK | • Daren Riley 447485y don doren.rilevcaletneid-caoitai.com EUROPE - LONDON | • Richard Wallace Xo3.4147 richorc.wallacecaletheic-caoitai.com ASIA / EUROPE . HONG KONG | |
| • Terrence Alford 469. 403 94361 terrence.allordgaletheia-caoital.com AMERICAS - DALLAS | • Dhananjay Mahurkar 44 777 55 26 870 dhananjay.mahurkar@alethela-capital.com EUROPE - LONDON | • Augustine Chen 8869 2739 8793 augustine.chen@aletheia-capital.com ASIA - HONG KONG |
Firm Disclosures
Aletheia Capital Ltd ("Aletheia") is a limited company registered in Hong Kong, located at Unit 2407, World-Wide House, 19 Des Voeux Road, Central, Hong Kong.
Aletheia Analyst Network Ltd ('AAN') is a limited company registered in Hong Kong and is a wholly owned by Aletheia and is regulated by the Hong Kong Securities and Futures Commission, is a registered investment advisor with the U.S. Securities and Exchange Commission and is regulated by the Financial Conduct Authority, Firm Reference Number 794762.
Aletheia Capital (Singapore) Pte Ltd ('ACSG') is a limited company registered in Singapore, UEN 201823248E, and is a wholly owned by AAN and is an Exempt Financial Adviser as defined in the Financial Advisers Act.
This report was published by AAN and is distributed by AAN and ACSG. For investors in Singapore, this material is provided by ACSG pursuant to Regulation 32C of the Financial Advisers Regulations. If there are any matters arising from, or in connection with this material, please contact ACSG, Level 39, MBFC Tower 2, 10 Marina Blvd, Singapore 018983.
Additional information will be made available upon request.
圖片清單(已驗證 2026-07-02)
回補驗證:僅涵蓋已被 lib 頁嵌入的圖片,非全量驗證。
| 檔名 | size | 分類 | 親眼所見內容 |
|---|---|---|---|
Rippling Effect of Capacity Shift Will be Large_001.png |
17KB | 裝飾·logo·banner | 報告封面頁,含Aletheia Capital社群圖示(LinkedIn/FB/Twitter)、網址www.aletheia-capital.com、日期「15 June 2026」、標題文字「Technology Hardware」「Global」,無圖表數據 |
Rippling Effect of Capacity Shift Will be Large_008.png |
213KB | 真資料圖 | Figure 8流程圖「DIELECTRIC MATERIAL AND PRODUCTION TECHNOLOGY」,三欄Technical Management Elements/Material Development/Production Technology,含Uniformity/Flatness/Particle Control列與顯微照片 |
Rippling Effect of Capacity Shift Will be Large_009.png |
31KB | 真資料圖 | Figure 9長條圖「MLCC SALES COMPARISON IN FY25」,Y軸JPY bn,X軸Murata/Yageo/Walsin Tech三家公司銷售額比較,圖下標註Source: Company data, Aletheia Capital/TAG |
Rippling Effect of Capacity Shift Will be Large_011.png |
37KB | 真資料圖 | Figure 14折線圖「MIX OF HGX AND NVL72 FOR NVIDIA GPU DEMAND」,X軸2024-2027年,兩條線HGX(深藍,由100%降至約52%)與NVL72(灰,由0%升至約48%),Y軸0-120% |