PDF 原檔:260701_3711_3131_ubs_cloud-AI_original.pdf
圖片清單(已驗證 2026-07-02)
| 檔名 | size | 分類 | 親眼所見內容 |
|---|---|---|---|
| _001.png | 28KB | 真資料圖 | Figure 9 產業 CoWoS 產能柱狀圖(kwpm,Q123→Q427E 升至約 250) |
| _002.png | 36KB | 真資料圖 | Figure 10 TSMC vs Non-TSMC CoWoS 產能堆疊柱狀圖 |
| _003.png | 38KB | 真資料圖 | Figure 11 產業 CoWoS 產能 vs Nvidia 用量估計雙色柱狀圖 |
| _004.png | 27KB | 資料圖(本次不嵌) | Figure 14 TSMC N3 產能加速擴充圖 |
| _005.png | 17KB | 資料圖(本次不嵌) | Figure 12 主要客戶 CoWoS 需求圖 |
| _006.png | 33KB | 資料圖(本次不嵌) | Figure 15 2026E N3 產能客戶佔比餅圖 |
| _007.png | 33KB | 資料圖(本次不嵌) | Figure 16 2027E N3 產能客戶佔比餅圖 |
| _008.png | 70KB | 裝飾·valuation | GPTC Value drivers upside/downside spectrum |
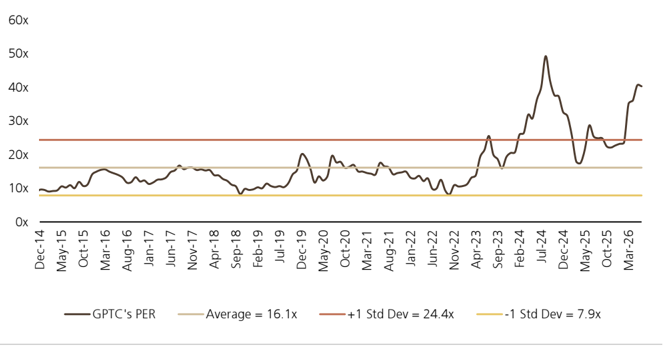
| _009.png | 49KB | 裝飾·valuation | Figure 21 GPTC 12M forward PE band |
嵌入對象:_001/_002/_003(CoWoS 產能)→ 供應鏈_CoWoS。
原始內容
UBS Global I/O Semiconductors
Cloud AI: TSMC and ASE driving faster CoWoS expansion, unlocking larger TAM
CoWoS capacity upside in 2026-27 across TSMC and ASE
We view TSMC and broader industry CoWoS expansion as a leading indicator of cloud AI demand over the next 2-3 years. Capacity expansion over the next 12-18 months is progressing faster than we expected a month ago, suggesting stronger underlying cloud AI demand. TSMC's CoWoS capacity expansion is re-accelerating and we now expect capacity to reach 130k/180k wpm by end-2026/27 vs our prior estimates of 120k / 150k wpm. We believe this reflects a much larger advanced packaging TAM over the next several years, with a meaningful portion likely to remain on CoWoS even as Intel EMIB-T and TSMC CoPoS enter mass production in 2028. ASE has also been accelerating its fullprocess capacity expansion for 2027. We now forecast its full-process CoWoS capacity to more than double from 20kwpm at end-2026E to ~50kwpm end-2027E vs prior estimate of 40kwpm. (See our ASE note). Overall, we estimate industry CoWoS capacity may rise from 160kwpm at end-2026 to 250kwpm by end-2027.
Robust server CPU demand; Nvidia Rubin ramp to accelerate in H226
On the demand side, we believe server CPU continues to show upside into 2027. ASE's faster CoWoS expansion should be underpinned by higher AMD Venice volumes, which we estimate at 4mn units in 2027, up from 1.3mn in 2026. AMD's CoWoS demand could grow 232% in 2027E with a strong ramp of Venice server CPU and MI450/455. We also lift Nvidia's Vera CPU units to 5.5mn units in 2027 from 1.6mn in 2026, implying 57% growth in Nvidia's CoWoS demand in 2027. Rubin GPU ramp was slower in Q226 due to redesigns, but we anticipate a steep pick up in H226 to reach 2.1mn for 2026. We forecast Google TPU chipset units to rise from 4.1mn in 2026 to 9.0mn in 2027, with MediaTek expected to support 4mn units of TPU v8t capacity. Amazon Trainium 3 demand is growing and we lift 2026/27E unit estimates to 1.8mn/2.8mn (from 1.7m/2.3m). See our CoWoS supply vs demand analysis in Figure 2 T o t a l C W S i n e r p s w f d m -Figure 12 C o W S d e m a n f j r c u t s .
More diversified supply ahead, but TSMC should remain the largest player
As previously noted, we anticipate advanced packaging supply to become more diversified from 2027-28 onward. We see increasing opportunities for ASE and Amkor in H226/2027, mainly driven by server CPUs. Intel's EMIB-T is gaining traction, but we believe Intel may face resource and capacity constraints in 2028, and will likely prioritise internal products and Google/MediaTek's TPU v9 initially. Overall, we think TSMC's advanced packaging sales should sustain solid ~50% growth over the next five years on its leading market share, rising content through 3D stacking, and tech upgrades such as CoPoS and co-packaged optics.
Stock recommendations; ASE/GPTC price target raised to NT$835/$5,000
Along the semiconductor supply chain for cloud AI, our top picks are TSMC (the industry's leading cloud AI foundry), MediaTek (design services for Google TPU), and ASE (advanced packaging & testing). We estimate backend, including advanced packaging, to reach ~12%/15% of TSMC sales in 2026/27E, and our recent Q226 earnings preview raised our sales and EPS estimates on stronger cloud AI demand. MediaTek is a Buy and a Key Call. We lift our ASE price target to NT$835 from NT$660. Critical equipment suppliers for advanced packaging & testing could also benefit from the cloud AI ramp-up, and we like GPTC, Chroma, Hon Precision, and ASMPT. We raise our GPTC price target to NT$5,000 (from NT$4,000) based on 33x 2027-28E PE (vs 33x 2027E PE previously). See page 6. KYEC remains well positioned in the final test space. We like Aspeed for its strong BMC outlook, GUC for its robust Google CPU upside potential, and Alchip for its Amazon Trainium3 and Trainium4 opportunities.
Equities
Asia
Semiconductors
Sunny Lin
Analyst sunny.lin@ubs.com +886-2-8722 7346
Randy Abrams
Analyst randy.abrams@ubs.com +886-2-8722 7338
Nicolas Gaudois Analyst nicolas.gaudois@ubs.com +65-6495 5148
Timothy Arcuri
Analyst timothy.arcuri@ubs.com +1-415-352 5676
Jerry Su Analyst jerry.su@ubs.com +886-28-722 7306
Shingo Hirata, CFA Analyst shingo.hirata@ubs.com
+81-3-5208 6224
Ryan Sun
Associate Analyst ryan-za.sun@ubs.com +886-2-8722 7267
Christine Chen
Associate Analyst christine.chen@ubs.com +886-2-8722 7352
Diana Chang Analyst diana.chang@ubs.com
+886-2-8722 7335
Jimmy Yoon
Analyst jimmy.yoon@ubs.com +65-6495 4617
Figure 1: Valuation comparison
| Company name | Ticker | Rating | Market cap (US$m) | Price target (LC) | Share price (LC) | EPS growth (%) | EPS growth (%) | P/E (x) | P/E (x) | P/BV (x) | P/BV (x) | ROE (%) | ROE (%) | Dividend yield (%) | Dividend yield (%) |
|---|---|---|---|---|---|---|---|---|---|---|---|---|---|---|---|
| 2026E | 2027E | 2026E | 2027E | 2026E | 2027E | 2026E | 2027E | 2026E | 2027E | ||||||
| Foundry | |||||||||||||||
| TSMC | 2330.TW | Buy | 1,961,379 | 3,400 | 2,410 | 50.7 | 39.5 | 24.1 | 17.3 | 8.5 | 6.3 | 40.5 | 41.7 | 0.9 | 1.2 |
| Fabless | |||||||||||||||
| Alchip | 3661.TW | Buy | 10,670 | 6,000 | 4,180 | 122.6 | 37.9 | 27.1 | 19.7 | 6.7 | 5.5 | 27.3 | 30.7 | 0.9 | 0.8 |
| Aspeed | 5274.TWO | Buy | 19,569 | 22,000 | 16,495 | 88.4 | 69.9 | 84.3 | 49.6 | 51.9 | 32.7 | 75.5 | 80.9 | 0.5 | 0.9 |
| GUC | 3443.TW | Buy | 20,367 | 6,260 | 4,845 | 84.2 | 99.4 | 93.4 | 46.9 | 37.7 | 23.4 | 46.1 | 61.7 | 0.3 | 0.4 |
| MediaTek | 2454.TW | Buy | 213,677 | 6,500 | 4,245 | (3.4) | 183.2 | 66.4 | 23.5 | 17.3 | 12.8 | 25.7 | 62.7 | 1.3 | 1.2 |
| Semi-backend | |||||||||||||||
| ASE | 3711.TW | Buy | 94,923 | 835 | 680 | 87.6 | 66.5 | 38.7 | 23.2 | 7.7 | 6.4 | 20.9 | 30.0 | 0.9 | 1.7 |
| KYEC | 2449.TW | Buy | 12,951 | 380 | 338 | 57.0 | 69.7 | 33.0 | 19.4 | 7.4 | 6.0 | 23.5 | 34.1 | 1.7 | 2.0 |
| Equipment | |||||||||||||||
| ASMPT | 0522.HK | Buy | 12,695 | 200 | 240 | 106.1 | 41.2 | 45.7 | 32.4 | 5.5 | 5.0 | 12.4 | 16.1 | 0.6 | 1.1 |
| Chroma ATE | 2360.TW | Buy | 28,840 | 2,960 | 2,160 | 63.5 | 37.6 | 47.7 | 34.6 | 21.3 | 16.4 | 51.2 | 53.4 | 0.4 | 0.9 |
| GPTC | 3131.TWO | Buy | 3,328 | 5,000 | 3,630 | 72.6 | 57.5 | 46.3 | 29.4 | 17.2 | 13.0 | 41.7 | 50.3 | 0.9 | 1.5 |
| Hon Precision | 7769.TW | Buy | 36,535 | 8,800 | 6,470 | 46.8 | 87.0 | 57.8 | 30.9 | 16.7 | 12.5 | 31.6 | 46.3 | 0.8 | 1.2 |
Source: LSEG, UBS estimates. Note: Priced as of 30 June 2026.
Figure 2: Total CoWoS interposer wafer demand
| Interposer Wafer Demand (kps) | Q126E | Q226E | Q326E | Q426E | Q127E | Q227E | Q327E | Q427E | 2024 | 2025 | 2026E | 2027E |
|---|---|---|---|---|---|---|---|---|---|---|---|---|
| Nvidia | 128 | 154 | 231 | 278 | 256 | 296 | 335 | 351 | 174 | 444 | 791 | 1,238 |
| AMD | 11 | 11 | 30 | 77 | 86 | 107 | 110 | 124 | 37 | 42 | 129 | 427 |
| ASICs and others | 77 | 97 | 105 | 108 | 162 | 202 | 218 | 226 | 147 | 193 | 387 | 809 |
| Google TPU - Broadcom | 60 | 76 | 195 | 338 | ||||||||
| Google TPU - MediaTek | 0 | 0 | 20 | 182 | ||||||||
| Amazon Trainium - Alchip | 26 | 5 | 72 | 132 | ||||||||
| Amazon Trainium - Marvell | 17 | 38 | 18 | 4 | ||||||||
| Meta | 7 | 8 | 6 | 25 | ||||||||
| Others | 38 | 66 | 67 | 78 | ||||||||
| Total | 216 | 262 | 365 | 463 | 504 | 605 | 664 | 702 | 358 | 679 | 1,307 | 2,475 |
Source: Company data, UBS estimates
Figure 3: Breakdown of CoWoS demand
| ASIC vendor as a %of CoWoS wafers demand | 2024 | 2025 | 2026E | 2027E |
|---|---|---|---|---|
| 17% | 11% | 16% | 21% | |
| Broadcom | 17% | 11% | 15% | 14% |
| MediaTek | 0% | 0% | 2% | 7% |
| Amazon | 12% | 6% | 7% | 6% |
| Alchip | 7% | 1% | 6% | 5% |
| Marvell | 5% | 6% | 1% | 0% |
| Meta | 2% | 1% | 0% | 1% |
| Intel / Habana | 2% | 1% | 0% | 0% |
| Microsoft | 0% | 0% | 0% | 0% |
| Tesla | 0% | 0% | 0% | 0% |
| Others | 8% | 9% | 5% | 5% |
| Total ASIC | 41% | 28% | 30% | 33% |
| GPU vendors as a %of CoWoS wafers demand | ||||
| Nvidia | 49% | 65% | 61% | 50% |
| AMD | 10% | 6% | 10% | 17% |
| Total GPU | 59% | 72% | 70% | 67% |
| Total | 100% | 100% | 100% | 100% |
Source: Company data, UBS estimates
Figure 4: Nvidia's supply chain build units
| Nvidia Supply Chain Build Units (k chips) | Q126E | Q226E | Q326E | Q426E | Q127E | Q227E | Q327E | Q427E | 2024 | 2025 | 2026E | 2027E |
|---|---|---|---|---|---|---|---|---|---|---|---|---|
| Ampere | 0 | 0 | 0 | 0 | 0 | 0 | 0 | 0 | 134 | 0 | 0 | 0 |
| Hopper | 180 | 251 | 215 | 100 | 0 | 0 | 0 | 0 | 4,086 | 1,402 | 746 | 0 |
| Blackwell B200/B300 and GB200/GB300 | 1,703 | 1,855 | 1,715 | 953 | 350 | 111 | 81 | 0 | 314 | 5,520 | 6,226 | 543 |
| Rubin R200 and VR200 | 0 | 70 | 678 | 1,339 | 1,544 | 1,797 | 1,450 | 672 | 0 | 0 | 2,087 | 5,463 |
| Rubin R300 and VR300 | 0 | 0 | 0 | 0 | 0 | 137 | 639 | 1,416 | 0 | 0 | 0 | 2,191 |
| Vera CPU | 0 | 100 | 428 | 1,054 | 1,025 | 1,180 | 1,543 | 1,754 | 0 | 0 | 1,582 | 5,502 |
| Total | 1,883 | 2,275 | 3,036 | 3,446 | 2,919 | 3,226 | 3,713 | 3,841 | 4,534 | 6,921 | 10,641 | 13,699 |
Source: Company data, UBS estimates
Figure 5: AMD's supply chain build units
| AMD Supply Chain Build Units (k chips) | Q126E | Q226E | Q326E | Q426E | Q127E | Q227E | Q327E | Q427E | 2024 | 2025 | 2026E | 2027E |
|---|---|---|---|---|---|---|---|---|---|---|---|---|
| MI300 + MI325X + MI308X+MI355X | 163 | 170 | 87 | 89 | 93 | 82 | 15 | 4 | 544 | 626 | 508 | 194 |
| MI400 | 0 | 0 | 38 | 225 | 295 | 433 | 415 | 369 | 0 | 0 | 263 | 1,513 |
| MI500 | 0 | 0 | 0 | 0 | 0 | 0 | 66 | 177 | 0 | 0 | 0 | 242 |
| Venice CPU | 0 | 0 | 400 | 900 | 900 | 1,000 | 1,000 | 1,100 | 0 | 0 | 1,300 | 4,000 |
| Others | 1 | 1 | 1 | 2 | 2 | 3 | 3 | 4 | 11 | 4 | 6 | 12 |
| Total | 164 | 171 | 526 | 1,216 | 1,291 | 1,518 | 1,498 | 1,653 | 555 | 630 | 2,077 | 5,961 |
Source: Company data, UBS estimates
Figure 6: ASIC's supply chain build units
| ASIC Supply Chain Build Units (k chips) | 2024 | 2025 | 2026E | 2027E |
|---|---|---|---|---|
| Google TPU - Broadcom | 2,045 | 2,565 | 3,680 | 5,000 |
| Google TPU - MediaTek | 0 | 0 | 450 | 4,000 |
| Amazon Trainium - Alchip | 1,000 | 176 | 1,800 | 3,100 |
| Amazon Trainium - Marvell | 600 | 1,335 | 605 | 145 |
| Meta | 348 | 421 | 175 | 425 |
| Others | 277 | 222 | 192 | 190 |
| Total | 4,270 | 4,719 | 7,072 | 13,590 |
Source: Company data, UBS estimates. Note: Others include Intel's Habana, Microsoft's Maia, Tesla's Dojo, etc.
Figure 7: SoIC volume
| SoIC (kps) | Q126E | Q226E | Q326E | Q426E | Q127E | Q227E | Q327E | Q427E | 2024 | 2025 | 2026E | 2027E |
|---|---|---|---|---|---|---|---|---|---|---|---|---|
| SoIC volume | 14 | 17 | 23 | 29 | 41 | 49 | 54 | 57 | 20 | 42 | 82 | 202 |
Source: Company data, UBS estimates
Figure 8: TSMC's back-end sales analysis
| TSMC's backend sales (US$m) | Q126E | Q226E | Q326E | Q426E | Q127E | Q227E | Q327E | Q427E | 2024 | 2025 | 2026E | 2027E |
|---|---|---|---|---|---|---|---|---|---|---|---|---|
| Sales from adv packaging | 2,693 | 3,236 | 4,421 | 5,684 | 5,924 | 7,135 | 7,959 | 8,713 | 5,240 | 8,899 | 16,034 | 29,730 |
| Sales from bumping & testing | 919 | 1,039 | 1,122 | 1,156 | 1,179 | 1,320 | 1,505 | 1,580 | 2,348 | 3,156 | 4,236 | 5,584 |
| Total TSMC's backend sales | 3,613 | 4,275 | 5,543 | 6,840 | 7,102 | 8,455 | 9,464 | 10,293 | 7,588 | 12,056 | 20,270 | 35,314 |
| %of TSMC's sales | 10.1% | 10.6% | 12.4% | 14.8% | 14.7% | 15.5% | 15.2% | 15.6% | 8.4% | 9.8% | 12.1% | 15.3% |
Source: Company data, UBS estimates
Figure 9: Industry CoWoS capacity
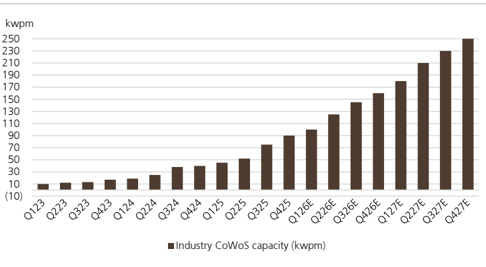
Source: Company data, UBS estimates
Figure 10: TSMC vs. non-TSMC CoWoS capacity
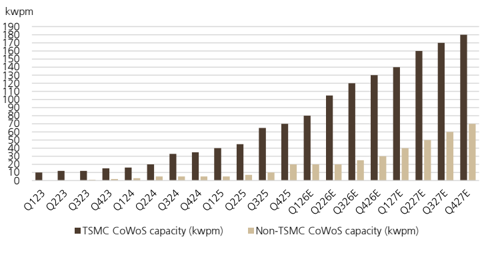
Source: Company data, UBS estimates. Note: Non-TSMC CoWoS capacity includes ASE and Amkor.
Figure 11: Industry CoWoS capacity vs. Nvidia's volume
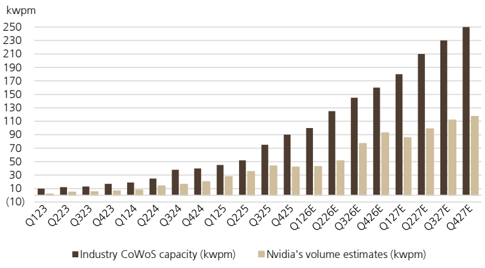
Source: Company data, UBS estimates
Figure 13: N3 supply & demand analysis
| N3 capacity requirement (kwpm) | N3 capacity requirement (kwpm) | N3 capacity requirement (kwpm) | N3 capacity requirement (kwpm) | N3 capacity requirement (kwpm) | N3 capacity requirement (kwpm) | N3 capacity requirement (kwpm) | N3 capacity requirement (kwpm) | N3 capacity requirement (kwpm) | N3 capacity requirement (kwpm) | |||
|---|---|---|---|---|---|---|---|---|---|---|---|---|
| Client | Products | Die size (mm2) | Q126E | Q226E | Q326E | Q426E | 2026 demand (k) | Q127E | Q227E | Q327E | Q427E | 2027 demand (k) |
| Nvidia | Rubin | 1,628 | 0 | 2 | 15 | 29 | 137 | 34 | 39 | 32 | 15 | 360 |
| Rubin Ultra | 1,628 | 0 | 0 | 0 | 0 | 0 | 0 | 4 | 16 | 36 | 169 | |
| Vera CPU | 800 | 0 | 1 | 5 | 11 | 51 | 11 | 13 | 17 | 19 | 178 | |
| Broadcom | Google - TPU v7 Ironwood | 1,400 | 6 | 11 | 16 | 21 | 158 | 14 | 8 | 6 | 0 | 85 |
| Google - TPU v8i | 1,400 | 0 | 0 | 2 | 4 | 18 | 7 | 17 | 25 | 35 | 250 | |
| Meta - MTIA v3 | 1,600 | 0 | 0 | 0 | 0 | 2 | 1 | 1 | 2 | 3 | 19 | |
| OpenAI | 1,600 | 0 | 0 | 0 | 3 | 11 | 3 | 4 | 4 | 1 | 36 | |
| AMD | MI355 | 840 | 2 | 2 | 1 | 1 | 17 | 1 | 1 | 0 | 0 | 7 |
| Alchip | Amazon - Trainium 3 | 1,600 | 0 | 4 | 12 | 23 | 116 | 24 | 18 | 12 | 6 | 181 |
| Marvell | Amazon - Trainium 2.5 | 1,600 | 0 | 0 | 0 | 2 | 7 | 0 | 0 | 0 | 0 | 2 |
| MediaTek | Google - TPU v8t | 800 | 0 | 0 | 1 | 4 | 15 | 9 | 13 | 12 | 9 | 129 |
| Other CPUs / accelerators and products like networking | Other CPUs / accelerators and products like networking | 2 | 4 | 10 | 20 | 106 | 21 | 24 | 25 | 31 | 302 | |
| Capacity requirement - Cloud AI (kwpm) | Capacity requirement - Cloud AI (kwpm) | 9 | 23 | 61 | 120 | 639 | 125 | 142 | 150 | 155 | 1,717 | |
| %of N3 demand | %of N3 demand | 7% | 17% | 37% | 65% | 35% | 68% | 73% | 74% | 74% | 72% | |
| Apple | iPhone's apps processor | 110 | 43 | 43 | 39 | 22 | 442 | 13 | 11 | 9 | 10 | 128 |
| Mac's processor | 165 | 10 | 10 | 8 | 7 | 106 | 7 | 6 | 6 | 6 | 74 | |
| iPad's Mprocessor for Pro & Air | 160 | 14 | 12 | 12 | 8 | 135 | 11 | 10 | 8 | 8 | 111 | |
| iPad's A17 Pro processor | 104 | 2 | 2 | 1 | 1 | 15 | 3 | 2 | 2 | 2 | 30 | |
| Qualcomm | Flagship smartphone SoC | 120 | 17 | 13 | 9 | 3 | 129 | 5 | 5 | 4 | 3 | 51 |
| MediaTek | 5G smartphone SoC | 120 | 5 | 4 | 3 | 1 | 39 | 2 | 2 | 2 | 1 | 19 |
| Intel | Outsourced PC CPUs | 100 | 19 | 19 | 11 | 4 | 161 | 8 | 8 | 8 | 5 | 85 |
| Others like Bitcoin, tablet, ARM based PC CPU | Others like Bitcoin, tablet, ARM based PC CPU | 10 | 10 | 20 | 20 | 180 | 10 | 10 | 15 | 20 | 165 | |
| Capacity requirement - Consumer and other devices (kwpm) | Capacity requirement - Consumer and other devices (kwpm) | 120 | 113 | 104 | 65 | 1,206 | 60 | 53 | 53 | 55 | 663 | |
| %of N3 demand | %of N3 demand | 93% | 83% | 63% | 35% | 65% | 32% | 27% | 26% | 26% | 28% | |
| Total N3 demand | Total N3 demand | 129 | 136 | 165 | 185 | 1,845 | 185 | 195 | 204 | 210 | 2,379 | |
| TSMC's N3 capacity | TSMC's N3 capacity | 120 | 130 | 150 | 170 | 1,710 | 175 | 180 | 185 | 190 | 2,190 | |
| Capacity utilisation | Capacity utilisation | 107% | 105% | 110% | 109% | 108% | 105% | 108% | 110% | 110% | 109% |
Source: Company data, UBS estimates. Note: kwpm stands for thousands of wafers per month.
Figure 14: TSMC is accelerating N3 capacity expansion to meet strong demand from cloud AI
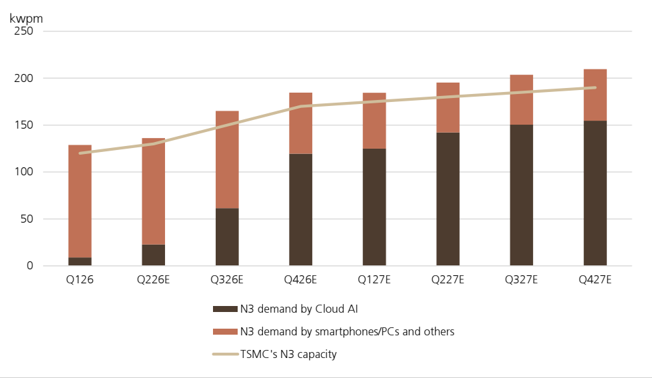
Source: Company data, UBS estimates
Figure 12: CoWoS demand from major customers
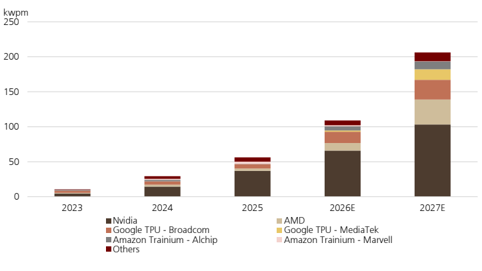
Source: Company data, UBS estimates
Figure 15: N3 capacity share by client in 2026E
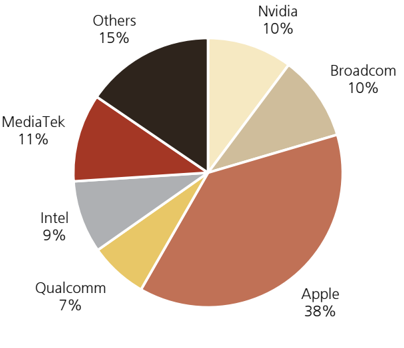
Source: Company data, UBS estimates
Figure 16: N3 capacity share by client in 2027E
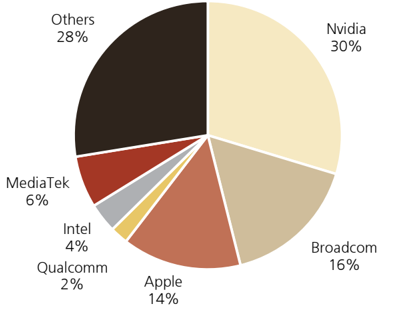
Source: Company data, UBS estimates
Thesis Map UBS Research THESIS MAP a guide to our thinking and what´s where in this report
Pivotal Questions
UBS VIEW
EVIDENCE
WHAT´S PRICED IN?
Upside/Downside Spectrum
Company Description
Q: Can advanced packaging sustain strong growth from cloud AI and increasing chiplet design into N2?
Yes. Advanced packaging has gained importance amid greater system integration and rising performance demands. We expect robust CoWoS capacity expansion to continue in 2026-27, while faster expansion by OSATs such as ASE should benefit GPTC, given its higher share in OSATs. We expect TSMC to ramp up CoWoS capacity from 70kwpm at end-2025 to 130kwpm/180kwpm by end-2026/27. We think OSAT's CoWoS capacity could reach 70kwpm by end-2027. We forecast GPTC's tool shipments to grow 22%/50% in 2026/2027.
Q: Will competitors cause GM headwinds?
Unlikely. We believe GPTC is well positioned versus competitors, given its strong track record in developing new technologies and its ability to maintain solid GM. Over the past 10+ years, despite competition from Scientech in InFO (integrated fan-out) and CoWoS, GPTC has sustained GM above 40% through technology leadership and continuous product roll-outs. Now, with advanced packaging proliferating amid faster technology upgrades and more design types, we expect GPTC to benefit over the next few years, supported by its strong industry position and leading market share in SoIC, panel-level packaging and CPO, among others. GPTC's GM has come under slight pressure in 2025-26 as it outsources some module assembly to meet strong demand. However, we expect its GM to gradually recover toward the mid-40% range by 2027-28.
GPTC is a Taiwanese semiconductor equipment supplier specialising in wet processing tools for advanced packaging. For 2026, we expect TSMC to contribute around 40-50% of its sales, with ASE and SPIL contributing around 25-30% combined. We are increasingly optimistic about the accelerated development of advanced packaging over the next three to four years, and believe GPTC could gain share given its superior technology capabilities. We raise our earnings estimates for 2026 and beyond to reflect a stronger outlook for CoWoS capacity expansion in 2027, as well as additional upside from CoPoS, SoIC and CPO in 2028. We forecast GPTC's tool shipments to increase substantially to ~330 units in 2027, up from 220 in 2026. We reiterate our Buy rating and raise our price target to NT$5,000 from NT$4,000, based on 33x 2027-28E PE (vs 33x 2027E PE previously). We believe a 33x PE multiple is justified by 36% long-term earnings CAGR.
In recent months, we have observed increasing signs of strengthening cloud AI demand, with several large US hyperscalers further raising their 2027 cloud capex plans, alongside TSMC accelerating N3/ N2 capacity expansion and increasing HBM-related capex.
YTD, GPTC's stock has rallied 133%, reflecting an improving cloud AI outlook for 2026 and beyond. However, we believe the significant opportunities in CoWoS, SoIC, panel-level packaging, HBM and CPO are still not fully priced in.
| Value drivers (2027E/2028E) | Equipment sales growth | Chemical sales growth | GM | 2027-28E PE |
|---|---|---|---|---|
| NT$6,500 upside | 73%/53% | 14%24% | 47%/47% | 36x |
| NT$5,000 base | 67%/47% | 9%/19% | 45%/45% | 33x |
| NT$2,500 downside | 57%/37% | 5%/15% | 43%/43% | 20x |
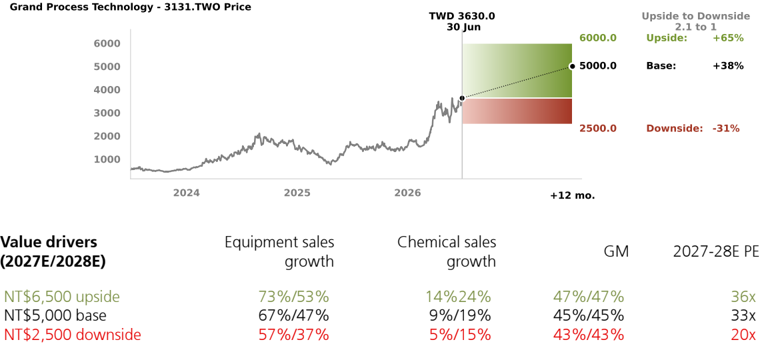
Source: UBS estimates
Founded in 1993 and headquartered in Hsinchu, Taiwan, Grand Process Technology Corp. (GPTC) is an industry leader that specializes in semiconductor wet processing equipment and chemicals. GPTC's expertise in the wet processing equipment field is recognized by major foundries and backend semiconductor companies. Its main customers include TSMC, ASE/SPIL and Chinese OSATs, with around 70% of sales concentrated in Taiwan.
Figure 17: Summary of major advanced packaging equipment vendors
| Product category | Ticker | Company name | Market cap (US$m) | Share price | Stock YTD performance | 2026E | 2027E P/E (x) | 2028E | Major equipment offering(s) |
|---|---|---|---|---|---|---|---|---|---|
| Die attach | 0522.HK | ASMPT | 12,695 | 241.6 | 211.9% | 46 | 32.6 | 26.5 | • Die bonder for on-substrate (mass reflow) • Thermo-compression bonder (Chip-to-substrate/Chip-to-wafer) • Hybrid bonder |
| BESI.AS | BE Semiconductor Industries | 24,547 | 278.9 | 108.5% | 72.2 | 42.5 | 27.5 | • Hybrid bonder • Thermo-compression bonder • Flip chip bonder | |
| 042700.KS | Hanmi Semiconductor | 15,788 | 256,500.0 | 101.3% | 76.1 | 48.3 | 40.5 | • Thermo-compression bonder | |
| KLIC.O | Kulicke and Soffa | 9,913 | 129.1 | 183.4% | 38.4 | 30.5 | 28.7 | • Thermo-compression bonder (Chip-to-substrate/Chip-to-wafer) • Ball bonder in InFO | |
| 6590.T | Shibaura Mechatronics | 1,860 | 4,620.0 | 22.0% | 20.1 | 15.7 | 17 | • Die bonder for chip-on-wafer (mass reflow) • Hybrid bonder | |
| Wet process | 3131.TWO | Grand Process Technology | 3,328 | 3,630.00 | 132.7% | 46.3 | 29.4 | 20.5 | • Wet process cleaning tool |
| Wet process | 3583.TW | Scientech | 2,172 | 904.00 | 170.7% | 44.2 | 29.7 | 22 | • Wet process cleaning tool • Temporary bonding/debonding system |
| Underfill | 6187.TWO | All Ring | 3,001 | 998.00 | 174.2% | 43.1 | 25 | 17.8 | • Underfill dispenser • Automated optical inspection (AOI) tool |
| Underfill | NDSN.O | Nordson Corporation | 17,281 | 302.2 | 25.7% | 26.1 | 24.1 | 22.3 | • Underfill dispenser |
| Metrology | 2360.TW | Chroma ATE | 27,776 | 2,160.00 | 178.7% | 51.7 | 34 | 25.5 | • Redistribution layer measurement |
| Temporary bonding | SMHNn.DE | SÜSS MicroTec | 2,045 | 93.8 | 139.5% | 45.9 | 28.8 | 21.6 | • Temporary bonding/debonding system |
Source: Company data, LSEG, UBS estimates. Share price in local currency. Note: Asian stocks priced as of 30 June 2026; non-Asian stocks priced as of 29 June 2026. EPS estimates for non-covered (Kulicke and Soffa, Shibaura Mechatronics, Scientech, All Ring, Nordson Corporation) companies are based on LSEG consensus forecasts.
Forecast changes - GPTC
Figure 18: Revisions to our earnings estimates - GPTC
| New | New | New | Old | Old | Old | Change | Change | Change | |
|---|---|---|---|---|---|---|---|---|---|
| (NT$m) | 2026E | 2027E | 2028E | 2026E | 2027E | 2028E | 2026E | 2027E | 2028E |
| Revenue | 10,363 | 15,873 | 22,521 | 10,363 | 15,553 | 20,574 | 0% | 2% | 9% |
| - YoY chg (%) | 59% | 53% | 42% | 59% | 50% | 32% | |||
| Gross profit | 4,239 | 7,106 | 10,167 | 4,239 | 6,961 | 9,291 | 0% | 2% | 9% |
| - Gross margin | 40.9% | 44.8% | 45.1% | 40.9% | 44.8% | 45.2% | 0% | 0% | 0% |
| Operating profit | 2,419 | 4,407 | 6,338 | 2,419 | 4,317 | 5,793 | 0% | 2% | 9% |
| - Operating margin | 23.3% | 27.8% | 28.1% | 23.3% | 27.8% | 28.2% | 0% | 0% | 0% |
| Pre-tax profit | 2,815 | 4,432 | 6,355 | 2,815 | 4,341 | 5,815 | 0% | 2% | 9% |
| Reported net profit | 2,251 | 3,545 | 5,084 | 2,251 | 3,473 | 4,652 | 0% | 2% | 9% |
| - Net margin | 21.7% | 22.3% | 22.6% | 21.7% | 22.3% | 22.6% | |||
| Reported EPS (NT$) | 78.45 | 123.59 | 177.23 | 78.45 | 121.07 | 162.16 | 0% | 2% | 9% |
| - YoY chg (%) | 73% | 58% | 43% | 73% | 54% | 34% |
Source: UBS estimates
Figure 19: Our revised earnings estimates vs. consensus - GPTC
| UBS | UBS | UBS | Consensus | Consensus | Consensus | Difference | Difference | Difference | |
|---|---|---|---|---|---|---|---|---|---|
| (NT$m) | 2026E | 2027E | 2028E | 2026F | 2027F | 2028F | 2026E | 2027E | 2028E |
| Revenue | 10,363 | 15,873 | 22,521 | 9,196 | 12,829 | 16,655 | 13% | 24% | 35% |
| - YoY chg (%) | 59% | 53% | 42% | 41% | 40% | 30% | |||
| Gross profit | 4,239 | 7,106 | 10,167 | 3,770 | 5,654 | 7,602 | 12% | 26% | 34% |
| - Gross margin | 40.9% | 44.8% | 45.1% | 41.0% | 44.1% | 45.6% | |||
| Operating profit | 2,419 | 4,407 | 6,338 | 2,191 | 3,621 | 5,101 | 10% | 22% | 24% |
| - Operating margin | 23.3% | 27.8% | 28.1% | 23.8% | 28.2% | 30.6% | |||
| Pretax profit | 2,815 | 4,432 | 6,355 | 2,431 | 3,817 | 5,212 | 16% | 16% | 22% |
| Net profit | 2,251 | 3,545 | 5,084 | 1,943 | 3,038 | 4,127 | 16% | 17% | 23% |
| - Net margin | 21.7% | 22.3% | 22.6% | 21.1% | 23.7% | 24.8% | |||
| Basic EPS (NT$) | 78.45 | 123.59 | 177.23 | 66.58 | 103.98 | 141.25 | 18% | 19% | 25% |
| - YoY chg (%) | 73% | 58% | 43% | 46% | 56% | 36% |
Source: Visible Alpha, UBS estimates
Figure 20: UBS earnings forecasts - GPTC
| (NT$m) | 2025 | Q126E | Q226E | Q326E | Q426E | 2026E | Q127E | Q227E | Q327E | Q427E | 2027E | 2028E | 2029E | 2030E |
|---|---|---|---|---|---|---|---|---|---|---|---|---|---|---|
| Revenue | 6,514 | 1,596 | 2,584 | 2,905 | 3,278 | 10,363 | 3,427 | 3,857 | 4,235 | 4,355 | 15,873 | 22,521 | 27,497 | 35,952 |
| - YoY chg (%) | 60% | 29% | 58% | 95% | 52% | 59% | 115% | 49% | 46% | 33% | 53% | 42% | 22% | 31% |
| - QoQ chg (%) | -26% | 62% | 12% | 13% | 5% | -63% | 24% | 13% | ||||||
| Gross profit | 2,681 | 539 | 1,059 | 1,213 | 1,427 | 4,239 | 1,512 | 1,706 | 1,912 | 1,976 | 7,106 | 10,167 | 12,665 | 16,556 |
| - Gross margin | 41.2% | 33.8% | 41.0% | 41.7% | 43.5% | 40.9% | 44.1% | 44.2% | 45.2% | 45.4% | 44.8% | 45.1% | 46.1% | 46.1% |
| Operating profit | 1,636 | 210 | 620 | 719 | 870 | 2,419 | 929 | 1,050 | 1,193 | 1,235 | 4,407 | 6,338 | 8,265 | 11,163 |
| - Operating margin | 25.1% | 13.2% | 24.0% | 24.7% | 26.5% | 23.3% | 27.1% | 27.2% | 28.2% | 28.4% | 27.8% | 28.1% | 30.1% | 31.1% |
| Pre-tax profit | 1,690 | 580 | 632 | 728 | 875 | 2,815 | 936 | 1,058 | 1,200 | 1,239 | 4,432 | 6,355 | 8,278 | 11,175 |
| Net profit | 1,327 | 463 | 505 | 582 | 700 | 2,251 | 749 | 846 | 960 | 991 | 3,545 | 5,084 | 6,623 | 8,940 |
| - YoY chg (%) | 57% | 81% | 145% | 91% | 25% | 70% | 62% | 67% | 65% | 41% | 58% | 43% | 30% | 35% |
| - QoQ chg (%) | -18% | 9% | 15% | 20% | 7% | -62% | 28% | 17% | ||||||
| Basic EPS (NT$) | 45.45 | 16.11 | 17.62 | 20.29 | 24.41 | 78.45 | 26.09 | 29.49 | 33.47 | 34.54 | 123.59 | 177.23 | 230.85 | 311.63 |
| - YoY chg (%) | 56% | 84% | 150% | 95% | 27% | 73% | 62% | 67% | 65% | 41% | 58% | 43% | 30% | 35% |
| - QoQ chg (%) | -16% | 9% | 15% | 20% | 7% | -62% | 28% | 17% |
Source: Company data, UBS estimates
Figure 21: GPTC's 12M forward PE band (x)
Source: LSEG, UBS
Valuation Method and Risk Statement
Tech investing involves risk. It is difficult for the investment community, UBS included, to project the financial results of tech companies, as their operating models are highly volatile and unpredictable, and they compete in a highly dynamic marketplace. In addition to their low predictability, valuing tech stocks can be challenging because neither traditional nor nontraditional valuation measures have provided much insight into how tech stocks trade.
We value GPTC based on PE methodology.
Downside risks include: 1) slower-than-expected CoWoS capacity expansion; 2) competitors achieving technological advancements; 3) geopolitical uncertainty; and 4) worse-thanexpected AI growth.
Quantitative Research Review
UBS Global Research publishes a quantitative assessment of its analysts' responses to certain questions about the likelihood of an occurrence of a number of short term factors in a product known as the 'Quantitative Research Review'. The views for this month can be found below. Views contained in this assessment on a particular stock reflect only the views on those short term factors which are a different timeframe to the 12-month timeframe reflected in any equity rating set out in this note. For previous responses please make reference to (i) previous UBS Global Research reports; and (ii) where no applicable research report was published that month, the Quantitative Research Review which can be found at https://neo.ubs.com/quantitative, or contact your UBS sales representative for access to the report or the Quantitative Research Team on ubs-quant-answers@ubs.com. A consolidated report which contains all responses is also available and again you should contact your UBS sales representative for details and pricing or the Quantitative Research Team on the email above.
GPTC
| Question | Response |
|---|---|
| 1. Is the industry structure facing the firm likely to improve or deteriorate over the next six months? Rate on a scale of 1-5 (1 = getting worse, 3 = no change, 5 = getting better, N/A = no view) | 4 |
| 2. Is the regulatory/government environment facing the firm likely to improve or deteriorate over the next six months? Rate on a scale of 1-5 (1 = getting tougher 3 = no change, 5 = getting better, N/A = no view) | 3 |
| 3. Over the last 3-6 months in broad terms have things been improving/no change/getting worse for this stock? Rate on a scale of 1-5 (1 = getting a lot worse, 3 = not much change, 5 = getting a lot better, N/A = no view) | 3 |
| 4. Relative to the current CONSENSUS EPS forecast, is the next company EPS update likely to lead to: (1 = negative surprise vs consensus, 3 = in-line with consensus, 5 = positive surprise vs consensus expectations, N/A = no view) | 3 |
| 5. What's driving the difference? | |
| 6. Relative to YOUR current earnings forecast, is there relatively greater risk at the next earnings result of:(1 = downside skew risk to earnings, 3 = equal upside or downside risk to earnings, 5 = upside skew risk to earnings, N/A = no view) | 3 |
| 7. What's driving the difference? | |
| 8. Is there an upcoming catalyst for the company over the next three months? | |
| 9. Is there an actual or approximate date for the catalyst? | |
| 10. Is the catalyst date an actual or approximate date? | |
| 11. What is the catalyst? |
Required Disclosures
This document has been prepared by UBS Securities Pte. Ltd., Taipei Branch, an affiliate of UBS AG. UBS AG, its subsidiaries, branches and affiliates, including former Credit Suisse AG and its subsidiaries, branches and affiliates are referred to herein as "UBS".
For information on the ways in which UBS manages conflicts and maintains independence of its UBS Global Research product; historical performance information; certain additional disclosures concerning UBS Global Research recommendations; and terms and conditions for certain third party data used in research report, please visit https://www.ubs.com/disclosures. Unless otherwise indicated, information and data in this report are based on company disclosures including but not limited to annual, interim, quarterly reports and other company announcements. The figures contained in performance charts refer to the past; past performance is not a reliable indicator of future results. Additional information will be made available upon request. UBS Securities Co. Limited is licensed to conduct securities investment consultancy businesses by the China Securities Regulatory Commission. UBS acts or may act as principal in the debt securities (or in related derivatives) that may be the subject of this report. This recommendation was finalized on: 01 July 2026 05:38 AM GMT. UBS has designated certain UBS Global Research department members as Derivatives Research Analysts where those department members publish research principally on the analysis of the price or market for a derivative, and provide information reasonably sufficient upon which to base a decision to enter into a derivatives transaction. Where Derivatives Research Analysts coauthor research reports with Equity Research Analysts or Economists, the Derivatives Research Analyst is responsible for the derivatives investment views, forecasts, and/or recommendations. Quantitative Research Review: UBS Global Research publishes a quantitative assessment of its analysts' responses to certain questions about the likelihood of an occurrence of a number of short term factors in a product known as the 'Quantitative Research Review'. Views contained in this assessment on a particular stock reflect only the views on those short term factors which are a different timeframe to the 12-month timeframe reflected in any equity rating set out in this note. For the latest responses, please see the Quantitative Research Review Addendum at the back of this report, where applicable. For previous responses please make reference to (i) previous UBS Global Research reports; and (ii) where no applicable research report was published that month, the Quantitative Research Review which can be found at https://neo.ubs.com/ quantitative, or contact your UBS sales representative for access to the report or the Quantitative Research Team on ubs-quantanswers@ubs.com. A consolidated report which contains all responses is also available and again you should contact your UBS sales representative for details and pricing or the Quantitative Research team on the email above.