PDF 原檔:260622_三星電機_ms_MLCC-super-cycle_original.pdf
原始內容
M June 22, 2026 03:46 PM GMT
Asia Technology | Asia Pacific
MLCC Super Cycle - The Other AI Squeeze
What's Changed
Samsung Electro-Mechanics (009150.KS) Price Target
From W920,000
To
W2,560,000
AI is shifting from semiconductors to MLCCs, creating a supplydemand mismatch in high-end components. TAM is set to expand, driven by compute, power, and networking needs. The key question is not if supply tightens, but how long constraints could persist.
What's changed? AI computing platforms are driving a surge in capacitor demand a single AI server consumes ~440,000 MLCCs, 10-15x more than traditional servers. Producers are reallocating capacity toward high-growth, high-margin AI applications, reducing flexibility in other segments. Demand is shifting from volume to quality, with a focus on high-value solutions and long-term supply lock-ins for AI data centers.
Why it matters? We estimate AI-driven MLCC demand will more than quadruple between 2025 and 2030, while total capacity grows only 10%-15% annually. AIgrade supply already runs ahead of current capacity, with premium high-reliability and high-voltage lines effectively booked out for multiple years. AI platforms now compete directly with consumer, automotive, and industrial applications for advanced materials, heightening supply risk for traditional customers.
Cycle upturn - early innings. Supply concerns extend beyond near-term shortages, with longer-term supply agreements becoming more common. Key indicators to monitor include: (1) evolving AI specifications, (2) sharp reversals in book-to-bill ratios, (3) pricing momentum (YoY), and (4) AI server demand.
Stock implications. We raise our SEMCO earnings estimates and PT following recent AI customer commitments (ABF substrates, embedded MLCCs, silicon capacitors, and potential glass substrates). In Taiwan, we favor Yageo , which benefits from capacity shifting away from commodity MLCCs. In Japan, we favor Murata on rising AI exposure, while we expect Taiyo Yuden to underperform due to elevated expectations.
Idea
Morgan Stanley & Co. International plc+
Shawn Kim
Equity Analyst
Shawn.Kim@morganstanley.com
+44 20 7677-1018
Morgan Stanley Asia Limited+
Duan Liu
Equity Analyst
Duan.Liu@morganstanley.com
+852 2239-7357
Morgan Stanley & Co. International plc+
Cindy Huang
Equity Analyst Cindy.Huang@morganstanley.com
+44 20 7425-2915
Morgan Stanley & Co. International plc, Seoul Branch+
Ryan Kim
Equity Analyst
Ryan.G.Kim@morganstanley.com
+82 2 399-4939

S. Korea Technology
Asia Pacific Industry View
Attractive
Morgan Stanley does and seeks to do business with companies covered in Morgan Stanley Research. As a result, investors should be aware that the firm may have a conflict of interest that could affect the objectivity of Morgan Stanley Research. Investors should consider Morgan Stanley Research as only a single factor in making their investment decision.
For analyst certification and other important disclosures, refer to the Disclosure Section, located at the end of this report.
+= Analysts employed by non-U.S. affiliates are not registered with FINRA, may not be associated persons of the member and may not be subject to FINRA restrictions on communications with a subject company, public appearances and trading securities held by a research analyst account.
M
Executive summary
The MLCC industry today feels like the legacy DDR4 DRAM two years ago, which experienced unprecedented, AI-driven supply constraints, triggering structural price hikes. These shortages arose as leading DRAM manufacturers redirected fixed capacity toward higher-margin AI hardware (e.g., HBM), away from legacy products. We see several reasons why MLCC constraints are structural this time:
- Existing MLCC capacity (e.g., EV-related) is not fungible with AI servers, given large differences in specifications, packaging, power conversion, and capacitancevoltage requirements.
- Long lead times. Greenfield MLCC capacity requires ~2 years from commitment to production. Unlike semiconductors, equipment is customized in-house, limiting rapid efficiency gains.
- New wave of agentic AI demand. Inference growth and the CPU-intensive nature of agentic AI add incremental demand beyond GPUs. Technology: Rise of the AI Agent - Global Implications (19 Apr 2026)
- Required returns. Manufacturers require sustained pricing upside to justify new capacity; most target output growth of ~10%-15% p.a. while avoiding speculative investment.
- High entry barriers. High-capacitance, low-ESL MLCCs for servers and autos face strict qualification constraints, limiting competition from lower-end producers.
- 2026 vs. 2017. The commodity part of the MLCC industry will likely face shortages similar to the 2017-18 super cycle driven by a demand surge from EV adoption and smartphone content (5G and iPhone), although current dynamics are more structural, supported by durable AI demand.
What's changed?
How AI is impacting MLCCs? MLCCs are evolving from commodity components into strategic resources. The focus has shifted from quantity to increasingly complex technical requirements, including closer system integration, higher capacitance density, and AIspecific power architectures.
- Content surge: AI servers require ~8-13x more MLCCs than traditional servers, driven by rapid load changes and the need for stable multi-rail power delivery. MLCCs play a critical role in decoupling and noise suppression due to fast response at high frequencies.
- Volume surge. NVIDIA's GB300 platform uses ~320,000 units per full cabinet, ~30x the consumption of a high-end smartphone. The upcoming Vera Rubin platform implies ~1.8x higher content value.
- Specs surge. AI GPUs require ultra-low ESR and minimal ESL to manage nanosecond transient responses and prevent system instability under high-load conditions.
- Tiny but mighty. Limited board space increases the importance of small-size, highcapacitance MLCCs, making advanced materials science a key competitive differentiator.
VR Solution step1
(Mother Board VR)
HBM
Power
Coill
Stage
Output
PMIC
ASIC
High capacitance
MLCC
Integrated Voltage Regulator
VR Solution step2
(Vertical Power Delivery)
HBM
2T Cap
VR Solution step3
(IVR : Integrated VR)
Low ESL
Embedded Package Substrate
CPU/GPU|
CPU/GPU
M
(input)
PMIC|
PMIC
Main Board
Thin
Embedding
MLCC
MLCC
Vertical Power Delivery
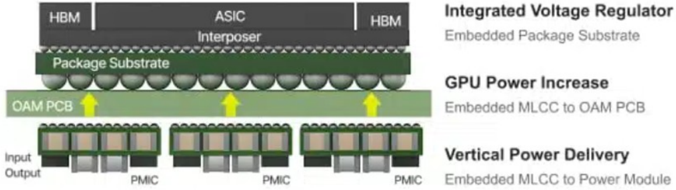
Embedded MLCC - a new trend addressing multiple issues. Embedded MLCCs are emerging as a key design feature in AI servers. They facilitate current flow and reduce power loss by integrating power supply circuits within ABF substrates, shortening the distance to semiconductor chips. This enables efficient vertical power delivery, reduces losses, and frees board space for additional components.
Multilayer substrates in AI servers use copper interconnects, requiring embedded components to be copper-plated for effective bonding. Embedded MLCCs feature flat surfaces that improve substrate integration and reliability. This design also increases usable board space, supporting higher component density.
Exhibit 1: Embedded MLCC architecture
Source: Samsung Electro - Mechanics
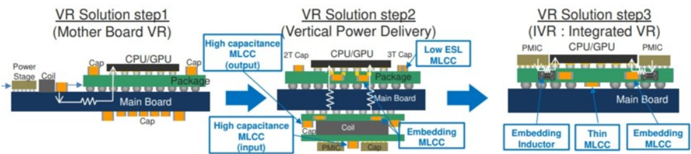
The importance of AI server power integrity. AI servers increasingly require highperformance power supply circuits, driving demand for MLCCs capable of handling higher current and enabling more efficient power delivery. This shift is reshaping power solutions toward high-density integration of electronic components within constrained spaces, supporting enhanced system performance.
Exhibit 2: MLCC evolution in AI servers
Source: Taiyo Yuden
Channel Checks
Our recent channel checks point to 200%-300% price increases at distributors since 1Q26 (vs. a 10x peak in 2017) and direct sales up to 30% QoQ.
- Spot pricing: The Huaqiangbei spot market in Shenzhen has seen significant price increases since early May. Initially concentrated in high-capacitance products, increases have spread to consumer grades. Distributor pricing to spot customers has risen 2-10x for some specifications (e.g., 0805 27uF up ~6x YTD), from cycle trough levels over the past two years.
- Contract pricing: Leading suppliers have raised distributor pricing by 20%-30% QoQ in 2Q26. Some have removed volume discounts and stopped accepting orders
PMIC
PMIC
M
- at 1Q low prices. Distributors expect further price increases in 3Q26 and are actively negotiating LTA-like agreements to secure supply.
- Inventory: Supply chain inventory remains lean after two years of destocking. Distributors hold ~1.5 months of inventory on average, while downstream customers hold less than one month.
- Is this hype? Distributors do not expect meaningful demand growth from consumer applications and note that some extreme price increases (10-20x) reflect inventory hoarding by traders in Huaqiangbei rather than end demand. However, with lean inventories and leading suppliers reallocating capacity toward AI-grade products, distributors expect a more durable trend vs. the short-lived tariff-driven spike in early 2025.
Still early in the cycle?
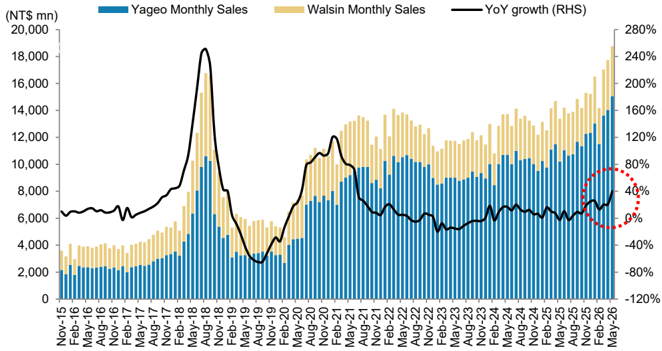
The market has moved beyond a typical commodity cycle into structural competition in materials science, precision manufacturing, and supply chain resilience. Lead times exceed 20 weeks for high-end products, and pricing dynamics are shifting from cyclical volatility to structurally elevated premiums for strategic AI components. High-end shortages remain real, while distributors have begun precautionary stockpiling of standard X5R products - a segment not currently in shortage.
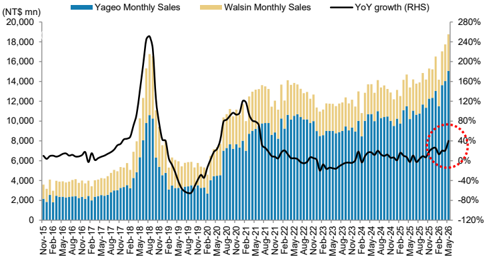
Exhibit 3: Taiwan monthly MLCC sales - cycle edging up with May +40% YoY
Source: Company data, Morgan Stanley Research
Market structure
Who dominates? The high-end AI MLCC market is dominated by a Japanese-Korean duopoly, with a combined 85% market share.
- Murata (45% share): As the industry benchmark, Murata's AI server orders are running at ~2x capacity, with utilization at 90%-95%. Its competitive edge stems from vertical material integration and leadership in ultra-small 008004 form factors.
- Samsung Electro-Mechanics (40% share): SEMCO has narrowed the gap with Murata by pivoting from low-margin consumer electronics to higher-margin AI and
M
Idea
- automotive segments. Its Tianjin plant is operating at full capacity to meet global demand.
- Other key players including TDK , Taiyo Yuden , and Yageo focus on high-voltage and specialized industrial modules. Chinese firms like CCTC (San Huan Group) are entering domestic server supply chains. Commodity-grade producers, including Walsin Tech in Taiwan and Guangdong Fenghua Advanced Technology , Chaozhou Three-Circle and Eyang Technology in China, primarily serve consumer electronics.
- Kyocera AVX is strongly positioned in automotive and industrial segments, while Vishay Intertechnology offers a broad capacitor portfolio.
Stock implications
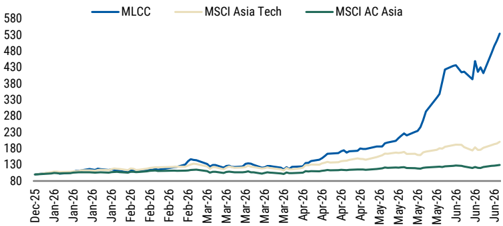
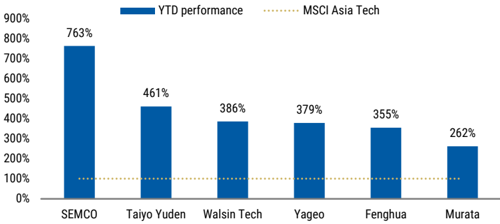
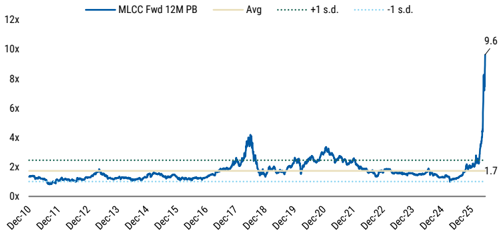
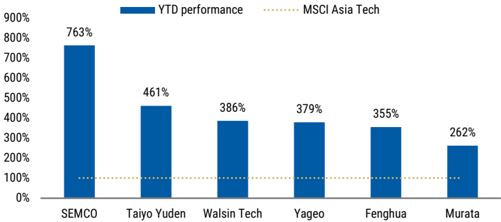
MLCC has lagged the broader AI trade but has delivered strong returns since the onset of agentic AI (Yageo +379% YTD, SEMCO +763% and Fenghua +355%). We remain constructive despite the rally, as price increases are broadening beyond spot markets, while book-to-bill ratios and utilization continue to improve. AI and data center demand are pulling scarce high-end MLCC capacity away from standard applications.
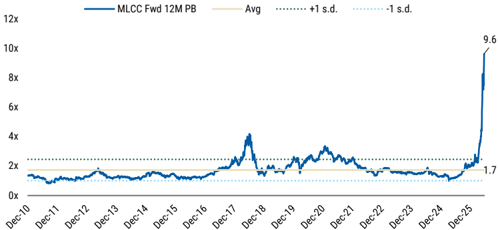
We recommend SEMCO supported by ~20% potential upside to our price target and its still reasonable valuation at 1.4x P/B vs. historical average of 1.7x.
In Taiwan, Howard Kao continues to prefer Yageo OW for its business transformation growth story (link). Yageo's preliminary May earnings tracked ahead of expectations with supply chain checks pointing to substantially stronger pricing in 2H26.
In Japan, Shoji Sato believes Murata OW will benefit most from increased demand and product mix improvements, while Taiyo Yuden UW may only see modest benefits from improved mix, driven by compact larger-capacity products. Electronic Components: Murata Mfg Now Our Top Pick, Lowering Taiyo Yuden to UW (16 Jun 2026).
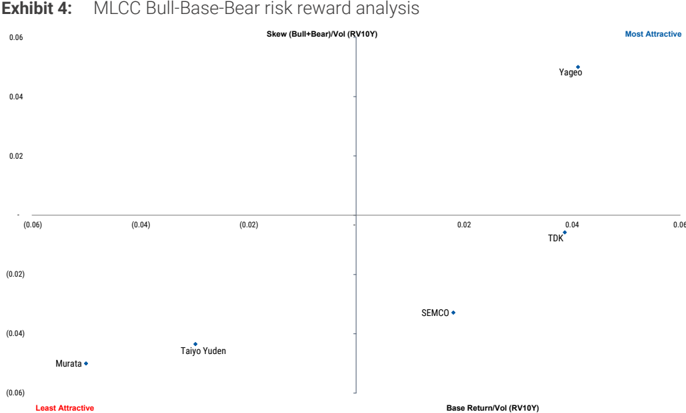
Source: Factset, Morgan Stanley Research. Note: X-axis (Base Return/Vol) represents our base case price target return divided by 10-year realized volatility (RV10y). Y-axis (Skew) represents the sum of our bull and bear case returns divided by RV10y, capturing payoff asymmetry.
M
Key Charts
Exhibit 5: MLCC remains one of the best performing segments within Asia Tech YTD
Source: Factset, Morgan Stanley Research
Exhibit 7: MLCC group now trading at 9.6x NTM P/B vs. historical average of 1.7x
Source: Factset, Morgan Stanley Research
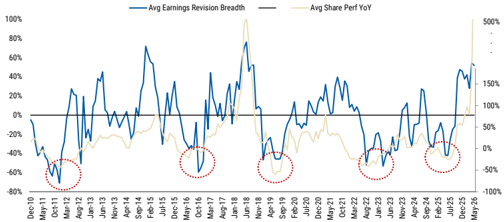
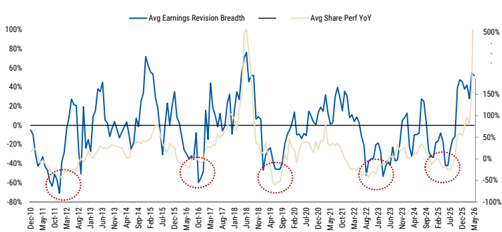
Exhibit 9: Earnings revision breadth has bounced back since Oct-25 and is moving to positive territory
Source: Factset, Morgan Stanley Research
Exhibit 6: SEMCO outperform MLCC peers YTD
Source: Factset, Morgan Stanley Research
Exhibit 8: Taiwan monthly MLCC sales - cycle edging up with May +40% YoY
Source: Company data, Morgan Stanley Research
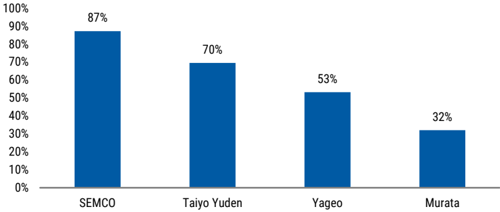
Exhibit 10: EPS revision YTD
Source: Factset, Morgan Stanley Research
7000x
6000x
5000x
4000x
3000x
2000x
1000x
M
Will AI Impact MLCC?
MLCCs (multilayer ceramic capacitors) are critical components in modern electronic systems, serving as local energy reservoirs that stabilize voltage and suppress noise in electronic circuits. In AI servers, MLCCs are particularly important because GPUs, CPUs, ASICs, and FPGAs operate at very low voltages and switch on and off within nanoseconds, creating significant transient current demands and voltage fluctuations.
Positioned close to these processors, MLCCs provide immediate charge delivery to support rapid current spikes while simultaneously filtering high-frequency noise. Their inherently low equivalent series resistance (ESR) and low equivalent series inductance (ESL) enable them to respond to the nanosecond-scale current fluctuations associated with AI accelerators, making them indispensable for maintaining power integrity.
The importance of MLCCs has increased as semiconductor process nodes continue to shrink. Lower operating voltages improve computing performance and power efficiency but also reduce voltage tolerance, meaning even small voltage deviations can impair chip functionality. At the same time, AI workloads are driving higher processor power consumption, increasing the need for local decoupling capacitance. Given board space constraints, this creates sustained demand for smaller, higher-capacitance MLCCs.
Content Growth: AI Drives a Step-Function Increase in MLCC Consumption. Al accelerators are transient-current hungry - high di/dt, very low operating voltages - so designers pack far more local decoupling capacitance around the die to hold power integrity. At the board level, an AI server mainboard carries an estimated 15,000-25,000 MLCCs, roughly 10x a general server. That scales sharply at the system level: a fully configured Rubin NVL72 rack runs ~570k MCCs vs~320k for GB300, with total dollar content per rack up ~182%.
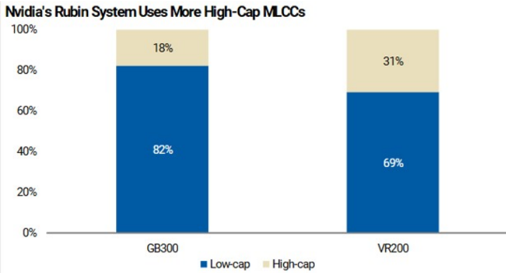
Mix Upgrade: AI Demand Favors High-Value MLCCs. The AI opportunity is not only about higher unit consumption but also a significant shift toward more technologically demanding products. Demand is increasingly concentrated in small-form-factor, highcapacitance, high-temperature, and low-ESL MLCCs that are optimized for accelerator power delivery. In particular, 47µF+ high-capacitance MLCCs are becoming a larger portion of AI server bill-of-materials requirements, accounting for more than 30% of units in Rubin-generation platforms versus less than 20% in GB300 systems. We estimate cloud AI demand for 47µF+ MLCCs could expand from ~4bn units in CY25 to~38bn units by CY30. This mix shift toward premium products is likely to be a more durable driver of industry ASPs than cyclical pricing movements.
Capacity Intensity: AI Creates Disproportionate Capacity Consumption. High-cap AI MLCCs need several hundred to over a thousand dielectric layers, so each part eats a disproportionate share of capacity relative to its unit count. Even at only ~3% of industry units and ~5% of revenue by CY27, AI absorbs far more capacity than that. As the leaders shift toward AI, supply tightens and pricing firms across everything else. That's what the channel data is now showing.
laun
Server Assumptions
General server
of MLCCs
2,000
M
Peripheral boards
HGX B200 Al server (8x GPU)
GPU module (OAM)
GPU baseboard (UBB)
CPU motherboard
Peripheral boards
HGX B300 Al server (8x GPU)
GPU module (OAM)
GPU baseboard (UBB)
CPU motherboard
Peripheral boards
GB200 (NVL72)
Bianca
Switch board
Peripheral boards
GB300 (NVL72)
Bianca
Switch board
Peripheral boards
VR200 (NVL72)
Strata
Switch board
BlueField Module
CX9 Orchid Module
Peripheral boards
Vera Rack
Vera MGX
Switch board
Peripheral boards
STX Rack
Mainboard
Peripheral boards
LPX Rack
LPX UBB
LPX Module
BF4
x86 CPU Module
8x
8x
1x
1x
8x
8x
1x
1x
8x
36x
9x
90x
36x
9x
90x
36x
9x
72x
45x
128x
4x
64x
16x
384x
16x
256x
16x
16x
650
3,000
1,500
5,300
650
4,400
6,100
1,500
650
6,800
650
3,800
6,300
650
3,800
11,000
2,000
7,000
650
650
3,316
650
7,000
4,791
650
5,374
2,000
1,705
1,660
30
190
80
45
25
Exhibit 11: VR200 MLCC unit demand is rising to 570K+, up close to 80% vs a GB300 rack
36,000
24,000
5,300
1,500
5,200
48,000
35,200
6,100
1,500
5,200
337,500
244,800
34,200
58,500
319,500
226,800
34,200
58,500
571,050
396,000
63,000
46,800
36,000
29,250
494,048
424,448
28,000
41,600
326,256
76,656
249,600
581,024
85,984
436,480
32,000
26,560
| 24 60 192 60 | 24 60 192 60 |
|---|---|
| 25 25 | 25 25 |
| 5 40 | |
| 435 320 | |
| 40 50 50 | |
| 25 25 | |
| 5 40 | |
| 1,710 | |
| 30 20 1,080 180 | |
| 5 450 | |
| 1,530 900 | |
| 25 20 180 | |
| 5 450 | |
| 4,320 | |
| 90 45 3,240 | |
| 5 405 90 | |
| 5 360 | |
| 20 3,060 2,560 | |
| 45 5 180 320 | |
| 2,415 | |
| 31 495 | |
| 5 1,920 | |
| 35 559 | |
| 14 3,527 | |
| 5 10 80 160 |
Source: Morgan Stanley Asia Pacific Research estimates based on supply chain checks.
317
US$
univell uy ai lelaleu myn value pruuuulo
• AI/DC = Others
Nvidia's Rubin System Uses More High-Cap MLCCs
40
100%
(USD bn)
35
80%
30
25
60%
40%
20
15
20%
10
5
18%
lastel
Ieaull uluse lu voplull, tlaunmly mealm yruny abuve vur previuus forecast of ~US$550M by 2030
Al Server MLCC Demand Split by High/Low-Cap (USS M)
600
Al Server MLCC Demand (USS M)
35%
M
82%
Exhibit 12: High-cap (47uF+) MLCC usage to increase to 30%+ in VR200 (vs <20% for GB300) 10%
0%
0
CY24
refers to 47uF+ MLCCS.
Source: Morgan Stanley Research estimates.
Source: Morgan Stanley Asia Pacific Research estimates based on supply chain checks. Note: High-cap refers to 47uF+ MLCCs.
100
0
86
893
402
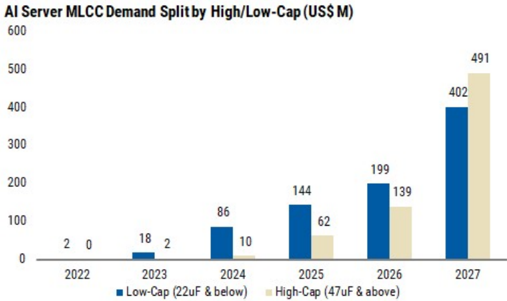
Exhibit 13: Demand for high-cap (47uF+) MLCC is growing faster 144 139 338
Source: Morgan Stanley Research estimates.
Market outlook
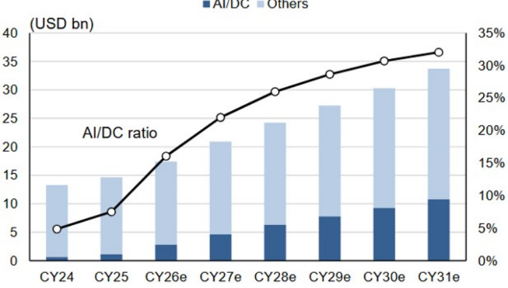
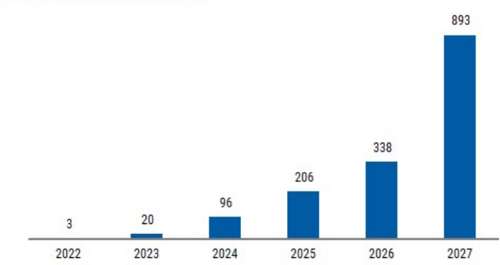
We see global MLCC shipment value rising from US$14.7bn in 2025 to US$24.3bn in 2028e - an 18% CAGR against a 6.5% ten-year trend - with AI/DC the dominant incremental drive. AI server MLCC TAM now looks like ~US$900M by 2027e and could exceed US$1bn by 2030e if AI infrastructure demand keeps running ahead. We expect tightness to hold into 2H26 and 2027 as capacity lags, with mix-driven ASP the sustainable feature rather than transient spot spikes.
Exhibit 14: Global MLCC market forecasts
| Base Case | 2007 2008 | 2009 | 2010 | 2011 | 2012 2013 | 2014 2015 | 2016 | 2017 | 2018 | 2019 2020 | 2021 | 2022 | 2023 2024 | 2025 2026e | 2027e 2028e | 2029e | 2030e | 2031e | |||
|---|---|---|---|---|---|---|---|---|---|---|---|---|---|---|---|---|---|---|---|---|---|
| Total worldwide shipment quantity (Bil pcs) | 1,504 | 1,480 1,640 | 2,050 | 2,029 | 2,167 2,293 | 2,605 2,735 | 3,080 | 3,480 | 3,828 | 3,254 | 3,695 | 4,446 | 3,572 | 3,187 3,386 | 3,773 | 4,037 4,360 | 4,709 | 5,086 | 5,493 | 5,932 | |
| YoY (%) | 14.9% | -1.6% 10.8% | 24.9% | -1.0% | 6.8% 5.8% | 13.6% | 5.0% 12.6% | 13.0% | 10.0% -15.0% | 13.5% | 20.3% | -19.7% | -10.8% 6.2% | 11.4% 7.0% | 8.0% | 8.0% | 8.0% | 8.0% | 8.0% | ||
| ASP in worldwide shipment (Cent) | 0.47 0.42 | 0.36 | 0.38 0.39 | 0.36 | 0.33 | 0.30 | 0.29 0.26 | 0.27 | 0.37 | 0.39 0.38 | 0.39 | 0.40 | 0.40 0.39 | 0.39 0.43 | 0.48 | 0.52 | 0.54 | 0.55 | 0.57 | ||
| YoY (%) | -0.2% -10.1% | -14.0% | 6.8% 1.2% | -7.7% | -7.2% | -10.6% | -4.1% -7.2% | 3.8% | 34.3% | 4.6% | -2.8% | 4.7% | 2.0% | -1.0% -1.0% | -1.0% | 11.0% 11.0% | 7.5% | 4.0% | 3.0% | 3.0% | |
| Total worldwide shipment value (Bil $) | 7.00 | 6.19 5.90 | 7.87 | 7.89 7.77 | 7.63 | 7.75 | 7.80 | 8.15 | 9.56 | 14.13 | 12.56 13.86 | 17.47 | 14.32 | 12.64 13.30 | 14.67 17.43 | 20.89 | 24.25 | 27.24 | 30.30 | 33.71 |
Source: Morgan Stanley Research
Exhibit 15: Global MLCC shipment value to continue rising, driven by AI -related high -value products
Source: Morgan Stanley Research estimates.
491
Exhibit 16: By 2027, AI server MLCC demand will likely already reach close to US$1bn, tracking meaningfully above our previous forecast of ~US$550M by 2030
Source: Company data, Morgan Stanley Research estimates.
Exmbll 1%. Miuu tainel orlale
— Taiyo Yuden —#—-SEMCO |
**•X•• Yageo
M
Stock updates
Yageo
5.4%
SEMCO
22.5%
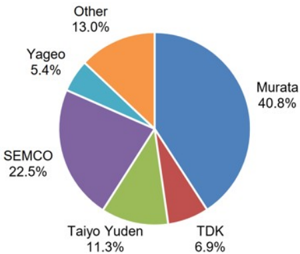
We receive frequent investor questions comparing Japan, Korea, and Taiwan, given direct competition across multiple segments. We address key metrics including profitability, high-end exposure, growth, cash conversion, and ROIC. We believe SEMCO should continue narrowing the gap with peers, but Murata is likely to retain clear leadership, with an estimated 41% share of the MLCC market in 2025.
Exhibit 18: MLCC market share (CY25)
Source: Company data, Morgan Stanley Research
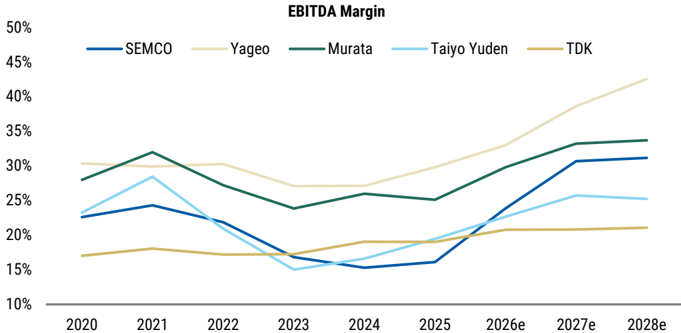
- How does profitability compare? This question comes to us regularly as business mix varies as well as level of disclosure. We highlight margin dynamics below, and we believe the industry should vary around 20-30% EBITDA margins in 2026 and continue to expand in 2027-28 with Murata and Yageo ahead vs. TDK meaningfully lower. SEMCO MLCC margins are catching up quickly driven by AI-related shipments.
Exhibit 19: MLCC player EBITDA margin
Source: Company Data, Morgan Stanley Research (e) estimates
- What is the growth outlook ? Comparing the revenue growth outlook for MLCC players, we expect segment growth to accelerate, led by SEMCO's aggressive expansion into premium products and Yageo's acquisition strategy. From an end-market exposure perspective, Japanese players retain a leading position, with over 60% revenue exposure to high-end smartphone and industrial/automotive demand.
40%
35%
30%
25%
20%
15%
10%
5%
0%
1Q 1Q
Source: Company data, Morgan Stanley Research
Exhibit 17: MLCC market share
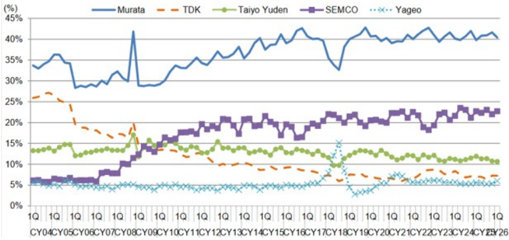
Source: Company data, Morgan Stanley Research
cxmbll 10. ViLuu tllainel ollale ul<u)
Other
13.0%
Murata
40.8%
M
Exhibit 20: SEMCO and Yageo leading growth into next upcycle
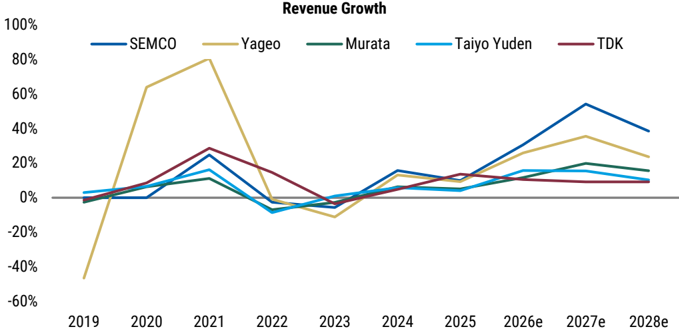
Source: Company Data, Morgan Stanley Research (e) estimates
- What are the differences in cash generation? We highlight FCF conversion as a percentage of net income below. Note that working capital can be volatile year-to-year in this business, driven by raw material costs and the scale of down payments on large projects. Capex has declined across companies in recent years but will likely increase to support strong industry growth, which we view as critical to driving further earnings. Yageo's M&A activity is an exception, and the incremental contribution to sales and EBITDA remains uncertain.
Exhibit 21: MLCC players' FCF conversion
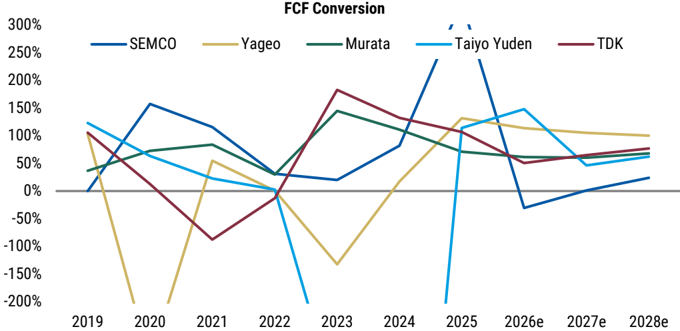
Source: Company Data, Morgan Stanley Research (e) estimates
- What is the relative ROIC level? When we compare ROIC for each company historically and forecasts, we observe that Taiyo Yuden returns have lagged meaningfully while SEMCO is improving significantly with AI MLCC and ABF upgrade tailwinds. As a group, we expect the ROIC to recover towards the double-digit level by 2026 and move even higher towards new highs in 2028. Overall, the returns profile of the companies is not fundamentally different, in our view, which makes sense considering their business
M
similarities.
Exhibit 22: Improving ROIC into 2026-28e
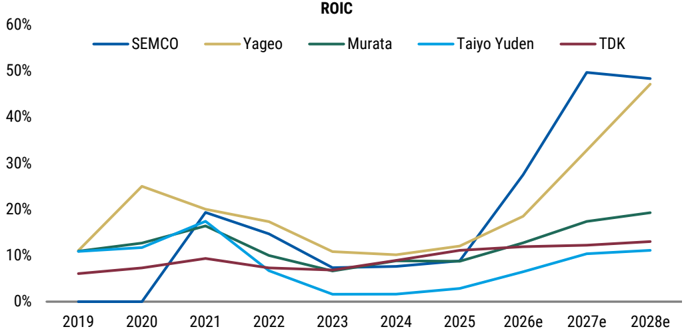
Source: Company Data, Morgan Stanley Research (e) estimates
M
| Latest Published Quarter Earnings Results | Latest Published Quarter Earnings Results | Latest Published Quarter Earnings Results | Latest Published Quarter Earnings Results | Latest Published Quarter Earnings Results |
|---|---|---|---|---|
| Metric | Results | Consensus | Beat/Miss | |
| SEMCO | Revenue | W3.2tn | W3.1tn | Beat |
| W280.6bn | W271.5bn | Beat | ||
| Murata | Revenue | ¥460.6bn | ¥438.7bn | Beat |
| ¥78.8bn | ¥71.8bn | Beat | ||
| Taiyo Yuden | Revenue | ¥89.2bn | ¥88.9bn | Beat |
| ¥3.5bn | ¥5.0bn | Miss | ||
| Yageo | EPS | NT3.9 | NT$3.7 | Beat |
| TDK | Revenue | ¥646.3bn | ¥608.2bn | Beat |
| ¥41.7bn | ¥37.9bn | Beat |
Source: Company data, Factset
SEMCO - 1Q26 results were strong, with revenue +17% YoY (+3% vs. consensus) and operating profit +40% YoY (+75% YoY excluding a one-off severance expense), beating an already elevated consensus. Component (MLCC) revenue rose +16% YoY (+7% QoQ) to W1,408bn, reflecting strong AI server demand and broader recovery in auto and industrial. Shipments increased across all applications, especially in value-added products for auto, AI servers, and high-speed networking, driving lower inventory days and higher blended ASP QoQ. Management confirmed sustainable growth acceleration as AI penetration continues, with capacity utilization expected to be full from 2H26. We estimate AI MLCC contributed ~15% of MLCC sales in 1Q26, rising to ~20% for CY2026, with AI MLCC margins in the mid-/high 20s (%) and expected to improve to the low/mid-30% range as yield ramps. ( Samsung Electro-Mechanics: 1Q26 Earnings - AI Growth Accelerates [30 Apr 2026] ).
Yageo - 1Q26 revenue came in at NT$38,166mn (+6.1% QoQ, +22.7% YoY), beating management's guidance of a "slight increase q/q," driven by continued AI-related demand momentum and growth across both standard and specialty products. Gross margin expanded to 38.1% (+80bps QoQ, +250bps YoY), above MS forecast of 38.0% and Street consensus of 37.7%, attributable to better AI demand, higher utilization rates, and the initial flow-through of MLCC price hikes. Yageo adjusted pricing for select MLCC SKUs, primarily in the consumer and automotive end segments, to reflect the "right" cost structure. Management indicated the impact of price hikes has not yet been fully reflected in financials, suggesting more pronounced margin benefit is yet to come. On utilization, 1Q UTRs were 70-72% for commodity products and 80-82% for premium products. For 2Q, management guided UTRs to increase to ~75% for standard and ~85% for specialty products. The order backlog is at a record high, supporting the guidance. For 2Q, management guided revenue "up moderately" QoQ (slightly better than MS preview of "up slightly"), with GM/OpM "up slightly" QoQ. No major new capacity expansion is planned for CY26; management is discussing options but has not committed. ( Yageo Corp.: MLCC Price Hike Confirmed [15 Apr 2026] ).
Murata -Murata reported F3/26 full-year OP of ¥281.8bn, above both the company forecast of ¥270.0bn and FactSet consensus of ¥275.2bn. The 4Q MLCC BB ratio surged to 1.36, up sharply from 1.12 in 3Q, reflecting significant growth in orders related to AI and data centers. MLCC capacity utilization approached 95% in 4Q (vs. 85-90% in 1Q and 9095% in 2Q-3Q). AI and data center-related MLCCs accounted for ~10% of all MLCC sales in
M
F3/26, and Murata indicated that it expects these sales to roughly double in each of the next few years. President Nakajima stated that demand for AI/DC-use cutting-edge MLCC products is expected to remain significantly above expectations for at least 3 years. Customer demand for Murata's cutting-edge MLCCs featuring small size, high capacitance, stable effective capacitance under DC, and stable performance at high frequencies far exceeds Murata's own expectations. ( Murata Manufacturing: F3/26 4Q Results: Continued Growth in AI/DC Related Earnings [30 Apr 2026] ).
Taiyo Yuden F3/26 full-year OP came in at ¥20.0bn (vs. MS forecast ¥22.5bn, company plan ¥21.0bn, FS consensus ¥21.6bn), ¥9.5bn higher YoY. 4Q OP of ¥3.5bn was down ¥4.0bn QoQ. The MLCC BB ratio surged to 1.31 in 4Q (up sharply from 1.08 in 3Q), while the line utilization rate came in at just under 85%, slightly below the company plan of 85%, attributed to production issues at some sites (since resolved). The company targets a rise to ~90% in May and ~95% from 2Q F3/27. MLCCs accounted for 71% of Taiyo Yuden's sales in F3/26, where it ranks #3 in global market share. AI/DC-related MLCCs accounted for 5-10% of MLCC sales in F3/26, and MS expects an 82-83% YoY increase in F3/27, raising the weighting to ~15% of MLCC sales. However, the company only increased MLCC output capacity by ~5% in F3/26 amid a capex freeze, which may limit its ability to fully capitalize on buoyant AI/DC MLCC demand relative to market leader Murata. ( Taiyo Yuden: F3/26 4Q Results: Expect Share Price to Fall in Short Run [8 May 2026] ).
TDK Full-year Passive Components net sales were ¥593.2bn (+6% YoY), with OP of ¥41.8bn (+22.8% YoY). For ceramic capacitors (MLCCs), sales for the automotive market and industrial equipment increased, leading to higher sales, but profit was pressured by lower average selling prices. In 4Q specifically, ceramic capacitor sales for the automotive market decreased, but sales for industrial equipment for AI data centers and others increased, resulting in higher sales while profit remained virtually flat. TDK announced a JV with Nippon Chemical Industrial (April 2) to accelerate development of materials for low-voltage, high-capacity MLCCs used in data centers, and plans to increase sales of passive components for AI data centers by approximately tenfold. We forecast F3/27 Passive Components OP of ¥54.0bn (+¥12.2bn YoY), with growth in sales of core products including MLCCs, aluminum electrolytic capacitors, and inductors for both automotive and AI/DC applications. ( TDK: F3/26 4Q Results: Positive on Aggressive Growth Investments [28 Apr 2026] )
Stock Implications
Staying constructive. The MLCC group has significantly outperformed MSCI Asia tech YTD (MLCC up 434% vs. Asia Tech +101% on average) on rising expectations of AI-driven content gains. With inventories returning to healthy levels and UTRs trending higher, we remain constructive on the segment. A potential catalyst would be the acceleration of edge AI growth contributing to MLCC shipment volumes. We stay constructive on AIgrade MLCC exposure, but the call is now about earnings revisions and scarcity value rather than simply buying a cheap cyclical recovery. We prefer SEMCO for the cleanest AI MLCC + ABF substrate earnings revision story and margin catch-up, and Yageo for pricing/ mix improvement, China demand recovery, and business transformation. Murata remains the technology leader in high-end MLCCs, but Japan's greater auto/industrial exposure and the recent share-price move make near-term risk/reward more selective. The key catalysts are further contract price increases, higher book-to-bill, utilization moving toward full
M
capacity, and confirmation of Rubin/VR200 MLCC content.
Exhibit 23: MLCC group now trading at 9.6x NTM P/B vs. historical average of 1.7x
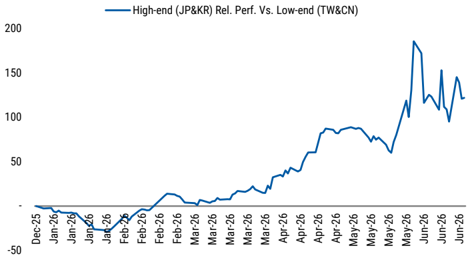
Exhibit 24: MLCC High-end (Japan/Korea) vs. Low-end (Taiwan/ China) relative performance
Source: Factset, Morgan Stanley Research
Exhibit 25: SEMCO outperforming MLCC peers YTD
Source: Factset, Morgan Stanley Research
Source: Factset, Morgan Stanley Research
Exhibit 26: Earnings revision breadth has bounced back since Oct-25
Source: Factset, Morgan Stanley Research
M
Raising SEMCO Earnings and PT
Investment thesis - MLCC three key drivers
The company aligns its MLCC roadmap with key AI hardware bottlenecks. As MLCC selection increasingly ties to system-level roadmaps for GPUs, power architectures, and network fabrics, SEMCO positions its product portfolio across computing, power, and networking. Management focuses on three core areas to support next-generation AI data centers: (1) high-density computing boards, (2) high-power delivery, and (3) ultra-fast networking. The strategy emphasizes ultra-high capacitance, miniaturization, higher voltage ratings, and improved thermal performance to meet AI server requirements:
- Computing - MLCCs for GPU/CPU boards handling massive currents at very low voltages.
- Power - MLCCs for new 48V and 800V power architectures and vertical power delivery.
- Network - MLCCs for high -speed switches and co -packaged optics in 800G-1.6T systems.
1) AI computing. SEMCO targets MLCC solutions for GPUs and CPUs requiring hundreds to thousands of amperes at ~0.8V core voltage. It positions MLCCs as co-designed components within package boards, rather than standard PCB cost items. AI accelerators require significantly more decoupling capacitors while offering limited PCB area near the package. Key revenue drivers include: (1) ultra-high capacitance in small case sizes (≥47µF in 0402, ≥100µF in 0603) for close-in decoupling; (2) embedded MLCCs integrated into substrates or packages to reduce parasitic inductance and utilize PCB back-side surfaces; and (3) power integrity support across a wide frequency range to handle rapid load changes.
2) Power delivery. Efficiency and reliability are increasingly critical as systems shift from legacy 12V/48V to 800V architectures and AI rack power approaches ~120kW. SEMCO's MLCC portfolio supports: (1) higher system voltages; (2) vertical power delivery, shortening paths from VRMs to GPUs and improving power density; and (3) thermal and reliability requirements.
3) Networking. SEMCO aligns MLCC development with high-speed networking and optical integration roadmaps. As AI clusters transition to 800G and 1.6T links with copackaged optics, network systems face high power density and strict signal integrity requirements. SEMCO provides stable capacitance and low loss under elevated temperatures, supporting power rails for CPO modules and dense networking environments.
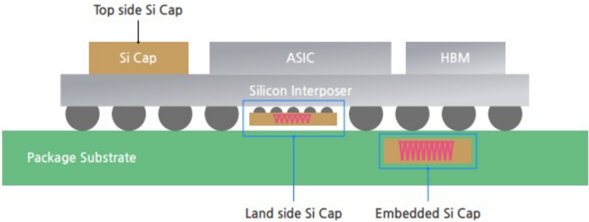
Silicon capacitors - a new growth engine
SEMCO is now positioning its silicon capacitors as a major growth pillar , leveraging DRAM-derived capacitor structures on 300mm wafers to deliver ultra-thin, low-parasitic devices optimized for AI semiconductors and advanced packaging. The company adopts a fabless model, outsourcing wafer production to mature-node foundries and packaging to
Idea
Top side Si Cap
M
Package Substrate
Clostra Manhanina
OSAT partners, while focusing on design, quality, and integration with its MLCC and FCBGA substrate portfolio - a differentiated combination among peers.
The announced W1.5trn (~US$1bn) silicon capacitor supply agreement with a global technology customer for 2027-28 reinforces silicon capacitors as a meaningful new growth driver within its broader AI component strategy.
Exhibit 27: Silicon capacitor mounting locations determined by package type and thickness
Source: Samsung Electro-Mechanics
What's next?
SEMCO is likely to be a leader in next generation glass substrate - a cutting-edge solution that enhances the durability and performance of semiconductor substrates. SEMCO has established a pilot production line and is actively supplying glass substrate samples to major tech players, including Apple and custom AI chip designer Broadcom (Trendforce). The company has also established a joint venture with Japan's Sumitomo Chemical Group to speed up the production and supply of glass cores - a critical component of semiconductor glass substrates. Key features of this next-generation substrate technology are:
- Form factor : Glass provides a smooth surface, ensuring much more stable data communication required by high-performance AI chips.
- Thermal stability : Glass maintains its structural integrity even at high temperatures without warping with a lower coefficient of thermal expansion and higher rigidity compared to traditional materials.
- Optimized signal quality : Its superior dielectric properties and low signal loss allow for more accurate transmission of ultra-high-speed signals.
- Scalability for large areas : As high-performance packages grow larger, glass remains resistant to deformation even when manufactured in large panels.
Raising estimates and PT
We have significantly raised our SEMCO near-term and long-term estimates, reflecting the latest MLCC industry trends and long-term new business opportunities:
- For 2026-28, we have assumed a 30% price hike in 2H26 and a 40-50% price hike in 2027 for IT MLCC as SEMCO could increase the margin for IT applications in anticipation of potential opportunity costs of shifting capacity to AI-related
Land side Si Cap
M
applications. We increase our IT MLCC margin to 25-35% (from 20% previously), approaching the 2018 cycle peak of 36%.
- For AI MLCC, we increase the revenue mix from 18% in 2026 to over 50% by 2030, driven by SEMCO's capacity shift and higher ASPs for AI MLCCs. We increase AI MLCC margins from 34% in 2026 to 44% in 2027, reflecting yield improvements and potential price hikes.
- We add silicon capacitors (news) as a new revenue contributor from 2027 onward and assume a 20% OPM, in line with company guidance.
- We add potential revenue from glass substrates from 2029 onward, assuming 5k m²/month capacity in 2029 ramping to 30k m²/month in 2030, with pricing and margin premiums to the ABF business.
- We increase the long-term dividend payout ratio from 5% to 20%, anticipating stronger free cash flow will support improved shareholder returns.
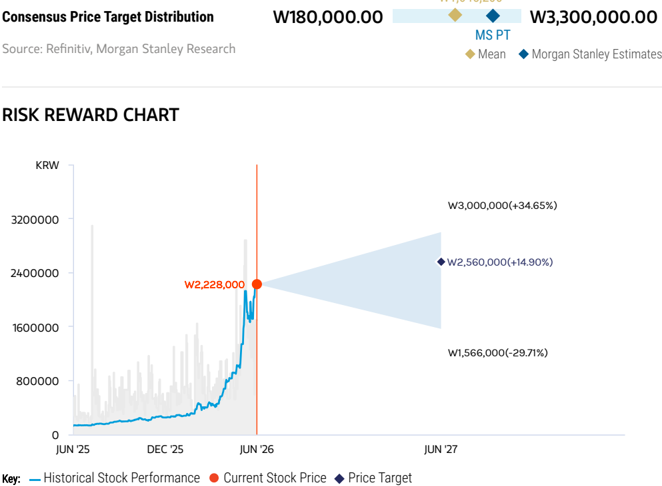
As a result, we raise 26-28e EPS by 20%, 71%, and 84%, respectively. Our residual income model implies a target price of W2,560,000, corresponding to 27-29e P/E of 37x, 26x, and 19x. We also lift our bull and bear scenario values to W3,000,000 and W1,566,000, respectively, to reflect stronger earnings momentum and higher multiples.
Exhibit 28: Earnings revisions
| FY26E | FY26E | FY26E | FY27E | FY27E | FY27E | FY28E | FY28E | FY28E | |
|---|---|---|---|---|---|---|---|---|---|
| (W bn) | Previous | Revised | Change | Previous | Revised | Change | Previous | Revised | Change |
| Sales | 13,817 | 14,772 | 7% | 17,977 | 22,770 | 27% | 22,773 | 31,533 | 38% |
| Optics | 4,009 | 4,009 | 0% | 4,113 | 4,113 | 0% | 4,039 | 4,039 | 0% |
| Substrate | 2,976 | 2,976 | 0% | 3,962 | 3,962 | 0% | 5,838 | 5,838 | 0% |
| Components (MLCC) | 6,832 | 7,787 | 14% | 9,902 | 14,695 | 48% | 12,897 | 21,657 | 68% |
| Operating Profit | 1,911 | 2,317 | 21% | 3,208 | 5,586 | 74% | 4,397 | 8,162 | 86% |
| Optics | 191 | 191 | 0% | 192 | 192 | 0% | 219 | 219 | 0% |
| Substrate | 478 | 478 | 0% | 854 | 854 | 0% | 1,366 | 1,430 | 5% |
| Components (MLCC) | 1,242 | 1,648 | 33% | 2,162 | 4,540 | 110% | 2,812 | 6,514 | 132% |
| OP Margin | 13.8% | 15.7% | 1.9pp | 17.8% | 24.5% | 6.7pp | 19.3% | 25.9% | 6.6pp |
| Optics | 4.8% | 4.8% | 0.0pp | 4.7% | 4.7% | 0.0pp | 5.4% | 5.4% | 0.0pp |
| Substrate | 16.1% | 16.1% | 0.0pp | 21.6% | 21.6% | 0.0pp | 23.4% | 24.5% | 1.1pp |
| Components (MLCC) | 18.2% | 21.2% | 3.0pp | 21.8% | 30.9% | 9.1pp | 21.8% | 30.1% | 8.3pp |
| Net Profit | 1,547 | 1,863 | 20% | 2,568 | 4,389 | 71% | 3,459 | 6,349 | 84% |
| EPS for consensus | 19,549 | 23,555 | 20% | 32,464 | 55,477 | 71% | 42,692 | 78,356 | 84% |
Source: Company data, Morgan Stanley Research estimates
Exhibit 29: Residual income
| RIM | FY26A | FY27E | FY28E | FY29E | FY30E | FY31E | FY32E | FY33E | FY34E | FY35E | FY36E | Terminal |
|---|---|---|---|---|---|---|---|---|---|---|---|---|
| Fiscal period Forecast year Total Shareholder Equity | 0 - | 1 15,332 | 2 21,425 | 3 28,134 | 4 37,348 | 5 48,022 | 6 60,579 | 7 75,972 | 8 93,445 | 9 112,248 | 10 133,191 | value 139,851 |
| Residual Income | 3,622 | 4,511 | 5,825 | 7,933 | 8,897 | 10,240 | 12,458 | 13,867 | 14,600 | 16,273 | 15,353 | |
| Core Net Profit | 4,389 | 6,348 | 8,303 | 11,207 | 13,165 | 15,670 | 19,285 | 22,338 | 24,885 | 28,545 | 29,972 | |
| ROE | 35% | 34% | 24% | 23% | 22% | |||||||
| 57% | 34% | 31% | 29% | 28% | 26% | |||||||
| Discount period | 0.00 | 1.00 | 2.00 | 3.00 | 4.00 | 5.00 | 6.00 | 7.00 | 8.00 | 9.00 | 10.00 | |
| Discount factor | 1.00 | 0.91 | 0.83 | 0.75 | 0.68 | 0.62 | 0.56 | 0.51 | 0.47 | 0.42 | 0.39 | 0.39 |
| PV of Equity Capital | 0.0 | 3,293 | 3,728 | 4,376 | 5,418 | 5,524 | 5,780 | 6,393 | 6,469 | 6,192 | 6,274 | 5,919 |
| Beginning Equity Capital PV of Equity Capital | 9,471 59,366 | |||||||||||
| PV of Continuing Value | 124,300 | |||||||||||
| Total Equity Value | 193,138 | |||||||||||
| FD shares outstanding ('000) | 75,547 | |||||||||||
| Per share value | 2,560,000 |
Source: Company data, Morgan Stanley Research estimates
M
Exhibit 30: Financial summary
| Income Statement (W bn) | FY24A | FY25A | FY26E | FY27E | FY28E | Cash Flow Statement (W bn) | FY24A | FY25A | FY26E | FY27E | FY28E |
|---|---|---|---|---|---|---|---|---|---|---|---|
| Revenue | 10,294 | 11,314 | 14,772 | 22,770 | 31,533 | Net Income (Loss) | 703 | 726 | 1,863 | 4,389 | 6,348 |
| Gross Profit | 1,959 | 2,277 | 4,490 | 11,173 | 16,325 | Add: Depreciation& Amortization | 840 | 912 | 1,282 | 1,404 | 1,667 |
| SG&A | -1,224 | -1,364 | -2,245 | -5,586 | -8,162 | Less: Changes in Working Capital | 319 | 2,094 | (986) | (2,058) | (1,241) |
| EBITDA | 1,575 | 1,825 | 3,599 | 6,990 | 9,830 | Less: Net tax expense | (601) | (201) | (532) | (1,386) | (2,005) |
| Operating profit/loss | 735 | 913 | 2,317 | 5,586 | 8,162 | Less: Net interest expense | 383 | 84 | (71) | (75) | (78) |
| Financial Income | -1 | 12 | 150 | 188 | 191 | Cash flows from operating activities | 1,430 | 3,360 | 1,557 | 2,273 | 4,692 |
| Pretax profit | 797 | 896 | 2,395 | 5,774 | 8,353 | ||||||
| Net Profit | 703 | 726 | 1,863 | 4,389 | 6,348 | Acquisition of PP&E | (772) | (1,022) | (2,101) | (2,237) | (3,273) |
| Other Operating cashflows | (215) | (254) | 0 | 0 | 0 | ||||||
| Margins | Cash flows from Investing activities | (806) | (1,032) | (2,101) | (2,237) | (3,273) | |||||
| Gross Margin | 19.0% | 20.1% | 30.4% | 49.1% | 51.8% | ||||||
| EBITDA Margin | 15.3% | 16.1% | 24.4% | 30.7% | 31.2% | Changes in LT Borrowings | 8 | 0 | 0 | 0 | 0 |
| Operating Margin | 7.1% | 8.1% | 15.7% | 24.5% | 25.9% | Changes in Short term Borrowing | 152 | 555 | 0 | 0 | 0 |
| Net Income | 6.8% | 6.4% | 12.6% | 19.3% | 20.1% | Dividend Payout | 0 | 0 | 0 | 0 | 0 |
| Other Investing Cashflows | (381) | (199) | 0 | 0 | 0 | ||||||
| Growth Rates | 54.1% | 38.5% | Cash flows from Financing activities | (309) | 41 | (178) | (213) | (256) | |||
| Sales EBITDA | 9.9% 15.8% | 30.6% 97.2% | 94.2% | 40.6% | Cash and cash equivalents - closing | 2,013 | 4,377 | 3,655 | 3,479 | 4,642 | |
| Operating Income | 24.3% | 153.6% | 141.2% | 46.1% | Increase(decrease) in cash& cash equivalents | 315 | 2,369 | (722) | (177) | 1,163 | |
| Net Income | 3.3% | 156.5% | 135.5% | 44.7% | FX impact | 29 | (5) | 0 | 0 | 0 | |
| Balance Sheet | Ratio Analysis | ||||||||||
| (W bn) | FY24A | FY25A | FY26E | FY27E | FY28E | (W bn) | FY24A | FY25A | FY26E | FY27E | FY28E |
| Cash& Cash Equivalents | 2,013 | 4,377 | 3,655 | 3,479 | 4,642 | ROE (AOY) | 8.0% | 7.5% | 17.3% | 31.6% | 32.2% |
| Trade and other receivables | 1,492 | 1,577 | 2,392 | 3,950 | 5,239 | ROE (EOY) | 7.5% | 7.3% | 16.0% | 27.3% | 27.6% |
| Inventory | 2,251 | 2,171 | 2,773 | 4,038 | 5,116 | ROA | 5.6% | 4.9% | 10.9% | 21.2% | 23.0% |
| Other current assets | 136 | 141 | 141 | 141 | 141 | ROIC (AOY) | 5.6% | 6.4% | 13.7% | 24.9% | 27.5% |
| Current Assets | 5,892 | 8,265 | 8,961 | 11,607 | 15,137 | ||||||
| Asset Turnover | 106.9 | 164.2 | 146.9 | 121.7 | 106.2 | ||||||
| Tangible Assets | 5,933 | 5,936 | 6,735 | 7,549 | 9,117 | Days sales outstanding | 0.0 | 0.0 | 0.0 | 0.0 | 0.0 |
| Intangible Assets | 146 | 144 | 164 | 184 | 222 | Days inventory outstanding | 53.0 | 50.9 | 59.1 | 63.3 | 60.8 |
| Other non-current assets | 435 | 370 | 370 | 370 | 370 | Days payable outstanding | 86.2 | 76.2 | 80.8 | 85.8 | 80.1 |
| Total Assets | 12,792 | 15,307 | 17,353 | 22,218 | 29,359 | ||||||
| Current Ratio | 1.9 | 1.7 | 1.7 | 1.9 | 2.1 | ||||||
| Trade and other payables | 1,212 | 2,749 | 3,181 | 3,946 | 5,072 | Debt to Equity | 41.9% | 61.6% | 55.5% | 44.9% | 37.0% |
| Short term Borrowings | 1,580 | 1,931 | 1,860 | 1,784 | 1,706 | Net Debt to Equity | 12.7% | -4.3% | 1.6% | 1.3% | -5.2% |
| Other current liabilities | 53 | 82 | 82 | 82 | 82 | ||||||
| Current Liabilities | 3,057 | 4,981 | 5,340 | 6,031 | 7,079 | EPS (MW) | 8,990 | 9,196 | 23,555 | 55,477 | 78,349 |
| Borrowings | 0 | 56 | 56 | 56 | 56 | BVPS (MW) | 116,340 | 122,021 | 143,226 | 195,883 | 270,848 |
| Long-term other payables | 84 | 127 | 127 | 127 | 127 | DPS | 1,800 | 2,350 | 2,350 | 2,820 | 3,384 |
| Other Nont-current liabilities | 634 | 656 | 656 | 656 | 656 | EBITDA | (132) | (164) | (532) | (1,386) | (2,005) |
| Total Liabilities | 3,777 | 5,836 | 6,196 | 6,886 | 7,934 | P/E | 17 | 26 | 18 | 8 | 5 |
| P/BV | 1.3 | 2.0 | 2.9 | 2.1 | 1.5 | ||||||
| Capital Stock | 388 | 388 | 388 | 388 | 388 | EV/EBITDA | (96) | (109) | (60) | (23) | (15) |
| 18,115 | EV/Sales | 1.2 | 1.6 | 1.4 | 1.0 | ||||||
| Retained Earnings Total Shareholders' Equity | 6,490 9,016 | 6,871 9,471 | 8,473 11,157 | 12,452 15,332 | 21,425 | Dividend Yield (%) | 1 | 1 | 2.1 1 | 1 | 1 |
| Total Liabilities &SE | Price (KRW) | 153,200 | 417,000 | ||||||||
| Net Debt | 1,147 | (403) | 202 | (1,117) | Shares Outstanding (000 | 75,547 | 75,547 | ||||
| 12,792 | 15,307 | 17,353 | 22,218 | 29,359 | FCF Share | 690 | 2,525 241,000 | (91) 417,000 | 1,234 | 3,233 417,000 | |
| 176 | AOY) | 75,547 | 75,547 | 75,547 |
Source: Company data, Morgan Stanley Research estimates
M
M
Risk Reward - Samsung Electro-Mechanics (009150.KS) Risk Reward - Samsung Electro-Mechanics (009150.KS)
Dual AI opportunity - ABF and MLCC
W2,560,000 PRICE TARGET
Base case, residual income valuation model. We apply a 10% cost of equity (beta 1.0, equity risk premium of 6.5%, and risk-free rate of 3.5%) and a 5% terminal growth rate. Our base year is 2026 and our forecast period is 2026-36.
W1,645,200
Source: Refinitiv, Morgan Stanley Research
BULL CASE
38x 2028E P/E
ABF opportunities from major US CSPs drive meaningful content growth, and we estimate future ASIC content and volume growth will continue to outpace. Customer diversification into non-mobile companies also lowers earnings volatility and improves profitability. Our bull case implies a 2028e P/E at current peak of 38x. We believe this premium is supported by what we view as an unprecedented supercycle in the underlying industry dynamics.
W3,000,000
BASE CASE
37x 2027e P/E
We see a number of catalysts ahead for SEMCO, including a large ABF opportunity in ASIC chip wins, accelerating MLCC growth and FCF inflection. Although the stock has moved higher, our long-term conviction in custom silicon opportunities via ABF substrates has grown substantially.
W2,560,000
OVERWEIGHT THESIS
- We see long-term improvement in SEMCO's operating profile - multi-layer core ABF capacity sold out from ASIC customers and accelerating AI penetration in MLCC, driving substantial content from rising complexity.
- With the AI computing opportunity and the prospect of a cyclical recovery from 2H26, earnings expectations appear to be lagging significantly based on the current outlook.
- We think the share price will look to discount accelerating EPS estimate revisions.
- NTM P/B is below its mid-cycle average, indicating continued valuation upside on top of earnings.
- Our price target implies 2027e P/B of 10x.
Risk Reward Themes
Secular Growth:
Positive
View descriptions of Risk Rewards Themes here
BEAR CASE
20x 2028e P/B
We reflect slower content growth for MLCC and substrates amid competition and China localization. But AI exposure will structurally increase SEMCO's MLCC and ABF ASP, product mix, and margin with commodity suppliers not easy to penetrate.
W1,566,000
M
Risk Reward - Samsung Electro-Mechanics (009150.KS)
KEY EARNINGS INPUTS
| Drivers | Dec 2025 | Dec 2026e | Dec 2027e | Dec 2028e |
|---|---|---|---|---|
| Revenue Growth (%) | 9.9 | 30.6 | 54.1 | 38.5 |
| OPM (%) | 8.1 | 15.7 | 24.5 | 25.9 |
| CAPEX (%) | 8.7 | 14.2 | 9.8 | 10.4 |
INVESTMENT DRIVERS
- AI servers, high-speed networking, Auto 2.0, and smartphone content growth
- Customer diversification away from Samsung Electronics, targeting major CSPs
- MLCC pricing/margin trend
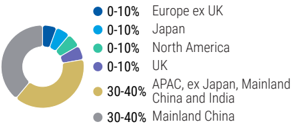
GLOBAL REVENUE EXPOSURE
Source: Morgan Stanley Research Estimate View explanation of regional hierarchies here
MS ALPHA MODELS
4/5 MOST
3 Month Horizon
Source: Refinitiv, FactSet, Morgan Stanley Research; 1 is the highest favored Quintile and 5 is the least favored Quintile
RISKS TO PT/RATING
RISKS TO UPSIDE
- Price hikes driven by MLCC shortage
- Better-than-expected smartphone demand
- Higher MLCC margin from better yield and product mix
- Strong tailwind from China's consumptionfriendly policies
RISKS TO DOWNSIDE
- Significant pullback in Samsung's mobile flagship product cycle and SEMCO's lower market share
- Execution risk in penetrating Chinese smartphone customers
- Consumer demand headwinds in 2026
OWNERSHIP POSITIONING
Inst. Owners, % Active
79%
Source: Refinitiv, Morgan Stanley Research
MS ESTIMATES VS. CONSENSUS
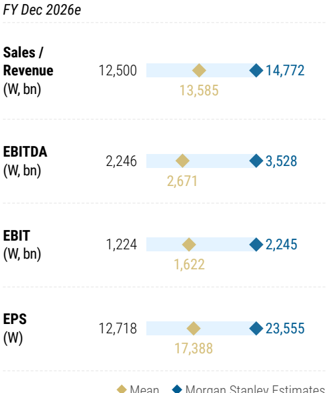
Source: Refinitiv, Morgan Stanley Research
M
M
Valuation Methodology and Risks
Yageo Corp. (2327.TW)
Base case, multistage residual income valuation model. Key assumptions: cost of equity 7.8% (risk-free rate 1%, equity risk premium 6.8% and beta of 1.1), medium-term growth rate 16%, terminal growth rate 3%.
Risks to Upside
- n Faster-than-expected revenue/profit recognition from stronger AI server/notebook demand
- n Further price hikes led by stronger pricing power arising from better demand and/or tighter supply
Risks to Downside
- n A sudden bursting of demand for AI
- n Inventory risk
- n Consumer electronics demand risk
Taiyo Yuden (6976.T)
Derived from the base case. DCF assumptions: 2.6% risk-free rate, 1.35 equity beta, 3.2% risk premium, for 6.5% WACC; zero growth from F3/36.
Risks to Upside
- n Increase in premium MLCC sales for AI/DC use.
- n Power inductor sales for 5G handsets and others grow steeper than expected.
Risks to Downside
- n We estimate a ¥1/US$ move affects annual OP by ~¥0.9bn. Changes in the ¥/€ have limited effect.
- n Since MLCCs are fitted in various electronic devices, demand depends to some extent on the rate of global economic growth, and prices can swing widely depending on S/D balances.
Murata Manufacturing (6981.T)
Derived from our base case and a DCF model, with the following assumptions: 2.6% risk-free rate, 1.09 equity beta, 3.2% risk premium, yielding 6.1% WACC; zero growth from F3/36.
Risks to Upside
MetroCirc, MLCCs, and RF devices sales could outstrip our forecasts if high-end smartphone demand is stronger than we envision.
Risks to Downside
- n Since Murata's core products are in all sorts of electronic devices, demand and unit prices could fluctuate widely due to changes in the global economy.
- n If demand for high-end smartphones is weaker than we envision.
M
- n We estimate a ¥1/$ change impacts OP by ¥4.5bn.
M
Risk Reward Reference links
- View explanation of Options Probabilities methodology -Options_Probabilities_Exhibit_Link.pdf
- View descriptions of Risk Rewards Themes - RR_Themes_Exhibit_Link.pdf
-
View explanation of regional hierarchies - GEG_Exhibit_Link.pdf
-
View explanation of Theme/Exposure methodology -
-
ESG_Sustainable_Solutions_External_Link.pdf
- View explanation of HERS methodology - ESG_HERS_External_Link.pdf
M
Disclosure Section
The information and opinions in Morgan Stanley Research were prepared or are disseminated by Morgan Stanley Asia Limited (which accepts the responsibility for its contents) and/or Morgan Stanley Asia (Singapore) Pte. (Registration number 199206298Z) and/or Morgan Stanley Asia (Singapore) Securities Pte Ltd (Registration number 200008434H), regulated by the Monetary Authority of Singapore (which accepts legal responsibility for its contents and should be contacted with respect to any matters arising from, or in connection with, Morgan Stanley Research), and/or Morgan Stanley Taiwan Limited and/or Morgan Stanley & Co International plc, Seoul Branch, and/or Morgan Stanley Australia Limited (A.B.N. 67 003 734 576, holder of Australian financial services license No. 233742, which accepts responsibility for its contents), and/or Morgan Stanley Wealth Management Australia Pty Ltd (A.B.N. 19 009 145 555, holder of Australian financial services license No. 240813, which accepts responsibility for its contents), and/or Morgan Stanley India Company Private Limited having Corporate Identification No (CIN) U22990MH1998PTC115305, regulated by the Securities and Exchange Board of India ('SEBI') and holder of licenses as a Research Analyst (SEBI Registration No. INH000001105); Stock Broker (SEBI Stock Broker Registration No. INZ000244438), Merchant Banker (SEBI Registration No. INM000011203), and depository participant with National Securities Depository Limited (SEBI Registration No. IN-DP-NSDL-567-2021) having registered office at Altimus, Level 39 & 40, Pandurang Budhkar Marg, Worli, Mumbai 400018, India; Telephone no. +91-22-61181000; Compliance Officer Details: Mr. Tejarshi Hardas, Tel. No.: +91-22-61181000 or Email: tejarshi.hardas@morganstanley.com; Grievance officer details: Mr. Tejarshi Hardas, Tel. No.: +91-22-61181000 or Email: msic-compliance@morganstanley.com which accepts the responsibility for its contents and should be contacted with respect to any matters arising from, or in connection with, Morgan Stanley Research, and their affiliates (collectively, "Morgan Stanley"). Morgan Stanley India Company Private Limited (MSICPL) may use AI tools in providing research services. All recommendations contained herein are made by the duly qualified research analysts.
For important disclosures, stock price charts and equity rating histories regarding companies that are the subject of this report, please see the Morgan Stanley Research Disclosure Website at www.morganstanley.com/eqr/disclosures/webapp/generalresearch, or contact your investment representative or Morgan Stanley Research at 1585 Broadway, (Attention: Research
Management), New York, NY, 10036 USA.
For valuation methodology and risks associated with any recommendation, rating or price target referenced in this research report, please contact the Client Support Team as follows: US/Canada +1 800 303-2495; Hong Kong +852 2848-5999; Latin America +1 718 754-5444 (U.S.); London +44 (0)20-7425-8169; Singapore +65 6834-6860; Sydney +61 (0)2-9770-1505; Tokyo +81 (0)3-6836-9000. Alternatively you may contact your investment representative or Morgan Stanley Research at 1585 Broadway, (Attention: Research Management), New York, NY 10036 USA.
圖片清單(已驗證 2026-07-02)
回補驗證:僅涵蓋已被 lib 頁嵌入的圖片,非全量驗證。
| 檔名 | size | 分類 | 親眼所見內容 |
|---|---|---|---|
260622_三星電機_ms_MLCC-super-cycle_012.png |
43KB | 真資料圖 | 標題「Nvidia's Rubin System Uses More High-Cap MLCCs」堆疊長條圖,X軸GB300/VR200,Low-cap(藍)/High-cap(米)佔比,GB300為82%/18%、VR200為69%/31% |
260622_三星電機_ms_MLCC-super-cycle_015.png |
29KB | 真資料圖 | 長條圖,X軸2022-2027年,各年數值標示3/20/96/206/338/893(深藍長條逐年遞增,無座標軸標籤) |
260622_三星電機_ms_MLCC-super-cycle_016.png |
48KB | 真資料圖 | 圓餅圖,市佔率分佈:Murata 40.8%、SEMCO 22.5%、Taiyo Yuden 11.3%、TDK 6.9%、Yageo 5.4%、Other 13.0% |