PDF 原檔:報告_UBS_AI電力產業_20260914_original.pdf
圖片清單(已驗證 2026-09-16)
| 檔名 | size | 分類 | 親眼所見內容 |
|---|---|---|---|
報告_UBS_AI電力產業_20260914_002.png |
332KB | 真資料圖 | Exhibit「Four stages of grid-to-chip power architecture」全圖:四列分別為 1 Direct Power Supply/2 Power Shelf/3 Power Rack(800 VDC)/4 SST or Facility Rectifier,左為 GREY SPACE 設施電力(GRID 13.8–34.5kV AC → SWITCHGEAR → TRANSFORMER 480/415VAC),中為 POWER EQUIPMENT/POWER RACKS,右為 IT RACKS 交付鏈(BUSBAR 48/54VDC 或 800VDC → IBC/VRM → XPU+HBM) |
報告_UBS_AI電力產業_20260914_015.png |
299KB | 真資料圖 | 同一張四階段架構圖的無標題版本(內容與 002 相同,002 多了標題列) |
本報告共抽出 48 張圖,上表為本次 ingest 實際開圖驗證者;其餘未逐張驗證,不得直接嵌入 lib/。
原始內容
Asia Hardware Insights
APAC Focus: AI Power-From watts to gigawatts
AI power is emerging as the next constraint on compute-grid availability and hyperscale cash flows could moderate growth later this decade, even as rising power density creates a larger power-electronics content opportunity than chip and rack counts imply. Our bottom-up model estimates a 69% CAGR to US$91.1bn AI server power TAM from 2025-2030, front-end loaded with rising content/watt sustaining growth. Our bottom-up rack and power model converts UBS accelerator forecasts into racks, IT GW and architecture-specific BOMs across major GPU and customer ASIC platforms. The shift from integrated power supply units (PSUs) toward dedicated power racks, 400/800V distribution and ultimately solid-state transformers (SST) expands content per watt and creates opportunities across power supply, energy storage, MLCCs and power semis.
Strong growth in 2027E precedes the 400/800V transition
While the market has focused on slower migration to 800VDC, our bottom-up rack and power model points to growth in deployed compute GW and architectural upgrades at the chip, rack and grid level driving content gains before widespread high-voltage adoption. We see a strong 2027 driven by +65% YoY accelerator die growth, Rubin's ~60% higher rack power and AMD's move to rack-scale systems. 400V/800V becomes a larger driver in 2028-29 as rising power density outgrows low-voltage distribution.
Grid constraints moderate 2028-30E; rising content/watt sustains power TAM
We project +12% CAGR in AI rack units and +39% CAGR in TDP (thermal design power) per rack, driving +55% CAGR in IT capacity deployed. We taper 2028-30 growth for potential grid, capex and cash-flow constraints, anchoring our TAM to deployable IT GW, slowing growth to 44%/37%/20% in 2028-30. Against that moderation, power system content rises at a +9% CAGR from US$0.57 to US$0.87/W, lifting our AI power TAM to US$91bn by 2030. Dedicated 660kW-1.2MW power racks add PSU density, DC-DC distribution, energy storage, busbars, protection, and controls.
Rising deployed GW & richer content support the chain even as constraints rise
We expect growth in GW compute plus architecture upgrades to lift content across the power chain. We see Buy-rated Delta and Lite-On as the two direct beneficiaries: Delta's broad grid-to-chip porfolio helps sustain its ~40% share of a rising TAM while Lite-On is expanding customer qualifications and ramping ASIC platforms. Rising AI power also supports strong pricing/tight supply for MLCCs (Murata/TDK/Semco) and near rack and pooled energy storage (Panasonic/Samsung SDI). In power semis, we prefer Buy-rated TI, ADI and STM, where power offers upside potential, over Infineon (Neutral).
Equities
Global
Technology
Randy Abrams
Analyst randy.abrams@ubs.com +886-2-8722 7338
Nicolas Gaudois
Analyst nicolas.gaudois@ubs.com +65-6495 5148
Timothy Arcuri
Analyst timothy.arcuri@ubs.com +1-415-352 5676
Francois-Xavier Bouvignies
Analyst francois.bouvignies@ubs.com +44-20-7568 7105
Tim Bush
Analyst tim-d.bush@ubs.com +82-2-3702 8801
Kenji Yasui
Analyst kenji.yasui@ubs.com +81-3-5208 6211
Gregg Orrill
Analyst gregg.orrill@ubs.com
+1-212-713 1064
Shneur Z. Gershuni, CFA
Analyst shneur.gershuni@ubs.com
+1-212-713 3974
Andre Kukhnin
Analyst andre.kukhnin@ubs.com +44-20-7567 2162
Amit Mehrotra
amit.mehrotra@ubs.com
Analyst +1-201-352 1410
Shingo Hirata, CFA
Analyst shingo.hirata@ubs.com +81-3-5208 6224
Kunlun Li
Analyst
S1460520080002 kunlun.li@ubs.com +86-21-3866 8894
Executive summary
AI compute growth increasingly a power-density story
The rapid growth of AI compute is driving higher power density at every level of the system. Power per GPU accelerator increases from ~700W for NVIDIA's Hopper to 1.31.4kW for Blackwell and 2.3kW for Vera Rubin. More accelerators are also integrated into each chip, moving up from 1 die on Hopper to 2 dies with Blackwell and upcoming ASICs in late 2027 will push 4 per package. With scale-up bandwidth 18x faster than scale out and more optimal for dense training and inference clusters, rack compute density continues to rise, taking accelerator dies per rack from 32 on Hopper to 144 on Blackwell and future architectures could scale to 576+. Rack power consequently rises from ~40-50kW for Hopper to 140kW for GB300, 227kW for VR200 and 500-1,000kW + for Feynman and beyond. To support that power density, we see AI power upgrading from a relatively standardized PSU market into a critical grid-to-chip system spanning conversion, storage, distribution, protection, controls and cooling.
Deployable IT GW reflecting power constraints helps shape the outyear TAM
We introduce a bottom-up AI GPU and ASIC hardware rack and power TAM based on accelerator units by platform, accelerators per rack, rack configuration and TDP per rack, ultimately translating these assumptions into annual IT GW deployed. We taper 202830 growth for potential grid, permitting, capex and cash-flow constraints, anchoring the out-year TAM slowing to 44%/37%/20% in 2028-30 to deployable IT GW. Against that moderation, our bottom-up assumptions imply AI rack units grow only ~12% CAGR over 2025-30E, but average rack TDP rises 39%, lifting annual IT capacity deployed at a 55% CAGR to 104.5GW in 2030. Across NVIDIA, AMD and ASICs-most notably TPU and Trainium-we model roughly 340GW of incremental AI IT capacity over 2026-30, equivalent to approximately 380GW of associated data-center capacity at a 1.12 PUE.
Capacity plans require further work on grid and behind-the-meter power
UBS Evidence Lab tracks approximately 201GW of global data-center capacity under construction or planned, including ~126GW in the US. If the US represents 55-60% of incremental capacity, the gap requires improvement in permitting, grid interconnection, generation, construction and financing. UBS US Utilities identifies potential upside from higher plant completion rates, inclusion of early-stage projects not yet in the approval/ construction pipeline and fewer retirements than in its base case. Separately, UBS Americas Sustainability (link) estimates ~133GW of additional usable capacity from energy sources beyond traditional grid transmission in its base case, rising to ~156GW under a full-absorption scenario. These include batteries/peak shaving, gas generation, utility-scale solar, fuel cells and solar-plus-storage, providing potential pathways to support a meaningful portion of the incremental capacity required by our accelerator assumptions, subject to timing, permitting and execution.
We therefore taper deployment growth in 2028-30 as grid capacity, permitting, capex and cash-flow constraints increasingly factor into investment decisions and deployment timing. We view 2026-27 primarily as a volume and power-density phase, while deployability and power architecture become increasingly important determinants of growth from 2028 onward.
The power stack progressively moves outside the IT rack
Even with a more constrained GW deployment curve, the power-electronics opportunity can continue to expand because each deployed watt becomes more content-rich as rack density rises. The same physical constraints that ultimately limit deployment including current, copper, rack space, thermal loss and resilience also force the power architecture to evolve toward larger shared systems, higher distribution voltages and more efficient architectures.
Our industry feedback points to an upcoming power transition in four overlapping stages: 1) AC power distributes to the IT rack where server PSUs (power supply units) and power shelves convert it into 48/54VDC and further down to <1V to power
Four stages of grid-to-chip power architecture
AC/DC conversion moves upstream as higher-voltage distribution pushes DC/DC conversion closer to silicon
GREY SPACE • FACILITY ELECTRICAL
WHITE SPACE • DATA HALL
the accelerator. 2) Higher-density rack systems centralize PSUs, power shelves and energy storage (BBU (battery back-up units)/CBU (capacitor back-up units) at the rack level and increasingly move them into a separate power rack. 3) 800V or ±400V sidecars convert and distribute power at higher voltage before stepping it down close to the compute rack. 4) Greenfield facilities can centralize conversion at the row or facility level, ultimately using medium-voltage rectification or SST to deliver native 800VDC across the data hall. The migration path adds value increasing amount of power conversion, distribution, storage, and protection moving upstream, while the final DC/ DC conversion remains close to the accelerator. AC/DC POWER SHELF BUSBAR
CENTRALIZED
MEDIUM-
RACK-LEVELI
AC/DC
KV* AC
VOLTAGE
PROTECTION
480/415 VAC
480V AC +
50/54 V
The physical rationale is compelling. Delivering a 227kW rack at 54V requires more than 4,000A. Moving distribution to 800V reduces current by approximately 15x and theoretical resistive loss in the same conductor by more than 200x, reducing copper, losses and thermal stress. We estimate that more advanced grid-to-chip configurations could improve overall efficiency from roughly 82% to 87%, saving approximately 6070MW of input power for each 1GW of IT load.Importantly, NVIDIA may initially extend 48/54V farther while Google and Meta appear positioned to introduce +/- 400V architectures earlier alongside Amazon 48V power rack for some Trainium 3 systems and 800V for Trainium 4. We therefore see 2027-28 as an overlap period across multiple power architectures rather than a single industry wide switchover - one reason our strong 2027 TAM does not depend on strong 800V adoption.
GPU / CPU
CORE RAILS
VRM
12 V→ <1 Vl
IBC + VRM
12 V→ <1 Vl
HVDC/DC +
VRM
800 V →12V <1 Vl
HVDC/DC +
VRM
800V ->12V→
<1 V
HBM
1.1 VI/O
XPU + HBM
SILICON RAILS
XPU + HBM
SILICON
RAILS
XPU + HBM
SILICONI
RAILS
XPU + HBM
SILICONI
RAILS
Figure 1: Higher voltage distribution shifts rectification upstream and final DC/DC closer to the silicon
DISTRIBUTED SERVER CONVERSIONI
RACK-LEVEL CONSOLIDATION
800 VDC DISTRIBUTION + CONVERSION NEAR SILICON I
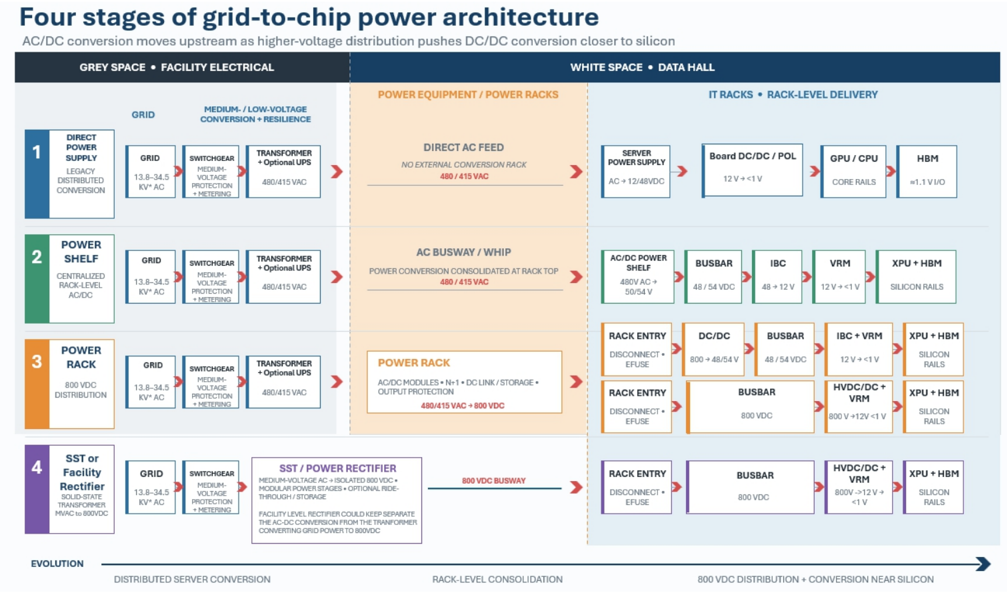
Source: UBS compiled from industry feedback including at GTC San Jose, Computex, OCP Asia and Semicon Taiwan (OCP , NVIDIA, Infineon, Eaton, Lite-On, Delta, Vertiv)
Power content grows faster than rack TDP
Our platform BOM analysis indicates that rack power content increases close to tenfold from Hopper through VR300, versus approximately sixfold growth in rack TDP (thermal design power). Indicative content rises from roughly US$19,000 per Hopper rack to US $67,000 for GB200, US$96,000 for GB300, US$170,000 for VR200 and US$183,000 for VR300. Content intensity increases from approximately US$0.42/W to US$0.73/W across these platforms and reaches a blended US$0.87/W in our 2030 market model.
The content increase extends well beyond adding more PSUs. PSU modules scale from approximately 5.5kW toward 12-18kW, shelves increase from roughly 33kW to 72110kW, and dedicated power racks reach 660-840kW. BBU/CBU, busbars, DC/DC conversion, power distribution, protection, controls and liquid cooling all expand.
13.8-34.5
480 / 415 VAC
1
2
3
4
48 / 54 VDC
IBC
48 ÷ 12 Vl
BUSBAR
48 / 54 VDC
BUSBAR
800 VDC
Transitional 400/800V architectures should be particularly content-rich because they add high-voltage power racks, distribution and protection before existing AC and 48/55V conversion chain is eliminated. Native 800V and SST may later remove some mature stages, but shift value into higher-power rectification, storage, protection, widebandgap semiconductors and controls rather than disappearing.
Our bottom-up AI power TAM reaches US$91.1bn in 2030
We calculate TAM by applying architecture-specific power content per IT watt to annual AI IT capacity deployed. This drives our AI server power TAM from US$6.6bn in 2025 to US$17.7bn in 2026, US$38.2bn in 2027, US$55.1bn in 2028 and US$91.1bn in 2030E, a 69% CAGR and US$285bn of cumulative TAM over 2025-30E. Importantly, the nearterm ramp does not depend on broad 800V adoption. Higher accelerator volumes, rising rack TDP , larger PSUs and shelves, and greater BBU/CBU content already drive substantial growth under conventional 48/54V architectures. The move to power racks and 800V becomes a larger incremental contributor from 2028 onward.
Figure 2: AI Power TAM build-up: rising watts per rack drive the majority of growth
| AI Power TAM build-up | 2024 | 2025 | 2026E | 2027E | 2028E | 2029E | 2030E | CAGR (25-30) |
|---|---|---|---|---|---|---|---|---|
| AI server rack units | 237,600 | 208,418 | 296,616 | 428,299 | 396,708 | 342,359 | 369,452 | 12% |
| TDP per rack (kW) | 40.0 | 55.4 | 89.3 | 118.5 | 170.7 | 256.9 | 282.8 | 39% |
| AI IT capacity deployed (GW) | 9.5 | 11.5 | 26.5 | 50.8 | 67.7 | 87.9 | 104.5 | 55% |
| Power content / IT Watt | $0.52 | $0.57 | $0.67 | $0.75 | $0.81 | $0.86 | $0.87 | 9% |
| AI Power TAM (US$mn) | $4,951 | $6,582 | $17,726 | $38,199 | $55,144 | $75,798 | $91,115 | 69% |
| YoY TAM Growth | 33% | 169% | 115% | 44% | 37% | 20% |
Source: UBS
2027 growth does not depend on broad 800V; more important for 2028
Our sensitivity work suggests the timing of NVIDIA's initial 800V power-rack ramp has a relatively modest impact on the overall 2027 TAM: each 10ppt change in NVIDIA powerrack penetration moves our total TAM by only ~1%. The larger drivers for 2027 are the sharp increase in deployed IT GW (+92% YoY), Rubin's higher system power (+60%), AMD's move toward rack-scale systems and early power-rack adoption across the top custom ASIC platforms. By 2028, architecture becomes a larger driver as Google/ Amazon should ramp power racks with chip and rack TDP rising with their shift to 4 die chip architectures to offset milder ramp with Rubin Ultra's similar Oberon and mild TDP upgrade before a steeper ramp toward native 800V systems into the Feynman generation also likely shifting to a 4 die architecture and 288+ GPUs/rack. We therefore see 2026-27 primarily as a watts-growth phase, followed by a stronger architecture/ content-per-watt phase from 2028 onward.
ASICs broaden the power-rack transition and nearly match GPU power TAM by 2030
NVIDIA remains the largest individual platform, with US$41.8bn of modeled 2030 power TAM, but it is no longer the industry's only meaningful driver. We estimate total GPU-related power TAM of US$49.2bn in 2030, or 54% of the market, versus US $42.0bn, or 46%, from custom ASIC systems. Google, Amazon, Meta, Microsoft/ OpenAI and other ASIC deployments therefore become almost as important as NVIDIA and AMD combined.
This mix also argues against assuming one universal power architecture. NVIDIA is leading the move toward 800VDC, while hyperscalers may continue using 48/50/54V, ±400V or localized 800V designs for different periods. Rack structure, CPU separation, redundancy and storage requirements also vary. Suppliers must qualify across multiple platforms and support several architectures simultaneously, increasing the value of engineering breadth and customer relationships.
Figure 3: AI power TAM growth moderates after 2027, but annual dollar increases remain substantial
Source: UBS
Deployments determine TAM; architecture determines who captures it
Deployed IT GW is the largest sensitivity in our model: a 10% change in 2030 capacity changes TAM by approximately US$9.1bn. A US$0.05/W change in blended content changes TAM by approximately US$5.2bn. An additional 1GW in 2027 adds approximately 4.2 percentage points to TAM growth, while an additional US$0.01/W of content adds approximately 2.9 percentage points. This reinforces our view that the magnitude and timing of AI hardware deployments remain the most important variables for the 2026-27 inflection; widespread native 800V adoption is not required for a strong 2027 outcome. The timing of 800V and SST has a larger effect on revenue mix and supplier positioning than on the underlying power requirement. A one-year delay in 800V shifts content toward conventional PSUs, 48/54V shelves and localized DC/DC rather than eliminating demand. Faster adoption benefits suppliers qualified in HVDC power racks, storage, protection and high-ratio conversion. This distinction also reduces the dependence of our 2026-27 TAM on precise forecasts of the 800V roadmap.
Figure 4: 2027 TAM sensitivity: US$38.2bn base case at 50.8GW and US$0.75/W
| IT GWDeployed | IT GWDeployed | IT GWDeployed | IT GWDeployed | IT GWDeployed | IT GWDeployed | IT GWDeployed | |||
|---|---|---|---|---|---|---|---|---|---|
| YoY: | $0 | 47.8 | 48.8 | 49.8 | 50.8 | 51.8 | 52.8 | 53.8 | |
| Power content per IT Watt | 8% | $0.72 | $34.5 | $35.2 | $36.0 | $36.7 | $37.4 | $38.1 | $38.8 |
| Power content per IT Watt | 9% | $0.73 | $35.0 | $35.7 | $36.5 | $37.2 | $37.9 | $38.6 | $39.4 |
| Power content per IT Watt | 11% | $0.74 | $35.5 | $36.2 | $36.9 | $37.7 | $38.4 | $39.2 | $39.9 |
| Power content per IT Watt | 12% | $0.75 | $35.9 | $36.7 | $37.4 | $38.2 | $39.0 | $39.7 | $40.5 |
| Power content per IT Watt | 14% | $0.76 | $36.4 | $37.2 | $37.9 | $38.7 | $39.5 | $40.2 | $41.0 |
| Power content per IT Watt | 15% | $0.77 | $36.9 | $37.7 | $38.4 | $39.2 | $40.0 | $40.8 | $41.5 |
| Power content per IT Watt | 17% | $0.78 | $37.4 | $38.2 | $38.9 | $39.7 | $40.5 | $41.3 | $42.1 |
Source: UBS
White-space and grey-space competitors converge
The transition blurs the historical separation between white-space suppliers of IT rack power and grey-space suppliers of UPS, switchgear, transformers and facility distribution. White-space leaders are moving upstream into power racks, HVDC and SST, while Vertiv, Schneider and Eaton are extending facility-level capabilities closer to the compute rack. Flex competes through manufacturing and system integration, while Advanced Energy, AcBel and Megmeet are relevant in select platforms.
As power domains expand from standalone PSU modules to hundreds-of-kW power racks and eventually multi-MW systems, value shifts toward engineered power systems. This favors suppliers with platform qualification, high-density engineering, breadth across conversion, storage, distribution, protection and cooling, and the ability to integrate and service systems globally. These requirements should slow commoditization despite increasing Chinese competition. Power and infrastructure related revenue across
Figure 5: 2027 TAM growth sensitivity: +4.2ppt per +1GW and +2.9ppt per +$0.01/W
| Ultra Power Rack Penetration IT GWDeployed | Ultra Power Rack Penetration IT GWDeployed | Ultra Power Rack Penetration IT GWDeployed | Ultra Power Rack Penetration IT GWDeployed | Ultra Power Rack Penetration IT GWDeployed | Ultra Power Rack Penetration IT GWDeployed | Ultra Power Rack Penetration IT GWDeployed | |||
|---|---|---|---|---|---|---|---|---|---|
| YoY: | 115.5% | 47.8 | 48.8 | 49.8 | 50.8 | 51.8 | 52.8 | 53.8 | |
| content Watt | 8% | $0.72 | -20.8% | -16.7% | -12.7% | -8.6% | -4.5% | -0.4% | 3.6% |
| content Watt | 9% | $0.73 | -18.1% | -14.0% | -9.9% | -5.7% | -1.6% | 2.5% | 6.7% |
| content Watt | 11% | $0.74 | -15.4% | -11.2% | -7.1% | -2.9% | 1.3% | 5.5% | 9.7% |
| content Watt | 12% | $0.75 | -12.7% | -8.5% | -4.2% | 0.0% | 4.2% | 8.5% | 12.7% |
| content Watt | 14% | $0.76 | -10.0% | -5.7% | -1.4% | 2.9% | 7.2% | 11.5% | 15.8% |
| content Watt | 15% | $0.77 | -7.3% | -3.0% | 1.4% | 5.7% | 10.1% | 14.4% | 18.8% |
| content Watt | 17% | $0.78 | -4.6% | -0.2% | 4.2% | 8.6% | 13.0% | 17.4% | 21.8% |
Source: UBS
our selected vendor reporting categories rises from US$56bn in 2024 to US$196bn in 2030E. Although the reporting scopes are not directly comparable, this illustrates the scale, opportunity and investment required to compete.
Supply chain implications: Power, storage, and MLCC beneficiaries
We would highlight several areas benefiting from the architecture upgrades supplementing a grid constrained moderation in IT GW of capacity deployed.
- Power supply and storage are the most direct beneficiaries. Our preferred power names are Delta and Lite-On : Delta has the broadest grid-to-chip exposure and ~39-43% share of a rising AI power TAM, while Lite-On (also initiating with a Buy and NT$400 target) with improving execution, customer penetration and power rack ramps to lift sales and margins. We forecast their relevant revenues rising from US$3.0bn/US$3.0bn in 2026 to US$11.0bn/US $11.0bn in 2030, respectively. We also view potential for Megmeet (Neutral) in China to outgrow from a low base with fast development to gain qualifications and customer responsiveness to secure new design-ins.
- Global infrastructure vendors can extend toward the white space . Vertiv, Schneider and Eaton bring established positions in UPS, distribution, switchgear, controls, and cooling, giving them a natural path into higher-voltage, rackadjacent power as AI architectures scale. Vertiv is particularly well positioned where power and cooling converge, while Schneider and Eaton can leverage broader data-center electrical infrastructure. Relative to Delta and Lite-On, however, they have less historical content immediately adjacent to the accelerator. Flex and Advanced Energy (both Not Rated) are more focused on powerconversion, with Flex combining power, cooling, racks and large scale manufacturing while Advanced Energy targets high performance convergence.
- Energy storage should also expand as AI power rises . We view energy storage as a strong growth area with the BBU battery back-up unit (BBU) market rising from US$2.5bn in 2026 to US$12.8bn by 2030 and including capacitor back-up unit (CBU) from US$3.1bn to US$15.9bn. We view different architectures with some positioning back-up power with BBU near-rack but over time moving to pooled storage. Panasonic appears better positioned in compact cylindrical rack storage, while Samsung SDI has potential upside from LFP and larger pooled/UPS applications .
- MLCCs - rising contribution from data center power. We see opportunities as voltage and power density rise. 800V/SST architectures increase high-voltage capacitor content, benefiting MLCC suppliers including Murata, TDK and Semco. TDK sees its AI-related MLCC business with 30-40% share growing >100% YoY from a small base.
- AI power semiconductors. We also view AI data-center power semiconductors as a strong structural growth market, but favor suppliers with capacity and differentiated new products given the risk that infrastructure availability constrains deployment. Our preferred exposures include TI gaining share in PSUs/IBCs, Analog Devices gaining share in VRMs, and STMicro's photonics exposure provides additional upside. We are more conservative on Infineon (Neutral) with high share but also high expectations.
Figure 6: AI Server Power Electronics Suppliers
| Product | Market cap | Price 11-Sep | Price target | EPS | (LC$) | (LC$) | P/E (x) | P/B | P/B | (x) Div Yld (%) | (x) Div Yld (%) | |||||
|---|---|---|---|---|---|---|---|---|---|---|---|---|---|---|---|---|
| Company | category | Ticker | (US$m) | (LC$) | (LC$) | Rating | 2026E | 2027E | 2028E | 2026E | 2027E | 2028E 2026E | 2027E | 2026E | 2027E | Analyst |
| Power supply chain | ||||||||||||||||
| Analog Devices | Power Semis | ADI.O | 185,471 | 379 | 490 | Buy | 12.93 | 17.00 | 18.06 | 29.1 | 22.0 | 20.5 5.4 | 5.2 | 1.1 | 1.3 | Timothy Arcuri |
| Delta Electronics | Power Supply | 2308.TW | 133,161 | 1,620 | 2,750 | Buy | 41.35 | 67.50 | 90.00 | 39.2 | 24.0 18.0 | 11.6 | 8.4 | 0.7 | 1.3 | Randy Abrams |
| Eaton | Power Systems | ETN.N | 166,830 | 425 | 515 | Buy | 13.64 | 17.05 | 19.95 | 31.1 | 24.9 | 21.3 7.4 | 6.7 | 1.0 | 1.1 | Amit Mehrotra |
| Infineon | Power Semis | IFXGn.DE | 88,259 | 59 | 64 | Neutral | 1.79 | 2.61 | 3.31 | 32.8 | 22.4 | 17.7 4.2 | 3.7 | 0.9 | 1.3 | Francois-Xavier Bouvignies |
| Lite-On Technology | Power Supply | 2301.TW | 20,088 | 277 | 400 | Buy | 10.85 | 16.00 | 20.00 | 25.5 | 17.3 | 13.8 6.4 | 5.4 | 1.8 | 2.7 | Pending Initiation |
| Megmeet | Power Supply | 002851.SZ | 10,899 | 126 | 125 | Neutral | 1.99 | 3.74 | 4.55 | 63.3 | 33.6 | 27.6 9.9 | 8.0 | 0.5 | 0.9 | Kunlun Li |
| Murata | MLCCs | 6981.T | 86,848 | 7,352 | 13,200 | Buy | 128.35 | 199.48 | 325.10 | 21.5 | 36.9 | 22.6 1.8 | 4.7 | 1.0 | 1.2 | Shingo Hirata |
| Panasonic | Energy Storage | 6752.T | 63,638 | 4,200 | 5,320 | Buy | 81.18 | 225.00 | 276.52 | 22.5 | 18.7 | 15.2 0.8 | 1.8 | 1.9 | 2.3 | Kenji Yasui |
| Samsung SDI | Energy Storage | 006400.KS | 31,429 | 545,000 | 850,000 | Buy | 4,904 | 21,870 | 27,012 | 108.9 | 24.4 | 19.8 1.9 | 1.8 | 0.2 | 0.3 | Tim Bush |
| Schneider | Power Systems | SCHN.PA | 192,811 | 291 | 335 | Buy | 11 | 12 | 14 | 26.9 | 22.9 | 20.4 6.2 | 5.6 | 1.7 | 1.9 | Andre Kukhnin |
| SEMCO | MLCCs | 009150.KS | 78,060 | 1,400,000 | 2,700,000 | Buy | 21,180 | 55,230 | 87,793 | 65.4 | 25.0 | 15.7 9.3 | 6.9 | 0.1 | 0.3 | Jimmy Yoon |
| STMicroelectronics | Power Semis | STMPA.PA | 45,265 | 45 | 80 | Buy | 1.40 | 3.16 | 4.63 | 35.5 | 15.7 | 10.7 2.5 | 2.2 | 0.5 | 0.5 | Francois-Xavier Bouvignies |
| TDK | MLCCs | 6762.T | 34,595 | 2,809 | 4,950 | Buy | 103.26 | 142.09 | 194.78 | 19.1 | 19.8 | 14.4 1.7 | 2.2 | 1.4 | 2.0 | Shingo Hirata |
| Texas Instrument | Power Semis | TXN.O | 243,859 | 269 | 380 | Buy | 8.68 | 12.11 | 15.01 | 30.6 | 21.9 | 17.6 12.4 | 12.0 | 2.2 | 2.3 | Timothy Arcuri |
| Vertiv | Power Systems | VRT.N | 98,120 | 257 | 370 | Buy | 6.71 | 9.20 | 10.84 | 37.5 | 27.4 | 23.2 16.6 | 11.3 | 0.1 | 0.1 | Amit Mehrotra |
Source: UBS Estimates
Interposer Size
CoWoS-S
CoWoS-L/R
CoWoS-L
9.5-reticle
A16 SoC/SolC
212 HBM4E|
CoPoS
CoWos
14-reticle
AI power ramping with package power, rack density and rising GW of deployments 12 HBM3E/4 SoW · (system on water) |
3.3-reticle
3.3-reticle
The AI infrastructure build-out is increasing power demand on three levels: 1) rising power per accelerator package, 2) rising power per rack and 3) increasing the GW of AI hardware deployed. The rise in power, which is driven by higher compute density is designed to minimize data movement to save time and energy, driving as much compute as possible on one die/package then as much as possible in a rack and then once that is exhausted toward communicate across racks. Every step outward gets slower, consumes more energy per bit and costs more.
More compute per package drives higher chip power
At the chip level, the accelerate wants access to the largest possible amount of compute sharing the fastest, closest memory and interconnect and driving a push toward ever larger chip packages integrating multiple chipsets. Increasing compute inside an accelerator gives several advantages: 1) less communication overhead exchanging data on chip and with nearby HBM and SRAM rather than sending over a networking link, 2) better high bandwidth memory (HBM) utilization maximizing the adjacent compute to the memory, 3) ability to run more of a model layer rather than inefficiently splitting across accelerators, and 4) reuse more data locally vs. paying the bandwidth and energy cost moving it around.
The foundries and advanced packaging manufacturers are enabling these move up to larger multi-die accelerators by upgrading their advanced packaging to support larger chipsets. TSMC's CoWoS (chip on wafer on substrate) roadmap has expanded to multiple reticles and will upgrade further to CoPoS (chip on panel on substrate) in the next few years migrating from 12" wafer based packaging to larger 310x310 panels capable of more efficiently packaging the larger chips. UBS also profiled Intel's EMIB-T which can scale to 6-8 reticles now and targets over 12 reticles by 2028 (link).
Figure 7: TSMC's tech roadmap supporting multiple accelerators per package
Source: Company Data, UBS
Scale-up economics push more compute and power into each rack
The same logic for more compute density on chip also applies to the rack to make the whole server behave like one accelerator and maximize utilization of those accelerators. AI uses a high degree of parallel compute in training and inference that must require different GPUs calculating operations to quickly exchange results. The ability to have 72 GPUs or accelerators communicate over a high bandwidth low latency scale-up network allows greater efficiency than scattered across many independent racks connected by Ethernet / Infiniband networking.
Communication that remains within the rack generally avoids additional network hops, optical links and latency associated with crossing rack boundaries. This can improve accelerator utilization and reduce the amount of time expensive compute sits idle waiting for data or synchronization. The increase in rack power is not only a by-product of faster chips. It is partly an economically rational decision to place more of the scale-up r -
system within a single rack.
The scale-up bandwidth is vastly higher and latency lower making it optimal to keep communications between accelerators within a rack. NVIDIA's NVLink scale-up domain has improved from 900GB/second bidirectional bandwidth between GPUs to 3.6TB/ second from Hopper to Rubin, keeping it at an 18x bandwidth advantage over its scale out bandwidth between adjacent racks improving from 50GB/second to 200GB/second over the same time frame.
The speed and latency advantage of scale-up is particularly importance for communication heavy inference operations including 1) tensor parallelism: splitting a layer of compute across many GPUs which need to exchange data, 2) MoE (mixture of experts) parallelism to efficiently route tokens to experts residing on different GPUs, 3) gradients/intermediate results that need to be combined across GPUs, and 4) large model inference including the weights, activations and KV cache workloads that need to move data between workloads. For large frontier mixture of expert models, scale-up is well suited for the frequent token exchange between experts for fast coordination.
Scale-out still has its place connecting hundreds of these racks together for a large training job to aggregate compute, inference jobs that can be replicated on multiple racks to serve multiple users, disaggregation of prefill and decode into separate racks during inference, bulk transfers of data between racks, and computation of batches of data that can operate in parallel.
Figure 8: Scale-up has an 18x bandwidth advantage over scale-out, increasing the incentive for compute dense racks
| Platform | Scale-up Domain | Scale-up Fabric | NVLink bandwidth/GPU | Scale-out Fabric | Scale-out bandwidth/GPU | Scale up advantage |
|---|---|---|---|---|---|---|
| Hopper H100 | HGX 8 GPUs | NVLink 4 | 900GB/s bidirectional | ConnectX-7 Ethernet / Infiniband | 50GB/s | 18x |
| Blackwell GB200 | NVL 72 GPUs | NVLink 5 | 1.8TB/s bidirectional | ConnectX-7 Ethernet/ Infiniband | 50GB/s | 36x |
| Blackwell GB300 | NVL 72 GPUs | NVLink 5 | 1.8TB/s bidirectional | CX8, Spectrum X/ Quantum X800 | 100GB/s | 18x |
| Vera Rubin | NVL 72 GPUs | NVLink 6 | 3.6TB/s bidirectional | CX9, Spectrum X/Infiniband | 200GB/s | 18x |
Source: Company Data, UBS
Accelerator roadmaps show rising rack compute and power density
The trends to higher power per chip and per rack are visible across the major GPU (NVIDIA and AMD) and ASIC accelerators (Google, Amazon, Microsoft, Meta and other start-ups) maximizing compute density on each chipset to increase compute performance at low latency for training and inference. Rack power also grows not only because each accelerator consumes more power, but also because the rack contains more of the complete AI system including the accelerator packages, host CPUs and memory, scale-up switches, scale out network interface cards (NICs) and data processing units (DPUs), management and storage controllers, liquid cooling pumps and manifolds, and additional conversion loss and energy buffering.
NVIDIA's GPU accelerators are seeing rise in power per GPU, GPUs per package, GPUs per rack. Its Hopper generation introduced in 2023 had one large monolithic H100 die at 700W and 32 GPUs per server rack connected by NVLink networking. While the 32 chips at 700kW draws about 23kW of power, total TDP (thermal design power) is 45kW including the host CPU, system memory, network adapters, NVLink switch, power conversion loss and auxiliary components. Blackwell and Blackwell Ultra upgraded the TDP to 120 and 140kW respectively with each GPU package upgrading to 2 reticle dies at 650/700W. Rubin steps up TDP further to 227kW in the Max-P version with each die moving up to 1,150W.
For Rubin Ultra's planned release in H227, NVIDIA originally pitched to upgrade further to 4 dies per GPU and 576 dies per rack although we believe has scaled back to using the same Oberon rack with 72 GPUs and 2 dies per GPU. We view the scale back a function of 4 dies being too large to efficiently produce on TSMC's 12" CoWoS until the larger more efficient CoPoS packaging is commercialized in 2028 and a proposed Kyber rack architecture with 144 blades and 288/576 dies per rack having complications with the midplane material, liquid cooling leakage control on the vertical shelves and customer interest to change rack design.
For AMD, its MI accelerator architecture is also upgrading from MI300 to MI455 from 32 GPUs to 72 GPUs, allowing it to upgrade accelerator chiplets per rack from 256 to 576 and raising the TDP from 40kW to 235kW. For MI500, a megapod that can connect 256 GPUs is a possible development option that could scale the rack TDP to 1MW.
Figure 9: AI GPUs from AMD and NVIDIA increasing # of dies and power per package
| NVIDIA | NVIDIA | NVIDIA | NVIDIA | NVIDIA | NVIDIA | AMD | AMD | AMD | |
|---|---|---|---|---|---|---|---|---|---|
| Hardware Opportunity | H200 | GB200 | GB300 | VR200 | VR300 Oberon | RF 200 | MI300 | MI455 | MI500 |
| Year of Introduction | H223 | H224 | H225 | H226 | H227 | H228 | Dec-23 | H226 | H227 |
| Rack architecture | HGX | Oberon | Oberon | Oberon | Oberon | TBD | HGX | Helios | Mega Pod |
| Process node | N4 | N4 | N4 | N3 | N3P | A16 | N5 | N2/N3 | N2P |
| Design service company | NVIDIA | NVIDIA | NVIDIA | NVIDIA | NVIDIA | NVIDIA | AMD | AMD | AMD |
| GPU/XPU # | 32 | 72 | 72 | 72 | 72 | 144 | 32 | 72 | 256 |
| Accelerator dies per package | 1 | 2 | 2 | 2 | 2 | 4 | 8 | 8 | 8 |
| XPU Dies per rack | 32 | 144 | 144 | 144 | 144 | 576 | 256 | 576 | 2048 |
| Power per XPU die (W) | 700 | 650 | 700 | 1,150 | 1,380 | 1,500 | 94 | 288 | 316 |
| Power per XPU (W) | 700 | 1,300 | 1,400 | 2,300 | 2,600 | 6,000 | 750 | 2,300 | 2,530 |
| 1GW of Data Center Power in kW | 1,000,000 | 1,000,000 | 1,000,000 | 1,000,000 | 1,000,000 | 1,000,000 | 1,000,000 | 1,000,000 | 1,000,000 |
| PUE | 1.15 | 1.15 | 1.15 | 1.15 | 1.15 | 1.15 | 1.15 | 1.15 | 1.15 |
| Power avail for AI Hardware, Net (kW) | 870,000 | 870,000 | 870,000 | 870,000 | 870,000 | 870,000 | 870,000 | 870,000 | 870,000 |
| Power per rack (kW) | 45 | 120 | 140 | 200 | 250 | 1200 | 40 | 235 | 1000 |
| Number of racks perGW | 19,333 | 7,250 | 6,214 | 4,350 | 3,480 | 725 | 21,750 | 3,702 | 870 |
| Rack ASP (US$mn) | $1.3 | $3.3 | $4.3 | $9.0 | $11.7 | $56.3 | $0.6 | $4.9 | $25.6 |
| Customer compute sales per GW($bn) | $25.1 | $23.9 | $26.7 | $39.2 | $40.7 | $40.8 | $13.7 | $18.1 | $22.3 |
Source: Company Data, UBS Estimates
ASIC platforms also upgrading the power per chip and rack
The power upgrade trend is not limited to the GPU accelerators as custom ASICs across Amazon, Google, Microsoft and Meta also are upgrading power per die, die per package and power density per rack. Amazon is turning the knobs of compute sequentially by adding more dies/package, higher power dies, more packages per rack and then higher power dies again requiring more liquid cooling. Amazon upgrades Trainium 1 to Trainium 2 by moving from 1 to 2 compute dies per package with 32 packages per rack and to Trainium 3 by doubling the power per package and stepping up TDP from 27kW to 65kW. It also has released its scale-up domain with Teton3 Max, a liquid cooled 72 accelerator rack (144 dies) with TDP estimated to reach 155kW. For Trainium 4, we expect power to rise to 800W per die and could reach 250kW in the next rack configuration.
Figure 10: Leading ASIC platforms from AWS and Google also scaling up power per rack
| Amazon | Amazon | Amazon | |||||||||
|---|---|---|---|---|---|---|---|---|---|---|---|
| Hardware Opportunity | Trainium 1 Trainium 2 | Trainium 1 Trainium 2 | T3 32 | T3 72 | Trainium 4 | TPU v5e | TPU v6 | TPU v7x | TPU 8i | TPU 8t | TPU 9 |
| Year of Introduction | H222 | H224 | H226 | H226 | H227 | H223 | H224 | H225 | H226 | H226 | H227 |
| Rack architecture | 2D Torus | 2D Torus | 3D Torus | 3D Torus | 3D Torus | Torus Cube | Torus Cube | Torus Cube | Torus Cube | Torus Cube | Torus Cube |
| Process node | N7 | N5 | N3P | N3P | N2 | N5 | N4 | N3 | N2 | N2 | N2P |
| Design service company | Alchip | Marvell | Alchip | Alchip | Alchip | Broadcom | Broadcom | Broadcom | Broadcom | Mediatek | AVGO/MTK |
| GPU/XPU # | 32 | 32 | 32 | 72 | 72 | 64 | 64 | 64 | 32 | 64 | 64 |
| Accelerator dies per package | 1 | 2 | 2 | 2 | 4 | 1 | 1 | 2 | 2 | 1 | 4 |
| XPU Dies per rack | 32 | 64 | 64 | 144 | 288 | 64 | 64 | 128 | 64 | 64 | 256 |
| Power per XPU die (W) | 350 | 250 | 500 | 500 | 800 | 200 | 300 | 550 | 450 | 1,000 | 600 |
| Power per XPU (W) | 350 | 500 | 1,000 | 1,000 | 3,200 | 200 | 300 | 1,100 | 900 | 1,000 | 2,400 |
| 1GW of Data Center Power in kW | 1,000,000 | 1,000,000 | 1,000,000 | 1,000,000 | 1,000,000 | 1,000,000 | 1,000,000 | 1,000,000 | 1,000,000 | 1,000,000 | 1,000,000 |
| PUE | 1.15 | 1.15 | 1.15 | 1.15 | 1.15 | 1.15 | 1.15 | 1.15 | 1.15 | 1.15 | 1.15 |
| Power avail for AI Hardware, Net (kW) | 870,000 | 870,000 | 870,000 | 870,000 | 870,000 | 870,000 | 870,000 | 870,000 | 870,000 | 870,000 | 870,000 |
| Power per rack (kW) | 27 | 27 | 65 | 155 | 330 | 28 | 40 | 90 | 50 | 90 | 200 |
| Number of racks perGW | 32,222 | 32,222 | 13,385 | 5,613 | 2,636 | 31,071 | 21,750 | 9,667 | 17,400 | 9,667 | 4,350 |
| Rack ASP (US$mn) | $0.4 | $0.7 | $0.9 | $2.1 | $4.5 | $0.5 | $1.1 | $1.8 | $2.1 | $0.7 | $3.1 |
| Customer sales per GW($bn) | $14.0 | $21.0 | $12.2 | $11.5 | $11.9 | $16.9 | $23.6 | $17.8 | $35.9 | $6.3 | $13.5 |
Source: Company Data, UBS Estimates
Google keeps its 64 TPU package per rack configuration but upgrades power per die and die per package. The major transition came with TPUv7x moving from 1 to 2 compute dies per package and also doubling power per die to 1.1kW. v8 upcoming in H226 has a v8i for inference maintaining dual die configuration while v8t has one higher power compute die optimized for training. We expect TPU v9 to further push up performance with higher power dies to raise the rack TDP from 90kW on TPUv8i to 200kW for TPU v9.
Scale-up economics favor higher rack density
Concentrating compute improves floor-space productivity and can reduce the number and length of external cables. These benefits help explain why AWS is doubling Trainium rack density and why AMD and NVIDIA are designing complete 72-GPU rack-scale systems rather than only increasing standalone server performance.
Our central conclusion is that the power trajectory remains structural toward denser compute and rack configurations supported by the silicon vendor roadmap toward multi-die systems, TSMC and Intel's roadmap to support multiple reticle packaging with CoPoS and EMIB_T respectively and rack architectures which are improving the scale-up bandwidth to allow multiple accelerators to behave as a single unit with lower latency.
The rise in compute density per rack will have positive implications for the power electronics TAM by increasing the conversion and distribution of power wattage from the grid to the rack and ultimately the chip. The market has been concerned about NVIDIA's Kyber delay, as the architecture would have increased the scale-up density from Oberon's 72 GPU packages per system to 144. However, powerdensity increases do not depend solely on increasing the number of GPU packages per rack. Density can also rise materially through more compute dies per package, supported by the advanced packaging roadmap toward larger multi-die systems including TSMC's CoPoS and Intel's EMIB-T supporting multiple reticle sizes and 4+ large compute dies per package in coming years.
As accelerator platforms expand from two compute dies with Blackwell toward four and potentially more, even a 72-GPU configuration could support materially higher rack power density, driving greater requirements for power conversion, distribution and rack level back-up power. Blackwell was about 3.5 reticle sizes supported by TSMC's roadmap but by 2027, TSMC can support 14x reticle CoWoS (10 compute dies + 20 HBM stacks), plans to extend it further with 310x310 panels planned for volume by 2028 and as far as system on wafer (SoW-X supporting 40x reticles).
AI infrastructure build-out driving strong GW compute growth
Key driver for the power TAM beyond the upgrade of power content per chip and per rack will be the amount of GW of compute capacity added. We project strong growth in capacity deployed across AI GPUs, accelerators and CPUs leveraging our signposts (see appendix) including 1) UBS hyperscale capex model analyzing metrics for Internet service and cloud service sales growth, cloud operating margins, operating cash flow, capex and balance sheet health, 2) insights into compute constraints appearing across all the major hyperscalers and neoclouds which are helping lift GPU rental pricing and cloud margins, and 3) rising AI natives annualized revenues pointing to strong monetization. We would highlight:
Monetization of AI is improving. Cloud revenue growth is accelerating toward 100% YoY by the end of 2026 on UBSe before tapering to +70% YoY growth in H227 although still subject to new contracts potentially coming in and keeping up that elevated growth. Cloud backlog at the top 7 hyperscalers is US$2.5trn, +197% YoY and representing 578% of annualized cloud sales and 361% of forward 12 months cloud sales. Internet service growth is also improving monetization leveraging AI and is accelerating progressively from <5% YoY growth in early 2023 to +25% YoY growth in 2026. The AI natives have also accelerated their growth with OpenAI coming into the year targeting to ramp from US$13bn sales in 2025 to US$30bn and already having reached US$40bn ARR in July.
Figure 11: Hyperscaler cloud seeing high growth
Source: Company Data, UBSe
Figure 12: Internet service growth also picking up
Source: Company Data, UBSe
Capex spending remains robust, just passing operating cash flows
UBS capex estimates revised up through the Q226 results season for the top 12 hyperscalers by 7%/26% to US$998bn/US$1.447trn, +97%/45% YoY for 2026-27. The hyperscalers are spending for an accelerated period of growth, remain compute constrained and continue to earn healthy margins, with cloud OpM improving 640bp YoY at AWS to 39.4%, 1,480bp YoY to 35.6% at GCP and stayed stable at 40.6% for Microsoft Intelligent Cloud. While capex is robust and driven by the strong cloud backlog, tight compute, and solid operating margins, it is still at a pace that should slow in the coming few years now that it is outpacing operating cash flow and triggering a widening financing gap from capital market. We view a moderation from 2028 in capex toward the growth rate of operating cash flow growth and eventually below the growth in cash flows to reduce the capital markets financing requirements. On that moderation scenario, we project a still healthy growth rate for spending. Operating cash flow is projected to grow 38% in both 2026 and 2027 to US$914bn/US$1.27trn. The gap to capex would be US$160bn in 2027 and still be able to be financed by capital markets plus backed by US$628bn net cash on the top hyperscalers balance sheets.
Figure 13: Operating CF improving to ~40% YoY
Source: Company Data, UBSe
Figure 14: Capex may moderate to a more sustainable level of operating cash flow growth
Source: Company Data, UBSe
Aggressive supply chain deployment plans for compute
We leverage our supply chain bottom up inputs on accelerator demand from our covered companies, HBM and advanced packaging for AI GPUs and ASICs projecting strong growth through 2027 and taper our forecasts from 2028-30 factoring capex may moderate toward the 30-40% growth rate of operating cash flows and eventually
Thousands below that. That moderation view reflects still swing factors around monetization pace into corporates and disruption from open source models, grid and generation capacity availability, power equipment and construction lead times and greater capital discipline as spending is increasingly financed from equity/debt in addition to operating cash flows. UBS forecasts based on orders for HBM attached to the accelerators and CoWoS assembly capacity projects GPU and ASIC unit growth ramping from 19.7mn dies in 2025 to 100.6mn dies in 2030, with strong growth planned in 2027-28 (+65%/71% YoY) before slowing to 10-15% YoY in 2029-30 for a healthy +39% '2025-30 CAGR for compute dies.
Figure 15: UBS projections for AI accelerator shipments: +39% compute die unit CAGR
| AI GPU and ASIC units | 2024 | 2025 | 2026E | 2027E | 2028E | 2029E | 2030E | CAGR '25-30 |
|---|---|---|---|---|---|---|---|---|
| NVIDIA | 4,534,285 | 6,921,044 | 9,058,681 | 8,196,941 | 12,802,881 | 10,000,031 | 10,268,164 | 8% |
| AMD | 554,501 | 630,279 | 777,083 | 1,960,628 | 1,771,098 | 2,060,000 | 2,360,000 | 30% |
| Total AI GPU Units | 5,088,787 | 7,551,323 | 9,835,764 | 10,157,569 | 14,573,980 | 12,060,031 | 12,628,164 | 11% |
| AWS | 1,602,024 | 1,513,025 | 2,405,000 | 3,245,000 | 2,800,000 | 3,000,000 | 3,300,000 | 17% |
| 2,229,074 | 2,642,106 | 4,166,926 | 9,100,000 | 7,100,000 | 6,180,000 | 6,909,600 | 21% | |
| Meta | 348,000 | 421,000 | 175,000 | 425,000 | 560,000 | 710,000 | 810,000 | 14% |
| Microsoft | 52,000 | 68,000 | 74,000 | 114,000 | 71,000 | 90,800 | 107,960 | 10% |
| Intel | 313,728 | 213,178 | 109,200 | 86,000 | 50,000 | 20,000 | 10,000 | -46% |
| OpenAI | 0 | 0 | 170,000 | 730,000 | 1,200,000 | 1,770,000 | 2,430,000 | N/M |
| Tesla | 0 | 0 | 64,000 | 63,000 | 129,400 | 183,340 | 245,650 | N/M |
| Other ASICs | 641,538 | 1,018,535 | 747,500 | 978,750 | 1,272,375 | 1,590,469 | 1,908,563 | 13% |
| Total AI ASIC Units | 5,186,363 | 5,875,845 | 7,911,626 | 14,741,750 | 13,182,775 | 13,544,609 | 15,721,773 | 22% |
| Total AI GPU & ASIC Chipsets | 10,275,150 | 13,427,167 | 17,747,390 | 24,899,319 | 27,756,755 | 25,604,640 | 28,349,936 | 16% |
| YoY Growth | 31% | 32% | 40% | 11% | -8% | 11% | -19% | |
| Dies per Unit | 1.2 | 1.5 | 1.6 | 1.9 | 2.9 | 3.5 | 3.5 | 19% |
| Total AI GPU & ASIC Dies | 12,484,020 | 19,689,393 | 28,258,709 | 46,608,128 | 79,551,903 | 90,209,143 | 100,615,547 | 39% |
| YoY Growth | 58% | 44% | 65% | 71% | 13% | 12% |
Source: Company data, UBS estimates
Based on the ASIC shipments and our projection for chips per rack, we project a 12% CAGR in rack shipments from 2025-30 but reaching a peak in shipments around 2027. The drawdown in rack numbers from 2027-2030 stems from the shift to more accelerators per rack as scale-up systems increase compute density to maximize training and inference bandwidth and efficiency. We project average # of chipsets per rack to rise from 43 to 77 from 2025-2030 and # of accelerator dies per rack to rise from 53 to 272 during the same period. We also factor timing between chip production and rack assembly and assume 75% of accelerator chips are deployed in racks in the same year and 25% in the subsequent year.
Figure 16: UBS forecast for AI GPU and ASIC racks: possible peak in 2027 but shifts to more chips and dies per rack
| AI GPU and ASIC Rack Forecast | (UBSe)2024 | 2025 | 2026E | 2027E | 2028E | 2029E | 2030E | CAGR '25-30 |
|---|---|---|---|---|---|---|---|---|
| NVIDIA NVL72+ | 18 | 27,034 | 77,506 | 95,098 | 82,000 | 34,429 | 27,000 | 0% |
| NVIDIA Other (HGX/LPU/CPU) | 130,744 | 63,000 | 66,303 | 72,941 | 83,188 | 100,016 | 111,868 | 12% |
| AMD | 6,164 | 6,466 | 8,450 | 13,765 | 11,338 | 9,000 | 9,168 | 7% |
| Total AI GPU Racks | 136,926 | 96,500 | 152,260 | 181,803 | 176,526 | 143,444 | 148,035 | 9% |
| AWS | 39,583 | 43,935 | 63,026 | 82,083 | 54,952 | 42,361 | 44,792 | 0% |
| 34,820 | 39,672 | 59,155 | 133,465 | 122,266 | 100,156 | 105,113 | 22% | |
| Meta | 5,631 | 6,448 | 3,465 | 5,439 | 7,448 | 9,340 | 10,903 | 11% |
| Microsoft | 474 | 553 | 611 | 832 | 965 | 1,192 | 1,440 | 21% |
| Intel | 9,804 | 7,447 | 4,225 | 2,869 | 1,844 | 859 | 391 | -45% |
| OpenAI | 0 | 0 | 1,771 | 8,299 | 15,069 | 22,604 | 31,458 | N/M |
| Tesla | 1,451 | 1,025 | 781 | 718 | 986 | 1,415 | 1,917 | 13% |
| Other ASICs | 8,910 | 12,837 | 11,323 | 12,791 | 16,652 | 20,985 | 25,403 | 15% |
| Total AI ASIC Racks | 100,674 | 111,918 | 144,357 | 246,496 | 220,182 | 198,914 | 221,416 | 15% |
| Total Racks | 237,600 | 208,418 | 296,616 | 428,299 | 396,708 | 342,359 | 369,452 | 12% |
| Chipsets per Rack | 43 | 64 | 60 | 58 | 70 | 75 | 77 | 4% |
| Total # of Chipsets | 10,275,150 | 13,427,167 | 17,747,390 | 24,899,319 | 27,756,755 | 25,604,640 | 28,349,936 | 16% |
| Dies per Rack | 53 | 94 | 95 | 109 | 201 | 263 | 272 | 24% |
| Total # of Dies | 12,484,020 | 19,689,393 | 28,258,709 | 46,608,128 | 79,551,903 | 90,209,143 | 100,615,547 | 39% |
Source: Company data, UBS estimates.
With racks adding more accelerators per rack to increase the compute density, the thermal design power for racks (TDP) is steadily increasing. Our bottom-up analysis of
9.5
2024
87.9
supply chain feedback and roadmaps by vendors points to a +43% CAGR in the TDP of the racks from 55kW in 2025 to 283kW by 2030. We also expect upside to our estimates in 2029-30 as new ASIC systems are introduced at higher TDP leveraging TSMC's CoPoS and Intel's EMIB supporting even larger integrated chiplet systems.
Figure 17: Thermal design power for racks increasing
2025
27
| TDP per Rack (kW) | 2024 | 2025 | 2026E | 2027E | 2028E | 2029E | 2030E | CAGR (25-30) |
|---|---|---|---|---|---|---|---|---|
| NVIDIA NVL72+ | 120.0 | 124.7 | 138.8 | 208 | 270.4 | 801.9 | 1,200.0 | 57% |
| NVIDIA (HGX/LPU/CPU) | 45.0 | 64.8 | 88.2 | 109.9 | 126.1 | 144.6 | 162.0 | 20% |
| AMD | 40.0 | 40.0 | 81.2 | 242 | 533.4 | 850.6 | 969.2 | 89% |
| AI GPU TDP per Rack | 44.8 | 79.9 | 113.6 | 171.2 | 219.3 | 346.7 | 401.3 | 38% |
| AWS | 27.0 | 27.0 | 55 | 79.1 | 181.1 | 307.5 | 330.0 | 65% |
| 28.0 | 31.2 | 71.1 | 74.1 | 113.4 | 179.2 | 197.4 | 45% | |
| Meta | 3.4 | 3.7 | 28.7 | 106.1 | 138.7 | 154.4 | 165.5 | 114% |
| Microsoft | 50.0 | 50.0 | 64 | 85 | 112.5 | 120.6 | 121.4 | 19% |
| Tesla | 110.0 | 110.0 | 110 | 110 | 110 | 110 | 110.0 | 0% |
| Intel | 55.0 | 55.0 | 59.9 | 71.7 | 71.9 | 75.5 | 80.0 | 8% |
| OpenAI | N/M | N/M | 180 | 180 | 180 | 180 | 180.0 | N/M |
| Other ASICs | 65.0 | 65.0 | 65 | 65 | 65 | 65 | 65.0 | 0% |
| AI ASIC TDP per Rack | 33.4 | 34.2 | 63.8 | 79.7 | 131.7 | 192.1 | 203.6 | 43% |
| AI Accelerator TDP per Rack | 40.0 | 55.4 | 89.3 | 118.5 | 170.7 | 256.9 | 282.8 | 39% |
2026E
2027E
Source: Company data, UBS estimates
Based on expected rack deployment by vendor, tapering additions from 2028-30 and rising TDP per rack, we project annual AI IT capacity deployed rising from ~10GW in 2024 to ~105GW by 2030. Cumulatively, we model 358GW deployed over 2024-2030. At a PUE of 1.12 for efficient new hyperscale build-outs, this translates to ~401GW of gross data center power capacity over 2024-2030, including 348GW required during 2027-2030.
Figure 18: Annual IT capacity deployed rises to ~105GW by 2030
Source: UBS estimates
Figure 19: ~337GW AI capacity deployed over 2026-30
Source: UBS estimates
2028E
2029E
2030E
104.5
141
337
180
160
140
120
100
80
60
40
20
82
Global Data center capacity (Giga watt)
•30-Sep-24 31-Dec-24 • 31-Mar-25 • 30-Jun-25 30-Sep-25 31-Dec-25 • 31-Mar-26
161
Figure 20: GW of capacity deployed rising through 2030
US Data center capacity (Giga watt)
• 30-Sep-24 31-Dec-24 # 31-Mar-25 30-Jun-25 • 30-Sep-25 #31-Dec-25 # 31-Mar-26
100
89 88
| GWof Racks Deployed | 2024 | 2025 | 2026E | 2027E | 2028E | 2029E | 2030E | Total | CAGR (25-30) |
|---|---|---|---|---|---|---|---|---|---|
| NVIDIA NVL72+ | 0.0 | 3.4 | 10.8 | 19.8 | 22.2 | 27.6 | 32.4 | 116.1 | 57% |
| NVIDIA (HGX/LPU/CPU) | 5.9 | 4.1 | 5.9 | 8.0 | 10.5 | 14.5 | 18.1 | 66.9 | 35% |
| AMD | 0.2 | 0.3 | 0.7 | 3.3 | 6.0 | 7.7 | 8.9 | 27.1 | 103% |
| AI GPUs IT rack capacity deployed (GW) | 6.1 | 7.7 | 17.3 | 31.1 | 38.7 | 49.7 | 59.4 | 210.1 | 50% |
| AWS | 1.1 | 1.2 | 3.5 | 6.5 | 10.0 | 13.0 | 14.8 | 50.0 | 66% |
| 1.0 | 1.2 | 4.2 | 9.9 | 13.9 | 18.0 | 20.8 | 68.9 | 76% | |
| Meta | 0.0 | 0.0 | 0.1 | 0.6 | 1.0 | 1.4 | 1.8 | 5.0 | 137% |
| Microsoft | 0.0 | 0.0 | 0.0 | 0.1 | 0.1 | 0.1 | 0.2 | 0.6 | 45% |
| Tesla | 0.2 | 0.1 | 0.1 | 0.1 | 0.1 | 0.2 | 0.2 | 0.9 | 13% |
| Intel | 0.5 | 0.4 | 0.3 | 0.2 | 0.1 | 0.1 | 0.0 | 1.6 | -40% |
| OpenAI | 0.0 | 0.0 | 0.3 | 1.5 | 2.7 | 4.1 | 5.7 | 14.3 | N/M |
| Other ASICs | 0.6 | 0.8 | 0.7 | 0.8 | 1.1 | 1.4 | 1.7 | 7.1 | 15% |
| AI ASIC IT rack capacity deployed (GW) | 3.4 | 3.8 | 9.2 | 19.6 | 29.0 | 38.2 | 45.1 | 148.3 | 64% |
| AI rack IT rack capacity deployed (GW) | 9.5 | 11.5 | 26.5 | 50.8 | 67.7 | 87.9 | 104.5 | 358.4 | 55% |
| GWData center capacity (PUE 1.12) | 10.6 | 12.9 | 29.7 | 56.9 | 75.8 | 98.5 | 117.0 | 401.4 | 55% |
| YoY Growth | 22% | 130% | 92% | 33% | 30% | 19% |
Source: Company data, UBS estimates
Data center power availability increasingly constrains the out-year deployment curve
Our supply-chain deployment assumptions are aggressive, but the out-year ramp ultimately requires sufficient land, power, permitting and data-center infrastructure. Our modeled 2027-30 AI hardware deployments require approximately 348GW of gross data-center power capacity at a 1.12 PUE. NVIDIA in its FQ227 (Jul) 10-Q conveyed:
"The availability of land, power, shell, and capital is crucial to support the buildout of a full data center inclusive of NVIDIA AI infrastructure by our customers and partners, and any shortage of these or other necessary resources could impact our future revenue and financial performance. Expanding land, power, shell, and energy needs to meet demand is a complex, multi-year process that involves significant regulatory, technical, and construction challenges. In addition, access to capital can be particularly constrained for less-capitalized companies, which may face difficulties securing financing for large-scale infrastructure projects."
UBS Evidence Lab currently identifies approximately 201 GW of global data center capacity under construction or planned globally, including 126GW in the US. This provides meaningful support for the nearer-term build-out, but our model requires a further step-up in projects moving from planning into permitting and construction later in the decade. In particular, 2029-30 becomes as much about power availability as semiconductor and component supply.
Figure 21: Global data centers pipeline reaches 201GW, but out-year additions must accelerate
Source: Company Announcements, UBS Evidence Lab (> Access Dataset)
Figure 22: US planned/under-construction pipeline reaches 126GW
Source: Company Announcements, UBS Evidence Lab (> Access Dataset)
UBS US utilities analyst Gregg Orrill forecasts US data center demand rising by approximately 90GW from 2025-2030 from 51GW to 141GW. If the US represents roughly 55-60% of the 348GW of gross 2027-30 capacity implied by our model,
120
(20)
(40)
(60)
(8o)
(100)
(120)
(140)
(160)
(180)
25 GW
12 GV
approximately ~200GW of incremental US capacity would ultimately be required. Their base case includes roughly 90GW from the grid, with the remainder requiring additional or off-grid sources. On their forecasts, US reserve margins fall from approximately 24% in 2025 to 15% by 2030, dropping below the 20% safety level after 2027.
Within the grid pipeline, the utilities team identifies 3 sources of upside: 1) 24GW upside from higher plant completion rate, 2) 151GW advancing earlier-stage projects not yet in construction, and 3) fewer plant retirements vs. the 39GW assumed in UBS base case. A fourth source sits beyond the traditional grid: batteries/peak shaving, gas generation, utility-scale solar, fuel cells and solar-plus-storage to add usable capacity behind or alongside the meter.
Figure 23: US reserve margin falls below 20% after 2027 as data-center demand rises
| MW | 2024A | 2025E | 2026E | 2027E | 2028E | 2029E | 2030E | 26-30 Adds |
|---|---|---|---|---|---|---|---|---|
| Data Center Peak Demand | ||||||||
| ERCOT (Texas) | 4,163 | 4,618 | 7,051 | 11,298 | 18,521 | 22,613 | 28,813 | 21,762 |
| PJM | 6,710 | 7,278 | 9,507 | 13,585 | 18,702 | 24,634 | 36,134 | 26,627 |
| Data Center DemandMW | 46,226 | 51,602 | 65,152 | 80,348 | 99,559 | 116,454 | 141,025 | 75,874 |
| Peak DemandMW | 767,029 | 799,863 | 822,473 | 847,400 | 880,101 | 912,032 | 953,097 | 130,624 |
| Peak Demand Growth% | 4.3% | 2.8% | 3.0% | 3.9% | 3.6% | 4.5% | ||
| Data Center %Growth | 16% | 60% | 61% | 59% | 53% | 60% | 58% | |
| Supply | 970,490 | 990,075 | 1,017,822 | 1,024,116 | 1,031,131 | 1,048,836 | 1,092,421 | 74,599 |
| Supply Growth% | 2.0% | 2.8% | 0.6% | 0.7% | 1.7% | 4.2% | ||
| Reserve Margin | 26.5% | 23.8% | 23.8% | 20.9% | 17.2% | 15.0% | 14.6% |
Source: UBS Evidence Lab, ERCOT, PJM, Energy Information Administration, North America Electric Reliability Council, UBS Estimates
For supply side additions beyond the meter, UBS Americas Sustainability "How could half a trillion dollars of power capex be spent by '30?" outlined additional power sources which could drive 3% CAGR of power supply from sources beyond grid transmission and distribution build-out. The team views 133GW base case and 156GW full absorption case of additional usable GW of capacity from battery energy storage to support peak periods, combined cycle natural gas turbines, utility scale solar, simple cycle/peaker gas turbines, fuel cells, solar + storage, and off-shore wind. If the US could capture ~100GW of these additional sources, it could help close the power gap and supplement the grid and creating opportunities for solar, fuel cells and battery energy storage.
The implication for our AI power model is not that semiconductor demand disappears, but that the timing of hardware deployment increasingly hinges on deployable power. Our out-year TAM is therefore moderated by IT GW that can physically be brought online.
Figure 24: Multiple grid and behind-the-meter sources are required to close the 2026-30 capacity gap
Source: UBS
The power stack is moving out of the compute rack
Rapidly rising AI rack density is forcing a redesign of how power is delivered to the compute
24 GW
11 GW
Onshore Wind
0 GW
Final Gap
NVIDIA rack power has increased from roughly 45kW for Hopper to 120-140kW for Blackwell, while our model reaches 225-275kW for Rubin class systems and future systems could move up to 500kW-1MW+. Higher power per accelerator, more accelerators per scale-up domain and increased networking are all contributing to this increase.
The challenge is that today's racks typically distribute power internally at only 48-54V. As rack power rises, delivering the same watts at low voltage requires dramatically more current. That requires larger copper busbars and cables, higher resistive loses and heat, more difficult connectors and protection and more rack space devoted to power rather than compute. At several hundred kW per rack, continuing to scale the low-voltage architecture becomes increasingly uneconomic.
We expect the power architecture to evolve through a 4-stage transition
With the rise in rack power, we see the bulky AC/DC conversion, energy storage, protection and system controls progressively moving upstream into dedicated power shelves and power racks, allowing higher-voltage DC to travel deeper into the compute rack at much lower current. Longer term, industry participants are driving toward native 800V architectures carrying high voltage directly toward the compute node, with DC/DC conversion occurring close to the accelerator.
We view the transition to 800V architectures enable higher rack densities and ultimately GW-scale AI clusters, while also shifting and adding value across the power supply chain . Content increases in high-voltage AC/DC rectification, battery and capacitor backup, AC and DC power distribution, controls and additional DC/DC conversion stages. Even in the native 800V architecture, higher-value opportunities remain in node-level conversion, protection and safety controls.
A few factors driving the change:
- Low-voltage current becomes increasingly difficult to manage . Power equals voltage x current. A 250kW rack supplied at 50V requires roughly 5,000A; at 800V the same load only requires ~313A. The high current requires much more copper, increases resistive losses and heats and makes the connectors, busbars and fault management harder.
- Power hardware competes with compute for valuable rack space . T oday's systems contain server PSUs or rack-level power shelves, busbars, capacitors and controllers that occupy space otherwise available for GPUs, CPUs, networking and cooling. Moving bulky power hardware upstream or into adjacent power racks frees valuable compute space and simplifies servicing.
- High voltage distribution is more efficient . Resistive loss increases with the square of current. Reducing current lowers the copper requirements and distribution losses, while allowing more power to be delivered through the cables and connectors.
- Energy storage is becoming more tightly integrated into AI power architecture. Large synchronized training and inference workloads can create rapid changes and surges to demand. Centralizing batteries, capacitors and controls allow power to be buffered and managed across multiple compute racks rather than independently inside each rack.
Figure 25: Higher distribution voltage dramatically reduces current requirements
| Rack power | Current at 50V | Current at 800V |
|---|---|---|
| 100kW | 2,000A | 125A |
| 250kW | 5,000A | 313A |
| 500kW | 10,000A | 625A |
| 1MW | 20,000A | 1,250A |
Source: UBS. Illustrative current for power / voltage. Excludes conversion losses and redundancy
The architecture is migrating through four overlapping stages
We expect AI power delivery to migrate through an evolutionary transition to a fully native 800VDC architecture between now and the end of the decade. The infrastructure should upgrade as the hardware upgrades to higher power systems, safety standards mature and the industry develops reliable power delivery to meet each upgrade stage. We view a staged transition over time for the AC/DC conversion, energy storage and controls to navigate upstream while higher voltage DC is carried progressively deeper into the IT rack toward a high ratio DC/DC stage closer to the accelerator.
We see the progression through the following stages:
- Distributed server PSUs: The first stage of AI hardware which persisted through NVIDIA's Ampere and Hopper generation and early ASIC accelerator racks from 2021-2024, the 415/480VAC reached the IT rack through the busway. Once inside the server, it was converted with an AC-DC power supply unit (PSU) to 12V or 48VDC before board-level point-of-load regulation by a DC-DC module. The server PSUs still carry on with general CPU servers using this architecture.
- Centralized rack power shelf. In the 2nd stage which is now industry mainstream for the NVIDIA Blackwell generation and ASIC rack hardware from Google and Amazon, server-level AC/DC conversion consolidates into a rack-level power shelf feeding a 48/54VDC busbar. The downstream 48V-to-12V-to-corevoltage conversion chain remains largely unchanged.
- 400+/- and 800VDC power rack. In the upcoming stage that would see initial shipments from late 2026-27 alongside Rubin and upcoming ASIC racks from Google, Amazon, and Meta, we see adjacent power racks converting 415/480VAC to 400+/-VDC or 800VDC. As an evolutionary step, these power racks could upgrade to larger row level power blocks (2.5MW) or facility level power centers (6.5MW) to deliver power to multiple IT racks. The power rack centralizes the DC link, ride-through or energy storage, protection and system controls. In the upcoming generation, transitional designs step the 800V power inside the rack to 48/54V inside the IT rack. Once it matures further, more native designs will carry 800V through a busbar deeper into the rack and perform highratio conversion down to low voltage close to the compute node.
- Potential SST end-state: We see development underway to consolidate the medium voltage transformer and rectification later in the decade with a solid-state transformer (SST). The SST converts the medium-voltage AC directly to isolated 800VDC for distribution across the data hall, replacing the conventional linefrequency transformer and separate downstream rectification stages. Once inside the rack, an 800V busbar can span the system to deliver power to the server board for high ratio conversion to low voltage for use by the GPU.
We view the transition to high-voltage DC redistributing the power stack rather than eliminating it. The 800V power-rack phase may initially be additive to content per watt, as centralized rectification, storage, protection, controls and HVDC distribution are introduced while much of the existing low-voltage chain remains. Native 800V later removes the intermediate 48/54V layer, but raises the value and technical requirements of high-ratio node-level DC/DC conversion, high-voltage protection, connectors, busbars and telemetry. We therefore see a barbell of opportunity in larger centralized power systems upstream and higher-value conversion and protection close to the silicon downstream.
Four stages of grid-to-chip power architecture
AC/DC conversion moves upstream as higher-voltage distribution pushes DC/DC conversion closer to silicon
GREY SPACE • FACILITY ELECTRICAL
WHITE SPACE • DATA HALL
Figure 26: Higher voltage distribution shifts rectification upstream and final DC/DC closer to the silicon
MEDIUM- / LOW-VOLTAGE
DIRECT GRID CONVERSION + RESILIENCE
POWER
SUPPLY
LEGACY
DISTRIBUTED
CONVERSION
POWER
SHELF
CENTRALIZED
RACK-LEVEL
AC/DC
POWER
RACK
800 vDC|
DISTRIBUTION
SST or
Facility
Rectifier
SOLID-STATE
TRANSFORMER
MVAC to 800VDC
EVOLUTION
DIRECT AC FEED
Source: OCP, NVIDIA, Infineon, Eaton, Lite-On, Delta, Vertiv
The following section breaks down which components are added, retained or removed at each transition, and the resulting implications for content per rack and content per watt.
800V offers power electronics content expansion
The transition to higher-voltage DC alters both the placement of power hardware and the sources of value creation. In current architectures, a significant share of conversion, short-duration backup, and low-voltage distribution is housed within the IT rack. As rack density increases, the larger and less space-efficient elements of the power stack gradually shift upstream-initially to centralized rack power shelves, then to nearby 800V power racks, and eventually to row- or facility-level conversion. Meanwhile, the final DC/DC conversion required by the accelerator moves in the opposite direction, increasingly closer to the silicon.
We view the 800V offering a step-up of power electronics on a per watt basis. The transition offers new content in high voltage rectification, energy storage, DC distribution, protection and near-chip DC/DC conversion which more than offsets some mid-term elimination of low voltage AC-DC components.
NVIDIA's published roadmap and its discussions at GTC (link) and OCP Asia (link) show it actively driving its supply chain toward a phased transition to 800V DC. It introduced MGX compatible 800VDC power rack to start initial production alongside Rubin and mid-term is developing with the power supply vendors row-level power centers using 800VDC busways and longer-term facility scale DC power blocks that convert medium voltage power directly to 800VDC.
TRANSFORMER
1
2
3
4
SERVER
Board DC/DC / POL
Rising rack density centralizes front-end power while pushing final conversion closer to the xP
ARCHITECTURE GENERATION
2017-2023
2024-2025
2026-2027
Figure 27: Power architecture shifts upstream - conversion closes in on silicon
EMBEDDED POWER RACK LEVEL POWER
Conversion is distributed across every server;
conversion hardware as rack power scales
- UPSTREAM
PSU / RECTIFICATION • BATTERY BACK-UP / BBU
SIDE CAR / CENTRALIZED POWER
POWER DISTRIBUTION • PROTECTION
Source: Lite-On, UBS
Major components of the AI power BOM
We summarize the power chain into five major content buckets:
- AC-to-DC power conversion. Historically AC to DC conversion was handled by individual PSUs but is increasingly centralized within rack-level power shelves. With the move to 800V architecture, the PSUs would shift into a dedicated power rack and longer term into facility level conversion such as an SST.
- Energy storage and ride-through. Energy storage systems including battery back-up units (BBUs), capacitor back-up units (CBUs) or supercapacitor shelves provide continuity during short disturbances and buffer the rapid power changes generated by large synchronized AI workloads. The architectural change is increasingly toward pooling this capacity across multiple compute trays or racks rather than duplicating it inside each server. For 800V, centralized BESS (battery energy storage systems) could provide back-up power to the 800V busway to deliver to the IT racks.
- Distribution, protection and controls. The power distribution network includes busbars, cables, input and output PDUs, disconnects, fuses/contactors, pre-charge circuitry, isolation monitoring and power-management controllers. These components rise in importance at 800V because DC fault interruption, safe servicing and protection coordination become more demanding.
- Intermediate DC/DC conversion. The DC-DC conversion takes the distribution voltage down to a level that can be handled near the compute tray holding the accelerators. Today this often means converting 48/54V to ~12V. During the initial 800V transition it can mean converting 800V to 48/54V followed by the existing 48/54V-to-12V stage. In a more native architecture, the intermediate 48/54V layer can disappear and a high-ratio converter takes 800V directly toward ~12V near the compute node.
- Point-of-load (POL) voltage regulator modules (VRMs) as the last conversion step . The POL VRMs take the intermediate voltage down to the very low core voltage power required by the GPU, CPU and memory. The value of conversion immediately adjacent to increasingly expensive processors becomes more critical. Vertical power delivery is starting to move the VRM from beside the accelerator to the backside of the PCB directly beneath it, sharply shortening the high current, low-voltage path. We see the transition first from ASICs from Amazon and Google and extending to NVIDIA from the Feynman generation.
We discuss the architecture transition from current systems through the coming years moving toward facility level 800V power distribution.
Stage 1: Distributed server power for smaller systems with tens of kW
Early AI GPU platforms including Ampere and Hopper and many first-generation ASIC systems use a distributed power architecture. Facility AC is delivered to the rack and split among individual server or compute-tray power supply units. Each PSU converts the AC input to a 12-50V intermediate bus, after which board-level DC/DC converters and point-of-load voltage regulator modules generate the low-voltage rails required by the processor, memory and other components.
This architecture is modular and straightforward to service, but repeats rectifiers, bulk capacitors, fans, controllers and input cabling across each server. That duplication is manageable when rack loads remain in the tens of kilowatts, with power continuity generally provided by upstream UPS and generator infrastructure rather than large amounts of dedicated rack-level storage. As rack power rises, however, a growing share of rack volume, airflow and copper is consumed by power hardware rather than compute. The opportunity in this stage is therefore dominated by conventional PSUs and board-level conversion: absolute content rises with server wattage, but there is relatively little architectural content expansion.
In our current model, a Hopper-class rack contains roughly US$19k of rack-to-chip power-electronics content, including approximately US$13k of server PSU content. We use this as the baseline against which the larger power shelves, energy storage, protection and DC/DC content introduced in subsequent stages are measured.
Stage 2: Shift to centralized 48/54V power shelves for more free server space
Blackwell and many current CSP ASIC architectures move AC/DC conversion out of individual compute trays and into shared rack-level power shelves. Modular PSUs operate in parallel and feed a common 48/54V busbar, while intermediate bus converters and VRMs remain within the compute trays and continue stepping voltage down toward the accelerator. This reduces duplicated conversion hardware, makes modules easier to service and frees more of the server chassis for compute.
Figure 28: AI power conversion scales from server PSUs to 110kW rack-level power shelves
| IT Rack Content | NVIDIA Hopper | NVIDIA Grace Blackwell | NVIDIA Grace Blackwell | NVIDIA Vera Rubin | NVIDIA Vera Rubin |
|---|---|---|---|---|---|
| AC-DC Related Content | H100/200 HGX 32 | GB200 NVL72 | GB300 NVL72 | VR200 NVL72 | VR300 NVL72 |
| Rack / System IT Power (kW) | 45 | 120 | 140 | 227 | 250 |
| Shelf / System | Server PSU AC 12-50VDC | 33kW Shelf AC 50VDC | 33kW Shelf AC | 110kW Shelf 415/480VAC | 110kW Shelf 415/480VAC |
| Input | |||||
| Output | 50VDC | 54V DC | 54V DC | ||
| Location | Server PSU | IT Rack | IT Rack | IT Rack | IT Rack |
| PSU Modules (kW) | 3.3 | 5.5 | 5.5 | 18.3 | 18.3 |
| PSU # | 24 | 36 | 48 | 24 | 24 |
| Installed PSU capacity (kW) | 79 | 198 | 264 | 439 | 439 |
| Installed PSU capacity / rack TDP (x) | 1.76 | 1.65 | 1.89 | 1.93 | 1.76 |
| PSU ASP (US$/W) | $0.13 | $0.12 | $0.12 | $0.13 | $0.13 |
| AC-DC PSU Modules (US$) | $10,296 | $23,760 | $31,680 | $57,096 | $57,096 |
| PSU shelf Chassis Count | 4 | 6 | 8 | 4 | 4 |
| PSU shelf ASP (US$) | $750 | $2,000 | $2,500 | $5,000 | $5,000 |
| Power Shelf (US$) | $3,000 | $12,000 | $20,000 | $20,000 | $20,000 |
| Shelf Controller Count | 4 | 6 | 8 | 4 | 4 |
| Shelf Controller ASP (US$) | $50 | $200 | $250 | $500 | $600 |
| Shelf Controller (US$) | $200 | $1,200 | $2,000 | $2,000 | $2,400 |
| Power Conversion Related Content | $13,496 | $36,960 | $53,680 | $79,096 | $79,496 |
| Front-end conversion content per IT Watt (US$) | $0.30 | $0.31 | $0.38 | $0.35 | $0.32 |
Source: Company Data, UBS, Lite-On, Delta, Infineon
The product progression is material. Blackwell systems use 5.5kW modules assembled into 33kW-class 50V power shelves, while next-generation platforms move toward 18.3kW three-phase modules and 110kW-class 54V shelves. Actual redundancy and shelf configurations vary by customer, but the broad direction is clear: power conversion is becoming larger, shared and increasingly system-level rather than remaining an independent component inside each server.
The transition to larger rack-level power shelves is not unique to NVIDIA. AMD and the major CSP ASIC platforms are following the same broad path as rack power rises, although front-end conversion content varies materially with tray count, rack partitioning and redundancy rather than TDP alone.
OpenAI's Jalapeño is the clearest outlier: its 128-ASIC accelerator rack is paired with a separate 16-tray CPU host rack, with the accelerator and host racks consuming approximately 130kW and 31kW in production, respectively. The two-rack topology adds another set of shelf, controller and distribution hardware, while the high installed PSU capacity in our model also appears to reflect substantial redundancy and provisioning margin. We therefore view Jalapeño's higher PSU content as primarily a system-architecture decision-not simply a function of accelerator power-with exact active and redundant PSU configurations remaining subject to further disclosure.
Figure 29: AMD and ASIC power conversion also scaling up from 33kW to 72kW shelves
| IT Rack Content | AMD | AMD | Amazon | Meta | Microsoft | OpenAI | |
|---|---|---|---|---|---|---|---|
| AC-DC Related Content | MI300 32 | MI455 72 | Trainium 3 32 | TPU 8t | MTIA 400 | Maia 200 | OAI Jalapeno |
| Rack / System IT Power (kW) | 40 | 235 | 65 | 90 | 110 | 75 | 180 |
| Shelf / System Input Output Physical Architecture | 33kW Shelf AC 50VDC Single IT Rack | 74kW Shelf AC 50VDC Single IT Rack | 51kW shelf AC 50VDC Single IT Rack | 72kW Shelf AC 50VDC Single IT Rack | 72kW Shelf AC 50VDC Single IT Rack | 72kW Shelf AC 50VDC Single IT Rack | 39.6kW Shelf AC 50VDC 1 host+1 ASIC rack |
| PSU Modules (kW) | 5.5 | 12.3 | 8.5 | 12 | 12 | 5.5 | 6.6 |
| PSU # | 12 | 36 | 12 | 12 | 12 | 18 | 72 |
| Installed PSU capacity (kW) Installed PSU capacity / rack TDP (x) PSU ASP (US$/W) | 66 1.65 $0.12 | 444 1.89 $0.13 | 102 1.57 $0.13 | 144 1.60 $0.13 | 144 1.31 $0.13 | 99 1.32 $0.12 | 475 2.64 $0.13 |
| AC-DC PSU Modules (US$) | $7,920 | $13,260 | $18,720 | $18,720 | |||
| PSU shelf Chassis Count PSU shelf ASP (US$) | 2 | $57,720 | 2 | 2 | 2 | $11,880 | $61,776 12 |
| $2,000 $4,000 | 6 $4,000 | $3,000 $6,000 | $3,500 $7,000 | $3,000 $6,000 | 3 $3,000 $9,000 | $3,000 | |
| Power Shelf (US$) | $24,000 | 2 | 2 $250 | 2 | $36,000 | ||
| Shelf Controller Count | 2 | 6 | 3 | 12 | |||
| Shelf Controller ASP (US$) | $200 | $500 | $250 | $200 | $200 | $200 | |
| Shelf Controller (US$) | $400 | $3,000 | $500 | $500 | $2,400 | ||
| $400 | $600 | ||||||
| Power Conversion Related Content | $12,320 | $84,720 | $19,760 | $26,220 | $25,120 | $21,480 | $100,176 |
| Front-end conversion content per IT Watt (US$) | $0.31 | $0.36 | $0.30 | $0.29 | $0.23 | $0.29 | $0.56 |
Source: UBS, Lite-On, Delta, Infineon, UBS Estimates. OpenAI Jalapeño represents a two-rack host-plus-accelerator system. Approximately 160kW reflects estimated production power; provisioned power is approximately 180kW.
Higher power-shelf complexity keep the PSUs from commoditizing
The move from a 5.5kW module to an 18.3kW module is more than an increase in component count. At this level, suppliers must combine three-phase power-factor correction, high-efficiency isolated conversion, greater heat-flux management, fast response to AI workload transients, active current sharing, hot-swap capability, redundancy, telemetry and coordinated protection within a tightly constrained rack form factor.
Infineon's 18kW reference design illustrates the engineering required: it targets 97.5% peak efficiency, roughly 100W/in³ power density, 20ms of integrated hold-up and support for electrical design peak loads of up to 180%. It also uses SiC and GaN devices, advanced magnetics and real-time digital control. At 18.3kW, even a 0.5 percentagepoint efficiency difference equates to approximately 92W of additional heat per module, or more than 500W across six modules. Efficiency, transient performance and thermal reliability therefore have direct consequences for rack density and operating cost.
Power shelves also need to operate as part of a larger system. The supplier must manage parallel operation, droop or active current sharing, N+1 redundancy, high-power-factor performance under dynamic GPU loads, shelf-level monitoring and communication with the BBU, PMM and rack controller. These requirements, combined with platform qualification and customer-specific validation, differentiate higher-power shelves from lower-value commodity power products.
Despite these improvements, 48/54V distribution eventually reaches a physical limit. A 200kW load at 50V requires roughly 4,000A, while a 1MW load would require approximately 20,000A. The resulting busbars, connectors and copper become too large, heavy and lossy, and the number of power shelves begins to consume a material share of the IT rack. In our current configuration, GB200/GB300 already requires multiple 33kW shelves; extending the same approach toward a megawatt would be impractical.
Additional Rack Level Energy storage (BBUs/CBUs) is optional
The transition to rack-level shelves also creates a natural location for energy storage, but not every deployment requires the same solution. Solutions can span capacitors close to the rack for rapid support of GPU power swings to BESS near the utility connection for longer-duration load averaging and support during extended periods of power loss.
- PSU-integrated capacitors: Capacitors integrated in the power shelf provide the fastest transient response and tens of milliseconds of hold-up.
- CBU / power-capacitance shelf. A CBU shelf can provide 0.1 seconds to several seconds of high-power workload smoothing.
- BBU (Battery Back-up Unit): Provides tens of seconds to several minutes of power-loss ride-through. These are more efficient for longer events over the CBU.
- UPS / BESS : Facility-level battery energy storage systems for resilience, generator transfer, load averaging and grid services.
We distinguish three implementations: batteries distributed within IT racks; BBUs consolidated into a dedicated power rack supporting one or more IT racks; and pooled batteries serving a row or facility through UPS or DC-storage infrastructure. Delta's demonstrated 660kW 800V power rack integrates 480kW of battery backup, while LiteOn has also shown an 800V power rack with integrated BBU.
These designs demonstrate that high-voltage distribution and power-rack batteries can coexist with the storage architecture flexible for data center operators. Some data centers will retain a centralized AC UPS and may need only the PSU's embedded buffer or a CBU for workload smoothing. Other data center operators may remove part of the UPS layer and use rack- or row-level BBUs for backup-source transfer. Some configurations will use both CBU and BBU because they solve different time-duration problems. A newer PSU may also integrate sufficient energy buffering to eliminate a separate capacitor shelf for part of the workload envelope. Infineon, for example, says its integrated energy-buffer design can reduce required capacitor volume and avoid a separate capacitor bank in some implementations.
Moving backup further upstream creates greater potential to reduce dedicated racklevel battery capacity, while retaining local capacitors or other fast buffers. Feedback from our Samsung SDI analyst, Tim Bush, points to some data centers transitioning toward pooled prismatic lithium iron phosphate (LFP) batteries in UPS applications starting from Rubin/Rubin Ultra-era deployments. Customer qualification and the chosen facility power design will determine the adoption path whether pooling or staying near the rack. Our market feedback suggests hyperscalers more often rely on BBU to maintain better stability for their training and inference clusters alongside capacitor shelves for better smoothing of voltage while the broader enterprise and smaller operators have UPS and generators.
The supply chain for a BBU includes the battery maker including Panasonic Energy, Samsung SDI and CATL and battery pack suppliers Dynapack, AES and STL before going to a system maker such as Delta or Lite-On for integration. For battery chemistry, LFP is itself a lithium-ion chemistry with safety and cycle-life characteristics that can be attractive for frequently cycled, pooled storage, although lower energy density can require more space for the same runtime. High-output cylindrical cells remain relevant where compactness and power delivery are priorities. The choice therefore depends on discharge power, duration, cycling, footprint and safety requirements-not simply whether the system operates at 800V.
Panasonic and Samsung SDI have different emphasis on pooled vs. rack level batteries
Panasonic has portrayed a positive outlook for its energy storage with portfolio leading on in-rack cylindrical batteries and targeting the growing BBU shelf opportunity in the power rack. Its disclosed roadmap includes higher-output BBUs, BBUs for power racks and CBUs, with HVDC-compatible BBUs and first-generation CBUs scheduled to begin mass production within the fiscal year ending March 2027. Panasonic also states that products included in its medium-term sales plan have secured customer awards, which it defines as agreements covering development initiatives and orders. This supports continued distributed-storage opportunities even as some backup shifts upstream.
Samsung SDI has exposure to both distributed and centralized battery demand. Its current portfolio includes high-nickel cylindrical BBU cells and prismatic lithiummanganese-oxide UPS batteries, while it is preparing prismatic LFP production for ESS and UPS applications. Its July results also outlined expansion of high-power cylindrical capacity for BBU demand into the US. We therefore see SDI as positioned to pursue a chemistry and location shift, rather than requiring conventional BBUs to disappear. Panasonic, meanwhile, sells modules and storage-system solutions as well as cells; its revenue opportunity should not be compared directly with cell-only BBU market estimates.
Power supply vendors: Delta and Lite-On still have value in energy storage integration
Even where the underlying cells are purchased from a third party, the BBU is a qualified power-electronics and safety subsystem. The vendor integrates bidirectional charger, battery management, contactors, fuses, disconnect and fault isolation, thermal management, shelf controls, telemetry and rack level communications and mechanical integration, serviceability and lifetime assurance.
The value added by Delta or Lite-On is therefore the ability to guarantee high-current charge/discharge behavior and safe system operation under a defined transient and backup envelope-not merely assembling cells into a metal pack. Lite-On's rack-level solution, for example, emphasizes DC-coupled backup, PSU-BBU firmware coordination and multilayer battery protection. Panasonic's own cell-to-module and system capabilities also mean that the division of value between battery suppliers and powersystem integrators varies by customer.
Both Delta and Lite-On can benefit when BBUs remain within IT racks or dedicated power racks. Delta has a broader route to follow storage further upstream, given its established UPS portfolio and energy-storage systems integrating power conversion, batteries and controls. We therefore view Delta as better positioned to pursue pooledstorage opportunities, but not automatically insulated from lost BBU revenue: capturing the replacement system still requires customer wins and competitive execution.
Lite-On's demonstrated strengths are more concentrated in rack-level conversion, coordinated BBU and 800V power racks. We consequently see greater architecture sensitivity if customers move substantial battery content beyond the power rack into separately procured facility storage. It could retain conversion, controls and local buffering content, but recapturing the displaced battery dollars would require additional system participation or partnerships. The distinction is therefore broader upstream opportunity for Delta versus greater exposure to rack/power-rack storage for Lite-Onnot an automatic winner and loser from LFP adoption.
In our model, total power-electronics content rises from approximately US$19k per Hopper rack to US$66k for GB200 and US$96k for GB300, driven by higher rack power, larger shared power shelves, rack busbars, management electronics and optional storage. By Vera Rubin, our integrated 48/54V cases reach approximately US$169k for VR200 and US$184k for VR300. A shift to more pooled memory and lower rack-level attachment would not mean lower storage demand across the entire data center, but it can reduce our defined rack-and-power-rack TAM.
Figure 30: Storage and near silicon conversion lift power content faster than rack TDP
| IT Rack Content | NVIDIA Hopper | NVIDIA Grace Blackwell | NVIDIA Grace Blackwell | NVIDIA Vera Rubin | NVIDIA Vera Rubin |
|---|---|---|---|---|---|
| H100/200 HGX 32 | GB200 NVL72 | GB300 NVL72 | VR200 NVL72 | VR300 NVL72 | |
| Front-end AC/DC conversion, shelf and controls | $13,496 | $36,960 | $53,680 | $79,096 | $79,496 |
| Front-end conversion content per IT Watt (US$) | $0.30 | $0.31 | $0.38 | $0.35 | $0.32 |
| BBU Density (kW) | 36 | 99 | 132 | 240 | 240 |
| BBU Module ASP per W(US$) | $0.20 | $0.20 | $0.20 | $0.20 | $0.20 |
| BBU attach (rack level) | 10% | 25% | 40% | 50% | 50% |
| BBU subsystem (US$) (Attach-Rate Weighted) | $720 | $4,950 | $10,560 | $24,000 | $24,000 |
| Capacitor Content | $16,000 | $32,000 | $40,000 | $64,000 | $80,000 |
| CBU shelf attach | 0% | 5% | 10% | 10% | 15% |
| CBU/Capacitance Shelf (US$) (Attach-Rate Weighted) | $0 | $1,600 | $4,000 | $6,400 | $10,800 |
| Intermediate DC/DC and PDB Module (US$) | $640 | $4,680 | $6,048 | $9,936 | $11,232 |
| GPU POL VRM Module (US$) | $3,226 | $8,518 | $10,483 | $30,139 | $34,070 |
| Busbars, distribution, cabling and rack hardware | $1,000 | $10,000 | $11,000 | $20,000 | $24,000 |
| IT / System Rack Power Content (US$) | $19,082 | $66,708 | $95,771 | $169,571 | $183,598 |
| Rack ODM ASP (US$) | $1,100,000 | $3,036,000 | $4,000,000 | $8,460,000 | $10,998,000 |
| Power content per Rack BOM (%) | 1.7% | 2.2% | 2.4% | 2.0% | 1.7% |
| Power content per wattage (US$) | $0.42 | $0.56 | $0.68 | $0.75 | $0.73 |
Source: UBS, Lite-On, Delta, Infineon, UBS Estimate
Extending the same rack-to-chip methodology beyond NVIDIA suggests that the powerelectronics opportunity is broad-based across AMD and custom ASIC systems. Excluding OpenAI's two-rack design, our modelled content ranges from approximately US$0.56/ W for MI300 to US$0.79/W for Trainium 3, with MI455, Google TPU v8i, Meta MTIA 400 and Microsoft Maia 200 clustering around US$0.63-0.71/W-broadly comparable with our estimates for Blackwell and Vera Rubin. The mix varies more materially than the total: BBU and CBU attachment raises storage content for some hyperscalers, while higher current density increases the value of intermediate DC/DC conversion, POL VRMs, busbars, cabling and rack hardware. OpenAI's Jalapeño is the outlier at approximately US$0.80/W in our model, largely reflecting its separate host and accelerator racks and unusually high installed PSU capacity; the precise active-versus-redundant configuration remains less certain. Overall, power content per watt appears to be determined at least as much by rack topology, redundancy and energy-storage strategy as by whether the compute engine is an NVIDIA GPU, AMD GPU or custom ASIC.
Figure 31: AMD and custom ASIC power content is broadly similar to NVIDIA on a per-watt basis
| IT Rack Content | AMD | AMD | Amazon | Meta | Microsoft | OpenAI | |
|---|---|---|---|---|---|---|---|
| MI300 32 | MI455 72 | Trainium 3 32 | TPU 8t | MTIA 400 | Maia 200 | OAI Jalapeno | |
| Front-end AC/DC conversion, shelf and controls | $12,320 | $84,720 | $19,760 | $26,220 | $25,120 | $21,480 | $100,176 |
| Front-end conversion content per IT Watt (US$) | $0.31 | $0.36 | $0.30 | $0.29 | $0.23 | $0.29 | $0.56 |
| BBU Density (kW) | 33 | 240 | 66 | 66 | 99 | 80 | 99 |
| BBU Module ASP per W(US$) | $0.15 | $0.15 | $0.15 | $0.15 | $0.15 | $0.15 | $0.15 |
| BBU penetration (rack level) | 10% | 25% | 70% | 80% | 80% | 80% | 0% |
| BBU subsystem (US$) (Attach-Rate Weighted) | $495 | $9,000 | $6,930 | $7,920 | $11,880 | $9,600 | $0 |
| Capacitor Content | $16,000 | $16,000 | $16,000 | $16,000 | $16,000 | $16,000 | $16,000 |
| CBU shelf penetration | 3% | 15% | 10% | 20% | 10% | 10% | 0% |
| CBU/Capacitance Shelf (US$) (Attach-Rate Weighted) | $480 | $9,600 | $2,400 | $4,800 | $3,200 | $2,400 | $0 |
| Intermediate DC/DC and PDB Module (US$) | $4,800 | $8,280 | $4,320 | $3,072 | $10,368 | $6,480 | $10,109 |
| GPU POL VRM Module (US$) | $2,184 | $30,139 | $13,104 | $9,318 | $7,862 | $8,736 | $20,966 |
| Busbars, distribution, cabling and rack hardware | $2,250 | $23,000 | $5,000 | $5,500 | $11,000 | $4,500 | $12,500 |
| IT / System Rack Power Content (US$) | $22,529 | $164,739 | $51,514 | $56,830 | $69,430 | $53,196 | $143,751 |
| Power content per wattage (US$) | $0.56 | $0.70 | $0.79 | $0.63 | $0.63 | $0.71 | $0.80 |
Source: UBS, Lite-On, Delta, Infineon, UBS Estimates. OpenAI Jalapeño represents a two-rack host-plus-accelerator system. Approximately 160kW reflects estimated production power; provisioned power is approximately 180kW.
Stage 3: The 800V power rack is likely the most contentadditive transition
Once rack demand reaches several hundred kilowatts, the constraint is no longer only the capacity of individual PSUs. The combination of low-voltage current, copper, connectors, airflow and rack space becomes the binding limitation. At 1MW, a 50V architecture would carry approximately 20,000A, compared with approximately 1,250A at 800V. Moving to 800V therefore reduces current by roughly an order of magnitude and allows much more power to be delivered through a manageable number of cables and busbars. Delta at Semicon Taiwan 2026 showed how a busbar that carries the power through a rack at 54V would need to be 518mm thick and weigh 511kg. At 800V, the busbar width compresses to 35mm and weight to 35kg.
Delta's 800VDC in-row architecture uses 110KW shelves and 18.5kW modular PSUs
COMMON POWER BLOCK
6 active shelves x 110kW = 660kW DC output
WITH BBUs
PSU CONTENT
BBU CONTENT
RACK SPACE
RESILIENCE
EFFICIENCY
INVESTOR LENS
backup embedded in each shelf
WITHOUT BBUs
800 VDC
two complete shelves redundant
The initial 800V architecture is likely to be a localized in-row power rack or sidecar that is deliberately evolutionary. Existing 415/480VAC infrastructure feeds the power rack sidecar which converts and distributes the power 800VDC. The IT rack can then step 800V back down to 48/54V and retain much of the existing IBC and VRM architecture. That is important for both adoption and content. It avoids requiring the industry to redesign the entire rack and node power chain simultaneously, but it also means the initial 800V transition adds a new high-voltage layer before eliminating the old lowvoltage one. NVIDIA describes this as a transitional retrofit architecture: it is not the most efficient ultimate design because it retains additional conversion equipment, but it enables 800V compute racks to operate within existing AC data halls. Schneider similarly views rack-level conversion as the most practical initial deployment because it can retain conventional upstream AC UPS and limit early fault or protection issues to a smaller zone.
A typical 800V power rack contains modular AC/DC power shelves, rectifier modules, DC PDUs, busbars, cables, contactors, fuses, pre-charge circuitry, isolation and monitoring, together with optional BBU or CBU capacity. Delta's announced 660kW inrow system for NVIDIA for example uses six 110kW shelves and target up to 98% power efficiency. In the BBU configuration, six active shelves deliver 660kW of power and integrate 24x20kW BBU modules or 480kW of back-up power. The non-BBU configuration instead uses 8 power shelves in a 6 + 2 arrangement, adding 6 active shelves and 2 redundant shelves with 12 additional PSU modules. Thus the same 660kW rated output and vary on PSU vs. BBU content depending on the required resilience.
Figure 32: 660kW 800VDC power rack: BBU configuration adds 480kW back-up; non-BBU configuration uses 880kW installed conversion capacity in a 6+2 shelf architecture
Source: Delta Electronics Semicon Taiwan 2026 materials and press releases, NVIDIA, UBSe
The IT rack also gains important new content. Transitional systems may convert 800V to 48/54V and then to 12V, while the native NVIDIA direction is to move high-ratio 800Vto-12V conversion close to the GPU, eliminating intermediate conversion stages before the final VRM. NVIDIA estimates that direct conversion can improve efficiency and reduce the area required near the GPU versus a multi-stage power tree. The architecture has another underappreciated advantage: removing conversion and storage hardware from the IT rack frees scarce U-space, thermal headroom and servicing access for revenue-generating compute. The economic benefit therefore extends beyond powersystem efficiency itself.
From an investment perspective, the initial 800V power-rack transition may be the most content-rich part of the transition. The architecture temporarily adds high-voltage rectification, protection and distribution while retaining substantial downstream DC/DC and POL content in the IT rack.
POWER PATH AND COMPONENT MAP
415 / 480 VAC FACILITY INPUT
BBU ATTACHMENT: BOM IMPLICATIONS
WITHOUT BBU
WITH BBU
Figure 33: 800 VDC centralizes front-end power outside the IT rack and expands optional BBU content
POWER RACK / SIDECAR
AC/DC POWER SHELF: 6 X 110Kw (36 X 18.3Kw PSUs
RECTIFIER /
PSU MODULE
OPTIONAL ENERGY STORAGE:
BBU 6 × 80kW sections for ride through
BBU/
CBU
BBU: Ride-through / CBU: transient smoothing
CONTACTORS
FUNCTION
delivery plus local DC ride-
through
| Higher / additional storage modules | |
|---|---|
| Cells, BMS, bidirectional converter, contactors, cooling and controls | |
| Upstream UPS retained | reduced UPS dependence |
Source: UBS, Lite-On, Delta, Schneider
Key assumptions varying content include installed vs. usable rectifier capacity after redundancy, how many IT racks or how much IT load each power racks support, BBU and CBU attachment, percent of power backed up, hold-up duration and DC-DC conversion in the rack, which will start as a transitional 800V to 54V to 12V conversion requiring additional DC-DC shelves before later moving directly to 800V through a busbar to the compute boards for 800V to 12V conversion.
Our bottom-up work suggests the initial 800V transition is content additive without requiring a large increase in value per watt. Across our Vera Rubin sidecar cases, modeled rack-to-chip power content is approximately US$0.84-0.85/W, versus roughly US$0.68-0.71/W for the preceding integrated 48/54V architecture. The increase reflects the addition of a dedicated 800V power rack-including rectification, high-voltage distribution and protection and probability-weighted energy storage-while the IT rack initially retains substantial DC/DC, distribution and POL content. Absolute dollar content therefore scales rapidly with rack power: our model increases from approximately US $192k for a 227kW VR200 system to approximately US$469k for a 550kW configuration, despite relatively stable content intensity within the 800V architecture.
Native 800V changes the mix rather than eliminating the opportunity. As the 54V layer is removed, some low-voltage busbar and intermediate conversion content can decline, but value migrates toward higher-ratio DC/DC conversion, 800V protection and increasingly dense point-of-load power delivery. Our modeled 1.2MW Feynman powerrack architecture therefore remains near US$0.89/W of rack-to-chip power content. A subsequent facility-level SST architecture could lift modelled content further-to approximately US$1.21/W in our current case-as medium-voltage transformation and rectification shift from conventional magnetic equipment toward semiconductor-rich power conversion. These estimates remain architecture dependent, but importantly our TAM assumes rising system power and changing content location rather than simply extrapolating higher PSU prices.
IT RACK
IT-RACK ENTRY PROTECTION
Figure 34: 800V raises power content adding DC-DC distribution and optional storage attach
| VR200 | VR300 | VR300 Kyber (delayed) | RF200 | RF200 / SST | |
|---|---|---|---|---|---|
| IT/system power (kW) Power architecture | 227 Side-car | 250 Side-car | 550 Side-car | 1,200 Large Power Rack | 1,200 Facility SST |
| Power-rack capacity (kW) | 660 | 880 | 880 | 2,016 | 2,016 |
| IT racks / power rack allocation | 2.0 | 2.0 | 1.0 | 1.0 | 1.0 |
| BBU attach assumption% | 40% | 40% | 40% | 50% | 50% |
| CBU attach assumption% | 5% | 10% | 15% | 20% | 20% |
| Power-rack content per IT rack | $108,192 | $135,690 | $294,379 | $631,080 | $1,011,600 |
| IT-rack DC/DC distribution | $58,436 | $63,732 | $119,464 | $284,340 | $284,340 |
| POL/VRM | $30,139 | $34,070 | $68,141 | $157,248 | $157,248 |
| Total IT Rack Downstream Content | $88,575 | $97,802 | $187,605 | $441,588 | $441,588 |
| Total Power Content / System | $196,767 | $233,492 | $481,984 | $1,072,668 | $1,453,188 |
| Power Content / IT Watt | $0.87 | $0.93 | $0.88 | $0.89 | $1.21 |
| Power Content / Rack BOM | 2.3% | 2.2% | 2.5% | 2.0% | 2.7% |
Source: Company Data, UBS. Power rack content includes attach rate weighted BBU/CBU where applicable; shared power rack content is allocated to IT racks based on the modelled deployment ratio
We extend the same bottom-up framework to potential next-generation AMD and custom ASIC systems. While final rack configurations are not yet settled, our current estimates suggest broadly similar power-content intensity of approximately US$0.80$0.94/W across AMD MI500, Google TPU v9, and AWS Trainium 4. Differences primarily reflect assumed rack power, power-rack sharing, redundancy and downstream DC/Dc requirements rather than fundamentally different power architectures. This supports our view that the 800V opportunity is driven by rising AI rack density across the industry, rather than being specific to NVIDIA's roadmap.
Figure 35: Content for potential next-gen AMD and ASIC 800V systems
| AMD MI500 256 | Google TPU v9 | AWS Trainium 4 | |
|---|---|---|---|
| System/rack power | 1,000 | 200 | 330 |
| 800V architecture | Sidecar | Sidecar | Sidecar |
| Power-rack content per IT rack | $498,960 | $120,592 | $215,900 |
| Total IT Rack Downstream Content | $329,262 | $73,976 | $89,878 |
| Total Power Content / System | $828,222 | $194,568 | $305,778 |
| Power Content / IT Watt | $0.83 | $0.97 | $0.93 |
Source: UBS estimates
+/- 400V ASIC racks change the power-rack topology more than the total BOM content vs. 800V racks
The transition to higher-voltage DC is unlikely to follow a single architecture across every hyperscaler. Our checks suggest AWS may retain a ~50V power-rack architecture for Trainium 3 as an interim step, while Google and Meta are considering an earlier move to bipolar ±400VDC with 30% penetration of their 2027 racks shifting to this architecture. Importantly, ±400VDC is not simply a 'lower-voltage' alternative to 800V: the positive and negative rails are 800V apart, allowing a balanced system to capture broadly similar current and copper benefits while limiting each conductor to roughly 400V relative to the midpoint/reference.
Google's Mt. Diablo work with Meta and Microsoft explicitly targets ±400VDC delivery from a disaggregated sidecar supporting high-density IT racks up to 1MW, with the ability to leverage the established 400V EV supply chain an additional potential advantage. Vertiv's presentation of Mt. Diablo further illustrates the breadth of the sidecar architecture, combining power conversion, distribution, and BBU/CBU storage in alternative power-rack configurations. This supports our view that externalizing bulk conversion can relocate energy storage into the power rack rather than eliminate it. We would also point out OCP identifies a future Mt. Diablo 2.0 specification supporting native 800V as indicator the ±400V is an evolutionary path to 800V.
From a content perspective, our checks with Delta suggest ±400V and single-bus 800V should carry broadly similar power-rack BOM per kW. Both require high-power AC/DC rectification, HVDC distribution, optional BBU/CBU storage, busbars and cabling, contactors, fuses, pre-charge, sensing and controls, rack-entry protection and downstream high-ratio DC/DC conversion. Delta's newly demonstrated 840kW ±400V
Five 180 kW shelves provide 900 kW installed capacity versus an 840 kW system rating; Delta cites N+2 redundancy and battery charging.
FACILITY
IN-ROW POWER RACK
in-row rack shown at Semicon Taiwan provides a useful real-world example: five 180kW power shelves provide 900kW of installed conversion capacity versus an 840kW system rating, with Delta citing N+2 redundancy and battery charging, while BBU or CBU storage can be configured separately. Delta's discussion at Semicon Taiwan of a 900kW-class installed power architecture and Mt Diablo's support for up to 1MW power racks also supports our view that ASIC rack power density can rise materially over the coming years, expanding the addressable power opportunity and increasing the relevance of dedicated side cars.
3
180 kW POWER SHELF
"2 pes for redundancy & battery
ASIC IT RACK
HIGH-DENSITY ASIC COMPUTE
*400 VDC / 800 VDC
LINE-TO-LINE ENTERS RACK
LOCAL DC/DC
CONVERSION
The main differences are topology, grounding and component mix rather than a fundamentally different architecture or amount of power-electronics content. Bipolar ±400V introduces a midpoint management and protection of both poles, while allowing portions of the design to leverage established 400V EV component ecosystem. However, an 800V rail-to-rail voltage does not make ±400VDC and 0-800V supplies interchangeable: Vertiv at OCP Asia cautioned that some future IT loads may require the move to 800V. A single 800V bus is electrically simpler but can require higher-voltage switching, insulation and fault-interruption capability. We expect broadly similar functional power-system content per kW across the approaches, with differences concentrated in semiconductor voltage class, protection architecture and component count rather than a materially different total BOM.
LOW-VOLTAGE BUS
POINT-OF-LOAD
CONVERSION
ASIC + HBM
Conversion moves progressively closer to silicon
Figure 36: 840kW in-row power rack moves bulk AC/DC conversion outside the ASIC rack
OPTIONAL STORAGE CHANGES RESILIENCE AND POWER-RACK CONTENT
CONVERSION + DISTRIBUTION
Source: Delta, UBS, 900kW installed vs. 840kW rated indicates system-level redundancy/battery-charging headroom
Native 800V changes the economics again: the 54V layer can finally disappear
The transitional power-rack architecture does not capture the full benefit of highvoltage DC because it still steps the 800V supply back to 48/54V inside the compute rack. Longer term, high-voltage DC can be carried deeper into the rack and increasingly
A
C
Increasing centralization shifts conversion upstream while preserving high-value DC/DC close to compute
ARCHITECTURE EVOLUTION
Deployment timing will vary by operator and site architecture
2026+
2
2027+
2028+
3
to the compute node before a high-ratio conversion close to the accelerator. NVIDIA's planned reference design for native 800V illustrates this direction, distributing 800V to individual compute nodes where a high-ratio converter steps directly toward the 12V intermediate rail. This removes the 48/54V busbar and one layer of intermediate conversion, reducing space, copper and conversion losses close to the accelerator.
SHELF
BUS
For the supply chain, this changes the mix rather than eliminating power-electronics value. The 800V-to-54V shelf and some low-voltage distribution hardware can disappear, but they are replaced by technically more demanding high-ratio DC/DC conversion requiring higher-voltage power semiconductors, magnetics, isolation, protection and thermal management. We therefore expect value to migrate from relatively standardized intermediate conversion toward higher-value node-level conversion rather than disappear one-for-one. And regardless of whether the rack backbone is 54V, ±400V or 800VDC, the processor ultimately still requires sub-1V rails at extremely high current and transient performance, supporting continued growth in POL/ VRM content. FEEDS
INDICATIVE DOMAIN
INDICATIVE DOMAIN
INDICATIVE DOMAIN
Stage 4: Facility-level 800V moves front-end conversion into the grey space CORE EQUIPMENT Central rectifiers + switchgear CORE EQUIPMENT Prefabricated conversion block
BBU / controls optional
Shared storage / controls
Protection + cooling + controls
As 800V busways, protection equipment, standards and operating practices mature, AC/DC conversion can move farther upstream from the localized sidecar into the grey space of the data center. The first step discussed by NVIDIA and shown at the June Computex show in 2026 by Vertiv is likely to be a low-voltage power center that aggregates 400-480VAC input and supplies 800VDC to multiple racks or rows. Longer term, transformer-rectifier units, medium-voltage rectifiers or solid-state transformers can convert 13.8kV or 34.5kV power directly into 800VDC, reducing or eliminating parts of the conventional 480VAC layer.
MORE CENTRALIZED • HIGHER INPUT VOLTAGE • LARGER POWER DOMAIN
2028+
SST
GRID / FACILITY EDGE
Longer-term solid-state alternative
MV
800
AC
SiC
SST
VDC
MV AC → ISOLATED SST → 800 VDC
CONVERSION
MEDIUM-VOLTAGE AC → SST → DIRECT
800 VDC
INDICATIVE DOMAIN
MODULAR MULTI-MW
CORE EQUIPMENT
Medium-frequency isolation
SiC power stages + DC link
RATIONALE
Removes conversion stages; protection and MV insulation are gating items.
Figure 37: 800 VDC infrastructure roadmap: power conversion scales from rack side cars to multi-MW facility blocks
Source: UBS, NVIDIA, Schneider
NVIDIA describes approximately 1.5MVA low-voltage rectifier strings that can be paralleled on a common DC bus, while medium-voltage rectifier and SST concepts can reach several megawatts per unit. Schneider's roadmap similarly progresses from a roughly 660kW-1.2MW localized sidecar to 2.4-4.8MW power centers and ultimately 5-10MW facility power blocks. These figures are illustrative rather than fixed industry standards, but they show how the unit of deployment is shifting rapidly from the rack toward the multi-MW power block.
Figure 38: Power content migrates from rack-level conversion to multi-MW facility systems
| Localized 800V sidecar | Centralized LV power center | MV rectifier / SST power block | |
|---|---|---|---|
| Location | Beside IT rack | Row / data hall | Facility |
| Input | 415/480VAC | 400-480VAC | 13.8/34.5kVAC |
| Output | 800VDC | 800VDC busway | 800VDC busway |
| AC-DC Rectification scale | 0.66-1.2MW | 2.4-4.8MW | 5-10MW |
| Conversion hardware | Modular AC/DC shelves | Pooled LV rectifiers | TRU, MV rectifier or SST |
| Storage | Optional local BBU/CBU | Central DC UPS / storage | Facility BESS + local fast storage |
| Distribution | Rack cable | Row/data-hall busway | Facility DC network |
| Content implication | Highest rack-level content | Pooling and larger DC PDU | Large engineered power block |
| Unit of sale | US$/rack | US$/MW | US$/power block |
Source: UBS, Schneider, NVIDIA
A medium-voltage rectifier or transformer-rectifier unit is likely to be the more mature near-term solution because similar systems already operate in industrial applications. SSTs offer the longer-term potential to combine voltage transformation, rectification and active controls in a more compact architecture, but multi-MW power-module reliability, thermal management and protection remain development challenges.
The result is not that power-electronics content disappears. Rather, the unit of sale and location of value change:
- Rack-level rectifier modules and some BBU capacity can be pooled.
- Row/facility DC switchboards, busways and PDUs become larger.
- DC breakers, contactors, isolation, metering and protection coordination become more important.
- Energy storage can be aggregated into a centralized DC UPS or BESS.
- Software, controls, commissioning and service become more valuable.
- The IT rack still requires rack-entry protection, high-ratio DC/DC and VRM/VPD close to the xPU.
This shifts the opportunity from a relatively standardized PSU sale toward a multi-MW engineered system. It should favor suppliers with broad power-conversion portfolios, facility-integration capabilities, protection expertise, controls and field-service infrastructure.
Energy storage also becomes increasingly layered. Capacitors close to compute handle the fastest workload changes; rack- or row-level BBU/DC UPS supports short-duration ride-through; and facility BESS manages longer load averaging, source transfer and grid requirements. We therefore expect greater total storage and control content per MW, but rack-level BBU unit penetration could ultimately plateau or decline if storage becomes pooled upstream.
AI power TAM: US$91bn by 2030, built bottom-up from chips, racks, watts and power BOM
We estimate the AI server power-electronics TAM rises from US$6.6bn in 2025 to US $91.1bn in 2030, a 69% CAGR, with approximately US$285bn of cumulative powersystem content over 2025-30. We build up the power TAM opportunity platform by platform leveraging our bottom-up accelerator shipment assumptions from UBS CoWoS/HBM build assumptions for ASICs and UBS GPU unit model pulling in our coverage assumptions on AMD and NVIDIA AI GPU shipments. We convert our chip units to racks and build up TDP at the chip and rack level for announced systems with higher visibility through 2027. Beyond 2027, we extend the model using industry feedback on the expected scale-up of systems at the chip, rack and power level, while
27 27
Tranium 1
Tranium 2
Trainium 3 (32-XPU)
AWS
65
330
155
170
180
tapering deployment growth to reflect increasingly binding power and capex constraints and a normalization toward underlying hyperscaler cash-flow growth.
Our model combines two bottom-up builds: accelerator units are translated into rack deployments and supported IT watts, while architecture-specific component BOMs determine power-system content per supported IT watt. These two analyses converge in our annual TAM estimate.
Meta
Microsoft
Intel
OAI
Tesla Other
For each NVIDIA, AMD and custom-ASIC platform, we forecast accelerator units, convert these to racks using the number of accelerators per system, and estimate rack/ system IT power using package TDP and platform-level power assumptions. We then then construct the associated power-electronics BOM including PSUs/shelves/controls, battery or capacitor storage, HVDC conversion/distribution, downstream DC/DC and rack-power infrastructure, and normalize the resulting content to the IT watts supported. Our assumptions incorporate TDP , redundancy, BBU/CBU attach rates and architecture-specific changes in content as power electronics migrate from the IT rack into a separate power rack or side car and initially add additional DC-DC distribution content.
Figure 39: ASIC TDPs per rack (kW)
Source: UBS estimates
Where conversion, backup power or distribution remains integrated within the IT rack, that content is included directly in the rack BOM; where it migrates into a separate power rack or sidecar, we allocate the external power-rack content back across the IT load it supports. This allows us to compare architectures on a consistent US$/IT watt basis regardless of where the physical equipment resides.
The result is a TAM driven by three distinct variables rather than one heroic assumption: rack volume, watts per rack and power content per watt. Between 2025 and 2030, we estimate AI server rack shipments grow at only a 12% CAGR, while blended rack/system IT power rises at a 39% CAGR. Together, these drive annual AI IT capacity deployed at a 55% CAGR. Blended power-system content per watt adds a further 9% CAGR, resulting in a 69% power-TAM CAGR. Put differently, growth in IT GW deployed driven increasingly by rising rack power density rather than physical rack unit growth is the dominant TAM multiplier, with higher power content per watt providing an additional boost.
Figure 40: AI Power TAM build-up: rising watts per rack drive the majority of growth
| AI Power TAM build-up | 2024 | 2025 | 2026E | 2027E | 2028E | 2029E | 2030E | CAGR (25-30) |
|---|---|---|---|---|---|---|---|---|
| AI server rack units | 237,600 | 208,418 | 296,616 | 428,299 | 396,708 | 342,359 | 369,452 | 12% |
| TDP per rack (kW) | 40.0 | 55.4 | 89.3 | 118.5 | 170.7 | 256.9 | 282.8 | 39% |
| AI IT capacity deployed (GW) | 9.5 | 11.5 | 26.5 | 50.8 | 67.7 | 87.9 | 104.5 | 55% |
| Power content / IT Watt | $0.52 | $0.57 | $0.67 | $0.75 | $0.81 | $0.86 | $0.87 | 9% |
| AI Power TAM (US$mn) | $4,951 | $6,582 | $17,726 | $38,199 | $55,144 | $75,798 | $91,115 | 69% |
| YoY TAM Growth | 33% | 169% | 115% | 44% | 37% | 20% |
Source: UBS
We start with accelerator units, not rack shipments
200
Al Rack Units
NVIDIA NVL72+
NVIDIA (HGXLPU/CPU)
AMD
AWS
Meta
Microsoft
Tesla
Intel
OpenAl
2024
181
130,744
2025
27,034
63,000
2026E
77,506
66,303
2027E
95,098
72,941
2028E
82,000
83,188
2029E
34,429
100,016
A key input in our model is our existing bottom-up accelerator forecast leveraging memory, foundry, back-end, fabless/design service and ODM supply inputs. As detailed in Figure 15 B U S p r o j e t c i n s f A I a l h m : + 3 9 % d u C G R , we forecast bottom-up accelerator shipment forecasts across NVIDIA and AMD GPUs and the major custom-ASIC platforms, including AWS, Google, Meta, Microsoft, and OpenAI. We then apply a deployment-lag assumption under which 75% of each year's accelerator output enters rack builds in the same calendar year and 25% in the following year, reflecting system-assembly and supply-chain lead times. We align the associated rack power and power-system BOM with the same deployment cohort.
8,910
12,837
11,323
12,791
16,652
We separately model other rack types where required by the architecture. For example, a platform may place CPUs, scale-up components or power electronics in adjacent racks rather than in the main accelerator rack. The objective is not simply to count cabinets, but to determine how much IT load and associated power-system hardware is required to support the deployed accelerator base.
This bottom-up approach produces total AI server rack deployments of approximately rising from 208k in 2025, 297k in 2026, 428k in 2027, 397k in 2028, 342k in 2029 and 369k in 2030. The non-linear trajectory is important: physical rack units actually decline in several years even while power TAM continues to rise sharply.
Figure 41: AI rack units deployments peak in 2027, while rising power density sustains IT GW growth
Source: UBS
Rack power converts rack deployments into IT GW - the dominant volume driver of the TAM
We translate physical rack systems into IT watts based on accelerator package TDP , accelerator count per rack, expected system-level power and other IT loads required by the platform, including CPUs, memory, networking and rack-level electronics where appropriate. This distinction becomes increasingly important as power density rises. Our blended AI server rack/system IT power increases from approximately 55kW in 2025 to 89kW in 2026, 119kW in 2027, 171kW in 2028, 257kW in 2029 and 283kW in 2030. Within this average there is considerable dispersion: our GPU-system average reaches approximately 401kW by 2030, while the ASIC average is approximately 204kW, although we could see upside to that projection as new announced compute dense systems are announced in the out years of the forecast period.
9,000
42,361
9,340
1,192
1,415
859
22,604
20,985
2030E
27,000
111,868
9,168
148,035
44,792
105,113
10,903
1,440
1,917
391
31,458
25,403
221,416
369,452
CAGR (25-30)
0%
12%
7%
9%
0%
22%
11%
21%
13%
-45%
N/M
Annual Al IT Capacity Deployed
NVIDIA NVL72+
NVIDIA (HGXLPU/CPU)
AMD
2024
0.0
5.9
2025
3.4
4.1
Cumulative
116.1
66.9
Figure 42: 358GW cumulative gross deployments over 2024-30 (401GW of electricity at PUE 1.12) 0.3
AWS
Meta
Microsoft
Tesla
Intel
OpenAl
Other ASICs
AI ASIC IT rack capacity deployed (GW)
Al rack IT rack capacity deployed (GW)
Al IT GW Data center capacity (PUE 1.12)
YoY Growth
CAGR (25-30)
57%
35%
103%
50%
66%
| 1.0 | 1.2 | 68.9 | 76% |
|---|---|---|---|
| 0.0 | 0.0 | 5.0 | 137% |
| 0.0 | 0.0 | 0.6 | 45% |
| 0.1 | 0.9 | 13% | |
| 0.2 0.5 | 0.4 | 1.6 | -40% |
| 0.0 | 0.0 | 14.3 | N/M |
| 0.6 | 0.8 | 7.1 | 15% |
| 3.4 | 3.8 | 148.3 | 64% |
| 9.5 | 11.5 | 358.4 | 55% |
| 10.6 | 12.9 | 401.4 | 55% |
| 22% |
Source: UBS
Multiplying rack volume by rack/system IT power derives annual IT capacity deployed, a more relevant measure of the opportunity than rack units alone. We estimate this rises from 11.5GW in 2025 to 26.5GW in 2026, 50.8GW in 2027, 67.7GW in 2028, 87.9GW in 2029 and 104.5GW in 2030, a 55% CAGR.
This is why we believe rack-unit forecasts alone increasingly understate the AI power opportunity. In 2028, for example, we model rack shipments declining approximately 7%, yet AI IT capacity rises roughly 33%. In 2029, rack units decline another approximately 14%, but IT capacity still increases approximately 30%. The industry is deploying fewer incremental cabinets in those years, but considerably more watts.
We separately calculate facility power at a 1.12 PUE for data-center infrastructure context. Importantly, we do not apply PUE to inflate the rack power-electronics TAM; the content model is normalized to IT-side watts. IT GW represents the rated IT power associated with our modelled annual hardware deployments, rather than average electricity consumption. Cumulative deployments are shown before retirements and replacements at 358.4GW from 2024-2030; facility power at 1.12 is presented separately at 401.4GW.
We build the power BOM architecture by architecture
We construct a bottom-up power BOM for each major architecture. The physical location of that content changes considerably over time. In Hopper and early Blackwell systems, much of the conversion and distribution hardware sits directly in the IT rack. As rack power rises, BBU capacity, larger power shelves, busbars and higher-capacity distribution increase content. Moving toward ±400/800VDC architectures adds a new high-voltage distribution layer and increasingly externalizes bulk AC/DC conversion into a separate power rack or sidecar. Native high-voltage architectures can subsequently simplify some downstream conversion stages, while SST adoption could move still more power transformation into the power-electronics opportunity.
We therefore model both the IT rack and any dedicated power rack/sidecar as one power system. If a dedicated power rack supports one IT rack, its content is fully attributed to that system; if it supports multiple IT racks, its BOM is allocated across the supported IT load. This avoids the misleading conclusion that moving a PSU or BBU out of the compute rack somehow removes it from the TAM-it changes its physical location and sometimes its architecture, but the relevant economic question is the power-system content required per IT watt.
1.1
1.2
50.0
Higher rack density moves bulk AC/DC conversion, storage, protection and HV distribution outward; downstream conversion remains close to the accelerator
POWER DELIVERY ARCHITECTURE
Figure 43: Power-system BOM migrates from the IT rack to a dedicated power rack as density rises
FACILITY AC
IT RACK
ARCHITECTURE AND BOM MIGRATION
BULK AC/DC CONVERSION
DENSITY RISES
FACILITY AC
POWER RACK
HVDC
IT RACK
PSU shelves
BACK-UP/ENERGY
STORAGE
HVDC DISTRIBUTION +
PROTECTION
DOWNSTREAM DC/DC /
POL
BOM LOCATION
Source: UBS
Our detailed BOM contains the individual elements-AC/DC modules, power shelves, management and control, BBU and CBU shelves, DC PDUs, high-voltage conversion and distribution, busbars, rack-entry hardware, point-of-load conversion and, where applicable, SST. We roll these into six buckets: PSUs/shelves/controls; backup power and energy storage; HVDC conversion/distribution; downstream DC/DC power electronics; rack power infrastructure; and SST/upstream power transformation.
Content does not just increase-the mix changes materially across generations
Our NVIDIA architecture build provides a useful illustration. We estimate rack-plussidecar power content increases from approximately US$19k for Hopper/H200 to US $67k for GB200 and US$96k for GB300, before rising to approximately US$170k for VR200, US$233k for our VR300 Oberon configuration and US$1.07mn for RF200. An RF200 configuration incorporating upstream SST increases modeled power-system content to approximately US$1.45mn.
On a content/watt basis, our estimated power content rises from approximately US $0.42/W for Hopper to US$0.56/W for GB200, US$0.68/W for GB300, US$0.85/W for VR200, US$0.93/W for VR300 Oberon, and US$0.89/W for RF200. Our SST-equipped RF200 scenario reaches approximately US$1.45/W, although we treat SST penetration separately rather than assuming it across all deployments.
BBU
Bulk AC/DC increasingly external Power shelves / rectifiers
BBU/CBU can migrate outward
BBU / CBU
| Rack distribution | HVDC distribution added | HVDC distribution / protection |
|---|---|---|
| DC/DC | IT rack retains downstream DC/DC | IT rack retains DC/DC / POL |
| Most rack-level power BOM inside IT rack | Content split across IT + power rack | Bulk conversion outside IT rack |
| UBS TAM METHODOLOGY: | IT rack BOM + allocated power-rack / sidecar BOM = Total power-system content -> Normalize to IT watts supported → USS/IT watt. |
Figure 44: NVIDIA content evolution by platform
| Power Electronics Content Rack + Sidecar (US$) | Hopper | GB200 | GB300 | VR200 | VR300 Oberon | RF 200 | RF 200 + SST |
|---|---|---|---|---|---|---|---|
| PSUs, Shelves & Controls | $13,496 | $36,960 | $53,680 | $79,096 | $80,190 | $324,080 | $14,000 |
| Back-up Power / Energy Storage (BBU/CBU) | $720 | $6,550 | $14,560 | $30,400 | $26,000 | $204,000 | $204,000 |
| HVDC Power distribution (800/400V) | $0 | $0 | $0 | $0 | $43,500 | $192,500 | $172,500 |
| DC-DC Power Electronics (PDB/POL/VRM) | $3,866 | $13,198 | $16,531 | $40,075 | $45,302 | $209,088 | $209,088 |
| Rack Power Infrastructure (Busbars, Whip, Chassis) | $1,000 | $10,000 | $11,000 | $20,000 | $38,500 | $143,000 | $148,000 |
| SST / Upstream Power Transformation | $0 | $0 | $0 | $0 | $0 | $0 | $705,600 |
| Total | $19,082 | $66,708 | $95,771 | $169,571 | $233,492 | $1,072,668 | $1,453,188 |
| Power System Content per W(US$) | $0.42 | $0.56 | $0.68 | $0.85 | $0.93 | $0.89 | $1.21 |
Source: Company data, UBS estimates, RF200/SST is a modelled architecture pending release of more specs
The mix highlights an important point for suppliers. Falling PSU share does not mean falling PSU dollars. PSU, shelf and control content rises materially in absolute terms through most generations, but its share declines because new content pools are being layered around it. Backup power, HVDC distribution, larger busbars and rack infrastructure all become increasingly meaningful as the architecture transitions. If SST becomes part of the ultimate deployment architecture, upstream transformation represents a further potential content pool rather than simply another larger PSU.
Figure 45: NVIDIA content mix evolution by platform
| Power Content %of Total | Hopper | GB200 | GB300 | VR200 | VR300 Oberon | RF 200 | RF 200 + SST |
|---|---|---|---|---|---|---|---|
| PSUs, Shelves & Controls | 71% | 55% | 56% | 47% | 34% | 30% | 1% |
| Back-up Power / Energy Storage (BBU/CBU) | 4% | 10% | 15% | 18% | 11% | 19% | 14% |
| HVDC Power distribution (800/400V) | 0% | 0% | 0% | 0% | 19% | 18% | 12% |
| DC-DC Power Electronics (PDB/POL/VRM) | 20% | 20% | 17% | 24% | 19% | 19% | 14% |
| Rack Power Infrastructure (Busbars, Whip, Chassis) | 5% | 15% | 11% | 12% | 16% | 13% | 10% |
| SST / Upstream Power Transformation | 0% | 0% | 0% | 0% | 0% | 0% | 49% |
| Total | 100% | 100% | 100% | 100% | 100% | 100% | 100% |
Source: Company data, UBS estimates, RF200/SST is a modelled architecture pending release of more specs
Our bottom-up platform model allows us to isolate two of the largest individual powercontent pools: front-end power supply content and rack-level energy storage. We estimate AI server PSU & distribution TAM (rises from approximately US$3.6bn in 2025 to US$41.5bn in 2030, a 63% CAGR, as rapidly rising IT GW is compounded by larger power modules, higher-capacity shelves and richer controls). The content in our build-up includes the PSU, shelf and controls, power management controller and HVDC conversion (±400V/800V to 54/48V shelves). This component is the largest component of the white space power electronics stack, although its share of total power TAM declines from approximately 55% in 2025 to 46% in 2030 as new content pools in storage, protection, and eventually upstream transformation grow faster around it.
We estimate rack- and power-rack energy-storage TAM across BBU and CBU rises from approximately US$0.8bn in 2025 to US$15.9bn in 2030, an 82% CAGR, with modelled content increasing from approximately US$0.06 to US$0.14 per IT watt and from 12% to 17% of total power TAM as attach rates increase for hyperscale data centers and ASICs grow faster vs. GPU servers. The mix between battery and capacitive storage remains architecture-dependent: BBUs provide longer ride-through, while CBUs address higher-frequency transient and load-smoothing requirements, and some systems may incorporate both. Longer term, greater pooling of battery capacity into centralized UPS/ BESS could reduce rack-level BBU attachment without eliminating the need for fast local buffering. Our US$15.9bn estimate therefore captures modeled BBU/CBU within the IT rack and power rack, but excludes centralized facility-level storage.
Figure 46: PSU & Distribution the largest component pool with a US$42bn TAM by 2030; BBU/CBU storage grows faster to US$16bn by 2030
| AI Server PSU, Shelf & Distribution TAM (US$mn) | 2024 | 2025 | 2026E | 2027E | 2028E | 2029E | 2030E | CAGR (25-30) |
|---|---|---|---|---|---|---|---|---|
| AI Server PSU & Distribution TAM (US$mn) | $2,886 | $3,615 | $9,325 | $18,753 | $28,508 | $36,535 | $41,509 | 63% |
| Server PSU & Distribution Content per IT Watt | $0.27 | $0.28 | $0.31 | $0.33 | $0.38 | $0.37 | $0.35 | |
| PSU & Distribution %of Total Power TAM | 58% | 55% | 53% | 49% | 52% | 48% | 46% | |
| PSU & Distribution YoY TAM Growth | 25% | 158% | 101% | 52% | 28% | 14% | ||
| AI Server Energy Storage (BBU/CBU) (US$mn) | 2024 | 2025 | 2026E | 2027E | 2028E | 2029E | 2030E | CAGR (25-30) |
| AI Server Energy Storage TAM (US$mn) | $523 | $802 | $3,088 | $6,781 | $10,031 | $13,687 | $15,911 | 82% |
| Server Energy Storage Content per Watt | $0.05 | $0.06 | $0.10 | $0.12 | $0.13 | $0.14 | $0.14 | |
| Energy Storage %of Total Power TAM | 11% | 12% | 17% | 18% | 18% | 18% | 17% | |
| Server Energy Storage YoY TAM Growth | 53% | 285% | 120% | 48% | 36% | 16% |
Source: Company Data, UBS
SST adoption also represents an expansion and a redistribution of the power-content opportunity. In our RF200 scenario, approximately US$706k of upstream SST content is partly offset by lower conventional front-end conversion content, producing a net system-content increase of approximately US$381k. The supplier opportunity depends on capturing good market share on that key transition to more than offset the displaced content near the IT rack.
Turning the BOM into content per watt gives us a common denominator
For every platform we calculate power-system content per rack and divide it by the IT watts supported by that system. This produces a platform-specific content-per-watt metric that allows a 100kW integrated rack, an 800kW power-rack architecture and a future megawatt-class system to be compared on the same basis. Blended content/W reflects both architecture-specific changes in the required hardware and shifts in deployment mix across platforms; it should not be interpreted as like-for-like pricing for existing power products.
At the aggregate industry level, blended content increases from approximately US$0.57/ W in 2025 to US$0.67/W in 2026, US$0.75/W in 2027, US$0.81/W in 2028, US$0.86/W in 2029 and US$0.87/W in 2030, maintaining a healthy 9% CAGR from 2025-30. Architecture-driven content expansion came first from moves to rack scale systems such as Blackwell in 2025-26 and upcoming AMD Helios in 2027 followed by the transition to higher-density, externally powered 400/800V systems through 2028-29. Because 1GW of IT load at US$1/W of content equals US$1bn of TAM, the final calculation is transparent: AI power TAM = annual AI IT GW deployed × blended power-system content per IT watt.
Strong 2027 growth does not depend on widespread 800V power-rack adoption
We see 2026-27 as the principal TAM inflection, as rising accelerator units coincide with higher rack density and an architecture-driven increase in content per watt. TAM nearly triples in 2026 to US$17.7bn and more than doubles again to US$38.2bn in 2027.
The 2027 opportunity does not require widespread adoption of native 800V architectures. In our model, annual AI IT capacity rises approximately 92%, while blended power content per watt increases approximately 12%, together driving 115% TAM growth. The principal drivers are the scale of accelerator deployments and rising system power supplemented by richer power-system content. We expect a strong year driven by the aggressive sourcing plans for accelerator growth including strong Google TPU and Amazon Trainium forecasts, still strong power content growth with Rubin TDP 60% above Blackwell and AMD moving to a rack scale system with high power electronics content.
The slower initial transition by NVIDIA would shift more of that architecture-driven content opportunity into 2028-29 which could at that time offset some of the moderation of AI capex. We view Rubin Ultra having only mild upgrade with 30% penetration in our base case with modest TDP expansion from 225kW to 250kW but likely ramping sharply with the Feynman generation in late 2028 as that has much higher chance to move to 4 GPUs per package and 288+ GPUs per rack.
Power TAM (US$bn)
$100.0
169%
YoY Growth
$91.1
For custom ASICs, we expect Google and Meta to have about 30% of their 2027 ramps of TPUv8 and MTIA v4 with 400V power racks while Amazon would shift similar mix to a 48V power rack. With Google designing to EMIB-T and 4 dies on its v9 TPU with Mediatek and Amazon a 4 die design for Trainium 4 with Alchip, we model those transitioning to power racks in 2028.
$38.2
$26.9
80 %
While growth moderates, the power track transition keeps the TAM expanding. TAM rises to US$55.1bn in 2028, US$75.8bn in 2029 and US$91.1bn in 2030, representing annual dollar additions of approximately US$16.9bn, US$20.7bn and US$15.3bn, respectively. We view this as a transition from an early units + density + architecture growth phase toward a later primarily watts growth phase although still a swing factor around architecture upgrades. 2027E 2028 E 2029 E 2030E
Figure 47: AI power TAM growth moderates after 2027, but annual dollar increases remain substantial
Source: UBS
Upside to our out-year estimates would come from higher supported IT power, a richer architecture mix, greater storage attachment or higher SST penetration than assumed. The extent to which these raise total TAM depends on the additional hardware required rather than density alone.
We would note our TAM covers the power hardware identified in our rack and allocated power-rack BOMs including upstream SST content where modeled for Rosa-Feynman. It is not an estimate of total data-center electrical capital expenditure which would include more of the grey zone equipment.
NVIDIA 800V ramp may start slowly; ASIC power upgrades broaden the opportunity
NVIDIA provides perhaps the cleanest illustration of the model mechanics. Within our NVL72+ category, physical rack shipments are approximately 27,000 in both 2025 and 2030-essentially no endpoint unit growth. Yet the average system advances from approximately 125kW to 1.2MW if NVIDIA gets to 576 GPUs within a rack by 2030, increasing annual deployed IT capacity from 3.4GW to 32.4GW. At the same time, our blended content assumption for NVL72 racks rises from approximately US$0.59/W to US $1.04/W as the architecture adds richer conversion, energy storage, high-voltage distribution and rack infrastructure. The resulting annual power TAM grows from approximately US$2.0bn in 2025 to US$33.6bn in 2030, despite essentially flat endpoint rack units. We apply the same framework to HGX, CPU and LPU racks for a total NVIDIA power TAM scaling from US$3.7bn in 2025 to US$41.8bn in 2030.
180%
Figure 48: VR200 rack content US$170k in our base case
| PSU Pricing | PSU Pricing | PSU Pricing | PSU Pricing | PSU Pricing | PSU Pricing | ||
|---|---|---|---|---|---|---|---|
| $169,571 | $0.09 | $0.11 | $0.13 | $0.15 | $0.17 | $0.19 | |
| watt | $0.10 | $140,003 | $148,787 | $157,571 | $166,355 | $175,139 | $183,923 |
| $0.15 | $146,003 | $154,787 | $163,571 | $172,355 | $181,139 | $189,923 | |
| per | $0.20 | $152,003 | $160,787 | $169,571 | $178,355 | $187,139 | $195,923 |
| $0.25 | $158,003 | $166,787 | $175,571 | $184,355 | $193,139 | $201,923 | |
| price | $0.30 | $164,003 | $172,787 | $181,571 | $190,355 | $199,139 | $207,923 |
| BBU | $0.35 | $170,003 | $178,787 | $187,571 | $196,355 | $205,139 | $213,923 |
| $0.40 | $176,003 | $184,787 | $193,571 | $202,355 | $211,139 | $219,923 |
Source: UBS
Figure 49: $0.02 PSU erosion a 5% content downside, $0.05 BBU erosion a 4% downside
| PSU Pricing PSU Pricing | PSU Pricing PSU Pricing | PSU Pricing PSU Pricing | PSU Pricing PSU Pricing | PSU Pricing PSU Pricing | PSU Pricing PSU Pricing | PSU Pricing PSU Pricing | |
|---|---|---|---|---|---|---|---|
| $0.09 | $0.11 | $0.13 | $0.15 | $0.17 | $0.19 | ||
| watt | $0.10 | -17% | -12% | -7% | -2% | 3% | 8% |
| $0.15 | -14% | -9% | -4% | 2% | 7% | 12% | |
| per | $0.20 | -10% | -5% | 0% | 5% | 10% | 16% |
| $0.25 | -7% | -2% | 4% | 9% | 14% | 19% | |
| price | $0.30 | -3% | 2% | 7% | 12% | 17% | 23% |
| $0.35 | 0% | 5% | 11% | 16% | 21% | 26% | |
| BBU | $0.40 | 4% | 9% | 14% | 19% | 25% | 30% |
Source: UBS
Power TAM growth does not depend on a strong initial NVIDIA migration to 800V
The market has focused on the slower migration to 800V and dedicated power racks for Rubin, as approximately 440kW of 54V power shelves within the IT rack can support a 227kW Oberon NVL72 system. Our checks suggest initial power-rack penetration has moved lower as the existing architecture can extend through this generation and additional time is required to qualify the new high-voltage architecture. The uncertainty extends to Rubin Ultra, where a less aggressive upgrade than the original Kyber concept could similarly defer the need for external power conversion. A mix of higher GPU power and bandwidth but lower memory stack at 8 high nets to only a mild power upgrade to 250kW.
Importantly, our sensitivity analysis suggests this is a much smaller risk to the overall power TAM than to the 800V narrative. Around our 2027 base case, each 10ppt change in NVIDIA power-rack penetration changes total AI power TAM by only approximately 1%. The larger drivers are the roughly 92% increase in annual AI IT GW deployed and higher power content across the broader market, including Rubin's higher TDP , AMD's move toward rack-scale systems and initial adoption of power racks across custom ASIC platforms. Strong 2027 TAM therefore does not require NVIDIA to lead the 800V transition.
Figure 50: 2027 NVIDIA sensitivity to power rack adoption in 2027
| Rubin Power Rack Penetration | Rubin Power Rack Penetration | Rubin Power Rack Penetration | Rubin Power Rack Penetration | Rubin Power Rack Penetration | Rubin Power Rack Penetration | Rubin Power Rack Penetration | ||
|---|---|---|---|---|---|---|---|---|
| ##### | 0% | 10% | 20% | 30% | 40% | 50% | 60% | |
| Rubin Ultra Power Rack Penetration | 0% | $37,978 | $38,175 | $38,373 | $38,571 | $38,768 | $38,966 | $39,164 |
| Rubin Ultra Power Rack Penetration | 10% | $37,986 | $38,183 | $38,381 | $38,579 | $38,776 | $38,974 | $39,172 |
| Rubin Ultra Power Rack Penetration | 20% | $37,993 | $38,191 | $38,389 | $38,587 | $38,784 | $38,982 | $39,180 |
| Rubin Ultra Power Rack Penetration | 30% | $38,001 | $38,199 | $38,397 | $38,594 | $38,792 | $38,990 | $39,187 |
| Rubin Ultra Power Rack Penetration | 40% | $38,009 | $38,207 | $38,405 | $38,602 | $38,800 | $38,998 | $39,195 |
| Rubin Ultra Power Rack Penetration | 50% | $38,017 | $38,215 | $38,412 | $38,610 | $38,808 | $39,005 | $39,203 |
| Rubin Ultra Power Rack Penetration | 60% | $38,025 | $38,223 | $38,420 | $38,618 | $38,816 | $39,013 | $39,211 |
Source: UBS
Figure 51: 1% impact on the power TAM for each 10ppt swing in power rack adoption in 2027
| Rubin Ultra Power Rack Penetration Rubin Ultra Power Rack Penetration | Rubin Ultra Power Rack Penetration Rubin Ultra Power Rack Penetration | Rubin Ultra Power Rack Penetration Rubin Ultra Power Rack Penetration | Rubin Ultra Power Rack Penetration Rubin Ultra Power Rack Penetration | Rubin Ultra Power Rack Penetration Rubin Ultra Power Rack Penetration | Rubin Ultra Power Rack Penetration Rubin Ultra Power Rack Penetration | Rubin Ultra Power Rack Penetration Rubin Ultra Power Rack Penetration | ||
|---|---|---|---|---|---|---|---|---|
| Base: $1 | 0% | 10% | 20% | 30% | 40% | 50% | 60% | |
| 0% Rubin Power Rack Penetration | -1.2% | -0.1% | 1.0% | 2.1% | 3.2% | 4.3% | 5.4% | |
| 10% | -1.2% | -0.1% | 1.0% | 2.1% | 3.3% | 4.4% | 5.5% | |
| 20% | -1.2% | 0.0% | 1.1% | 2.2% | 3.3% | 4.4% | 5.5% | |
| 30% | -1.1% | 0.0% | 1.1% | 2.2% | 3.3% | 4.5% | 5.6% | |
| 40% | -1.1% | 0.0% | 1.2% | 2.3% | 3.4% | 4.5% | 5.6% | |
| 50% | -1.0% | 0.1% | 1.2% | 2.3% | 3.4% | 4.5% | 5.7% | |
| 60% | -1.0% | 0.1% | 1.2% | 2.4% | 3.5% | 4.6% | 5.7% |
Source: UBS
NVIDIA is also not the only path to externalized power. We expect Google and Meta to begin adopting ±400V architectures on a portion of their 2027 deployments, while Amazon can continue scaling a lower-voltage architecture with a 48V power rack before transitioning to 800V with Trainium 4 in 2028. The timing and topology differ, but the common direction is toward higher rack power, greater centralization of conversion and richer distribution/protection content.
For 2028, we do see a more mild ramp on Rubin Ultra followed by a strong adoption of power racks or initial SST shipments from late 2028 with the Feynman generation likely moving to 4+ dies and 288+ GPUs per rack and supporting 800V power side car. We model a 30% penetration and around our base case, each 15ppt change in Rubin Ultra power-rack penetration changes total power TAM by approximately 1.3-1.4%. We model only a moderate initial NVIDIA power-rack ramp, leaving meaningful upside if adoption occurs faster, while limiting downside from a slower transition.
By 2028, industry TAM is increasingly diversified beyond NVIDIA architecture decisions. We expect stronger power-system upgrades across Google, Amazon and other ASIC
platforms to support industry TAM even as NVIDIA enters a comparatively modest Rubin Ultra upgrade year. This diversification helps sustain our 44% total AI power TAM growth to US$55.1bn in 2028 despite slower NVIDIA growth.
Figure 52: 2028 NVIDIA sensitivity to power rack adoption
| Rubin Ultra Power Rack Penetration | Rubin Ultra Power Rack Penetration | Rubin Ultra Power Rack Penetration | Rubin Ultra Power Rack Penetration | Rubin Ultra Power Rack Penetration | Rubin Ultra Power Rack Penetration | Rubin Ultra Power Rack Penetration | Rubin Ultra Power Rack Penetration | |
|---|---|---|---|---|---|---|---|---|
| ##### | 0% | 15% | 30% | 45% | 60% | 75% | 95% | |
| 0% | $54,069 | $54,593 | $55,117 | $55,641 | $56,165 | $56,689 | $57,387 | |
| Rack | 10% | $54,097 | $54,620 | $55,144 | $55,668 | $56,192 | $56,716 | $57,414 |
| 20% | $54,124 | $54,648 | $55,171 | $55,695 | $56,219 | $56,743 | $57,442 | |
| Power Penetration | 30% | $54,151 | $54,675 | $55,199 | $55,723 | $56,246 | $56,770 | $57,469 |
| 40% | $54,178 | $54,702 | $55,226 | $55,750 | $56,274 | $56,798 | $57,496 | |
| Rubin | 50% | $54,205 | $54,729 | $55,253 | $55,777 | $56,301 | $56,825 | $57,523 |
| Rubin | 60% | $54,233 | $54,756 | $55,280 | $55,804 | $56,328 | $56,852 | $57,550 |
Source: UBS
Figure 53: 1.3-1.4% impact on the power TAM for each 15ppt swing in Rubin Ultra power rack adoption in 2028
| Rubin Ultra Power Rack Penetration Rubin Ultra Power Rack Penetration | Rubin Ultra Power Rack Penetration Rubin Ultra Power Rack Penetration | Rubin Ultra Power Rack Penetration Rubin Ultra Power Rack Penetration | Rubin Ultra Power Rack Penetration Rubin Ultra Power Rack Penetration | Rubin Ultra Power Rack Penetration Rubin Ultra Power Rack Penetration | Rubin Ultra Power Rack Penetration Rubin Ultra Power Rack Penetration | Rubin Ultra Power Rack Penetration Rubin Ultra Power Rack Penetration | |
|---|---|---|---|---|---|---|---|
| Base: $0 | 0% | 15% | 30% | 45% | 60% | 75% | 95% |
| 0% | -2.8% | -1.4% | -0.1% | 1.3% | 2.7% | 4.0% | 5.9% |
| 10% Rack | -2.7% | -1.4% | 0.0% | 1.4% | 2.7% | 4.1% | 5.9% |
| 20% | -2.7% | -1.3% | 0.1% | 1.4% | 2.8% | 4.2% | 6.0% |
| 30% Power Penetration | -2.6% | -1.2% | 0.1% | 1.5% | 2.9% | 4.3% | 6.1% |
| 40% | -2.5% | -1.2% | 0.2% | 1.6% | 3.0% | 4.3% | 6.2% |
| 50% Rubin | -2.5% | -1.1% | 0.3% | 1.7% | 3.0% | 4.4% | 6.2% |
| 60% | -2.4% | -1.0% | 0.4% | 1.7% | 3.1% | 4.5% | 6.3% |
Source: UBS
With the mild Rubin Ultra spec upgrade, 2028 should be a milder year for NVIDIA but ASIC upgrades pick up the slack to keep up healthy TAM growth. Our content growth for NVIDIA moderates in 2028 for the Rubin Ultra generation to +23% YoY before picking up to +47% YoY in 2029 for the Feynman generation. We expect a stronger ASIC ramp with Google and Amazon developing 4 die systems that should increase rack density to drive power rack upgrades to lift our overall 2028 power TAM +44% YoY to US$55.1bn.
Figure 54: NVIDIA Power TAM build-up: growth from higher power racks and content per rack
| NVIDIA AI Power TAM build-up | 2024 | 2025 | 2026E | 2027E | 2028E | 2029E | 2030E | CAGR (25-30) |
|---|---|---|---|---|---|---|---|---|
| NVIDIA NVL72+ Racks | 18 | 27,034 | 77,506 | 95,098 | 82,000 | 34,429 | 27,000 | 0% |
| TDP per rack (kW) | 120 | 125 | 139 | 208 | 270 | 802 | 1,200 | 57% |
| AI IT capacity deployed (GW) | 0.0 | 3.4 | 10.8 | 19.8 | 22.2 | 27.6 | 32.4 | 57% |
| NVIDIA NVL72+ Content per W(US$) | $0.56 | $0.59 | $0.66 | $0.75 | $0.82 | $0.97 | $1.04 | 12% |
| NVL72 Power TAM (US$mn) | $1 | $1,988 | $7,113 | $14,789 | $18,245 | $26,746 | $33,585 | 76% |
| YoY TAM Growth | N/M | 258% | 108% | 23% | 47% | 26% |
Source: UBS
GPU and ASIC power remain nearly equally important
Our bottom-up model is also built up for AMD and each major ASIC customer rather than applying NVIDIA economics across the industry. Chips per rack, system power, BBU/ CBU architecture, high-voltage topology, dedicated power-rack requirements and component content all vary by customer. We estimate GPU systems from NVIDIA and AMD represent approximately 59% of AI power TAM in 2025, 58% in 2026 and 56% in 2027, before falling to approximately 51% in 2028 and ending at 54% in 2030. ASIC systems therefore represent roughly 40-50% of industry power TAM throughout most of the forecast.
In dollar terms, GPU power TAM rises from US$3.9bn in 2025 to US$49.2bn in 2030, while ASIC power TAM increases from US$2.7bn to US$42.0bn. The architectures differ -AWS, Google, Meta, Microsoft and OpenAI will not necessarily converge on NVIDIA's exact rack implementation-but the fundamental power problem is common: more accelerator watts require greater conversion, protection, distribution, storage/ smoothing and downstream voltage conversion while the move up in rack compute density through more dies per package and more chips per rack is driving the OCP standards move toward power racks and native 800VDC architectures like NVIDIA.
This breadth is important for the investment case. The power TAM is ultimately tied to industry AI watts deployed, rather than requiring any single GPU vendor, ASIC program or rack standard to dominate the market. We would be explicit that the largest uncertainties are not all in the same direction. Accelerator shipment timing can move rack deployment between years; accelerators per rack can reduce rack counts even while increasing watts per rack; package and system TDP can move the GW denominator materially; and BBU/CBU attachment, power-rack sharing ratios, ±400V versus single-bus 800V topology and eventual SST penetration can all change content per watt.
The 169% and 115% growth rates we currently estimate for 2026 and 2027 could shift with product ramps without changing the central conclusion: the AI power market is moving from tens of kilowatts per rack toward hundreds of kilowatts and ultimately megawatt-class systems, while the architecture simultaneously adds new conversion, protection, storage and distribution content.
The critical point is that our US$91bn estimate is not predicated on extrapolating today's rack BOM. It reflects a bottom-up view of how many accelerator systems are deployed, how much power those systems consume, where the power electronics sit and what hardware is required to deliver each IT watt through successive rack architectures.
Figure 55: AI Power TAM by platform: strong growth for GPU and ASIC platforms
| AI Server Power TAM (US$mn) | 2024 | 2025 | 2026E | 2027E | 2028E | 2029E | 2030E | CAGR (25-30) |
|---|---|---|---|---|---|---|---|---|
| NVIDIA NVL72+ | $1 | $1,988 | $7,113 | $14,789 | $18,245 | $26,746 | $33,585 | 76% |
| NVIDIA (HGX/LPU/CPU) | $2,495 | $1,731 | $2,775 | $4,022 | $5,119 | $7,021 | $8,224 | 37% |
| AMD | $140 | $147 | $450 | $2,495 | $4,869 | $6,308 | $7,354 | 119% |
| Total AI GPU Power TAM (US$mn) | $2,636 | $3,866 | $10,339 | $21,307 | $28,233 | $40,074 | $49,163 | 66% |
| YoY TAM Growth | 47% | 167% | 106% | 33% | 42% | 23% | ||
| AWS | $638 | $760 | $2,708 | $5,482 | $8,998 | $12,043 | $13,696 | 78% |
| $608 | $812 | $3,437 | $8,753 | $13,593 | $17,572 | $20,175 | 90% | |
| Meta | $10 | $14 | $77 | $493 | $976 | $1,433 | $1,850 | 167% |
| Microsoft | $17 | $20 | $29 | $55 | $88 | $118 | $143 | 48% |
| Tesla | $131 | $93 | $71 | $65 | $89 | $128 | $173 | 13% |
| Intel | $431 | $327 | $201 | $163 | $105 | $51 | $25 | -40% |
| OpenAI | $0 | $0 | $255 | $1,193 | $2,166 | $3,249 | $4,522 | N/M |
| Other ASICs | $480 | $691 | $609 | $688 | $896 | $1,130 | $1,367 | 15% |
| Total AI ASIC Power TAM (US$mn) | $2,315 | $2,717 | $7,387 | $16,892 | $26,912 | $35,724 | $41,952 | 73% |
| YoY TAM Growth | 17% | 172% | 129% | 59% | 33% | 17% | ||
| Total AI Server Power TAM (US$mn) | $4,951 | $6,582 | $17,726 | $38,199 | $55,144 | $75,798 | $91,115 | 69% |
| YoY TAM Growth | 33% | 169% | 115% | 44% | 37% | 20% |
Source: UBS
AI Power TAM Sensitivities: IT GW is the primary TAM driver; architecture determines the upside around it
The two principal sensitivities to our AI Power TAM are annual IT capacity deployed and power-system content per supported IT watt. At a constant content per watt, a 10% change in our 104.5GW 2030 deployment assumption changes TAM by approximately US$9.1bn. Conversely, at our modelled 104.5GW of annual IT deployments, a US$0.05/ W change in blended power-system content changes 2030 TAM by approximately US $5.2bn.
The sensitivities are not completely independent. Higher rack power can increase IT GW while simultaneously changing the required power architecture and therefore content per watt; conversely, slower deployment of high-density systems can reduce both the GW denominator and penetration of more content-rich power racks. We therefore view the sensitivity tables as illustrating the magnitude of individual drivers.
Near-term TAM is most sensitive to IT GW deployed
Our 2027 base case assumes 50.8GW of annual IT capacity and US$0.75 of powersystem content per IT watt, producing approximately US$38.2bn of TAM. Around this base case, each incremental 1GW of IT deployments adds roughly US$0.75bn of annual TAM, or approximately 2% of the TAM level. A US$0.01/W change in blended content adds approximately US$0.5bn, or around 1.3%.
The impact on the year-on-year growth rate is larger because the 2026 TAM base remains relatively small. An additional 1GW in 2027 adds approximately 4.2 percentage points to TAM growth, while an additional US$0.01/W of content adds approximately 2.9 percentage points. This reinforces our view that the magnitude and timing of AI hardware deployments remain the most important variables for the 2026-27 inflection; widespread native 800V adoption is not required for a strong 2027 outcome.
Figure 56: UBS Power TAM in 2027 at US$38.2bn TAM at 50.8GW and US$0.75/watt
| IT GWDeployed | IT GWDeployed | IT GWDeployed | IT GWDeployed | IT GWDeployed | IT GWDeployed | IT GWDeployed | |||
|---|---|---|---|---|---|---|---|---|---|
| YoY: | $0 | 47.8 | 48.8 | 49.8 | 50.8 | 51.8 | 52.8 | 53.8 | |
| Power content per IT Watt | 8% | $0.72 | $34.5 | $35.2 | $36.0 | $36.7 | $37.4 | $38.1 | $38.8 |
| Power content per IT Watt | 9% | $0.73 | $35.0 | $35.7 | $36.5 | $37.2 | $37.9 | $38.6 | $39.4 |
| Power content per IT Watt | 11% | $0.74 | $35.5 | $36.2 | $36.9 | $37.7 | $38.4 | $39.2 | $39.9 |
| Power content per IT Watt | 12% | $0.75 | $35.9 | $36.7 | $37.4 | $38.2 | $39.0 | $39.7 | $40.5 |
| Power content per IT Watt | 14% | $0.76 | $36.4 | $37.2 | $37.9 | $38.7 | $39.5 | $40.2 | $41.0 |
| Power content per IT Watt | 15% | $0.77 | $36.9 | $37.7 | $38.4 | $39.2 | $40.0 | $40.8 | $41.5 |
| Power content per IT Watt | 17% | $0.78 | $37.4 | $38.2 | $38.9 | $39.7 | $40.5 | $41.3 | $42.1 |
Source: UBS
Figure 57: 2027YoY TAM growth sensitivity: ~4.2ppt per +1GW and 2.9ppt per +$0.01/W
| Ultra Power Rack Penetration IT GWDeployed | Ultra Power Rack Penetration IT GWDeployed | Ultra Power Rack Penetration IT GWDeployed | Ultra Power Rack Penetration IT GWDeployed | Ultra Power Rack Penetration IT GWDeployed | Ultra Power Rack Penetration IT GWDeployed | Ultra Power Rack Penetration IT GWDeployed | |||
|---|---|---|---|---|---|---|---|---|---|
| YoY: | 115.5% | 47.8 | 48.8 | 49.8 | 50.8 | 51.8 | 52.8 | 53.8 | |
| Power content per IT Watt | 8% | $0.72 | -20.8% | -16.7% | -12.7% | -8.6% | -4.5% | -0.4% | 3.6% |
| Power content per IT Watt | 9% | $0.73 | -18.1% | -14.0% | -9.9% | -5.7% | -1.6% | 2.5% | 6.7% |
| Power content per IT Watt | 11% | $0.74 | -15.4% | -11.2% | -7.1% | -2.9% | 1.3% | 5.5% | 9.7% |
| Power content per IT Watt | 12% | $0.75 | -12.7% | -8.5% | -4.2% | 0.0% | 4.2% | 8.5% | 12.7% |
| Power content per IT Watt | 14% | $0.76 | -10.0% | -5.7% | -1.4% | 2.9% | 7.2% | 11.5% | 15.8% |
| Power content per IT Watt | 15% | $0.77 | -7.3% | -3.0% | 1.4% | 5.7% | 10.1% | 14.4% | 18.8% |
| Power content per IT Watt | 17% | $0.78 | -4.6% | -0.2% | 4.2% | 8.6% | 13.0% | 17.4% | 21.8% |
Source: UBS
By 2028, the absolute TAM remains highly sensitive to incremental power deployments, but the impact on percentage growth moderates as the comparison base becomes larger. Our base case of 67.7GW and US$0.81/W produces approximately US$55.1bn of TAM. An incremental 1GW adds approximately US$0.81bn of TAM but only about 2.1ppt to YoY growth, while an additional US$0.01/W adds approximately US$0.68bn and roughly 1.8ppt to YoY growth. This is consistent with the broader shape of our forecast: the market remains large and continues to add substantial dollars, but percentage growth naturally decelerates beyond the initial deployment inflection.
Figure 58: UBS Power TAM in 2028 at US$55.1bn TAM at 67.7GW and US$0.81/watt
| IT GWDeployed | IT GWDeployed | IT GWDeployed | IT GWDeployed | IT GWDeployed | IT GWDeployed | IT GWDeployed | |||
|---|---|---|---|---|---|---|---|---|---|
| YoY: | $0 | 64.7 | 65.7 | 66.7 | 67.7 | 68.7 | 69.7 | 70.7 | |
| Power content per IT Watt | 4% | $0.78 | $50.8 | $51.5 | $52.3 | $53.1 | $53.9 | $54.7 | $55.5 |
| Power content per IT Watt | 6% | $0.79 | $51.4 | $52.2 | $53.0 | $53.8 | $54.6 | $55.4 | $56.2 |
| Power content per IT Watt | 7% | $0.80 | $52.1 | $52.9 | $53.7 | $54.5 | $55.3 | $56.1 | $56.9 |
| Power content per IT Watt | 8% | $0.81 | $52.7 | $53.5 | $54.3 | $55.1 | $56.0 | $56.8 | $57.6 |
| Power content per IT Watt | 10% | $0.82 | $53.3 | $54.2 | $55.0 | $55.8 | $56.6 | $57.5 | $58.3 |
| Power content per IT Watt | 11% | $0.83 | $54.0 | $54.8 | $55.7 | $56.5 | $57.3 | $58.2 | $59.0 |
| Power content per IT Watt | 12% | $0.84 | $54.6 | $55.5 | $56.3 | $57.2 | $58.0 | $58.9 | $59.7 |
Source: UBS
Figure 59: 2028 YoY growth sensitivity: _2.1ppt per +1GW and ~1.8ppt per +US$0.01/W
| Ultra Power Rack Penetration IT GWDeployed | Ultra Power Rack Penetration IT GWDeployed | Ultra Power Rack Penetration IT GWDeployed | Ultra Power Rack Penetration IT GWDeployed | Ultra Power Rack Penetration IT GWDeployed | Ultra Power Rack Penetration IT GWDeployed | Ultra Power Rack Penetration IT GWDeployed | |||
|---|---|---|---|---|---|---|---|---|---|
| YoY: | 44.4% | 64.7 | 65.7 | 66.7 | 67.7 | 68.7 | 69.7 | 70.7 | |
| Power content per IT Watt | 4% | $0.78 | -11.5% | -9.4% | -7.4% | -5.3% | -3.3% | -1.2% | 0.8% |
| Power content per IT Watt | 6% | $0.79 | -9.8% | -7.7% | -5.6% | -3.5% | -1.5% | 0.6% | 2.7% |
| Power content per IT Watt | 7% | $0.80 | -8.1% | -6.0% | -3.9% | -1.8% | 0.3% | 2.4% | 4.5% |
| Power content per IT Watt | 8% | $0.81 | -6.4% | -4.3% | -2.1% | 0.0% | 2.1% | 4.3% | 6.4% |
| Power content per IT Watt | 10% | $0.82 | -4.7% | -2.5% | -0.4% | 1.8% | 3.9% | 6.1% | 8.2% |
| Power content per IT Watt | 11% | $0.83 | -3.0% | -0.8% | 1.4% | 3.5% | 5.7% | 7.9% | 10.1% |
| Power content per IT Watt | 12% | $0.84 | -1.3% | 0.9% | 3.1% | 5.3% | 7.5% | 9.7% | 11.9% |
Source: UBS
Component price erosion is a risk, but rising system power and architectural upgrades mitigate the impact
Competitive pricing is another risk as conventional PSU volumes scale, more suppliers qualify and mature specifications such as Blackwell's mainstream 5.5kW PSUs become more standardized. However, our bottom-up BOM suggests that single-component price erosion has a more modest effect on total system content than changes in IT GW or architecture, because power content is increasingly distributed across conversion, storage, protection, distribution, controls and downstream DC/DC and also the PSUs are upgrading to higher complexity specs moving to 18.3kW and beyond.
Our VR200 integrated-power case contains approximately US$170k of rack power content using a PSU-module assumption of roughly US$0.13/W and BBU content of roughly US$0.20/W. Reducing PSU pricing by US$0.02/W lowers modelled rack power content by approximately 5%, while a US$0.05/W reduction in BBU pricing reduces total rack content by approximately 4%.
For the investment case, conventional PSU pricing on mature generations can face competitive pressure without invalidating the broader power TAM, particularly as additional content pools emerge in high-voltage distribution, protection, energy storage and near-silicon conversion. For individual suppliers unable to gain early qualification on newer generations of hardware, however, price erosion can still have a larger earnings impact depending on product mix and market share.
Figure 60: VR200 rack content US$170k in our base case
Source: UBS
Figure 61: $0.02 PSU erosion a 5% content downside, $0.05 BBU erosion a 4% downside
| PSU Pricing | PSU Pricing | PSU Pricing | PSU Pricing | PSU Pricing | PSU Pricing | PSU Pricing | |
|---|---|---|---|---|---|---|---|
| $0.09 | $0.11 | $0.13 | $0.15 | $0.17 | $0.19 | ||
| watt | $0.10 | -17% | -12% | -7% | -2% | 3% | 8% |
| $0.15 | -14% | -9% | -4% | 2% | 7% | 12% | |
| per | $0.20 | -10% | -5% | 0% | 5% | 10% | 16% |
| $0.25 | -7% | -2% | 4% | 9% | 14% | 19% | |
| price | $0.30 | -3% | 2% | 7% | 12% | 17% | 23% |
| BBU | $0.35 | 0% | 5% | 11% | 16% | 21% | 26% |
| $0.40 | 4% | 9% | 14% | 19% | 25% | 30% |
Source: UBS
Storage attachment is a larger architectural swing factor than storage pricing alone
BBU and CBU content is less standardized than front-end conversion because attachment depends on the resilience architecture selected by the data-center operator. A deployment retaining centralized UPS infrastructure may need relatively little racklevel battery capacity, while hyperscale systems requiring local ride-through or sourcetransfer support may attach materially more storage.
For VR200, our base case assumes roughly 50% BBU attachment at US$0.20/W. At that assumption, attach-weighted BBU content is approximately US$25.6k per system, contributing materially to the roughly US$170k total power BOM. Holding BBU pricing constant, moving attachment from 50% to 30% lowers modeled rack content by approximately 6%, while increasing attachment to 70% raises content by a similar amount. Moving across the much wider 10-100% attachment range produces a materially larger swing.
We therefore view BBU penetration as an architectural assumption rather than simply another ASP assumption. Greater upstream pooling of storage represents downside to rack-level BBU attachment, while increasing requirements for local ride-through, fast source transfer and workload stability provide upside. Importantly, lower rack-level BBU content does not necessarily imply proportionately lower total data-center storage content if capacity is instead centralized into DC UPS or BESS.
Figure 62: High storage attach would lift VR200 power content
| BBU Attach | BBU Attach | BBU Attach | BBU Attach | BBU Attach | BBU Attach | ||
|---|---|---|---|---|---|---|---|
| $169,571 | 10% | 30% | 50% | 70% | 85% | 100% | |
| watt | $0.10 | $147,971 | $152,771 | $157,571 | $162,371 | $165,971 | $169,571 |
| $0.15 | $149,171 | $156,371 | $163,571 | $170,771 | $176,171 | $181,571 | |
| per | $0.20 | $150,371 | $159,971 | $169,571 | $179,171 | $186,371 | $193,571 |
| $0.25 | $151,571 | $163,571 | $175,571 | $187,571 | $196,571 | $205,571 | |
| price | $0.30 | $152,771 | $167,171 | $181,571 | $195,971 | $206,771 | $217,571 |
| BBU | $0.35 | $153,971 | $170,771 | $187,571 | $204,371 | $216,971 | $229,571 |
| $0.40 | $155,171 | $174,371 | $193,571 | $212,771 | $227,171 | $241,571 |
Source: UBS
Figure 63: VR200: 50% BBU attachment contributes US $25.6k of weighted content
| BBU Attach BBU Attach | BBU Attach BBU Attach | BBU Attach BBU Attach | BBU Attach BBU Attach | BBU Attach BBU Attach | BBU Attach BBU Attach | BBU Attach BBU Attach | |
|---|---|---|---|---|---|---|---|
| 10% | 30% | 50% | 70% | 85% | 100% | ||
| watt | $0.10 | $4,000 | $8,800 | $13,600 | $18,400 | $22,000 | $25,600 |
| $0.15 | $5,200 | $12,400 | $19,600 | $26,800 | $32,200 | $37,600 | |
| per | $0.20 | $6,400 | $16,000 | $25,600 | $35,200 | $42,400 | $49,600 |
| price | $0.25 | $7,600 | $19,600 | $31,600 | $43,600 | $52,600 | $61,600 |
| $0.30 | $8,800 | $23,200 | $37,600 | $52,000 | $62,800 | $73,600 | |
| $0.35 | $10,000 | $26,800 | $43,600 | $60,400 | $73,000 | $85,600 | |
| BBU | $0.40 | $11,200 | $30,400 | $49,600 | $68,800 | $83,200 | $97,600 |
Source: UBS
SST adoption is the largest out-year architecture sensitivity
The largest architecture-specific swing in our 2030 NVIDIA model is SST penetration. Our base case assumes approximately 45% SST penetration, resulting in NVIDIA power TAM of approximately US$41.8bn in 2030. Holding the underlying hardware forecast constant, eliminating SST adoption reduces modelled NVIDIA TAM to approximately US $37.2bn, while increasing penetration to 90% raises TAM to approximately US$46.4bn under our base SST-content assumption.
The 45% SST assumption contributes roughly US$4.6bn of incremental NVIDIA power TAM versus a no-SST scenario. Each additional 15ppt of SST penetration around our base case moves annual TAM by roughly US$1.5bn, although the precise impact varies with the assumed power content of an SST-equipped architecture.
SST penetration also has a disproportionate effect on the out-year growth profile. At our base content assumption, 2030 NVIDIA TAM growth is approximately 24% with 45% SST penetration, versus roughly 10% without SST adoption and approximately 38% at 90% penetration.
This highlights why we treat SST separately from our nearer-term 800V thesis: 2026-27 growth is driven primarily by rapidly rising IT GW and rack power, 2028-29 by power rack upgrades and the 2029-30 and beyond growth profile is increasingly sensitive to which architecture ultimately wins and how much upstream transformation content migrates into the power-electronics opportunity.
SST should also be viewed as a net-content rather than gross-content opportunity. As discussed earlier, some upstream SST value displaces conventional front-end rectification and transformation. The relevant investment question is therefore not only whether SST is adopted, but which suppliers capture the larger engineered system as value migrates upstream and which are more impacted by displaced power conversion content closer to the rack.
Figure 64: SST at 45% penetration drives NVIDIA's Power TAM to US$41.8bn in 2030
Source: UBS
Figure 65: SST penetration key to YoY growth in the NVIDIA TAM in 2030
Source: UBS
Near-term TAM is driven by GW; architecture matters increasingly in the out-years
The sensitivity work reinforces three conclusions:
- IT GW deployed remains the largest determinant of total TAM, particularly through the 2026-27 ramp.
- A broader power BOM limits the impact of competitive price erosion in any individual component, particularly for vendors able to migrate toward newer, higher-content architectures.
- Architecture increasingly determines the out-years opportunity: storage attachment, external power-rack penetration and particularly SST can materially alter both content/watt and the distribution of value across suppliers.
Our US$91bn 2030 estimate does not require every platform to migrate to the most content-rich architecture. Rather, the sensitivity work suggests the AI power thesis is fundamentally a watts thesis first and an architecture thesis second: rising IT GW expands the addressable market, while external power racks, storage and ultimately SST determine how much incremental power-electronics content is captured around those watts and which suppliers capture it.
Competitive landscape: who captures the expanding AI power stack?
Convergence across the white-space and grey-space
The rapid increase in AI rack power is reshaping the competitive landscape across the data-center power ecosystem. Historically, white-space suppliers focused on server PSUs, rack-level power shelves and board-level conversion, while grey-space vendors supplied UPS, switchgear, transformers and facility-level distribution. Higher-voltage DC architectures increasingly blur this distinction. Bulk AC/DC conversion, energy storage, protection and distribution progressively migrate upstream from the IT rack into dedicated power racks, rows and ultimately facility-level systems, while high-ratio DC/
DC and point-of-load conversion move closer to the accelerator.
We therefore see competitive advantage shifting from leadership in an individual power component toward breadth across the power stack, qualification with the major AI platforms, system-level control capability and the ability to scale from rack-level products into multi-MW power systems. Importantly, the opportunity does not accrue uniformly. Some suppliers gain incremental content as new layers of power electronics are added, while others risk having mature low-voltage conversion content displaced as conversion becomes more centralized.
Figure 66: Key white-space and grey-space players in the data center power landscape
| Company | Segment Focus | Both | Geography | Key Offerings | Partnerships |
|---|---|---|---|---|---|
| Delta Electronics | √ | Taiwan | Power supplies, CDUs, rectifiers, 800V power racks | Official NVIDIA partner for power systems components: GB200 NVL72, 800VDC | |
| Flex | √ | US | Server racks, power modules, liquid cooling (via JetCool), utility power systems | Flex Power a leading vendor sampling for Vera Rubin power content. | |
| AcBel Polytech | White-Space | Taiwan | Power racks, DC power systems, converters | rectifiers, | |
| Artesyn (Advanced Energy) | √ | US | Custom power supplies for hyperscaler racks | ||
| Megmeet | China | AI server power supplies | Official NVIDIA partner (sole Chinese) for power systems components: GB200 NVL72, 800VDC | ||
| √ | US | UPS systems, battery shelves | cabinets, CDUs, power Official NVIDIA partner for data center power systems: GB200 NVL72, 800VDC | Vertiv | |
| √ | France | Software (EcoStruxure), liquid cooling (via Motivair), power distribution Official NVIDIA partner for data center power systems: GB200 NVL72, 800VDC | Schneider | ||
| √ | US | Switchgear, UPS, circuit protection, liquid cooling (via Boyd Thermal) Official NVIDIA partner for data center power systems: GB200 NVL72, 800VDC | Eaton | ||
| ABB | Grey-Space | Switzerland Switchgear, | electrical distribution, transformers Official NVIDIA partner for data center power systems: 800VDC | ||
| Legrand | √ | France | Power distribution units, busway systems, transformers | ||
| nVent | √ | US, UK | Liquid cooling units, server enclosures/racks | Official OCP contributor for GB200 / GB300 workloads and cooling partner for NVIDIA racks |
Source: Company data
Historically the white-space and grey-space suppliers operated in relatively separate parts of the data-center electrical chain. We expect that separation to narrow as highervoltage DC architectures mature. Grey-space incumbents are increasingly extending into rack-adjacent HVDC systems, while leading white-space suppliers are moving upstream into power racks, power centers and potentially medium-voltage conversion.
The key distinction therefore becomes less about where a supplier historically operated and more about how many stages of the architecture transition it can monetize. Delta has perhaps the broadest position spanning rack PSUs, DC/DC, energy storage, HVDC power racks, thermal management and upstream power conversion. Vertiv, Schneider and Eaton approach the market from the opposite direction, extending strong facilitylevel positions deeper into the data hall. Lite-On remains more concentrated around conversion and rack power, leaving meaningful upside if it successfully expands into centralized power racks and SST, but also greater risk if value migrates upstream faster than its product portfolio broadens.
Figure 67: Vendor portfolio in power conversion and energy storage
| Vendor | AC-DC Conversion | DC-DC Conversion | Energy Storage (BBU/CBU) | Power Rack, Center & Block Hardware | Solid-State Transformer (SST) Development |
|---|---|---|---|---|---|
| Delta Electronics | High-power AC-DC shelves up to 98.5% efficiency; PWM-controlled eFuse modules. | 90kW DC/DC shelves stepping down 800VDC; 12kW PDBs stepping down to 50V/12V at 98.5% peak efficiency. | 72kW BBUs; embedded 80kW BBUs; PCS utilizing supercapacitors for 10s ride-through. | In-row 660kW (800VDC) and 1.1MW power racks; 5,000A liquid-cooled busbars. | 2.5MW SST shipping to China; 6-10MW engineering samples in development for the US. |
| Lite-On | 5.5kW server PSUs; 23.5kW server PSUs; 33kW/110kW AC-DC power shelves. | 2.5kW motherboard DC-DC bricks (50VDC to 12V); 800V-to-50V (6kW) and 800V-to-12V (12kW) bricks. | 12kW/2U BBUs (50V, 45s); 22kW/3U BBUs (800V, 60s); 26kW BBUs for HVDC. | Liquid-cooled 800VDC power racks; 1.5MW+ power racks; 1500kW rack systems. | Roadmap outlines transition from server PSUs up to SST high-voltage distribution. |
| Megmeet | High-power server PSUs; 1U subrack rectifier systems. | Board-level bidirectional DC-DC modules and point-of-load converters. | BBU Shelf and Power Capacitor Shelf (CBU) systems; LiFePO4 battery packs. | 800V HVDC Sidecar (Side Rack) designed for NVIDIA rack-scale systems. | SST active research and development targeting conversion efficiency over 98.5%. |
| Flex | Embedded power supplies and high-density power modules. | BMR317 intermediate bus converters; vertical board-level power delivery. | 30kW Capacitive Energy Storage Systems (CESS); facility-level BESS systems. | 110kW power shelf for NVIDIA Vera Rubin platforms; prefabricated skids/pods. | Defined SST roadmap (34.5kV to 800VDC) secured via the acquisition of EPC Power. |
| Advanced Energy | 18kW 1U/36kW 2U ORV3 shelves; 1100W half- brick PFC; 30kW AC-DC front-ends. | ADH 8kW 800V-to-50V half-bricks at 98.2% efficiency; NDQ 50V-to-12V non-isolated bus converters. | 18kW 48V ORV3 BBU shelves; Hot Swap Control (HSC) inrush control modules. | Customized 800VDC power solutions combining ADH, NDQ, and HSC modules. | Focuses on high-frequency magnetics and density but has no public SST product. |
| Vertiv | Large-scale AC-DC power shelves; high- capacity UPS rectifiers. | DC-to-DC rack shelves stepping down 800VDC/400VDC to 50VDC for server boards. | Lithium-ion BESS; rack/row BBUs and supercapacitor shelves for transient buffering. | Mount Diablo ±400V/800V-class OCP sidecars; prefabricated Power Skids/Modules. | Grid interconnect and microgrid integration via UIG acquisition; SST reference design. |
| Schneider Electric | Galaxy VX UPS systems; TRU (Transformer Rectifier Units). | Rack-level DC-DC conversion systems for direct-to-chip board distribution. | Galaxy Lithium-ion battery systems; localized capacitors for transient ride-through. | 800VDC Sidecar up to 1.2MW; 800VDC Power Center (4.8MW); 800VDC Power Block (10MW). | 800VDC roadmap from grey space to white space utilizing SSTs (13.8kV/34.5kV to 800VDC). |
| Eaton | Low & medium voltage switchgear; medium- voltage AC distribution rectifiers. | Power conversion systems bridging AC and DC distribution networks. | Integrated battery backups; SPAN smart panel controls (7% stake). | Beam Rubin DSX power platform; customized modular enclosures (Fibrebond). | Medium-voltage SST (MVSST) development accelerated via Resilient Power acquisition. |
Source: UBS, AlphaSense
What increasingly determines competitive advantage
As AI power systems move from tens of kilowatts per rack toward several hundred kilowatts and ultimately megawatt-class systems, we see five factors becoming increasingly important.
- Platform qualification and execution remain critical. Suppliers need to be designed into NVIDIA, AMD and hyperscaler reference platforms before the major volume ramp and then demonstrate reliable manufacturing execution across rapidly changing generations.
- Second, power-density engineering becomes a larger barrier to entry. Moving from 5.5kW PSU modules toward 12-18kW-class modules, hundreds-ofkW power shelves and eventually multi-MW power systems requires higher efficiency, stronger transient performance, thermal management, redundancy and coordinated system controls.
- Third, breadth across the power BOM becomes increasingly important. Our TAM work shows that value is progressively distributed across AC/DC conversion, storage, HVDC distribution, protection, downstream DC/DC conversion, controls and cooling rather than remaining concentrated in a single PSU line item.
- Fourth, suppliers need the ability to follow value upstream. The transition from integrated 48/54V racks toward ±400V/800V power racks, centralized power centers and eventually medium-voltage rectification or SST shifts a larger portion of the opportunity toward engineered systems outside the IT rack.
- Finally, global scale, qualification history and field support become more important as power per deployment increases. Hyperscalers are unlikely to select suppliers based only on component price when individual power systems support hundreds of thousands or millions of dollars of compute. Reliability, geographic manufacturing diversity, commissioning capability, controls and longterm service therefore become increasingly relevant competitive differentiators.
These dynamics generally favor incumbents with both deep power-electronics expertise and broad system portfolios, while leaving room for focused rack-power suppliers to outperform if they successfully expand content faster than the architecture migrates upstream.
These competitive positions are increasingly visible in vendors' relative scale, growth and financial capacity. To compare companies with different reporting structures, we use the closest disclosed power- and infrastructure-related revenue category for each supplier. The comparison is therefore directional rather than strictly like-for-like, but it illustrates the resources available to fund product development, platform qualification, capacity and field support.
Gross Margin (%)
45.0%
40.0%
35.0%
30.0%
25.0%
20.0%
15.0%
10.0%
5.0%
0.0%
Figure 68: Delta and Flex gain scale fastest across cloud & power related businesses
2017
-Delta
Source: Company Data, UBS, VA Consensus
Figure 69: Delta, Vertiv, and Eaton lead on Gross Margins, Lite-On steadily improving
Source: Company Data, UBS, VA Consensus
Across the selected vendors, relevant revenue increases from US$56bn in 2024 to US $196bn in 2030E, a 23% CAGR, with Delta and Flex accounting for more than 60% of the incremental revenue. Profitability provides another important differentiator: Delta, Vertiv and Eaton maintain relatively strong gross-margin profiles, while Lite-On's steady improvement should provide greater capacity to reinvest as its AI power business scales.
The composition of this selected revenue pool also illustrates how the architecture transition could redistribute growth. Delta's share increases from 18% in 2024 to 31% in 2030E, reflecting its participation across rack power, infrastructure and thermal management, while Flex based on consensus revenues rises from 6% to 21% as its cloud and power portfolio expands. Schneider's relevant revenue still grows from US $31bn to US$51bn, but its share declines from 55% to 26% because its broader Energy Management base grows more slowly. Vertiv maintains a broadly stable 13-14% share despite more than tripling revenue, while Lite-On edges up from 6% to 8%.
These percentages represent each company's share of the selected vendor reporting categories-not market share of the AI power TAM. Their principal purpose is to show relative scale and growth as value expands beyond the traditional server PSU into racklevel and facility-adjacent power systems.
Figure 70: Power and Infrastructure related sales by vendor
| Power &Infra related sales (US$mn) | 2024 | 2025 | 2026 | 2027 | 2028 | 2029 | 2030 | Division Reporting |
|---|---|---|---|---|---|---|---|---|
| Delta (Power &Infra) | $10,086 | $14,903 | $21,855 | $32,447 | $44,879 | $52,884 | $59,983 | Delta Power &Infrastructure Total |
| Schneider (Energy Mgmt Sales ) | $31,131 | $33,130 | $37,266 | $40,422 | $43,792 | $47,451 | $51,426 | Schneider Energy Mgmt Sales |
| Flex (Cloud and Power infra) | $3,244 | $4,799 | $6,614 | $11,405 | $20,680 | $27,455 | $40,449 | Flex Cloud &Power |
| Vertiv (Total sales) | $8,012 | $10,230 | $14,009 | $17,892 | $20,218 | $23,251 | $25,817 | Vertiv Total Sales |
| LiteOn (Cloud& AIoT) | $3,181 | $3,835 | $5,374 | $7,989 | $10,667 | $13,370 | $14,828 | Lite-on Cloud Sales + IT/Consumer Power |
| Megmeet (Power) | $322 | $383 | $785 | $1,282 | $1,499 | $1,756 | $2,061 | Megmeet Power |
| Advanced Energy (Data Center Computing) | $284 | $587 | $893 | $1,158 | $1,391 | $1,599 | $1,839 | Data Center Computing |
| Power Supply Revenue of Selected Vendors YoYGrowth% | $56,261 | $67,867 21% | $86,795 28% | $112,595 30% | $143,127 27% | $167,767 17% | $196,403 17% | |
| Power/Infra revenue share by vendor | 2024 | 2025 | 2026 | 2027 | 2028 | 2029 | 2030 | Division Reporting |
| Delta (Power &Infra) | 18% | 22% | 25% | 29% | 31% | 32% | 31% | Delta Power &Infrastructure Total |
| Schneider (Energy Mgmt Sales ) | 55% | 49% | 43% | 36% | 31% | 28% | 26% | Schneider Energy Mgmt Sales |
| Flex (Cloud and Power infra) | 6% | 7% | 8% | 10% | 14% | 16% | 21% | Flex Cloud &Power |
| Vertiv (Total sales) | 14% | 15% | 16% | 16% | 14% | 14% | 13% | Vertiv Total Sales |
| LiteOn (Cloud& AIoT) | 6% | 6% | 6% | 7% | 7% | 8% | 8% | Lite-on Cloud Sales + IT/Consumer Power |
| Megmeet (Power) | 1% | 1% | 1% | 1% | 1% | 1% | 1% | Megmeet Power |
| Advanced Energy (Data Center Computing) | 1% | 1% | 1% | 1% | 1% | 1% | 1% | Data Center Computing |
| Share of Selected Vendor Revenue | 100% | 100% | 100% | 100% | 100% | 100% | 100% |
Source: Company Data, UBS, VA Consensus
Grey-space incumbents increasingly move toward the rack
Vertiv, Schneider and Eaton approach the opportunity from the opposite side of the value chain. Their established positions are in UPS, switchgear, facility distribution, protection and large-scale power infrastructure rather than traditional server PSUs. The move toward 800V DC power centers and eventually multi-MW rectifier or SST blocks is strategically favorable because it shifts more of the AI power BOM into systems where engineering, protection, commissioning, software, controls and field service are as important as component cost.
- Vertiv appears especially well positioned where high-density power and cooling converge. Its portfolio across UPS, distribution, rack PDUs, power shelves, CDUs and liquid cooling provides a natural path toward integrated 800V sidecars and centralized megawatt-scale power systems. As AI deployments become increasingly constrained by both electrical and thermal density, this combined power-and-cooling position could become more valuable.
- Schneider Electric benefits from deep capability in switchgear, power distribution and controls through its EcoStruxure platform. Centralized HVDC power centers fit naturally with its broader data-center systems position, particularly where customers prefer a single vendor to integrate facility electrical infrastructure, control systems and increasingly rack-adjacent power conversion.
- Eaton brings strong North American medium- and low-voltage distribution, protection and power-quality expertise. Its opportunity should rise as conversion moves toward larger HVDC systems and potentially medium-voltage rectification or SST. Relative to Delta or Lite-On, however, Eaton has less historical content immediately adjacent to the accelerator, making the transition more dependent on its ability to extend into the white space.
Flex and other integration-led competitors
- Flex competes differently from the pure-play power suppliers. It offers large-scale EMS/ODM integration and the ability to combine power, cooling, racks and manufacturing into complete systems. The 2026 acquisition of Electrical Power Products expands its ability to provide utility-level infrastructure. Flex is among the four primary vendors for Vera Rubin power content alongside Delta, Lite-On and Megmeet.
- Advanced Energy and AcBel remain more specialized participants. Advanced Energy has highest exposure in high-performance custom conversion where efficiency, density and control requirements can support premium solutions rather than high-volume commodity rack power. AcBel has power-conversion expertise and could participate selectively in AI rack power, but its narrower platform exposure and smaller system portfolio make broad share gains less certain.
China suppliers are progressing, but barriers to hyperscale share gains remain
Chinese power suppliers continue to improve in PSU, rectification and high-voltage conversion and remain an important longer-term source of pricing competition. However, high-density AI systems are becoming less commodity-like as rack power increases. Customers place substantial value on transient performance, fault tolerance, qualification history, global supply assurance, safety compliance and field reliability.
We expect Chinese suppliers including Megmeet to gain first through components, and programs with short lead time given their quick responsiveness with first order at a major AI native given short lead time. Over time, successful qualification in 800V power racks and high-power PSU platforms would increase competitive pressure, particularly on mature conversion products. However, the broader system opportunity in protection, controls, storage and HVDC distribution should make competitive share shifts slower than simple PSU price comparisons imply.
Figure 71: Competitive positioning across the AI power architecture transition
| Supplier | Rack conversion | Storage | 800V / HVDC | Cooling | Grey-space /MV | SST | Positioning |
|---|---|---|---|---|---|---|---|
| Delta | Strong | Strong | Strong | Moderate | Developing | Strong/Developing | Broadest grid-to-chip exposure |
| Lite-On | Strong | Strong | Strong | Limited | Developing | Developing | High leverage to rack-power growth |
| Vertiv | Moderate | Strong | Strong | Strong | Strong | Developing | Power + cooling convergence |
| Schneider | Limited/Moderate | Strong | Strong | Strong | Strong | Developing | Facility integration / controls |
| Eaton | Limited | Moderate | Strong | Limited | Strong | Strong/Developing | MV / protection upside |
| Flex | Moderate | Moderate | Moderate | Strong | Moderate | Limited | System integration |
| AcBel | Moderate | Limited | Developing | Limited | Limited | Limited | Selective rack-power exposure |
| Megmeet | Developing | Developing | Moderate | Limited | Limited | Developing | Longer-term pricing/share challenger |
Source: UBS
The matrix highlights that no single supplier is strongest in every part of the stack. Traditional white-space suppliers retain advantages closest to the compute rack, while grey-space incumbents are better positioned as conversion migrates toward larger power domains. The most strategically attractive suppliers are therefore those able to bridge both sides of the architecture, or those with sufficient product momentum to expand their addressable content faster than legacy products are displaced.
For our Taiwan coverage, this framework leaves Delta and Lite-On as the two most direct beneficiaries, but with different risk/reward profiles. Delta offers broader architecture exposure and greater protection against value migration, while Lite-On offers greater operating leverage to continued rack-power share gains and successful expansion into 800V and SST.
Implications for our Asia Power Supply coverage
Maintain Buy with NT$2,750 target on Delta, Initiate Coverage on Lite-On with a Buy and NT$400 target. Maintain Neutral on Megmeet with a RMB124.8 target.
Our bottom-up AI server power analysis points to a large difference in scale between Delta and Lite-On. We estimate Delta's AI server power revenue increases from US $7.7bn in 2026 to US$35.5bn in 2030E, while maintaining approximately 39-43% of our TAM. Lite-On also scales rapidly-from US$3.0bn to US$11.0bn-but its implied share moderates from 17% to 12% as an increasing portion of industry value migrates into infrastructure and upstream conversion categories where it has less established exposure. This supports our broader conclusion: Delta offers wider exposure across the architecture, while Lite-On offers greater operating leverage if it successfully extends its rack-power position upstream.
Figure 72: Delta remains the revenue leader, Lite-On scales from a lower base
| Server related power sales (US$mn) | 2026 | 2027 | 2028 | 2029 | 2030 | Division Reporting |
|---|---|---|---|---|---|---|
| Delta | $7,677 | $14,068 | $22,945 | $29,804 | $35,501 | Delta AI Server Power, Server Passives, BBU, Infra |
| YoY Growth | 81% | 83% | 63% | 30% | 19% | |
| %of the Power TAM | 43% | 37% | 42% | 39% | 39% | |
| LiteOn | $2,960 | $5,359 | $7,933 | $9,758 | $11,026 | Lite-On PSU, BBU&Infra |
| YoY Growth | 79% | 81% | 48% | 23% | 13% | |
| %of the Power TAM | 17% | 14% | 14% | 13% | 12% | |
| Flex Power | $2,100 | $3,793 | $7,200 | $14,043 | $20,362 | Flex Power |
| Advanced Energy (data center computing) | $893 | $1,158 | $1,391 | $1,599 | $1,839 | Data Center Computing |
| Megmeet | $446 | $892 | $1,071 | $1,285 | $1,542 | Megmeet AIDC Power |
| Total Power Revenue | $14,079 | $25,272 | $40,541 | $56,490 | $70,271 | |
| AI ServerPowerTAMYoY AI ServerPowerTAM | 78% | 80% | 60% | 39% | 24% $91,115 | |
| AI ServerPowerTAMYoY | $17,726 169% | $38,199 115% | $55,144 44% | $75,798 37% | 20% |
Source: UBS, Visual Alpha Consensus, Company Data
Delta Electronics: broadest exposure across the architecture transition
We see Delta as one of the best-positioned suppliers across the transition because its opportunity extends well beyond conventional server PSUs. Delta participates in AC/DC power conversion, rack power shelves, BBU/CBU, DC/DC conversion, HVDC power racks, distribution, controls and liquid cooling, while its industrial power capabilities create a path toward medium-voltage conversion, SST and microgrid architectures.
This breadth is particularly important in the context of our TAM analysis. As AI systems transition from integrated 48/54V architectures toward dedicated power racks and ultimately more centralized facility-level conversion, value does not simply disappear from the power chain. Instead, content migrates toward higher-voltage rectification, storage, HVDC distribution, protection, control and higher-ratio downstream conversion. Delta's portfolio gives it the ability to participate across these transitions rather than depending on a single architecture.
We therefore view Delta as relatively architecture agnostic. It can monetize continued adoption of integrated 48/54V power shelves, participate in ±400V/800V rack-side power systems, move upstream into larger power centers and potentially capture incremental content from SST or other medium-voltage conversion architectures. Its liquid-cooling portfolio also gives it additional exposure as power and thermal management become increasingly interdependent at higher rack densities.
The key risks are different from those of a narrower PSU supplier. As the unit of sale becomes larger and moves further into the grey space, Delta faces more direct competition from Vertiv, Schneider, Eaton and other facility-power incumbents. Successful execution therefore increasingly depends not only on component performance but also on system-level integration, controls, service and qualification for multi-MW deployments.
Maintain Buy on Delta with a NT$2,750 Target
We maintain our Buy rating and NT$2,750 target based on 35x average 2027-28 P/E, high-end of its range but reflecting higher growth and better margins versus its history. We keep earnings intact for 2026-27 at NT$42.30/NT$67.50 based on the company sales growing +41%/40% YoY with positive operating leverage to lift OpM from 15.1% 2025 to 18.5%/21.1% in 2026-27. We view our growth expectations appropriate and broadly in-line with its addressable power TAM the next few years keeping its market share around 40%. The company should leverage its strong product line, R&D and field support to participate in the key power architecture transitions in the coming years moving the power stack out of the rack and also developing emerging nascent technologies including SST for facility level power transformation and rectification and fuel cells licensing Ceres for medium-term opportunity to supplement the power grid constraint with alternative energy.
Figure 73: UBS estimates for Delta for 2026-28E
| Q226 | Q326E | Q326E | Q426E | Q426E | 2025 | 2026E | 2026E | 2027E | 2027E | 2028E | 2028E | |
|---|---|---|---|---|---|---|---|---|---|---|---|---|
| (NT$m) | Actual | UBSe | VA | UBSe | VA | Actual | UBSe | VA | UBSe | VA | UBSe | VA |
| Revenue | 183,256 | 211,472 | 209,633 | 228,773 | 223,594 | 554,885 | 782,854 | 775,836 | 1,098,155 | 1,095,045 | 1,419,750 | 1,571,855 |
| - QoQ / YoY | 15.0% | 15.4% | 14.4% | 8.2% | 5.7% | 31.8% | 41.1% | 39.8% | 40.3% | 41.1% | 29.3% | 43.5% |
| Gross profit | 65,308 | 76,358 | 75,922 | 83,862 | 82,049 | 190,157 | 284,489 | 282,240 | 408,437 | 412,288 | 529,624 | 606,216 |
| - Gross margin | 35.6% | 36.1% | 36.2% | 36.7% | 36.7% | 34.3% | 36.3% | 36.4% | 37.2% | 37.7% | 37.3% | 38.6% |
| Operating profit | 30,570 | 40,126 | 38,440 | 45,835 | 42,495 | 83,932 | 144,948 | 139,922 | 231,901 | 227,962 | 306,335 | 359,414 |
| - OP margin | 16.7% | 19.0% | 18.3% | 20.0% | 19.0% | 15.1% | 18.5% | 18.0% | 21.1% | 20.8% | 21.6% | 22.9% |
| Non-op profit | 4,430 | 1,438 | 1,645 | 1,438 | 1,611 | 3,934 | 9,981 | 10,361 | 5,723 | 6,633 | 5,723 | 7,543 |
| Pre-tax profit | 35,000 | 41,564 | 40,084 | 47,274 | 44,106 | 87,866 | 154,930 | 150,283 | 237,624 | 233,992 | 312,058 | 366,203 |
| Tax | -7,831 | -8,936 | -8,543 | -10,164 | -9,496 | -19,930 | -34,189 | -33,129 | -51,089 | -50,251 | -67,093 | -79,045 |
| - Tax rate | 22.4% | 21.5% | 21.3% | 21.5% | 21.5% | 22.7% | 22.1% | 22.0% | 21.5% | 21.5% | 22% | 22% |
| Minority | -2,033 | -2,779 | -3,192 | -2,777 | -3,278 | -7,828 | -10,868 | -11,781 | -11,194 | -16,771 | -11,194 | -24,618 |
| Net profit | 25,136 | 29,849 | 28,349 | 34,333 | 31,332 | 60,108 | 109,873 | 105,373 | 175,341 | 166,970 | 233,771 | 262,540 |
| EPS (NT$) | $9.68 | $11.49 | $10.94 | $13.22 | $12.05 | $23.14 | $42.30 | $40.57 | $67.50 | $64.28 | 90.00 | 101.08 |
Source: Company Data, UBSe, VA Consensus
Figure 74: Delta has pulled back from its peak
Source: Refinitiv Workspace
Lite-On: a stronger contender in AI power
Lite-On has spent several years exiting lower-return businesses, improving its margin structure and redirecting investment toward Cloud & AIoT, where AI server power is now becoming a meaningful growth and earnings driver. AI server PSU shipments began ramping in late 2024/2025, customer qualifications have broadened, and the company is moving beyond individual power modules into larger power shelves, BBU/energymanagement systems and eventually dedicated high-voltage power racks. Importantly, our checks suggest the power-rack opportunity is already becoming tangible on custom
Figure 75: Delta FWD EPS is still on growth trend
Source: Refinitiv Workspace
ASICs: we expect Lite-On to begin ramping a dedicated 48V power rack for its top ASIC client from late 2026, before stepping up to an ~800V/MW-class architecture with the following generation from late 2027. Lite-On remains well behind Delta in absolute AI power scale and breadth, but our forecasts do not require it to close that gap. The base case assumes only modest GPU-server share and stronger positions in selected custom-ASIC programs, leaving additional CSP wins as upside rather than a prerequisite.
Lite-On has improved execution, securing NVIDIA approved-vendor qualification and supplying three of the top five CSPs, with a leading position in power supplies for Trainium ASIC servers. Our checks point to a first dedicated 48V ASIC power rack ramp from late 2026, followed by a substantially higher-content 800V/MW-class architecture with the next generation from late 2027. We also expect penetration into the remaining two hyperscalers within 12-18 months. Cloud & AIoT revenue growth accelerated from -2% in 2024 to +48% in 2025 and +60% in 2026 YTD as design wins ramped. Sharper business focus and R&D investment are strengthening its platforms for upcoming transitions, including dedicated power racks. Supported by its balance sheet and nearterm capacity expansion, we believe Lite-On can sustain a top-three position in datacentre white-space power and capture strong AI market growth.
Initiate Lite-On with a Buy and NT$400 Target
We expect Lite-On to capture more of the expanding AI power electronics opportunity as execution improves, its customer base broadens and margins rise. Cloud power (48% of our 2026 sales forecast) should benefit from higher content per watt alongside growth in GW of AI hardware deployed. We initiate with a Buy and NT$400 target, implying 25x 2027E EPS versus peers at 29x. Our NT$400 price target applies 20x to our 2028E EPS of NT$20, equivalent to 25x our 2027E EPS of NT$16 versus peers at 29x. Lite-On has historically traded at 8-14x P/E, but we believe its transition into a key AI power supplier warrants a higher multiple.
Figure 76: UBS estimates for Lite-On for 2026-28E
| Q226 | Q326E | Q326E | Q426E | Q426E | 2025 2026E | 2025 2026E | 2027E | 2027E | 2028E | 2028E | |
|---|---|---|---|---|---|---|---|---|---|---|---|
| (NT$m) | Actual | UBSe | VA | UBSe | VA | Actual | UBSe VA | UBSe | VA | UBSe | VA |
| Revenue | 52,703 | 58,232 | 60,613 | 63,720 | 62,196 | 166,085 | 218,062 | 218,920 299,836 | 286,933 | 373,639 | 362,377 |
| - QoQ / YoY | 21.4% | 10.5% | 15.0% | 9.4% | 6.8% | 21.1% | 31.3% | 31.8% 37.5% | 31.1% | 24.6% | 26.3% |
| Gross profit | 14,348 | 14,827 | 15,292 | 16,409 | 15,802 | 38,039 | 54,987 | 54,846 79,023 | 75,362 | 99,253 | 99,622 |
| - Gross margin | 27.2% | 25.5% | 25.2% | 25.8% | 25.4% | 22.9% | 25.2% | 25.1% 26.4% | 26.3% | 26.6% | 27.5% |
| Operating profit | 8,203 | 8,043 | 8,428 | 9,113 | 8,648 | 16,738 | 29,458 | 29,378 45,875 | 42,837 | 57,742 | 58,555 |
| - OP margin | 15.6% | 13.8% | 13.9% | 14.3% | 13.9% | 10.1% | 13.5% | 13.4% 15.3% | 14.9% | 15.5% | 16.2% |
| Non-op profit | 1,166 | 358 | 274 | 316 | 254 | 2,975 | 2,711 | 2,238 1,258 | 1,112 | 1,201 | 1,112 |
| Pre-tax profit | 9,368 | 8,401 | 8,922 | 9,429 | 9,086 | 19,713 | 32,169 | 32,366 47,133 | 44,853 | 58,944 | 60,336 |
| Tax | -2,248 | -1,932 | -2,024 | -2,169 | -2,065 | -4,601 | -7,545 | -7,534 -10,841 | -10,288 | -13,557 | -13,867 |
| - Tax rate | 24.0% | 23.0% | 22.7% | 23.0% | 22.7% | 23.3% | 23.5% | 23.3% 23.0% | 22.9% | 23.0% | 23.0% |
| Net profit | 7,116 | 6,465 | 6,897 | 7,260 | 7,021 | 15,116 | 24,616 | 24,830 36,290 | 34,565 | 45,381 | 13,867 |
| EPS (NT$) | 3.14 | 2.85 | 3.01 | 3.20 | 3.06 | 6.64 | 10.85 | 10.74 16.00 | 15.22 | 20.00 | 20.34 |
Source: Company Data, UBSe, VA Consensus
Figure 77: Lite-On stock price has re-rated with better execution in AI power
Source: Refinitiv Workspace
Figure 78: Lite-On has re-rated toward Delta as investors recognize the AI power transition
Source: Refinitiv Workspace
Shenzhen Megmeet Electrical (002851.SZ, Neutral; RMB124.8 Target)
Megmeet has made progress in AI server power design and qualification and continues to invest aggressively in engineering. Driven by rising AI computing demand, data center power architectures are shifting toward higher power density and efficiency, supporting value growth across PSUs, Power Shelves, and HVDC-related infrastructure. Leveraging its power electronics expertise, the company has achieved hundred-million-Rmb level PSU shipments, demonstrating scaled deployment capabilities. It is also expanding into Power Rack, HVDC, and liquid-cooling infrastructure products such as CDUs and CBUs, broadening its presence in the data center power ecosystem. The pace of growth will depend on product development, customer qualification, and project ramp-up, with new product wins and order intake remaining key catalysts.
Figure 79: Valuation summary for the major power players
| Mkt Cap | Price | EPS (Local) | EPS (Local) | EPS (Local) | PE (x) | PE (x) | PE (x) | PB(x) | PB(x) | PB(x) | ROE(%) | ROE(%) | Sales (US$mn) | Sales (US$mn) | EBITDA margin (%) | EBITDA margin (%) | Net margin (%) | Net margin (%) | ||
|---|---|---|---|---|---|---|---|---|---|---|---|---|---|---|---|---|---|---|---|---|
| Company | Ticker | (US mn$) | (LC$) | 2026E | 2027E | 2028E | 2026E | 2027E | 2028E | 2026E | 2027E | 2028E | 2026E | 2027E | 2026E | 2027E | 5y avg. | 2026E | 5y avg. | 2026E |
| Taiwan | ||||||||||||||||||||
| Delta | 2308.TW | $133,140 | $1,620 | $40.54 | $63.96 | $98.92 | 40.0 | 25.3 | 16.4 | 11.7 | 8.9 | 6.7 | 31.6 | 37.5 | $24,527 | $34,412 | 17.1 | 20.1 | 10.2 | 13.6 |
| LiteOn | 2301.TW | $20,299 | $277 | $10.16 | $13.80 | $19.02 | 27.3 | 20.1 | 14.6 | 6.2 | 5.5 | 5.0 | 23.9 | 30.2 | $6,755 | $8,506 | 11.8 | 12.3 | 8.8 | 10.8 |
| US/EU | ||||||||||||||||||||
| Vertiv | VRT | $95,527 | $248 | $6.73 | $9.16 | $11.54 | 36.9 | 27.1 | 21.5 | 16.0 | 10.8 | 7.3 | 48.8 | 45.5 | $14,027 | $18,178 | 17.0 | 21.6 | 6.9 | 18.7 |
| Eaton | ETN | $158,914 | $409 | $13.58 | $16.06 | $18.70 | 30.1 | 25.5 | 21.9 | 7.2 | 6.5 | 6.0 | 23.7 | 25.0 | $32,741 | $36,196 | 21.9 | 23.7 | 13.6 | 15.8 |
| Schneider Electric | SCHN.PA | $194,810 | $287 | $10.17 | $12.15 | $14.10 | 28.3 | 23.7 | 20.4 | 6.2 | 5.4 | 4.8 | 22.4 | 23.9 | $51,930 | $57,075 | 21.2 | 21.7 | 11.2 | 12.9 |
| Flex | FLEX.O | $39,899 | $108 | $4.67 | $7.03 | $9.41 | 23.1 | 15.4 | 11.5 | 6.2 | 4.5 | 3.6 | 29.2 | 36.4 | $27,371 | $34,597 | 6.2 | 7.3 | 3.1 | 5.0 |
| China | ||||||||||||||||||||
| Megmeet | 002851.SZ | $10,982 | $128 | $1.24 | $2.83 | $4.03 | 102.8 | 45.1 | 31.7 | 9.6 | 8.1 | 6.8 | 10.0 | 17.8 | $27,371 | $34,597 | 8.3 | 5.3 | 6.4 | 5.5 |
| Zhongheng Electronic | 002364.SZ | $2,923 | $36 | $0.39 | $0.61 | $0.90 | 92.2 | 58.1 | 39.5 | 7.4 | 6.6 | 5.6 | 9.2 | 13.6 | $1,975 | $2,850 | 5.8 | 7.8 | 3.5 | 7.9 |
| Kstar | 002518.SZ | $3,014 | $35 | $1.33 | $1.94 | $2.54 | 26.6 | 18.2 | 13.9 | 3.8 | 3.2 | 2.7 | 15.0 | 19.7 | $458 | $635 | 16.6 | 14.8 | 13.4 | 11.8 |
| Kehua | 002335.SZ | $3,296 | $29 | $0.85 | $1.14 | $1.51 | 34.5 | 25.8 | 19.5 | 2.9 | 2.7 | 2.4 | 10.1 | 13.5 | $707 | $840 | 16.2 | 13.7 | 5.8 | 6.3 |
| Honor Electronic | 300870.SZ | $4,620 | $206 | $2.73 | $4.01 | $5.89 | 75.6 | 51.4 | 35.0 | 9.7 | 9.3 | 7.6 | 12.6 | 19.1 | $1,435 | $1,794 | 9.7 | 11.1 | 5.5 | 6.0 |
| Japan | ||||||||||||||||||||
| Panasonic | 6752.T | $66,765 | $4,200 | $204 | $249 | $297 | 20.6 | 16.8 | 14.1 | 1.8 | 1.7 | 1.5 | 8.9 | 9.9 | $791 | $1,023 | 9.6 | 11.1 | 3.9 | 6.0 |
| Sector avg. | 44.8 | 29.4 | 21.7 | 7.0 | 5.8 | 4.8 | 19.8 | 23.4 | 13.7 | 14.5 | 8.1 | 10.2 |
- EPS Average in US$, Share price as of 9/11
Source: UBS, Company data
Sector implications
AI Data Center Power Semis: Francois-Xavier Bouvignies
Key message : AI data-centre power semiconductors are one of the strongest growth opportunities in analog, with the market rising from roughly $4bn in 2026E to around $15bn by 2029-30E. However, the required pace of data-centre capacity additions is well above broader infrastructure forecasts, increasing the risk of a digestion period. We prefer prospective share gainers over incumbent leaders already discounting strong execution.
Revamped BoM estimates and higher units estimates drives TAM higher
Alongside this report, we update (link) our forecast for the AI power semis TAM to US $13bn by 2028E vs. US$11bn previously, rising to US$15bn in 2030, driven by higher custom ASICs power semis revenue and higher rack estimates across GPU and custom ASIC racks from UBS Taiwan Hardware team. We have expanded our bill of materials estimates to 30+ xPU generations, beyond the six GPU configurations we previously modelled. We have also adjusted component count to align rack configurations with UBS' Taiwan Hardware team and refined ASP estimates based on deep dives on the shifting product architecture of each power stage.
Our new estimates drive a content per GW range of $100-200m/GW and an average rising from $95m/GW in 2024 to $126m/GW in 2026E and $130-140m/GW beyond.
Implied GW additions suggest potential for a digestion period
Our estimates imply c60GW of capacity added in 2027, increasing steadily to c110GW in 2030, vs market expectations of c30-50GW annually. Cumulatively our estimates imply 370GW of capacity additions from 2026-2030E vs. <250GW in a 30-50W scenario. This also compares to <100GW of power grid additions in the US over the same period, though the delta could be bridged with behind-the-meter generation. Altogether we see an increasing likelihood of some digestion in power semis. While power semiconductor lead times are rising, we view electrical infrastructure as a larger bottleneck to AI buildout. Lead times for backup power systems and switchgear extend to ~18 months and beyond 3 years for utility scale transformers and on-site gas turbines.
40%
35%
30%
25%
20%
15%
10%
5%
0%
38%
36%
32%
How to play the theme: Prefer TI, ADI, and STM over Infineon
Given the potential for some level of digestion, we would take a selective approach to playing the theme. We are cautious on market share leaders such as Infineon (Neutral), given high investor expectations and increasing competition. We prefer potential market share winners with spare capacity, bringing new products to markets where they are not currently present such as TI (Buy) with PSUs and IBCs and Analog Devices (Buy) with VRMs. We also prefer stories where power is upside rather than core to the thesis, such as STMicro (Buy) with its photonics exposure.
Figure 80: DC revenue approaching 15% of group for diversified analog names
Source: Company data, VA consensus, UBS estimates; Navitas, Vicor, MPI, Diodes not covered
MLCC: Shingo Hirata and Jimmy Yoon Rising AI power a significant opportunity for MLCCs
We believe rising AI-related power requirements represent a significant growth opportunity for MLCC suppliers and will further accelerate the industry's migration toward higher-end products. To date, MLCC content growth has been driven primarily by compute boards, where content per system increased by approximately 5-10x with the transition from conventional servers to AI servers. We continue to see additional content expansion as the industry migrates to next-generation GPU and ASIC server racks.
Power content to expand with 800V and SST architectural migration
While the contribution from AI power applications remains relatively small compared with compute boards, we believe this represents a meaningful incremental growth opportunity for MLCCs as server power consumption continues to increase. Furthermore, architectural changes such as the adoption of 800V HVDC and solid-state transformers (SSTs) should create not only additional MLCC content opportunities but also a more favorable product mix, given the increasing need for higher-voltage MLCCs.
Capacity freed up by the EV slowdown can be deployed to AI power
Our recent discussions with TDK (JP6762) suggest that the company has started to see AI power MLCC revenue growing at more than 100% YoY, albeit from a relatively small base compared with its overall MLCC business. Management indicated that the slowdown in the EV market has freed up capacity, enabling the company to accommodate rapidly growing demand from AI power applications. Given the stringent reliability requirements of AI power systems, MLCC suppliers with a strong track record in xEV powertrain applications should be particularly well positioned to benefit. TDK estimates that it currently holds a 30-40% share of the AI power MLCC market. We believe robust demand for AI power MLCCs could increasingly drive capacity reallocation away from automotive powertrain applications. This could contribute to tighter supply-demand conditions across the broader MLCC market and potentially support future pricing improvements.
Energy Storage (BBU / CBU): Tim Bush and Kenji Yasui
What a hyperscaler uses batteries for
A hyperscaler cannot let chips go dark. There are two backups: First, a short backup in or next to the rack that covers a power dip from a fraction of a second to a few minutes so the rack stays up while building power supply recovers. The battery back up unit (BBU) and the faster capacitor back up unit (CBU) play this role. Second, the building (datacentre hall) covers a longer outage until generators start, and can run for hours. This is
02024 02025 • 2026
an uninterruptive power supply (UPS), or hall battery system.
Why the rack changes this
Older Hopper racks pulled high current at low voltage. The 800-volt Rubin design cuts current and lets voltage step down closer to the chips. Backup systems can now sit in a power cabinet (sidecar) beside the IT rack instead of inside every Hopper style server tray. Some sites will still put a BBU in the sidecar. Others will lean on the building UPS and keep only small, fast buffers at the rack. That is the operators' choice. Our working case for Rubin-class systems is about half still take a rack BBU.
BBU market $2.5bn in 2026, to $13bn by 2030
The BBU market is the battery next to / in the rack, not the building UPS. BBU sales should rise from $0.7bn in 2025 to $2.5bn in 2026 to $12.8bn by 2030. Nvidia is about $1.2bn of the 2026 total. Assuming a 5min duration and a BBU system cost of $0.2/W, we estimate that battery cells represent 10-15% of the BBU system cost. If we include the capacitor shelf the combined market (BBU + CBU) is $3.1bn in 2026 reaching $15.9bn in 2030. Growth in 2026-27 is more racks and more power per rack. Some investors treat Rubin as the end of BBU. In our view, Rubin gradually moves the battery out of the tray, not off the floor. The 800-volt sidecar still has an optional BBU and model a 40-50% attach rate on Rubin class systems. Dollars of BBU per rack rise versus Hopper because the rack draws much more power. What can fall is cylindrical cells in the tray, not backup as a product. If a site leans on hall UPS, attach in sidecar drops. Total batteries on the floor can still rise.
Positioning in battery - Panasonic leveraged to near rack side cars vs Samsung SDI driving toward the pooled storage opportunity
Panasonic is the compact rack product: cylindrical cells and full backup modules for the sidecar. Customers should keep buying that short duration backup. If reserve minutes move into the hall, cylindrical form factor in the tray could decline. Samsung SDI sell both rack cells and larger building batteries (UPS). In our view SDI could begin LFP for UPS at one of its two US expansion sites. They could be margin accretive with onshore battery production: US cell production can receive production tax credit; overseas cylindrical lines do not.
Figure 81: Global BBU TAM growing at a 78% CAGR to US$12.8bn
| AI Server BBU-only TAM (US$mn) | 2024 | 2025 | 2026E | 2027E | 2028E | 2029E | 2030E | CAGR (25-30) |
|---|---|---|---|---|---|---|---|---|
| NVIDIA NVL72+ | $0 | $169 | $756 | $1,958 | $2,135 | $3,129 | $3,780 | 86% |
| NVIDIA (HGX/LPU/CPU) | $94 | $65 | $425 | $614 | $1,532 | $1,773 | $1,866 | 96% |
| AMD | $4 | $4 | $26 | $216 | $569 | $806 | $957 | 195% |
| Total AI GPU BBU-only TAM (US$mn) YoY TAM Growth | $98 | $239 143% | $1,207 405% | $2,788 131% | $4,236 52% | $5,708 35% | $6,602 16% | 94% |
| AWS | $76 | $84 | $460 | $1,025 | $1,889 | $2,596 | $2,956 | 104% |
| $134 | $175 | $681 | $1,430 | $1,870 | $2,319 | $2,657 | 72% | |
| Meta | $0 | $1 | $15 | $92 | $159 | $219 | $272 | 233% |
| Microsoft | $3 | $3 | $6 | $12 | $18 | $24 | $29 | 59% |
| Tesla | $14 | $10 | $7 | $7 | $9 | $14 | $18 | 13% |
| Intel | $78 | $59 | $33 | $23 | $15 | $7 | $3 | -45% |
| OpenAI | $0 | $0 | $0 | $0 | $0 | $0 | $0 | N/M |
| Other ASICs | $104 | $149 | $132 | $149 | $194 | $244 | $296 | 15% |
| Total AI ASIC BBU-only TAM (US$mn) | $408 | $481 | $1,334 | $2,737 | $4,155 | $5,422 | $6,231 | 67% |
| YoY TAM Growth | 18% | 178% | 105% | 52% | 30% | 15% | ||
| Total AI Server BBU-only TAM (US$mn) | $506 | $720 | $2,542 | $5,525 | $8,390 | $11,130 | $12,834 | 78% |
| %of Total Power TAM | 10% | 11% | 14% | 14% | 15% | 15% | 14% | |
| YoY TAM Growth | 42% | 253% | 117% | 52% | 33% | 15% |
Source: UBS estimates
APAC Focus represents a curated selection of the best insights from Global Research APAC and showcases differentiated views and actionable ideas, based around unique evidence and key industry themes. It leverages the combined efforts of 130+ APAC analysts, and colleagues in other regions, to develop a broad and collaborative perspective. This research often leverages UBS proprietary assets, including UBS Evidence lab and Quant Answers, whilst utilizing new analytical approaches and identifying critical ESG themes.
To learn more about APAC Focus, visit UBS Neo.
*UBS Evidence Lab is a sell-side team of experts that work across numerous specialized labs creating insight-ready datasets. The experts turn data into evidence by applying a combination of tools and techniques to harvest, cleanse, and connect billions of data items each month. Since 2014, UBS Research analysts have utilized the expertise of UBS Evidence Lab for insight-ready datasets on companies, sectors, and themes, resulting in the production of thousands of differentiated UBS Research reports. UBS Evidence Lab does not provide investment recommendations or advice but provides insight-ready datasets for further analysis by UBS Research and by clients. All published UBS Evidence Lab content is available via UBS Neo. The amount and type of content available may vary. Please contact your UBS sales representative if you wish to discuss access.
Valuation Method and Risk Statement
Investing in the technology sector involves a high degree of risk. Rapid technological changes, increasing competition and exposure to macroeconomic cycles are among the many risks faced by investors in tech stocks. Moreover, it is extremely difficult to project the financial results of tech companies since their operating models are highly volatile and unpredictable. Finally, valuing tech stocks can prove challenging as neither traditional nor non-traditional valuation measures provide much insight into how these stocks trade.
Delta: We base our price target on PE multiple valuation.
Delta's businesses include SPS and components for a variety of end-applications, video displays and data networking subsystem and system products. Any changes in these endmarkets could affect our forecasts for Delta. Investment risk could increase/decrease on any deviation from our expectations for end-market demand and competition.
Downside risks for Delta include: severe supply chain constraints; weaker-than-expected PC/ server demand; a slower-than-expected IA recovery; and a slower ramp of 5G in 2022.
Megmeet: We value Megmeet based on SOTP methodology.
Downside risks for the company include: 1) structural price and supply risks of key raw materials, including semiconductors, magnetic components, passive components, structural parts, and PCBs. As direct materials account for >80% of COGS, raw material price fluctuations and S/D dynamics are the main factors affecting production costs; 2) undershooting demand -- disappointing AI development could be a drag on earnings; 3) changes in technical routes -- persisting uncertainties in AI power supply technology routes could weigh on earnings; 4) geopolitical tensions and changes in the international trade environment -- geopolitics and FX volatility could also affect earnings given rising overseas revenue exposure.
Upside risks for the company includes: 1) accelerated market share gain in Nvidia ecosystem for AI server power supplies; 2) faster R&D and adoption of 800V DC power products; 3) better-than-expected mass production execution and capacity ramp-up.
Lite-On: We value Lite-On Technology using PE methodology. Key risks to our investment thesis:
The principal risk is a slower AI infrastructure deployment cycle. Our industry work shows deployed IT GW is the single-largest determinant of the power TAM, so a meaningful reduction in hyperscaler accelerator deployment would affect all power suppliers.
Customer concentration is a second risk, particularly Lite-On's large custom-ASIC exposure and reliance on a relatively small number of hyperscalers. Program delays or share changes can materially affect annual revenue.
Execution on capacity expansion also matters. Lite-On is investing substantially ahead of forecast demand; if utilization ramps more slowly, depreciation and fixed operating costs could limit expected margin improvement.
Competitive pricing remains a risk as more suppliers qualify for high-power products. We believe the move toward larger, more engineered modules and systems should moderate pure commodity pricing pressure, but it will not eliminate it.
Architecture is another source of uncertainty. A slower transition to external power racks is not particularly damaging to our near-term thesis because 48/54V systems still require substantial power content. Longer term, however, the precise mix between rack-level BBUs, pooled UPS/BESS, ±400V, single-bus 800V and facility-level conversion will determine where value accrues within the supply chain.
Rising competition and slower spec upgrades would impact earnings. Faster progress from Chinese power suppliers, FX movements and weaker legacy IT/consumer demand could create additional earnings variability.
Required Disclosures
This document has been prepared by UBS Securities Pte. Ltd., Taipei Branch, an affiliate of UBS AG. UBS AG, its subsidiaries, branches and affiliates, including former Credit Suisse AG and its subsidiaries, branches and affiliates are referred to herein as "UBS".
For information on the ways in which UBS manages conflicts and maintains independence of its UBS Global Research product; historical performance information; certain additional disclosures concerning UBS Global Research recommendations; and terms and conditions for certain third party data used in research report, please visit https://www.ubs.com/disclosures. Unless otherwise indicated, information and data in this report are based on company disclosures including but not limited to annual, interim, quarterly reports and other company announcements. The figures contained in performance charts refer to the past; past performance is not a reliable indicator of future results. Additional information will be made available upon request. UBS Securities Co. Limited is licensed to conduct securities investment consultancy businesses by the China Securities Regulatory Commission. UBS acts or may act as principal in the debt securities (or in related derivatives) that may be the subject of this report. This recommendation was finalized on: 13 September 2026 06:16 PM GMT. UBS has designated certain UBS Global Research department members as Derivatives Research Analysts where those department members publish research principally on the analysis of the price or market for a derivative, and provide information reasonably sufficient upon which to base a decision to enter into a derivatives transaction. Where Derivatives Research Analysts co-author research reports with Equity Research Analysts or Economists, the Derivatives Research Analyst is responsible for the derivatives investment views, forecasts, and/or recommendations. Quantitative Research Review: UBS Global Research publishes a quantitative assessment of its analysts' responses to certain questions about the likelihood of an occurrence of a number of short term factors in a product known as the 'Quantitative Research Review'. Views contained in this assessment on a particular stock reflect only the views on those short term factors which are a different timeframe to the 12-month timeframe reflected in any equity rating set out in this note. For the latest responses, please see the Quantitative Research Review Addendum at the back of this report, where applicable. For previous responses please make reference to (i) previous UBS Global Research reports; and (ii) where no applicable research report was published that month, the Quantitative Research Review which can be found at https:// neo.ubs.com/quantitative, or contact your UBS sales representative for access to the report or the Quantitative Research Team on ubsquant-answers@ubs.com. A consolidated report which contains all responses is also available and again you should contact your UBS sales representative for details and pricing or the Quantitative Research team on the email above.