PDF 原檔:報告_UBS_漢測7856_首次覆蓋_20261008_original.pdf
圖片清單(已驗證 2026-10-12)
| 檔名 | size | 分類 | 親眼所見內容 |
|---|---|---|---|
報告_UBS_漢測7856_首次覆蓋_20261008_006.png |
42KB | 真資料圖 | Figure 6 示意:Tester/PCB-Probe Card/晶圓/Thermal Chuck/Prober 堆疊,Thermal Control Module(加熱+冷卻、進階溫度讀取、智慧溫控)位於 Prober 內 |
報告_UBS_漢測7856_首次覆蓋_20261008_007.png |
46KB | 真資料圖 | Figure 7/8:Insertion 2(Probe Card/PIC+EIC/矽基板/網格狀 Chuck/Lens/Periscope,光由下方穿過)與 Insertion 3(Socket/PIC+EIC/Receptacle/FAU)測試方式示意 |
報告_UBS_漢測7856_首次覆蓋_20261008_008.png |
140KB | 真資料圖 | Figure 9:CPO 測試流程圖,Insertion 1(EIC/PIC 晶圓)→2(EIC on PIC)→3(Optical Engine)→4(ASIC+OE Alignment 最終測試),各 insertion 列出測試服務商與設備廠(Advantest、Teradyne、Chroma、FormFactor、Tokyo Electron、MPI、ficonTEC、Hon Precision 等) |
報告_UBS_漢測7856_首次覆蓋_20261008_010.png |
152KB | 真資料圖 | Figure 11:32 顆 OE 的交換器 ASIC 晶片示意及 CPO 封裝供應鏈標註(Switch chip CoW:TSMC;OE stacking:TSMC/BESI;OE on substrate:ASE/SPIL;FAU coupling 服務:ASE/SPIL;FAU 耦合設備:All Ring、ADST、MRSI) |
報告_UBS_漢測7856_首次覆蓋_20261008_015.png |
66KB | 真資料圖(財務類) | Hon Precision、Chroma、Cohu、JHT、Changchuan 的 forward PE 走勢(2022-2026),同業均值 35x,+1std 52x、-1std 18x;不嵌公司頁 |
報告_UBS_漢測7856_首次覆蓋_20261008_016.png |
64KB | 真資料圖(財務類) | 7856 股價 NT$4,190 與 12 個月上檔 10,000/基準 8,880/下檔 1,500 情境三角圖,附熱管理模組出貨、CPO insertion 2&3 出貨、毛利率驅動假設;不嵌公司頁 |
報告_UBS_漢測7856_首次覆蓋_20261008_019.png |
62KB | 裝飾·非資料 | 股價與評等沿革圖(No Rating,2025-10 至 2026-10 股價線),免嵌 |
| 其餘 001~005、009、011~014、017~018 | <40KB | 未 Read | 小圖表(銷售組合、CP 功耗趨勢、毛利率等),不嵌 |
其餘 <40KB 圖未 Read(預設 logo/小圖表);財務、估值、股價類圖表不嵌公司頁。
原始內容
Initiation of Coverage
Hermes Testing Solutions
Shifting-left, scaling-up: dual catalysts in chip probing and CPO
Jack-of-all-trades for bespoke testing solutions in the se iconductor industry
We initiate coverage of Hermes Testing HTSI) with a Buy rating and NT$8,880 PT. HTSI is uniquely positioned to benefit from two key semiconductor testing trends: shift-left testing and the emerging CPO testing market. Leveraging its long-standing relationship with TSMC, HTSI has established capabilities across electrical test engineering, customised test equipment, thermal control modules, probe cards, and CPO testing solutions. We forecast revenue growth of 127%/152%/78% in 2026E/27E/28E, driven by increasing adoption of thermal control modules for wafer-level test and initial deployment of CPO insertion 2 and insertion 3 test equipment through ficonTEC. Additional 2028E growth drivers include reflow tools, laser clean solutions, and MEMS probe cards. The stock trades at 27/15x 2027/28E PE, versus ~35x NTM PE for handlerequipment peers, offering re-rating potential as sales scale, new products are qualified, and its CPO presence expands. See our companion testing deep dive sector note.
Shift-left beneficiary with exceptional ther al control odules
Thermal control modules should be HTSI's largest growth driver over the next several years. We expect increasing chip power consumption, rising package complexity, and tighter probe pitches to drive adoption of advanced thermal control solutions used alongside leading-edge probers, in additional to more wafer level insertions and longer test time. We estimate HTSI will ship approximately 3,000 thermal-control modules in 2027E, up from around 1,200 units in 2026E, sales contribution rise from ~30% in Q226 to >50% of sales by 2027E. The launch of its second-generation platform in 2027E, which carries 25-50% higher ASPs, should further improve profitability. We forecast GM expansion from 55.5% in 2026E to 58.3%/60.0% in 2027E/28E.
Unique position to capture CPO upside
Through its partnership with German optical-automation leader ficonTEC, HTSI is positioned to participate in the initial ramp of CPO testing equipment. HTSI supports local manufacturing, installation, automation and after-sales service, making it a key enabler of volume production. We estimate HTSI captures approximately 30% of equipment value across the 40 insertion 2 and 70 insertion 3 systems we forecast for delivery in 2027E, with further potential upside in 2028E as adoption expands.
Valuation: initiate coverage with a Buy rating and price target NT$8,880
We forecast EPS of NT$29.1 in 2026E including a one-off employee share purchase programme impact), rising to NT$153.3/286.5 in 2027E/28E. Our NT$8,880 price target is based on 31x average 2028E PE, versus handler-equipment peers forward PE at roughly 35x, reflecting HTSI's unique exposure to both shift-left testing, CPO, and our estimate of 32% LT earnings CAGR. We initiate with a Buy rating.
| Highlights (NT$ ) | 12/24 | 12/25 | 12/26E | 12/27E | 12/28E | 12/29E | 12/30E |
|---|---|---|---|---|---|---|---|
| Revenues | 1,598 | 2,425 | 5,505 | 13,879 | 24,713 | 29,218 | 32,810 |
| EBIT (UBS) | 54 | 297 | 1,076 | 6,154 | 11,604 | 14,294 | 16,170 |
| Net earnings (UBS) | 57 | 268 | 862 | 5,059 | 9,454 | 11,664 | 13,227 |
| EPS (UBS, diluted) (NT$) | 2.71 | 10.65 | 29.11 | 153.28 | 286.48 | 353.44 | 400.81 |
| DPS (net) (NT$) | 0.00 | 1.10 | 11.64 | 61.32 | 114.60 | 141.38 | 160.33 |
| Net (debt) / cash | 469) | 618 | 14,360 | 17,474 | 22,786 | 29,613 | 36,992 |
| Profitability/valuation | 12/24 | 12/25 | 12/26E | 12/27E | 12/28E | 12/29E | 12/30E |
| EBIT (UBS) argin % | 3.4 | 12.2 | 19.5 | 44.3 | 47.0 | 48.9 | 49.3 |
| ROIC (EBIT) % | - | 41.7 | 147.5 | 381.2 | 334.1 | 282.5 | 261.7 |
| EV/EBITDA (UBS core) x | - | 35.1 | 80.1 | 15.1 | 7.7 | 5.8 | 4.7 |
| P/E (UBS, diluted) x | - | 68.6 | NM | 27.3 | 14.6 | 11.9 | 10.5 |
| Equity FCF (UBS) yield % | - | 2.5 | 0.6 | 3.0 | 6.4 | 9.3 | 10.6 |
| Dividend yield (net) % | - | 0.2 | 0.3 | 1.5 | 2.7 | 3.4 | 3.8 |
Source: Company accounts, LSEG Eikon, UBS estimates. Metrics marked as UBS) have had analyst adjustments applied. Valuations: based on an average share price that year, E): based on a share price of NT$ 4,190.00 on 06-Oct-2026
Equities
Taiwan
Semiconductors
| 12- onth rating | Buy Prior : No Rating |
|---|---|
| 12 price target | NT$8,880.00 Prior : |
| Price (06 Oct 2026) | NT$4,190 |
RIC: 7856.TWOBBG: 7856 TT
Trading data and key etrics
52-wk range
Market cap.
NT$5,295.00-516.55
NT$114b/US$3.58b
Shares o/s
27.2m ORD)
Free float
94%
Avg. daily volu e ('000)
240
Avg. daily value ( )
NT$1,068.4
Co on s/h equity (12/26E)
NT$15.2b
P/BV (12/26E)
9.1x
Net debt to EBITDA (12/26E)
NM
| Fro | To | % ch | Cons. | |
|---|---|---|---|---|
| EPS (UBS, 12/26E | diluted) - | (TWD) 29.11 | - | 32.19 |
| 12/27E | - | 153.28 | - | 89.82 |
| 12/28E | - | 286.48 | - | 71.44 |
Ryan Sun
Analyst
+886-2-8722 7267
Sunny Lin
Analyst sunny.lin@ubs.com +886-2-8722 7346
Thesis Map UBS Research THESIS MAP a guide to our thinking and what´s where in this report
Pivotal Questions
UBS VIEW
EVIDENCE
WHAT´S PRICED IN?
Upside/Downside Spectrum
Company Description
Q: Will HTSI be able to keep its oat within chip probing ther al control odules?
Yes. We expect HTSI's competitive position to strengthen as chip power consumption, package complexity, and probe density continue to increase. The company is developing next-generation thermal control solutions, including liquid cooling technologies, while also expanding into specialized chuck solutions designed to address wafer warpage. In addition, HTSI's close collaboration with TSMC, TEL, Advantest, and other OSATs should reinforce its position within advanced wafer-level testing.
Q: Will insertion 2 of CPO testing process be skipped?
No. We believe concerns surrounding insertion 2 adoption are overdone. While some industry participants favor bypassing insertion 2 due to throughput and ROI considerations, doing so increases the risk of defective optical engines being identified only after the components are delivered to OSATs, creating yield accountability challenges and higher packaging losses. Based on our industry studies, we expect insertion 2 testing to remain an important part of the CPO workflow over at least the next two years as the industry focuses on improving PIC yields and overall testing efficiency.
We initiate coverage of Hermes Testing HTSI) with a Buy rating and NT$8,880 price target. HTSI offers unique exposure to two of the semiconductor testing industry's most attractive growth drivers: 1) shift-left testing and 2) CPO testing. The industry's shift-left testing strategy will have more test insertions move to the wafer level before packaging, in addition to longer CP time. Leveraging its longstanding relationship with TSMC, HTSI has established capabilities across thermal control modules, electrical-test engineering services, customized equipment, and emerging CPO testing solutions. We believe there could be re-rating potential as sales scale, new products are qualified, and its CPO presence expands.
TSMC and OSATs have been expanding their CoWoS capacities aggressively, from 40kwpm in 2024 to around 90 kwpm in 2025, and is tracking to expand CoWoS capacity toward 160kwpm in 2026E. TSMC also ramped up expanding N3/N2 capacity, with multiple product launches from customers' pipelines-Nvidia's Rubin, AMD's MI400 series/Venice CPU and other cloud ASICs-translating into foreseeable, strong testing demand.
Despite a 264% YTD share-price increase, HTSI currently trades at just 15x of our 2028E EPS versus handler-equipment peers forward PE at roughly 35x. We believe market expectations for 2027 CPO testing equipment shipments remain conservative, particularly for insertion 2 equipment. Based on our industry analysis, we estimate HTSI will deliver 40 insertion 2 and 70 insertion 3 systems in 2027E, this should be higher than the market's expectation of no insertion 2 and limited insertion 3 shipment due to engineering bottleneck. We also see further upside in 2028E as CPO adoption expands. Our reverse DCF analysis indicates that the current market price implies only a 17% long-term sales CAGR vs our estimate of 27% and long-term GM level of 33% vs our estimate of 61%. We see scope for re-rating.
Value drivers (2027/28E) Thermal control module shipmentsCPO insertion 2 & 3 shipments GM
| NT$10,000 upside | 3,300/5,000 | 60&100 / 100&180 | 61.2%/63.6% |
|---|---|---|---|
| NT$8,880 base | 3,000/4,100 | 40&70 / 80&160 | 58.3%/60.0% |
| NT$1,500 downside | 1,300/2,000 | 5&20 / 10&50 | 53.3%/54.0% |
Source: UBS estimates
Hermes Testing Solutions HTSI) was founded in 2004 in Hsinchu, Taiwan. It focuses on providing semiconductor testing and inspecting solutions, equipment installation, technical support, and maintenance services. Its main business segments are customized semiconductor equipment, engineering services, and probe cards and other materials.
Testing TAM expanding with IC co plexity: leaders likely to outperfor industry growth
Our central view is that testing content per AI accelerator is growing faster than semiconductor unit volumes, creating a multi-year expansion in testing TAM. We believe semiconductor testing is entering a period of structural growth as AI-driven chip complexity increases testing intensity across wafer, package and system levels. The industry's shift-left strategy, which moves more testing upstream in the semiconductor manufacturing process, is resulting in longer and more frequent test insertions. As cloud AI GPUs and ASICs become increasingly complex, additional testing is required to ensure functionality, performance and yield, while reducing defective parts per million DPPM). More robust testing should improve deployment efficiency and lower the cost of operating AI infrastructure.
Semiconductor testing generally comprises four stages: wafer/chip probing CP), final test FT), system-level test SLT), and burn-in. CP is conducted at the wafer-level before packaging, while FT, SLT, and burn-in occur after packaging. The below Figure 3Semicondutr sgp:fwalvk illustrates the semiconductor manufacturing flow.
Figure 1: Se iconductor testing process: fro wafer level to package level
Source: UBS
We estimate semiconductor testing historically accounts for ~1% of total semiconductor revenue. Within testing, consumables such as probe cards, sockets and interface boards represent ~10-15% of industry revenue. According to Yole, the probe card, socket and interface board markets should grow from US$3.8bn, US$2.3bn and US$1.7bn in 2026 to US$5.5bn, US$3.1bn and US$2.0bn by 2031, respectively.
Figure 2: Yole esti ating testing consu ables TAM to cli b in the next 5 years
Source: Yole, UBS
Nonetheless, leaders within the testing sector will standout among competition, with greater sales CAGR comparing to the industry.
We see HTSI's sales for the next few years to mainly be driven by 1) thermal control module shipment and 2) CPO equipment shipment. In the past, thermal control modules weren't necessary for chip probing, due to less TDP for the chips. However, as new iterations of AI accelerators now got substantial power draw, this unlocks a brand new TAM for HTSI to enter with their thermal control modules to pair with probers, in order to prevent probe card damages.
-
Robust ther al control odule ship ents. We estimate HTSI to ship 3,000/4,100 thermal control modules in 2027E/28E, with continuous demand in future years, bringing their 2026-31E semiconductor equipment sales CAGR to 48%.
-
Ther al control odule ASP expansion. Gen 2 thermal control modules will start to ship in 2027E which will drive tool ASP up around 25-50%.
- De and supported by Advantest expansions. We believe the 3,000 thermal control modules shipment forecast for 2027E is not far-fetched, as we read-across from Advantest's announced capacity expansion plan testers will be paired with probers with a 1:1 ratio) with increasing capacity up to 5,000 testers within FY2027/3 and they also announced a 10,000-unit target within CY2028. Although the testers capacity expansion plan includes testers for final test, we do see a good portion to be allocated to chip probing given shift-left testing trend increasing both testing insertions and testing time before chip packaging.
- CPO is another brand new TAM for se iconductor testing. As insertion 2 and 3 testing equipment demand starts to rise in 2027 with scale-out CPO adoption, we see HTSI to ship 40/70 insertion 2 and 3 equipment in 2027E, with this number growing in 2028E to 80/160 and higher in future years as CPO proliferates, and driving 52% 2026-31E test equipment & engineering services sales CAGR.
- CPO to see content increase. Gen 2 insertion 3 equipment may start to ship in 2027E, with higher throughput and tool ASP.
- Insertion 2 ight scale down, but not happening anyti e soon. Insertion 2 equipment shipment might come down in 2029E and beyond, as foundries scaleup yield for photonic IC PIC) in order to lessen the time consuming insertion 2 testing burden.
Figure 3: Her es Testing is set to benefit with a 46% 2026-31E sales CAGR
| Sales by Segments NT$m | 2026E | 2027E | 2028E | 2029E | 2030E | 2031E | 2026-31E CAGR |
|---|---|---|---|---|---|---|---|
| Semiconductor Equipment & Customization products YoY | $2,815 | $7,980 183% | $13,324 67% | $16,061 21% | $18,315 14% | $20,104 10% | 48% |
| Test Equipment & Engineering services YoY | $1,480 | $3,887 163% | $7,901 103% | $8,887 12% | $9,898 11% | $11,853 20% | 52% |
| Probe cards and cleaning materials YoY | $1,210 | $2,012 66% | $3,488 73% | $4,270 22% | $4,597 8% | $4,681 2% | 31% |
| Key products shipment units, ASP, sales | 2026E | 2027E | 2028E | 2029E | 2030E | 2031E | 2026-31E CAGR |
| Thermal control module shipment Thermal control product blended ASP (NT$m) Total sales from thermal control module shipment % of total sales | 1,200 $1.9 $2,316 42% | 3,000 $2.4 $7,168 52% | 4,100 $2.8 $11,417 46% | 4,500 $3.0 $13,505 46% | 4,700 $3.3 $15,591 48% | 4,900 $3.5 $17,067 47% 20 | 49% |
| CPO Insertion 2 shipment Ins2 blended ASP (NT$m) Total sales from insertion 2 | 8 $13.8 $111 | 40 $15.8 $633 | 80 $17.4 $1,391 6% | 60 $18.3 $1,095 4% | 20 $19.2 $383 | $20.1 $402 1% | |
| % of total sales CPO insertion 3 shipment | 2% 11 | 5% 70 | 160 | 200 | 1% 240 | 280 | 29% |
| Ins3 blended ASP (NT$m) Total sales from insertion 3 % of total sales | $16.0 $176 3% | $17.2 $1,202 9% | $18.2 $2,917 12% | $19.1 $3,829 13% | $20.1 $4,824 15% | $21.1 $5,910 16% | 102% |
| Key product sales - total % of total sales | $2,602 47% | $9,002 65% | $15,725 64% | $18,429 63% | $20,798 63% | $23,379 64% | 55% |
| Others - total % of total sales | $2,903 53% | $4,877 35% | $8,988 36% | $10,789 37% | $12,012 37% | $13,260 36% | 36% |
| Operating Metrics | 2026E | 2027E | 2028E | 2029E | 2031E | CAGR | |
| Revenue NT$m YoY | $13,879 | $24,713 | 2030E | $36,639 | 2026-31E | ||
| $29,218 | 11.7% | 46% | |||||
| $5,505 | 152.1% | 78.1% | 18.2% | $32,810 12.3% | |||
| GM % | 55.5% | 58.3% | 60.0% | 60.9% | 61.3% | 61.1% | |
| OpM % | 19.5% | 44.3% | 47.0% | 48.9% | 49.3% | 51.1% |
Source: UBS estimates
Robust growth drivers across se iconductor testing
We believe HTSI is set to benefit from several semiconductor testing growth drivers and capture the AI induced, expanding testing TAM. We see HTSI is uniquely positioned as the main beneficiary of two of the strongest growth drivers within semiconductor testing: testing shift-left and CPO.
Shift-left igniting secular growth for chip probing
The industry's adoption of shift-left testing should drive a multi-year structural growth opportunity for chip probing CP) and its supply chain. As advanced packaging costs rise and AI accelerators become increasingly complex, semiconductor manufacturers are placing greater emphasis on identifying known-good dies KGD) before packaging.
Figure 4: CP is set to grow substantially with shift-left, each packaging step set to be MORE costly than the prior step
Source: UBS
The economics of advanced packaging reinforce this trend. Heterogeneous integration, chiplet architectures and 2.5D/3D packaging significantly increase package value, while defects identified late in the manufacturing process can lead to substantial scrap costs. To mitigate this risk, foundries and OSATs such as TSMC and ASE employ distributed testing flows incorporating KGD, known-good-stack KGS) and assembly test screening, to catch defects before the components enter a multi-week packaging cycle >2 weeks for CoW and 2 weeks for oS). The importance of these tests rises as AI clusters become increasingly dependent on component reliability and low defective-parts-per-million DPPM) rates. Given the multiplicative yield degradation, a 300bps yield decline at just one manufacturing stage e.g. dropping from 99.5% to 96.5%) reduces overall integrated four-stage yield from 98.0% to 95.0%; on a 500,000 unit ramp at US $10,000 per unit, this 3% scrap delta translates into around US$150m in unrecoverable losses given >6-month manufacturing lead times.
At the same time, rising chip power consumption is increasing the technical difficulty of wafer-level testing. As chip thermal design power scales beyond 1,000W and power density is expected by the industry to surge another 8x by 2030, traditional wafer-level chip probe WLCP) encounters severe physical bottlenecks. Finer probe pitches and higher power densities increase the risk of overheating, probe needle burnout and yield degradation, creating demand for more advanced probing and thermal-control solutions.
Figure 5: CP power delivery trend rises with process tech evolution
Source: UBS
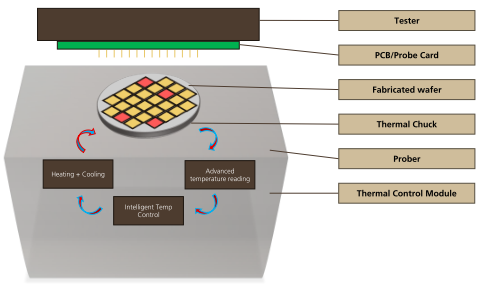
Figure 6: Ther al control odule inside probers are essential to control wafer te perature
From pin count of ~20k Migrating now to ~40k In 2-3 years pin count >100k
Source: UBS
Her es Testing (HTSI) is a key beneficiary of this trend. Leveraging its long-standing relationship with TSMC and expertise in semiconductor test solutions, HTSI supplies advanced thermal control modules used alongside leading-edge probers made by Tokyo Electron), particularly for AI applications. These thermal control modules are required for high TDP semiconductor wafer probe in order to maintain the temperature of the chuck to avoid needle burns or probe card damages. We estimate HTSI will ship approximately 3,000 thermal-management modules in 2027E, up from 1,200 in 2026E, supporting sales growth of 127%/152% in 2026E/27E. HTSI is also the partner for prober installation, prober maintenance and services. In addition, HTSI provides highend chuck processing services, an area that should benefit from increasing package sizes and higher wafer warpage associated with advanced packaging.
Beyond thermal control modules, HTSI also supplies consumables and customised solutions for wafer-level testing, including probe card cleaning sheets and laser-based probe head cleaning systems. As probing intensity increases under the shift-left testing model, demand for cleaning and maintenance solutions should rise alongside probe card utilisation. Currently, cleaning sheets is around 5% of sales, but we believe it could gain traction in 2027/28E and beyond. We see additional upside from future modular laser cleaning systems that could be integrated directly with probers, further expanding HTSI's content opportunity within advanced wafer-level testing.
CPO testing fuelling future growth for se iconductor testing
As interconnect bottlenecks increasingly shift from the memory wall to the copper wall, we believe co-packaged optics CPO) adoption is inevitable over the longer term. Testing remains one of the key bottlenecks to CPO deployment, as optical validation differs fundamentally from the electrical testing processes that have dominated semiconductor manufacturing for decades. As a result, CPO is creating a new testing opportunity across the semiconductor equipment and consumables ecosystem. We have written extensively on CPO and opportunities that it brings to the semiconductor supply chain, see our CPO deep dive, our thoughts on CPO timing, 2026 SiPhIA conference takeaways, and SEMICON 2026 takeaways.
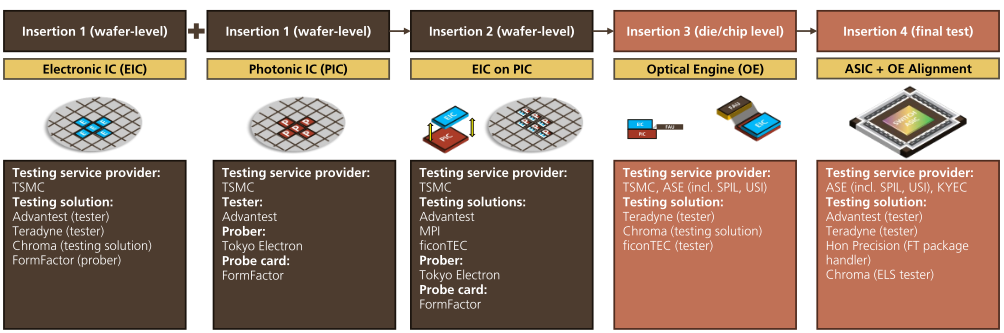
Various test equipment suppliers are scrambling to come up with ideal testing equipment across the four insertions of CPO testing, with solutions to ensure both optical and electrical signal integrity of the CPO solutions. The four insertions are:
- Insertion 1: Electronic IC (EIC)/Photonic IC (PIC) test. Single-side wafer test that has dedicated probe cards to test the fabricated EIC/PIC wafers.
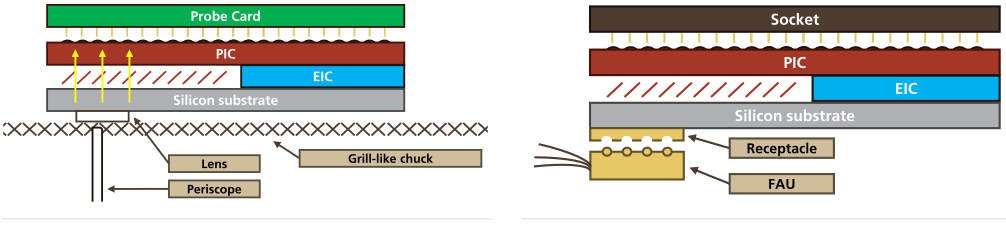
- Insertion 2: Optical/Electrical test. Double sided wafer test, testing the hybrid bonded e.g. via TSMC's COUPE) EIC and PIC wafers by an opto-electrical test that verifies the electrical signals on the top and optical signal on the bottom of the hybrid bonded wafers.
- Insertion 3: Optical engine (OE) test. The OE tests are done to ensure the quality of the OEs and with FAU Fiber Array Unit) attached, to ensure the signal integrity of the OEs. The testing equipment needs to be able to handle 224G per channel data rates, requiring high unit per hour UPH) throughput, meticulous dirt mitigation, and maintaining a near 100% contact rating on high-speed sockets.
- Insertion 4: ASIC final test. This final test step is established post the OEs are packaged together with the ASIC. The complete ASIC package now with CPO) is now tested for opto-electrical functionalities.
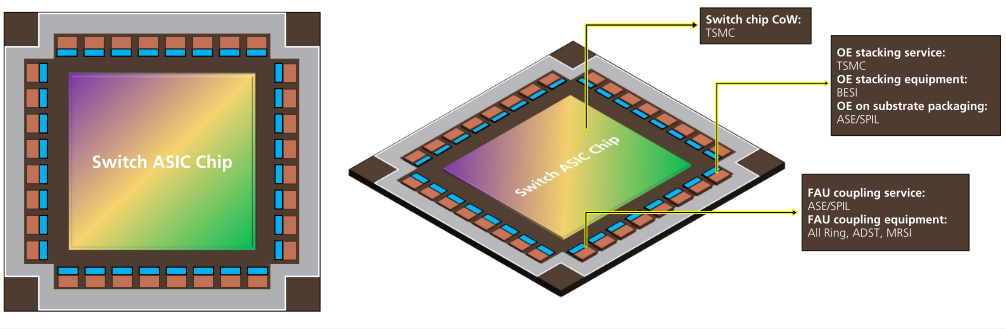
As it stands, insertion 2 and insertion 3 are the two areas where there are the most debates in the industry. Insertion 3 suppliers such as Chroma has noted the trend of 'shift-to-middle' paradigm centered on insertion 3. In high-density scale-out switches deploying up to 32 optical engines e.g. Nvidia's Spectrum-X architectures), any OE defect results in package scrap at the CoWoS level, making 100% known good die KGD) validation at the singulated OE stage an absolute commercial requirement.
Figure 7: An illustration for insertion 2 test ethod
Figure 8: An illustration for insertion 3 test ethod
Source: UBS
Source: UBS
As shown in the below figure, as there are no set standards for the testing equipment, throughput and stability are now the main target and area of competition for the major players in the field. Notable ones for each insertions are listed.
Figure 9: CPO testing flow chart with key suppliers
Source: UBS
With its 25 years of precision test equipment expertise, ficonTEC is an early mover for CPO test equipment and has key know-how for optical alignment, which is quintessential for optical test. HTSI, through its partnership with ficonTEC, is set to be a major beneficiary once CPO proliferates in 2027E-28E. As the partner of ficonTEC, Hermes Testing is the key enabler that can help ficonTEC achieve HVM for its CPO testing equipment. As of now, our view is that both insertion 2 and insertion 3 should be required within the next two years, despite the difficulties surrounding double-sided wafer probing insertion 2), as the yield for OEs are still not high enough to avoid defective dies. Finding out known-good OEs will be crucial before the FAU coupling process during the latter stages of CPO packaging, to prevent impeding the final package with multiple OEs attached to the switch ASIC e.g. 32 OEs on Nvidia's Spectrum-X). We estimate Hermes Testing will ship 40/70 units of insertion 2/3 testing equipment in 2027E, with potential upside to the numbers as we view Hermes Testing will likely assist with the ramp up for Gen 2 insertion 3 equipment in 2027E. Gen 2 insertion equipment will come with better throughput and ASP.
Figure 10: We believe HTSI CPO equip ent sales will pick up in 2027/28E with 541%/135% YoY growth
Source: UBS estimates
Beyond insertions 2 and 3, HTSI is also positioned to participate in insertion 1 testing through customised prober solutions for photonic integrated circuit PIC) testing. We believe these solutions could eventually be packaged as licensable intellectual property, creating an additional long-term growth opportunity as CPO adoption broadens. While near-term testing growth is driven by AI accelerators, CPO represents the next major expansion cycle for semiconductor testing. We believe HTSI is uniquely positioned to participate across multiple test insertions, providing exposure to a potentially significant source of incremental revenue beginning in 2027E.
Figure 11: A switch chip with 32 OEs and the CPO packaging supply chain
Source: UBS
HTSI's unique position for new TAM of ther al control odules and CPO test equip ent
Hermes Testing Solutions HTSI) was founded in 2004 in Hsinchu, Taiwan, as a spin-off from Hermes-Epitek. The company provides semiconductor testing and inspection solutions, engineering services, customized equipment, and test consumables. HTSI maintains a global service footprint across Taiwan Hsinchu, Tainan), Mainland China Suzhou), Japan Tokyo, Kumamoto), Singapore, Malaysia, and the United States Arizona), enabling close support for leading semiconductor customers.
Its main business segments are structured around three pillars:
- Se iconductor equip ent and custo ized products: HTSI utilises a dualtrack strategy of independent R&D and also equipment agency sales. They offers
highly customized solutions designed to address specific client pain points and bottlenecks. Key products include: thermal control modules that pair with a 1:1 ratio with wafer-level test probers, electron beam inspection equipment, white light interference optical inspection systems, laser probe cleaning machines, and the SYMPHONY fluxless reflow system.
- Testing equip ent engineering services: The company operates the largest engineering service team in Taiwan, consisting of over 340 technical professionals. The engineering service team provides extensive equipment life-cycle support, including installation, relocations, modification, testing, routine maintenance, and repair services. CPO related equipment sales/services will be recognized within this segment, as CPO are not direct HTSI products, but rather sales recognition via its partnership with ficonTEC.
- Probe card design, anufacturing, and cleaning aterials: HTSI delivers a comprehensive product portfolio that supports the entire probe card life-cycle. For probe cards, they supply membrane, cantilever, and vertical probe cards. As they are small in scale, HTSI targets niche probe card applications such as RF, 5G/6G, millimeter wave, LCD driver, low end logics, TIA Transimpedance Amplifier), etc. In addition to the three existing probe technologies, HTSI also collaborates with MJC in Japan for MEMS probe development, targeting sales in 2028E for high-end, AI/ HPC related applications. Cleaning materials is another important business within this segment, as HTSI source and process sand paper or other materials to offer cleaning sheets to clean the probe cards, removing oxidations, unwanted particles and substances that accumulated on the probe cards during the testing process.
The sales resiliency in the coming years mainly stems from its robust relationship with key industry players, especially as an engineering and service provider with TSMC for testing solutions. This sets up a solid foundation for its customized equipment business, as they know the specific testing bottleneck to tackle. For instance, as Hermes-Epitek manufacturers the probers for Tokyo Electron TEL) and HTSI helps with installation, services, and maintenance of the probers, they understand the thermal bottlenecks that the wafer-level test industry has been facing and can effectively come up with module solutions to solve this.
Margins set to expand with value-added products and services
The company has demonstrated strong execution in advanced wafer-level testing, with H126 revenue of NT$2.2bn already exceeding 90% of FY25 revenue NT$2.4bn). Profitability has also improved significantly, with GM increasing from 42.1% in 2025 to 54.9% in H126.
With share of value-added products and services set to rise in 2027E in sales mix, HTSI is set to see GM and operating leverage expansion. As a niche engineering service provider that has robust ties to leading foundries and OSATs, we believe HTSI has substantial pricing power and estimate HTSI' GM for thermal control modules to be around 65%, with GM for CPO equipment of around 60% as HTSI provides an engineering-servicelike business for it. We believe these factors will help the company to reach a 60% longterm GM range.
OPM is also set to expand with customized equipment sales rise in total sales mix. If we exclude the one-time expense to be recognized during Q326 for employee stock benefits we estimate around NT$1bn), YoY opex growth will be around 99% for 2027E, with downside risk if the company conducts tight cost control measures. We forecast the company's OPM will expand from 19.5% in 2026E, to 44.3%/47.0% in 2027/28E.
Figure 12: HTSI sales set to continue to cli b with 152% growth and GM at 58.3% in 2027E
Source: UBS estimates
Figure 14: We see custo ized equip ent to continue to drive co pany growth
Source: Company data, UBS estimates
Figure 16: UBS earnings forecast
| (NT$m) | 2025 | Q126 | Q226 | Q326E | Q426E | 2026E | Q127E | Q227E | Q327E | Q427E | 2027E | 2028E | 2029E | 2030E |
|---|---|---|---|---|---|---|---|---|---|---|---|---|---|---|
| Revenue | 2,425 | 985 | 1,200 | 1,513 | 1,807 | 5,505 | 2,634 | 3,197 | 3,760 | 4,289 | 13,879 | 24,713 | 29,218 | 32,810 |
| - YoY chg (%) | 52% | 123% | 108% | 28% | 127% | 167% | 166% | 149% | 137% | 152% | 78% | 18% | 12% | |
| - QoQ chg (%) | -30% | -51% | 54% | 51% | 46% | -42% | 43% | 34% | ||||||
| Gross profit | 1,021 | 545 | 655 | 843 | 1,012 | 3,054 | 1,534 | 1,856 | 2,184 | 2,523 | 8,097 | 14,817 | 17,801 | 20,107 |
| - Gross margin | 42.1% | 55.3% | 54.5% | 55.7% | 56.0% | 55.5% | 58.3% | 58.1% | 58.1% | 58.8% | 58.3% | 60.0% | 60.9% | 61.3% |
| Operating profit | 297 | 323 | 411 | -399 | 741 | 1,076 | 1,166 | 1,408 | 1,657 | 1,923 | 6,154 | 11,604 | 14,294 | 16,170 |
| - Operating margin | 12.2% | 32.8% | 34.3% | -26.4% | 41.0% | 19.5% | 44.3% | 44.1% | 44.1% | 44.8% | 44.3% | 47.0% | 48.9% | 49.3% |
| Pre-tax profit | 322 | 326 | 412 | -396 | 743 | 1,085 | 1,205 | 1,449 | 1,700 | 1,968 | 6,323 | 11,818 | 14,580 | 16,534 |
| Net profit | 268 | 254 | 330 | -317 | 594 | 862 | 964 | 1,160 | 1,360 | 1,574 | 5,059 | 9,454 | 11,664 | 13,227 |
| - YoY chg (%) | 373% | 586% | 301% | 299% | 221% | 280% | 251% | -529% | 165% | 487% | 87% | 23% | 13% | |
| - QoQ chg (%) | 70% | 23% | -225% | 80% | 62% | 35% | 41% | 36% | ||||||
| Basic EPS (NT$) | 10.83 | 9.35 | 12.15 | -10.20 | 18.01 | 29.11 | 29.22 | 35.14 | 41.22 | 47.70 | 153.29 | 286.49 | 353.45 | 400.82 |
| - YoY chg (%) | 281% | 492% | 279% | 200% | 169% | 213% | 189% | -504% | 165% | 427% | 87% | 23% | 13% | |
| - QoQ chg (%) | 55% | 12% | -209% | 48% | 62% | 21% | 41% | 36% |
Source: UBS estimates
Figure 13: OPM set to grow to 44.3%/47.0% in 2027/28E
Source: UBS estimates. Note 2026E opex includes a one-time NT$1bn employee stock benefit.
Figure 15: HTSI H126 sales ix breakdown
Source: Company data, UBS
Figure 17: Testing supply chain valuation table
| Market cap | Price Target | Share price | EPS growth (%) | EPS growth (%) | P/E (x) | P/E (x) | P/BV | (x) | ROE (%) | ROE (%) | ||||
| Company name | Ticker | Analyst | (US$m) | (LC) | (LC) | Rating | 2026E | 2027E | 2026E | 2027E | 2026E | 2027E | 2026E | 2027E |
| Testing service provider | ||||||||||||||
| ASE Industrial | 3711.TW | Sunny Lin | 104,043 | 835 | 744 | Buy | 104 | 64 | 39.3 | 24.0 | 7.5 | 6.3 | 21 | 28 |
| King Yuan Electronics | 2449.TW | Sunny Lin | 11,456 | 325 | 298 | Buy | 40 | 62 | 32.6 | 20.1 | 5.9 | 5.0 | 20 | 27 |
| Amkor Technology | AMKR.O | Randy Abrams | 13,114 | 80 | 53 | Buy | 73 | 8 | 20.6 | 19.1 | 2.6 | 2.4 | 14 | 13 |
| JCET Group | 600584.SS | Jimmy Yu | 17,156 | 135 | 64 | Buy | 72 | 53 | 42.7 | 28.0 | 3.7 | 3.3 | 9 | 12 |
| Tianshui Huatian Technology | 002185.SZ | Jimmy Yu | 7,928 | 13 | 16 | Neutral | 33 | 27 | 57.0 | 44.8 | 2.8 | 2.7 | 5 | 6 |
| TongFu Microelectronics Co Ltd | 002156.SZ | N/A | 13,526 | N/A | 57 | N/A | 50 | 13 | 45.3 | 40.1 | 5.0 | 4.5 | 10 | 11 |
| Shanghai V-Test Semiconductor Tech Co Ltd | 688372.SS | N/A | 2,517 | N/A | 100 | N/A | 36 | 106 | 40.6 | 19.7 | 3.8 | 3.2 | 11 | 18 |
| Sector Average | 58 | 47 | 39.7 | 28.0 | 4.5 | 3.9 | 13 | 17 | ||||||
| Tester | ||||||||||||||
| Advantest | 6857.T | Atsuhiro Kinoshita | 191,547 | 43,600 | 41,850 | Buy | 80 | 96 | 38.8 | 53.1 | 16.8 | 31.8 | 70 | 58 |
| Teradyne Inc | TER.O | Timothy Arcuri | 67,666 | 500 | 430 | Buy | 134 | 51 | 45.7 | 30.8 | 16.7 | 12.8 | 43 | 47 |
| Sector Average | 107 | 74 | 42.2 | 42.0 | 16.7 | 22.3 | 57 | 52 | ||||||
| Prober/Prober solutions | ||||||||||||||
| Hermes Testing Solutions | 7856.TWO | Ryan Sun | 3,580 | 8,880 | 4,190 | Buy | 221 | 487 | 143.9 | 27.3 | 9.1 | 7.0 | 10 | 29 |
| Tokyo Electron | 8035.T | Atsuhiro Kinoshita | 184,031 | 18,720 | 12,805 | Buy | -16 | 71 | 29.7 | 37.1 | 6.5 | 12.8 | 36 | 44 |
| Sector Average | 102 | 279 | 86.8 | 32.2 | 7.8 | 9.9 | 23 | 36 | ||||||
| Handler | ||||||||||||||
| Hon.Precision, Inc. | 7769.TW | Sunny Lin | 33,404 | 10,000 | 5,905 | Buy | 90 | 86 | 45.2 | 24.4 | 14.5 | 10.6 | 36 | 50 |
| Chroma ATE | 2360.TW | Jerry Su | 31,434 | 2,960 | 2,350 | Buy | 64 | 38 | 51.8 | 37.7 | 28.6 | 20.8 | 58 | 64 |
| Cohu, Inc. | COHU.O | N/A | 3,460 | N/A | 73 | N/A | n.a. | 94 | 77.0 | 39.6 | - | - | 7 | 16 |
| JHT Design Co Ltd | 603061.SS | N/A | 4,045 | N/A | 312 | N/A | 155 | 47 | 54.8 | 37.3 | 13.0 | 9.9 | 22 | 25 |
| Hangzhou Changchuan Technology | 300604.SZ | Yongwei Lai | 22,690 | 310 | 240 | Buy | 60 | 53 | 76.1 | 49.8 | 23.4 | 16.5 | 36 | 39 |
| Sector Average | 92 | 63 | 61.0 | 37.8 | 19.9 | 14.4 | 32 | 39 | ||||||
| Test Socket | ||||||||||||||
| WinWay Technology | 6515.TW | Ryan Sun | 6,948 | 8,900 | 6,130 | Buy | 119 | 98 | 60.2 | 30.4 | 22.0 | 14.6 | 44 | 34 |
| Leeno Industrial Inc | 058470.KQ | N/A | 4,936 | N/A | 86,900 | N/A | 33 | 17 | 35.4 | 30.3 | 8.0 | 6.8 | 24 | 24 |
| ISC Co Ltd | 095340.KQ | N/A | 3,247 | N/A | 205,500 | N/A | 70 | 41 | 47.0 | 33.2 | 7.0 | 5.9 | 16 | 19 |
| Yokowo Co Ltd | 6800.T | N/A | 744 | N/A | 4,925 | N/A | 28 | 93 | 38.3 | 19.8 | - | 1.8 | - | - |
| Sector Average | 62 | 62 | 45.2 | 28.4 | 12.3 | 7.3 | 28 | 26 | ||||||
| Load Board | ||||||||||||||
| Chunghwa Precision Test Tech | 6510.TWO | Ryan Sun | 3,149 | 5,000 | 3,055 | Buy | 112 | 99 | 47.5 | 23.8 | 9.2 | 7.3 | 21 | 34 |
| Probe Card | ||||||||||||||
| Technoprobe SpA | TPRO.MI | Harry Blaiklock, CFA | 27,100 | 41 | 37 | Buy | 259 | 18 | 66.9 | 56.5 | 14.6 | 11.6 | 25 | 23 |
| MPI Corp | 6223.TWO | N/A | 17,518 | N/A | 5,670 | N/A | 97 | 110 | 87.2 | 41.5 | 30.3 | 19.1 | 38 | 54 |
| FormFactor Inc | FORM.O | N/A | 11,038 | N/A | 141 | N/A | 159 | 24 | 46.2 | 37.1 | 9.3 | 8.9 | 19 | 23 |
| MICRONICS JAPAN CO.,LTD. | 6871.T | N/A | 3,906 | N/A | 15,410 | N/A | 155 | 28 | 24.8 | 19.4 | 7.1 | 5.6 | 32 | 36 |
| Japan Electronic Materials Corp | 6855.T | N/A | 804 | N/A | 8,650 | N/A | 46 | 43 | 24.9 | 17.4 | - | - | - | - |
| Sector Average | 138 | 54 | 49.6 | 32.6 | 14.1 | 10.5 | 27 | 34 |
Source: LSEG, UBS estimates. Priced as of October 6 HKT).
What´s Priced In?
WHAT´S PRICED IN?
Source: LSEG, UBS
Despite a 264% YTD share-price increase, HTSI still trades at just 15x 2028E P/E. We believe market expectations for 2027E CPO testing equipment shipments remain conservative, particularly for insertion 2 equipment. Based on our industry analysis, we estimate HTSI will deliver 40 insertion 2 and 70 insertion 3 systems in 2027E, this should be higher than the market's expectation of no insertion 2 and limited insertion 3 shipment due to engineering bottleneck. We also see further upside in 2028E as CPO adoption expands. Our reverse DCF analysis indicates that the current market price implies only a 17% long-term sales CAGR vs our estimate of 27% and long-term GM level of 33% vs our estimate of 61%. We see scope for re-rating.
We believe the market is not fully reflecting three key growth drivers:
1) Shift-left testing is still underappreciated.
As advanced packaging costs rise and AI accelerators become increasingly complex, more thorough testing is done at the wafer-level. This should drive sustained demand for HTSI's thermal control modules, probe card consumables, and other wafer-level testing solutions.
2) CPO revenue potential re ains underesti ated.
Investor expectations for 2027 CPO equipment shipments, particularly insertion 2 testing systems, remain conservative. Based on our industry studies, we forecast HTSI will deliver 40 insertion 2 and 70 insertion 3 systems in 2027E, with further potential upside in 2028E as CPO adoption broadens.
3) New products provide additional optionality.
Beyond its core businesses, HTSI is expanding into higher-value solutions including massreflow tools, MEMS probe cards and laser cleaning systems, creating incremental growth opportunities that we believe are largely absent from current expectations.
We value HTSI using 31x average 2028E PE, underpinned by a 32% 2027-31E earnings CAGR. We use 2028E PE as our view is that 2028 is the year for thermal control modules and CPO adoption grow from the initial ramping up stage to mass adoption stage. We believe using handlers as a peer group is justifiable for a unique company like HTSI, with thermal control modules for chip probing sharing similar characteristics as active thermal control used for final test, in addition to Hon Precision and Chroma having exposure to CPO test equipment. For equipment vendors, the peer group's average NTM PE post 2022 is around 35x, and the group is currently trading at around 41x NTM PE see What's Priced In chart).
HTSI is trading at NT$4,190 as of 6 Oct 2026
Upside/Downside Spectrum
Upside/Downside Spectrum
Source: UBS estimates
Risk to the current share price is heavily skewed (2.2:1) to the upside.
UPSIDE (NT$10,000): Our upside scenario reflects stronger than expected thermal module and CPO equipment shipment in 2027-28E, with additional upside from better traction of probe cards and mass reflow tools, forming 157%/91% YoY sales growth in 2027/28E and even higher operating leverage with OPM of 46.3%/50.0% in 2027/28E. This scenario implies a 34x 2028E PE, a upside driving by more equipment demand stemming for robust shift-left test induced equipment bottleneck, alongside CPO proliferation with scale-up CPO equipment pull-in in 2028E.
BASE (NT$8,880): Our price target of NT$8,880 is based on 31x 2028E PE. We expect an earnings CAGR of 32% in 2027-31E. With shift-left trend for more thermal module requirement during testing, alongside 40/70 CPO insertion 2/3 shipment. We see these growth drivers driving YoY sales growth from a high base of 127% in 2026E to 152%/78% YoY in 2027/2028E, with OPM of 44.3%/47.0% in 2027/28E.
DOWNSIDE (NT$1,500): Our downside scenario reflects lower shipment of thermal control modules due to less advanced prober demand with less insertion 2 and 3 equipment shipment due to bottlenecks with CPO production, alongside limited additional growth drivers to be picked up in 2028 such as MEMS probe card and mass reflow tools. This leads to weaker YoY sales growth of 67%/50% in 2027/28E and operating margin of 29.3%/32.0% in 2027/28E as equipment shipment fails to scale. This scenario implies a 14x 2028E PE, as valuation de-rate with dimmed outlook without CPO and limited upside from thermal control module shipments.
HTSI is trading at NT $4,190 as of 6 Oct 2026
Company Description
Company Description
Hermes Testing Solutions HTSI) was founded in 2004 in Hsinchu, Taiwan. It focuses on providing semiconductor testing and inspecting solutions, equipment installation, technical support, and maintenance services. Its main business segments are customized semiconductor equipment, engineering services, and probe cards and other materials.
Industry Outlook
New iterations of semiconductors, especially for AI / HPC applications, are set to increase in both front-end wafer fabrication advancements and back-end packaging complexities with each iterations. With the industry now moves to utilize "shift left", chip probing and its relevant supply chain will be key beneficiaries of this trend which we believe will unlock multiyear, secular growth trends.
HTSI sales and GM trend
Source: Company data, UBS estimates
HTSI H126 sales ix breakdown
Source: Company data, UBS
Her es Testing Solutions (7856.TWO)
| Inco e State ent (NT$ ) | 12/24 | 12/25 | 12/26E | %ch | 12/27E | %ch | 12/28E | 12/29E | 12/30E |
|---|---|---|---|---|---|---|---|---|---|
| Revenues | 1,598 | 2,425 | 5,505 | 127.0 | 13,879 | 152.1 | 24,713 | 29,218 | 32,810 |
| Gross profit | 579 | 1,021 | 3,054 | 199.2 | 8,097 | 165.1 | 14,817 | 17,801 | 20,107 |
| EBITDA (UBS) | 280 | 556 | 1,329 | 139.0 | 6,512 | 389.8 | 12,138 | 15,053 | 17,182 |
| Depreciation & amortisation | 226) | 260) | 254) | 2.3 | 358) | -41.0 | 534) | 759) | 1,012) |
| EBIT (UBS) | 54 | 297 | 1,076 | 262.7 | 6,154 | NM | 11,604 | 14,294 | 16,170 |
| Associates & investment income | 0 | 0 | 0 | - | 0 | - | 0 | 0 | 0 |
| Other non-operating income | 13 | 35 | 1 | -96.8 | 0 | - | 0 | 0 | 0 |
| Net interest | 10) | 9) | 8 | 169 | NM | 214 | 286 | 364 | |
| Exceptionals incl goodwill) | 0 | 0 | 0 | - - | 0 | - | 0 | 0 | 0 |
| Pre-tax profit | 57 | 322 | 1,085 | 236.7 | 6,323 | NM | 11,818 | 14,580 | 16,534 |
| Tax | 0 | 54) | 223) | -314.2 | 1,265) | NM | 2,364) | 2,916) | 3,307) |
| Profit after tax | 57 | 268 | 862 | 221.2 | 5,059 | NM | 9,454 | 11,664 | 13,227 |
| Preference dividends | 0 | 0 | 0 | - | 0 | - | 0 | 0 | 0 |
| Minorities | 0 | 0 | 0 | -83.3 | 0 | - | 0 | 0 | 0 |
| Extraordinary items | 0 | 0 | 0 | - | 0 | - | 0 | 0 | 0 |
| Net earnings (local GAAP) | 57 | 268 | 862 | 221.1 | 5,059 | NM | 9,454 | 11,664 | 13,227 |
| Net earnings (UBS) | 57 | 268 | 862 | 221.1 | 5,059 | NM | 9,454 | 11,664 | 13,227 |
| Tax rate %) | 0.0 | 16.7 | 20.6 | 23.0 | 20.0 | -2.7 | 20.0 | 20.0 | 20.0 |
| Per Share (NT$) | 12/24 | 12/25 | 12/26E | %ch | 12/27E | %ch | 12/28E | 12/29E | 12/30E |
| EPS UBS, diluted) | 2.71 | 10.65 | 29.11 | 173.4 | 153.28 | NM | 286.48 | 353.44 | 400.81 |
| EPS local GAAP, diluted) | 2.71 | 10.65 | 29.11 | 173.4 | 153.28 | NM | 286.48 | 353.44 | 400.81 |
| EPS UBS, basic) | 2.84 | 10.83 | 29.11 | 168.8 | 153.29 | NM | 286.49 | 353.45 | 400.82 |
| DPS net) NT$) | 0.00 | 1.10 | 11.64 | NM | 61.32 | NM | 114.60 | 141.38 | 160.33 |
| Cash EPS UBS, diluted) 1 | 13.49 | 20.94 | 37.67 | 79.9 | 164.12 | 335.6 | 302.66 | 376.44 | 431.48 |
| Book value per share | 12.85 | 46.45 | 459.82 | NM | 602.66 | 31.1 | 827.84 | 1,066.69 | 1,326.13 |
| Average shares diluted) | 21 | 25 | 30 | 17.5 | 33 | 11.5 | 33 | 33 | 33 |
| Balance Sheet (NT$ ) | 12/24 | 12/25 | 12/26E | %ch | 12/27E | %ch | 12/28E | 12/29E | 12/30E |
| Cash and equivalents | 182 | 709 | 14,360 | NM | 17,474 | 21.7 | 22,786 | 29,613 | 36,992 |
| Other current assets | 589 | 806 | 1,732 | 114.7 | 3,913 | 125.9 | 6,302 | 6,856 | 7,786 |
| Total current assets | 771 | 1,515 | 16,092 | NM | 21,386 | 32.9 | 29,088 | 36,469 | 44,777 |
| Net tangible fixed assets | 509 | 441 | 429 | -2.7 | 765 | 78.5 | 1,467 | 2,169 | 2,797 |
| Net intangible fixed assets Investments / other assets | 0 | 0 | 0 | - | 0 | - | 0 | 0 | 0 |
| 122 1,402 | 111 | 224 | 101.6 | 224 | 0.0 33.6 | 224 30,780 | 224 38,863 | 224 47,799 | |
| Total assets | 2,067 | 16,745 | NM | 22,376 | |||||
| Trade payables & other ST liabilities Short term debt | 384 | 694 | 1,485 | 113.8 | 2,401 | 61.8 | 3,374 | 3,575 | 3,950 |
| Total current liabilities | 525 909 | 0 694 | 0 1,485 | - 113.8 | 0 2,401 | - 61.8 | 0 3,374 | 0 3,575 | 0 3,950 |
| Long term debt | 125 | 90 | 0 | - | 0 | - | 0 | 0 | 0 |
| Other long term liabilities | 28 | 19 | 86 | 349.5 | 86 | 0.0 | 86 | 86 | 86 |
| Preferred shares | 0 | 0 | - | 0 | - | 0 | 0 | 0 | |
| Total liabilities (incl pref shares) | 1,062 | 804 | 0 1,571 | 95.4 | 2,488 | 58.4 | 3,461 | 3,662 | 4,037 |
| Co on s/h equity | 339 | 1,263 | 15,174 | NM | 19,888 | 31.1 | 27,319 | 35,201 | 43,762 |
| Minority interests | 0 | 0 | 0 | -1.1 | 0 | 0.0 | 0 | 0 | 0 |
| Total liabilities & equity | 1,402 | 2,067 | 16,745 | NM | 22,376 | 33.6 | 30,780 | 38,863 | 47,799 |
| Cash Flow (NT$ ) | 12/24 | 12/25 | 12/26E | %ch | 12/27E | %ch | 12/28E | 12/29E | 12/30E |
| Net income before pref divs) | 57 | 268 | 862 | 221.1 | 5,059 | NM | 9,454 | 11,664 | 13,227 |
| Depreciation & amortisation | 226 | 260 | 254 | -2.3 | 358 | 41.0 | 534 | 759 | 1,012 |
| Net change in working capital | 254) | 65) | 374) | NM | 1,264) | -238.1 - | 1,416) | 354) | 554) |
| Other operating | 88 | 139 | 256 | 84.3 | 0 | 0 | 0 | 0 | |
| Operating cash flow | 117 | 602 | 998 | 65.9 | 4,152 | 316.1 | 8,572 | 12,069 | 13,685 |
| Tangible capital expenditure | 157) | 122) | 275) 0 | -126.4 | 694) | -152.1 | 1,236) | 1,461) | 1,641) |
| Intangible capital expenditure | 0 | 0 | - | 0 | - | 0 | 0 | 0 | |
| Net acquisitions) & disposals | 29) | 17 | 13 | -24.0 | 0 | - | 0 | 0 | 0 |
| Other investing | 19) | 20) | 2) | 89.5 | 0 | - | 0 | 0 | 0 |
| Investing cash flow | (206) | (125) | (265) | -111.9 | (694) | -162.2 | (1,236) | (1,461) | (1,641) |
| Equity dividends paid | 27) | - | 345) | NM | 2,023) 0 | 3,782) | 4,666) | ||
| Share issues / buybacks) | 0 23 | 0 626 | 13,102 | NM | 0 | - | 0 | 0 | |
| Other financing | 46) | 54) | 33) | 38.9 | 0 | - | 0 | 0 | 0 |
| Change in debt & pref shares | 141 | 525) | 125) | 76.2 | 0 | 0 | 0 | 0 | |
| Financing cash flow | 117 | 46 | 12,916 | NM | (345) | - - | (2,023) | (3,782) 6,827 | (4,666) 7,379 |
| Cash flow inc/(dec) in cash | 29 | 523 | 13,649 2 | NM -42.4 | 3,113 0 | -77.2 -100.0 | 5,313 0 | 0 | 0 |
| FX / non cash items Balance sheet inc/(dec) in | - | 4 527 | 13,652 | NM | 3,113 | 5,313 | 6,827 | ||
| cash | -77.2 | ||||||||
| - | 7,379 |
Source: Company accounts, UBS estimates. UBS) metrics use reported figures which have been adjusted by UBS analysts. 1 Cash EPS UBS, diluted) is calculated using UBS net income adding back depreciation and amortization.
Her es Testing Solutions (7856.TWO)
| Valuation (x) | 12/24 | 12/25 | 12/26E | 12/27E | 12/28E | 12/29E | 12/30E |
|---|---|---|---|---|---|---|---|
| P/E local GAAP, diluted) | - | 68.6 | NM | 27.3 | 14.6 | 11.9 | 10.5 |
| P/E UBS, diluted) | - | 68.6 | NM | 27.3 | 14.6 | 11.9 | 10.5 |
| P/CEPS | - | 34.3 | NM | 25.5 | 13.8 | 11.1 | 9.7 |
| Equity FCF UBS) yield % | - | 2.5 | 0.6 | 3.0 | 6.4 | 9.3 | 10.6 |
| Dividend yield net) % | - | 0.2 | 0.3 | 1.5 | 2.7 | 3.4 | 3.8 |
| P/BV | - | 15.7 | 9.1 | 7.0 | 5.1 | 3.9 | 3.2 |
| EV/revenues core) | - | 8.1 | NM | 7.1 | 3.8 | 3.0 | 2.5 |
| EV/EBITDA UBS core) | - | 35.1 | 80.1 | 15.1 | 7.7 | 5.8 | 4.7 |
| EV/EBIT core) | - | 65.8 | 99.0 | 15.9 | 8.1 | 6.1 | 5.0 |
| EV/OpFCF core) | - | 65.8 | 99.0 | 15.9 | 8.1 | 6.1 | 5.0 |
| EV/op. invested capital | - | 27.4 | >100 | 60.7 | 27.0 | 17.3 | 13.1 |
| Enterprise value (NT$ ) | 12/24 | 12/25 | 12/26E | 12/27E | 12/28E | 12/29E | 12/30E |
| Market cap. | - | 19,581 | 113,884 | 113,884 | 113,884 | 113,884 | 113,884 |
| Net debt cash) | - | 75) | 7,489) | 15,917) | 20,130) | 26,200) | 33,302) |
| Buy out of minorities | 28 | 19 | 86 | 86 | 86 | 86 | 86 |
| Pension provisions/other | 0 | 0 | 0 | 0 | 0 | 0 | 0 |
| Total enterprise value | - | 19,526 | 106,481 | 98,054 | 93,841 | 87,771 | 80,668 |
| Non core assets | 29) | 0 | 0 | 0 | 0 | 0 | 0 |
| Core enterprise value | - | 19,526 | 106,481 | 98,054 | 93,841 | 87,771 | 80,668 |
| Growth (%) | 12/24 | 12/25 | 12/26E | 12/27E | 12/28E | 12/29E | 12/30E |
| Revenue | - | 51.8 | 127.0 | 152.1 | 78.1 | 18.2 | 12.3 |
| EBITDA UBS) | - | 98.9 | 139.0 | NM | 86.4 | 24.0 | 14.1 |
| EBIT UBS) | - | NM | NM | NM | 88.6 | 23.2 | 13.1 |
| EPS UBS, diluted) | - | NM | 173.4 | NM | 86.9 | 23.4 | 13.4 |
| Net DPS | - | - | NM | NM | 86.9 | 23.4 | 13.4 |
| Margins & Profitability (%) | 12/24 | 12/25 | 12/26E | 12/27E | 12/28E | 12/29E | 12/30E |
| Gross profit margin | 36.2 | 42.1 | 55.5 | 58.3 | 60.0 | 60.9 | 61.3 |
| EBITDA margin | 17.5 | 22.9 | 24.1 | 46.9 | 49.1 | 51.5 | 52.4 |
| EBIT UBS) margin | 3.4 | 12.2 | 19.5 | 44.3 | 47.0 | 48.9 | 49.3 |
| Net earnings UBS) margin | 3.6 | 11.1 | 15.7 | 36.4 | 38.3 | 39.9 | 40.3 |
| ROIC EBIT) | - | 41.7 | NM | NM | NM | NM | NM |
| ROIC post tax | - | 34.7 | NM | NM | NM | NM | NM |
| ROE UBS) | - | 33.5 | 10.5 | 28.9 | 40.1 | 37.3 | 33.5 |
| Capital structure & Coverage (x) | 12/24 | 12/25 | 12/26E | 12/27E | 12/28E | 12/29E | 12/30E |
| Net debt / EBITDA | 1.7 | 1.1) | 10.8) | 2.7) | 1.9) | 2.0) | 2.2) |
| Net debt / total equity % | 138.1 | 49.0) | 94.6) | 87.9) | 83.4) | 84.1) | 84.5) |
| Net debt / net debt + total equity) % | 58.0 | 95.9) | NM | NM | NM | NM | NM |
| Net debt/EV % | - | 0.4) | 7.0) | 16.2) | 21.5) | 29.8) | 41.3) |
| Capex / depreciation % | 69.5 | 46.8 | 108.5 | 194.1 | NM | 192.5 | 162.1 |
| Capex / revenue % | 9.8 | 5.0 | 5.0 | 5.0 | 5.0 | 5.0 | 5.0 |
| EBIT / net interest | 5.3 | 31.3 | - | - | - | - | - |
| Dividend cover UBS) | - | 9.9 | 2.5 | 2.5 | 2.5 | 2.5 | 2.5 |
| Div. payout ratio UBS) % | - | 10.1 | 40.0 | 40.0 | 40.0 | 40.0 | 40.0 |
| Revenues by division (NT$ ) | 12/24 | 12/25 | 12/26E | 12/27E | 12/28E | 12/29E | 12/30E |
| Others | 1,598 | 2,425 | 5,505 | 13,879 | 24,713 | 29,218 | 32,810 |
| Total | 1,598 | 2,425 | 5,505 | 13,879 | 24,713 | 29,218 | 32,810 |
| EBIT (UBS) by division (NT$ ) | 12/25 | 12/26E | 12/27E | 12/28E | 12/29E | 12/30E | |
| 12/24 | 16,170 | ||||||
| Others Total | 54 54 | 297 297 | 1,076 1,076 | 6,154 6,154 | 11,604 11,604 | 14,294 14,294 | 16,170 |
Source: Company accounts, UBS estimates. UBS) metrics use reported figures which have been adjusted by UBS analysts.
Forecast returns
| Forecast price appreciation | 111. % |
|---|---|
| Forecast dividend yield | 0.3% |
| Forecast stock return | 112.2% |
| Market return assumption | 6.3% |
| Forecast excess return | 105. % |
Co pany Description
Hermes Testing Solutions HTSI) was founded in 2004 in Hsinchu, Taiwan. It focuses on providing semiconductor testing and inspecting solutions, equipment installation, technical support, and maintenance services. Its main business segments are customized semiconductor equipment, engineering services, and probe cards and other materials.
Valuation Method and Risk State ent
We value Hermes Testing based on PE methodology. Risks for the semis industry:
- Geopolitical uncertainties: Geopolitical uncertainties including tariffs and more export control could negatively impact semis cycle, and a downturn would lead to slower demand in the overall market and moderating capacity expansion.
- Meaningful deceleration of new technology development: Slower demand and less investment are expected If there is meaningful deceleration of new technology development such as Cloud AI, autonomous driving, etc.
- Rising utility cost: Larger-than-expected utility cost increases would further pressure profitability. Rising utility costs in Taiwan have negatively impacted margins for Taiwan tech companies.
Company risks:
- Faster- or slower-than-expected front-end/CoWoS capacity expansion: This could result in Hermes Testing gaining/losing equipment orders from major foundries and OSATs.
- Competitors achieving technological advancement: Potential risk of competition from either local or foreign companies) achieving technological advancements could result in Hermes Testing losing market share from major foundries and OSATs.
- Better- or worse-than-expected AI growth: Better- or worse-than-expected AI growth could lead to a ramp-up or a slowdown of equipment orders from major foundries and OSATs to Hermes Testing, affecting long-term revenue growth potential.
- Slowdown or delay of new technological advancement: A potential slowdown or delay of the rollout for technological advancements for technologies such as SoIC, CoPoS, and CPO, would limit future equipment orders.
- Increase of raw material costs: Rising raw material costs may directly impact Hermes Testing's margins for equipment shipments.
Quantitative Research Review
UBS Global Research publishes a quantitative assessment of its analysts' responses to certain questions about the likelihood of an occurrence of a number of short term factors in a product known as the 'Quantitative Research Review'. The views for this month can be found below. Views contained in this assessment on a particular stock reflect only the views on those short term factors which are a different timeframe to the 12-month timeframe reflected in any equity rating set out in this note. For previous responses please make reference to i) previous UBS Global Research reports; and ii) where no applicable research report was published that month, the Quantitative Research Review which can be found at https://neo.ubs.com/quantitative, or contact your UBS sales representative for access to the report or the Quantitative Research Team on ubs-quant-answers@ubs.com. A consolidated report which contains all responses is also available and again you should contact your UBS sales representative for details and pricing or the Quantitative Research Team on the email above.
Her es Testing Solutions
| Question | Response |
|---|---|
| 1. Is the industry structure facing the firm likely to improve or deteriorate over the next six months? Rate on a scale of 1-5 (1 = getting worse, 3 = no change, 5 = getting better, N/A = no view) | 4 |
| 2. Is the regulatory/government environment facing the firm likely to improve or deteriorate over the next six months? Rate on a scale of 1-5 (1 = getting tougher 3 = no change, 5 = getting better, N/A = no view) | 3 |
| 3. Over the last 3-6 months in broad terms have things been improving/no change/getting worse for this stock? Rate on a scale of 1-5 (1 = getting a lot worse, 3 = not much change, 5 = getting a lot better, N/A = no view) | 4 |
| 4. Relative to the current CONSENSUS EPS forecast, is the next company EPS update likely to lead to: (1 = negative surprise vs consensus, 3 = in-line with consensus, 5 = positive surprise vs consensus expectations, N/A = no view) | 3 |
| 5. What's driving the difference? | |
| 6. Relative to YOUR current earnings forecast, is there relatively greater risk at the next earnings result of:(1 = downside skew risk to earnings, 3 = equal upside or downside risk to earnings, 5 = upside skew risk to earnings, N/A = no view) | 3 |
| 7. What's driving the difference? | |
| 8. Is there an upcoming catalyst for the company over the next three months? | No Catalyst |
| . Is there an actual or approximate date for the catalyst? | |
| 10. Is the catalyst date an actual or approximate date? | |
| 11. What is the catalyst? |