PDF 原檔:報告_GS_ODM品牌廠_20260703_original.pdf
圖片清單(已驗證 2026-07-06)
ingest 時建立的「眼見為憑」圖片索引,是 lib/ 嵌圖的唯一真相來源。
| 檔名 | size | 分類 | 親眼所見內容 |
|---|---|---|---|
2026-07-03 260703_gs_ODM-brands_001.png |
12KB | 裝飾·logo·banner | <40KB,未讀 |
2026-07-03 260703_gs_ODM-brands_002.png |
12KB | 裝飾·logo·banner | <40KB,未讀 |
2026-07-03 260703_gs_ODM-brands_003.png |
77KB | 真資料圖 | Exhibit 6 鴻海月營收(NT$m),Jan-25–Aug-26E,含 YoY% 折線;2Q26E NT$2.35 兆、3Q26E NT$2.96 兆 |
2026-07-03 260703_gs_ODM-brands_004.png |
43KB | 真資料圖 | 廣達月營收(NT$m),Jan-25–Aug-26E,含 YoY% 折線;Jun-26E +98% YoY |
2026-07-03 260703_gs_ODM-brands_005.png |
39KB | 真資料圖 | 奇鋐(AVC)月營收(NT$m),Jan-25–Aug-26E,含 YoY% 折線;Jun-26E +75% YoY |
2026-07-03 260703_gs_ODM-brands_006.png |
46KB | 真資料圖 | 緯穎月營收(NT$m),Jan-25–Aug-26E,含 YoY% 折線;2Q26E NT$257,843m(+17% YoY)、3Q26E +23% QoQ |
2026-07-03 260703_gs_ODM-brands_007.png |
41KB | 真資料圖 | 華碩月營收(NT$m),Jan-25–Aug-26E,含 YoY% 折線;Jun-26E +24% YoY |
2026-07-03 260703_gs_ODM-brands_008.png |
52KB | 真資料圖 | 仁寶月營收(NT$m),Jan-25–Aug-26E,含 YoY% 折線;Jun-26E +23% YoY |
分類只有三類:
真資料圖/裝飾·logo·banner/文字卡。
原始內容
For the exclusive use of KEVINLU@LENOVO.COM
Taiwan ODM/Brands: 3-month preview: June revenue fl at MoM on avg but YoY remains strong; AI servers/smartphone new models key drivers
We preview 3-month revenues for the seven companies under our coverage in the AI server/PC supply chain and update our estimates for Quanta. Across the supply chain, we are positive on: (1) Apple's supply chain on the back of a ramp-up of new models with form factor changes (i.e., foldable phones in 2026, and the iPhone 20 in 2027) to support end demand; (2) AI server components riding on speci fi cation upgrades; and (3) ASIC AI servers' rising penetration rate.
Buy: Hon Hai, Wiwynn, AVC; Neutral: Quanta, Inventec, Compal, ASUS
On a MoM basis, we expect the average revenue growth of the seven companies to come in at +6%/-5%/+0% in Jun/Jul/Aug 2026 (Exhibit 1). We expect fl at MoM growth in coming months, re fl ecting AI server ODMs undergoing model transition and PC consumption pull-in in 1H26 under high memory costs, which would weigh on PC supply chain shipment growth.
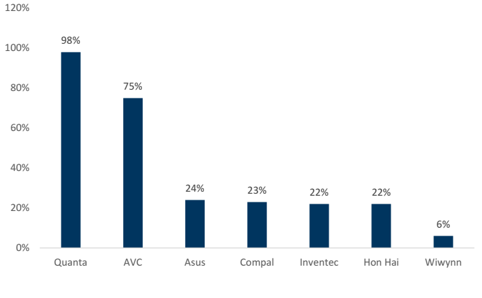
On a YoY basis, we expect the average revenue growth of the seven companies to come in at +39%/+37%/+29% in Jun/Jul/Aug 2026 (Exhibit 2), driven by the continuous ramp-up of AI servers, along with a PC product mix upgrade, new smartphone models, and high memory costs driving up the selling price.
Allen Chang
+852-2978-2930 | allen.k.chang@gs.com Goldman Sachs (Asia) L.L.C.
Verena Jeng
+852-2978-1681 | verena.jeng@gs.com Goldman Sachs (Asia) L.L.C.
Ting Song
+852-2978-6466 | ting.song@gs.com Goldman Sachs (Asia) L.L.C.
Yifan Hu +852-2978-0996 | yifan.hu@gs.com
Goldman Sachs (Asia) L.L.C.
e92c7a75ab8b4efbba794e6b187208c8
For the exclusive use of KEVINLU@LENOVO.COM
Exhibit 1: Jun 2026E revenue MoM
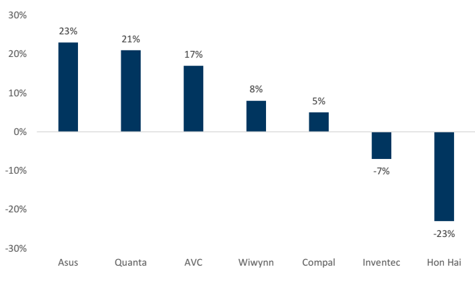
Exhibit 2: Jun 2026E revenue YoY
Source: Goldman Sachs Global Investment Research
Source: Goldman Sachs Global Investment Research
Mar to Aug 2026 revenue trends for Taiwan server / PC names
Exhibit 3: Taiwan PC/server names monthly revenue summary
| Rev YoY | Rev YoY | Rev YoY | Rev YoY | Rev YoY | Rev YoY | Rev MoM | Rev MoM | Rev MoM | Rev MoM | Rev MoM | Rev MoM | |
|---|---|---|---|---|---|---|---|---|---|---|---|---|
| Mar-26 | Apr-26 | May-26 | Jun-26(E) | Jul-26(E) | Aug-26(E) | Mar-26 | Apr-26 | May-26 | Jun-26(E) | Jul-26(E) | Aug-26(E) | |
| Wiwynn | 14% | 30% | 18% | 6% | 5% | 6% | 4% | -16% | 2% | 8% | -3% | 14% |
| Quanta | 88% | 121% | 94% | 98% | 90% | 68% | 68% | -6% | -8% | 21% | -20% | -15% |
| Inventec | 47% | 37% | 35% | 22% | 26% | 2% | 72% | -3% | -2% | -7% | -11% | -9% |
| Asus | 34% | 46% | 9% | 24% | 32% | 4% | 58% | -5% | -16% | 23% | -15% | -10% |
| Compal | 17% | 16% | 22% | 23% | 25% | 24% | 69% | -19% | -2% | 5% | -1% | -1% |
| Hon Hai | 46% | 30% | 40% | 22% | 21% | 38% | 35% | 4% | 3% | -23% | 13% | 12% |
| AVC | 112% | 72% | 61% | 75% | 60% | 59% | 29% | -13% | 2% | 17% | 2% | 6% |
Source: Company data, Goldman Sachs Global Investment Research
Exhibit 4: Taiwan ODM notebook monthly shipments
| May-25 | June-25 | July-25 | Aug-25 | Sep-25 | Oct-25 | Nov-25 | Dec-25 | Jan-26 | Feb-26 | Mar-26 | Apr-26 | May-26 | |
|---|---|---|---|---|---|---|---|---|---|---|---|---|---|
| Notebook shipments (m units) | 10.6 | 13.0 | 10.8 | 11.2 | 12.0 | 10.1 | 10.4 | 11.8 | 8.4 | 7.0 | 13.8 | 9.1 | 9.3 |
| Quanta | 3.8 | 5.0 | 4.0 | 4.1 | 4.6 | 3.5 | 3.5 | 3.9 | 2.7 | 2.0 | 5.3 | 3.5 | 3.5 |
| Compal | 2.4 | 2.5 | 2.3 | 2.3 | 2.5 | 2.1 | 2.3 | 2.4 | 1.6 | 1.5 | 2.8 | 1.8 | 2.0 |
| Inventec | 1.8 | 2.1 | 1.7 | 1.8 | 1.9 | 1.6 | 1.7 | 2.0 | 1.7 | 1.5 | 2.2 | 1.5 | 1.5 |
| Wistron | 1.8 | 2.4 | 2.0 | 2.2 | 2.2 | 2.1 | 2.2 | 2.6 | 1.7 | 1.6 | 2.8 | 1.8 | 1.7 |
| Pegatron | 0.8 | 1.0 | 0.8 | 0.8 | 0.8 | 0.8 | 0.7 | 0.9 | 0.7 | 0.4 | 0.7 | 0.5 | 0.6 |
| YoY | |||||||||||||
| Quanta | -5% | 11% | 18% | -5% | -6% | 9% | -3% | -9% | -4% | -35% | 8% | 6% | -8% |
| Compal | -17% | -17% | -8% | -21% | -14% | -25% | -15% | 4% | -30% | -29% | -3% | -18% | -17% |
| Inventec | 6% | 24% | 0% | 6% | 6% | -6% | 0% | 0% | 13% | -6% | 16% | -12% | -17% |
| Wistron | 6% | 33% | 25% | 29% | 16% | 17% | 29% | 44% | 13% | 7% | 47% | 6% | -6% |
| Pegatron | 6% | 28% | -3% | -6% | 0% | 41% | 12% | 23% | 15% | -26% | -4% | -14% | -26% |
| MoM / QoQ | |||||||||||||
| Quanta | 15% | 32% | -20% | 2% | 12% | -24% | 0% | 11% | -31% | -26% | 165% | -34% | 0% |
| Compal | 9% | 4% | -8% | 0% | 9% | -16% | 10% | 4% | -33% | -6% | 87% | -36% | 11% |
| Inventec | 6% | 17% | -19% | 6% | 6% | -16% | 6% | 18% | -15% | -12% | 47% | -32% | 0% |
| Wistron | 6% | 33% | -17% | 10% | 0% | -5% | 5% | 18% | -35% | -6% | 75% | -36% | -6% |
| Pegatron | 27% | 28% | -24% | 10% | 0% | -6% | -10% | 32% | -24% | -39% | 59% | -22% | 10% |
Source: Company data
e92c7a75ab8b4efbba794e6b187208c8
camont o. non narmonky revenues
NTSm
1,000,000
900,000
800,000
700,000
600,000
500,000
400,000
300,000
200,000
100,000
For the exclusive use of KEVINLU@LENOVO.COM
—YoY% (RHS)
60%
Hon Hai (2317.TW, Buy, on APAC CL): AI servers remain key growth driver
40%
30%
Hon Hai's May revenue was +40% YoY/+3% MoM to NT$859bn, or 5% higher than our previous estimates. We expect 2Q26E revenue to be +31% YoY/+11% QoQ to NT$2.4 trillion. May continued MoM growth (+3%) o ff Apr's high base, re fl ecting solid demand for AI server racks despite the typically slow seasonality of traditional electronics products in 2Q. We expect Jun revenue to grow 22% YoY (or -23% MoM) considering the high base, which is in line with historical seasonality. We expect continued shipment growth of AI server racks to support 2Q/3Q26E growth ahead.
Exhibit 5: We model Hon Hai's Jun 2026 revenue at +22% YoY or -23% MoM Hon Hai's monthly/annual revenue
| Apr 2026 | May 2026 | June 2026E | July 2026E | Aug 2026E | Sep 2026E | 2Q26E | 3Q26E | |
|---|---|---|---|---|---|---|---|---|
| Revenues (NT$m) | 832,098 | 859,409 | 659,861 | 745,642 | 835,120 | 1,377,695 | 2,351,368 | 2,958,457 |
| YoY | 30% | 40% | 22% | 21% | 38% | 65% | 31% | 44% |
| MoM/QoQ | 4% | 3% | -23% | 13% | 12% | 65% | 11% | 26% |
| GS estimates (NT$m) | 819,812 | 815,456 | ||||||
| Actual vs. GS | 1% | 5% |
Revenue lines are actual results reported by the company.
Source: Company data, Goldman Sachs Global Investment Research
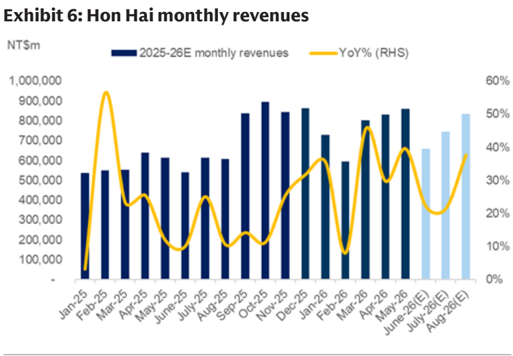
Source: Company data, Goldman Sachs Global Investment Research
Price Target Risks and Methodology - Hon Hai
Valuation methodology: We are Buy-rated on Hon Hai. Our 12-month target price of NT$400 is based on a 21.0x 2026E P/E multiple, which is set in line with peers' PEG&M ratio (i.e., P/E vs. forward-year earnings growth and OPM).
Key downside risks: (1) slower-than-expected ramp-up of the AI server business; (2) weaker-than-expected EV total solution performance across EV assembly, design, software, and semis; (3) slower-than-expected ramp-up of capacity globally; and (4) fi ercer-than-expected competition in the consumer electronics EMS business.
e92c7a75ab8b4efbba794e6b187208c8
Ludila monty/ quarterly revenue summary
Apr-26 May-26 Jun-26(E)
Rev (NTSm)
YoY
MoM/QoQ
GS (NT$m)
For the exclusive use of KEVINLU@LENOVO.COM
311,481
376,830
121%
94%
98%
Jul-26(E) Aug-26(E) Sep-26(E)
301,464
256,244
266,276
90%
68%
45%
20,26E
1,028,232
104%
30,26E
823,985
66%
Quanta (2382.TW, Neutral): AI server ramp-up while model transition and PC pull- in may weigh on 3Q26 32% -11%
Quanta's May revenue was down 8% MoM, or 11% below our estimate, re fl ecting the impact of the AI servers model transition and PC consumption pull-in under rising memory costs. The company's PC shipments in May declined 8% YoY, or were fl at MoM. We expect 21% MoM revenue growth for Jun, considering the low base in May and improved PC consumption by the quarter-end. However, we expect the growth momentum to slow in Jul-Aug, given the AI server rack model transition in 3Q26E and a slowdown of PC shipments as consumption was pulled in in 1H26.
Exhibit 7: We model Quanta's Jun 2026E revenue at +98% YoY, or +21% MoM Quanta monthly/quarterly revenue summary
Source: Company data, Goldman Sachs Global Investment Research
Exhibit 8: Quanta monthly revenues
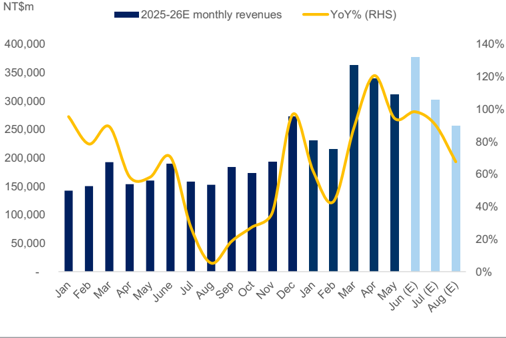
Source: Company data, Goldman Sachs Global Investment Research
Price Target Risks and Methodology - Quanta
We are Neutral-rated on Quanta. Our 12-month target price of NT$299 is based on an 11.4x 2027E P/E , which references PC/server peers' EPS growth vs. P/E multiple correlation. We see EPS growth as a major factor for the stock's performance.
Key upside/downside risks include: 1) stronger-/weaker-than-expected PC market recovery; 2) faster-/slower-than-expected AI server ramp-up; and 3) stronger-/weaker-than-expected demand for general servers.
e92c7a75ab8b4efbba794e6b187208c8
For the exclusive use of KEVINLU@LENOVO.COM
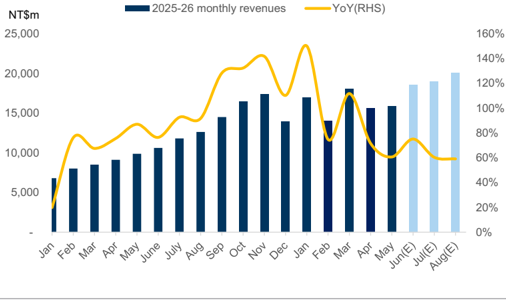
AVC (3017.TW, Buy): GPU and ASIC AI servers driving liquid cooling penetration rate
AVC's May revenue was fl at MoM, or in line with our estimate. We expect the growth momentum to recover in Jun, considering the lower base in May, followed by sequential revenue growth in Jun-Sep, driven by (1) the ramp-up of liquid cooling components for new AI server racks, (2) a growing liquid cooling penetration rate in ASIC AI servers, and (3) the ramp-up of AVC's liquid cooling components for new ASIC AI servers.
Exhibit 9: AVC monthly/quarterly revenue summary
| Apr-26 | May-26 | Jun-26E | Jul-26E | Aug-26E | Sep-26E | 2Q26E | 3Q26E | |
|---|---|---|---|---|---|---|---|---|
| Rev (NT$m) | 15,631 | 15,871 | 18,570 | 18,941 | 20,077 | 21,786 | 50,072 | 60,805 |
| Rev YoY | 72% | 61% | 75% | 60% | 59% | 50% | 69% | 56% |
| Rev MoM / QoQ | -13% | 2% | 17% | 2% | 6% | 9% | 2% | 21% |
| GS estimates (NT$m) | 18,197 | 15,788 | ||||||
| Act vs. GS | -14% | 1% |
Source: Company data, Goldman Sachs Global Investment Research
Exhibit 10: AVC monthly revenues
Source: Company data, Goldman Sachs Global Investment Research
Price Target Risks and Methodology - AVC
We are Buy-rated on AVC. Our 12-month target price for AVC is based on a near-term P/E, consistent with our Taiwan Technology coverage. We base our target price of NT$3,536 on a target P/E multiple of 26.7x on our forward-year EPS (2027E). Our target P/E is derived from the correlation between P/E and EPS growth of its peers in technology hardware.
Key downside risks: (1) slower-than-expected adoption of liquid cooling; (2) lower-than-expected demand for AI servers; (3) fi ercer-than-expected competition; and (4) slower-than-expected recovery of general servers.
e92c7a75ab8b4efbba794e6b187208c8
camble 11 we expect wiwyll soutrevenue growul to be to turf tormom
Exmole 14. wiwynn montmy revenues
NTSm
120,000
YoY
MoW QoQ
100,000
Act vs. GS
80,000
60,000
40,000
20,000
For the exclusive use of KEVINLU@LENOVO.COM
Apr-26
30%
May-26 June-26(E) July-26(E)
84,050
-YoY (RHS)|
18%
6%
5%
91,062
88,782
Aug-26 (E) Sep-26(E)
101,465
250%
126,831
6%
47%
2026E
257,843
17%
-7%
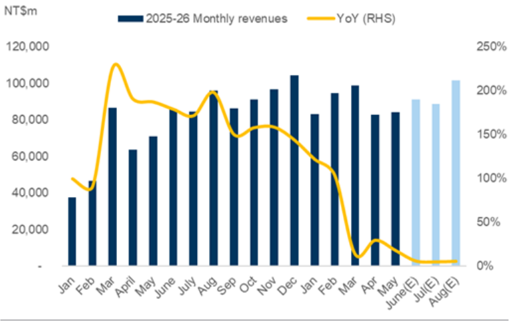
Wiwynn (6669.TW, Buy): ASIC AI servers support growth ahead
150%
Wiwynn's May revenue was fl at MoM, or 12% below our estimate, due to the switch to a consignment business model for some server projects starting from Apr (read more). Despite the business model transition being set to result in lower revenues, GM is expected to improve, which would also ease the working capital burden in the long term. For the coming June revenue, we expect a sequential increase on strong general server demand from leading US CSPs, followed by 23% QoQ growth in 3Q26 driven by an ASIC AI server ramp-up. We are positive on Wiwynn's leading market position in ASIC AI servers, diversifying into GPU AI server racks and riding on leading US CSPs' strong demand across general servers and AI servers.
Exhibit 11: We expect Wiwynn's Jun revenue growth to be +6% YoY/ +8% MoM
Source: Company data, Goldman Sachs Global Investment Research
Exhibit 12: Wiwynn monthly revenues
Source: Company data, Goldman Sachs Global Investment Research
Price Target Risks and Methodology - Wiwynn
We are Buy-rated on Wiwynn with a 12-month TP of NT$7,147 . Our target price is based on 15.8x 2027E P/E , which is derived from PC/server peers' EPS growth vs. P/E multiple correlation. We see EPS growth as a major factor for the stock's performance.
Key downside risks: 1) weaker-than-expected AI server demand growth; 2) slower-than-expected recovery in general server demand; and 3) more severe competition in the server ODM market.
3026E
317,077
19%
23%
e92c7a75ab8b4efbba794e6b187208c8
For the exclusive use of KEVINLU@LENOVO.COM
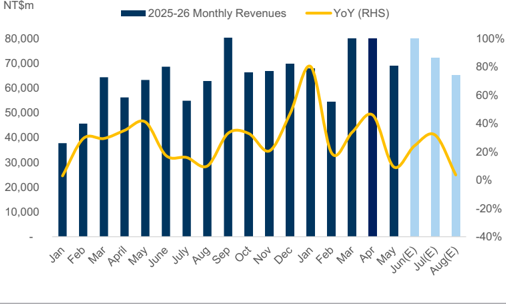
ASUS (2357.TW, Neutral): PC product mix upgrade and rack-level AI servers supporting 2H26 growth
ASUS's May revenue was down 16% MoM, or 13% below our estimate, which we attribute to the high base in Mar-Apr (monthly revenue +58% / -5% MoM). We expect Jun revenue to grow at +23% YoY, considering customer pull-in at quarter-end. Despite ongoing memory cost pressures, we expect the mix upgrade towards AI PCs and a rack-level AI server ramp-up to support 2Q/3Q26E growth at 26%/12% YoY. We model Jul/ Aug revenues to grow 32%/4% YoY to NT$72bn/ NT$65bn, with a MoM decline on the high base.
Exhibit 13: We expect ASUS Jun revenue to grow +24% YoY/+23% MoM to NT$85bn ASUS monthly/quarterly revenues
| Apr-26 | May-26 | Jun-26E | Jul-26E | Aug-26E | Sep-26E | 2Q26E | 3Q26E | |
|---|---|---|---|---|---|---|---|---|
| Rev (NT$m) | 81,915 | 69,094 | 85,089 | 72,325 | 65,093 | 86,226 | 236,098 | 223,645 |
| Rev YoY | 46% | 9% | 24% | 32% | 4% | 4% | 26% | 12% |
| RevMoM/QoQ | -5% | -16% | 23% | -15% | -10% | 32% | 22% | -5% |
| GS estimates (NT$m) | 60,259 | 79,458 | ||||||
| Act vs. GS | 36% | -13% |
Source: Company data, Goldman Sachs Global Investment Research
Exhibit 14: ASUS monthly revenue trend
Source: Company data, Goldman Sachs Global Investment Research
Price Target Risks and Methodology - Asus
We are Neutral-rated on ASUS with a 12-month target price of NT$1,082 . Our target price is based on 15.8x 2027E P/E , which is derived from brand makers' average ratio of 2027E P/E to 2028E NI YoY and OPM. We see EPS growth and OPM as major factors for the stock's share performance.
Key upside/downside risks include: 1) stronger / weaker-than-expected PC market growth; 2) faster / slower-than-expected AI and gaming PC growth; and 3) faster / slower-than-expected AI server ramp-up.
e92c7a75ab8b4efbba794e6b187208c8
calivi lo collival moncily Icyclucs allu 10.
cambre 19. compare month revenue preview
NTSm
100,000
90,000
Rev YoY
80,000
70,000
Act vs. GS
60,000
50,000
40,000
30,000
20,000
10,000
For the exclusive use of KEVINLU@LENOVO.COM
Apr-26
16%
22%
24%
chu intor
May-26 Jun-26(E) Jul-26(E) Aug-26(E) Sep-26(E)
70,462
74,209
73,467
72,732
30%
25%
-YoY (RHS)
23%
44%
2Q26E
216,650
20%
3Q26E
246,733
32%
20%
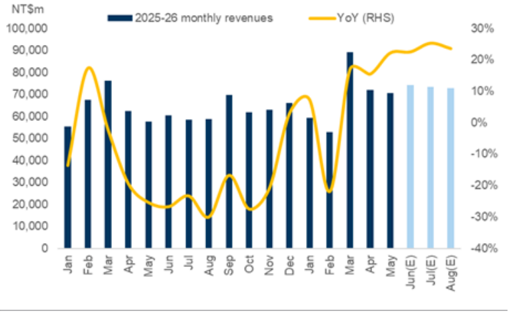
Compal (2324.TW, Neutral): Global capacity ramping up to support AI servers
9%
MIAV
0%
Compal's May revenue was fl at MoM, or 9% higher than our estimate. Compal's PC shipments in May increased 11% MoM to 2mn units, and management expects QoQ growth in 2Q-3Q26. We expect MoM revenue growth in Jun, driven by customers' pull-in by quarter-end, followed by slight MoM declines in Jul-Aug, considering the high base in Jun. Overall, we expect 2Q / 3Q26E revenues to grow at 20%/32% YoY, supported by Compal's ongoing revenue mix diversi fi cation, and its new US plant, expected to start production by the end of 2Q26 (link).
Exhibit 15: Compal 3-month revenue preview
Source: Company data, Goldman Sachs Global Investment Research
Exhibit 16: Compal monthly revenues and YoY trend (RHS)
Source: Company data, Goldman Sachs Global Investment Research
Price Target Risks and Methodology - Compal
We are Neutral-rated on Compal with a 12-month target price of NT$39.5 . Our target price is based on 13.6x 2027E P/E , which is derived from PC/server peers' EPS growth vs. P/E multiple correlation. We see EPS growth and market re-rating for ODM companies as major factors for the stock's performance.
Key upside/downside risks : 1) stronger-/weaker-than-expected PC market recovery; 2) faster-/slower-than-expected AI server ramp-up; and 3) stronger/weaker-than-expected demand for tablets.
100,533
e92c7a75ab8b4efbba794e6b187208c8
camore 1re mventee monty revenue preview
Exmore 10. mventec May revenue up so 70 ToT
Apr-26
Apr-26
May -26 Jun-26 (E)
May -26 Jun-26 (E)
82,808
77,003
35%
YoY
82,808
37%
35%
22%
Jul-26 (E)
Jul-26 (E)
68,533
26%
Aug-26 (E)
Sep-26 (E)
Aug-26 (E)
Sep-26 (E)
62,365
2%
2%
YoY
77,003
37%
22%
68,533
26%
62,365
Inventec (2356.TW, Neutral): Server business in expansion
Actual vs. GS
Actual vs. GS
34%
34%
30%
30%
Inventec's May revenue was up 35% YoY, or 30% above our estimate, which management attributes to the strong end demand for both AI and general servers on the global AI trend. We model sequential revenue declines for Jun-Aug, considering the PC consumption pull-in in 1H26 and rack-level AI servers entering model transition. Nevertheless, our estimate still show YoY growth for Inventec's Jun-Aug revenues, supported by its AI server capacity ramp up in the US (e.g., L10 / L11 assembly). Overall, we expect 2Q/3Q26E revenues to grow at 31%/10% YoY.
Exhibit 17: Inventec monthly revenue preview
Source: Company data, Goldman Sachs Global Investment Research
Exhibit 18: Inventec May revenue up 35% YoY
Source: Company data, Goldman Sachs Global Investment Research
Price Target Risks and Methodology - Inventec
We are Neutral-rated on Inventec with a 12-month target price of NT$56.0 . Our target price is based on 13.6x 2027E P/E , which is derived from PC/server peers' EPS growth vs. P/E multiple correlation. We see EPS growth as a major factor for the stock's performance.
Key upside/downside risks : 1) stronger-/weaker-than-expected PC market recovery; 2) faster-/slower-than-expected AI server ramp-up; and 3) stronger-/weaker-than-expected demand for general servers.
63,552
63,552
5%
5%
2%
2%
For the exclusive use of KEVINLU@LENOVO.COM
2Q26E
2Q26E
244,598
31%
244,598
31%
22%
22%
3Q26E
3Q26E
10%
10%
-21%
-21%
e92c7a75ab8b4efbba794e6b187208c8
For the exclusive use of KEVINLU@LENOVO.COM