PDF 原檔:報告_GS_ABF載板_20260712_original.pdf
圖片清單(已驗證 2026-07-13)
公司代號對照:NYPCB=8046_南電(市)、Unimicron=3037_欣興(市)、Kinsus=3189_景碩(市)、ZDT(Zhen Ding)=4958_臻鼎科技(市)(本次 ingest 範圍外,僅供對照)。
| 檔名 | size | 分類 | 親眼所見內容 |
|---|---|---|---|
報告_GS_ABF載板_20260712_001.png |
18.9KB | 真資料圖 | ABF 供需缺口率長條圖 2018-2028E(紅=供過於求、藍=供不應求;2028E 缺口 51%) |
報告_GS_ABF載板_20260712_002.png |
50.6KB | 真資料圖 | Unimicron/Kinsus/Nanya PCB/Ibiden 稼動率(UTR)趨勢線圖 1Q22-4Q28 |
報告_GS_ABF載板_20260712_003.png |
199.7KB | 真資料圖 | Exhibit 3:ABF TAM 歷年+預估長條圖疊 ROE 散點圖 2004-2028E,標示各週期 CAGR 與驅動因素 |
報告_GS_ABF載板_20260712_004.png |
51.7KB | 真資料圖 | ABF 需求依應用別堆疊長條圖 2017-2028E(PC/一般伺服器/AI 伺服器/交換器/路由器/消費性) |
報告_GS_ABF載板_20260712_005.png |
17.7KB | 真資料圖 | AI 伺服器/一般伺服器/交換器/PC 別 2025-28E CAGR 長條圖 |
報告_GS_ABF載板_20260712_006.png |
50.9KB | 真資料圖 | 與 002 相同之 UTR 趨勢線圖(Exhibit 6 重複引用) |
報告_GS_ABF載板_20260712_007.png |
10.6KB | 真資料圖 | ABF 交期長條圖:上輪週期 2020-22(18 個月)/2026 年初(3 個月)/現在(12 個月) |
報告_GS_ABF載板_20260712_008.png |
27.8KB | 真資料圖 | AI 晶片出貨量依類型堆疊長條圖 2024-2028E(Nvidia GPU/其他 GPU-ASIC/AI CPU/AI 交換器) |
報告_GS_ABF載板_20260712_009.png |
47.7KB | 真資料圖 | Exhibit 10:AI 晶片出貨 YoY vs AI ABF 需求 YoY 對比長條圖 2025-2028E |
報告_GS_ABF載板_20260712_010.png |
39.5KB | 真資料圖 | 一般伺服器 CPU 出貨依廠商堆疊長條圖 2020-2028E(Intel/AMD/ARM) |
報告_GS_ABF載板_20260712_011.png |
30.5KB | 真資料圖 | CPU 出貨 YoY vs 一般伺服器 ABF 需求 YoY 對比長條圖 |
報告_GS_ABF載板_20260712_012.png |
34.4KB | 真資料圖 | 全球 ABF 供應商市占率堆疊長條圖 2020-2028E(Unimicron/Kinsus/Nanya PCB/Zhen Ding/Ibiden/SEMCO/Others) |
報告_GS_ABF載板_20260712_013.png |
73.0KB | 真資料圖 | ABF 供應商合計資本支出堆疊長條圖+YoY 折線 2020-2028E |
報告_GS_ABF載板_20260712_014.png |
28.7KB | 真資料圖 | Exhibit 16:AI IC substrate TAM 成長長條圖 2023-2028E |
報告_GS_ABF載板_20260712_015.png |
35.5KB | 真資料圖 | AI 伺服器 ABF TAM 長條圖疊 ASIC 占比標記 2023-2028E |
報告_GS_ABF載板_20260712_016.png |
27.4KB | 真資料圖 | Exhibit 18:Kinsus AI ABF 營收占比長條圖(Unimicron/NYPCB/Kinsus AI 營收占比走勢) |
報告_GS_ABF載板_20260712_017.png |
38.5KB | 真資料圖 | Exhibit 19:AI ABF substrate 市占率堆疊長條圖 2024-2028E(Unimicron/NYPCB/Kinsus/Others) |
報告_GS_ABF載板_20260712_018.png |
296.4KB | 真資料圖 | Exhibit 20:各公司 OPM 歷史趨勢線圖 2004-2029E(NYPCB/Kinsus/Unimicron/Zhen Ding/Ibiden/SEMCO),標註各景氣週期驅動因素 |
報告_GS_ABF載板_20260712_019.png |
56.0KB | 真資料圖 | 2028 AI ABF TAM 瀑布圖(舊估→NVIDIA AI GPU 出貨增量→AI ASIC substrate 出貨→組合變化→新估 10,754) |
報告_GS_ABF載板_20260712_020.png |
110.6KB | 真資料圖 | Exhibit 22:台灣四大 ABF 廠季度毛利率趨勢線圖 1Q20-3Q28E(NYPCB/Kinsus/Unimicron/Zhen Ding) |
報告_GS_ABF載板_20260712_021.png |
76.7KB | 真資料圖 | Zhen Ding(4958.TW)GS 評等與目標價沿革圖(股價/指數雙軸,2023-2026) |
報告_GS_ABF載板_20260712_022.png |
78.6KB | 真資料圖 | NYPCB(8046.TW)GS 評等與目標價沿革圖(股價/指數雙軸,2023-2026),最新目標價 1,115 |
報告_GS_ABF載板_20260712_023.png |
81.5KB | 真資料圖 | Unimicron Technology(3037.TW)GS 評等與目標價沿革圖(股價/指數雙軸,2023-2026),最新目標價 630 |
報告_GS_ABF載板_20260712_024.png |
87.2KB | 真資料圖 | Kinsus(3189.TW)GS 評等與目標價沿革圖(股價/指數雙軸,2023-2026),最新目標價 555 |
全數 24 張皆為報告內產業/公司數據圖表,無 logo/封面/文字卡。
原始內容
ASIA TECHNOLOGY
ABF price hikes to outpace our estimates, with solid GM expansion from 2Q26; revise up TPs for all our TW ABF substrate players by 81% to 112%
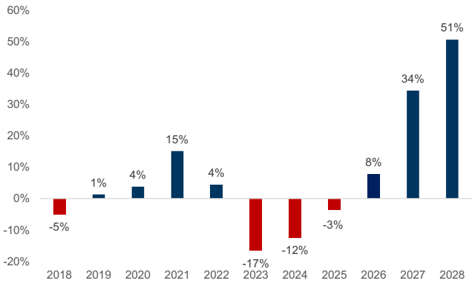
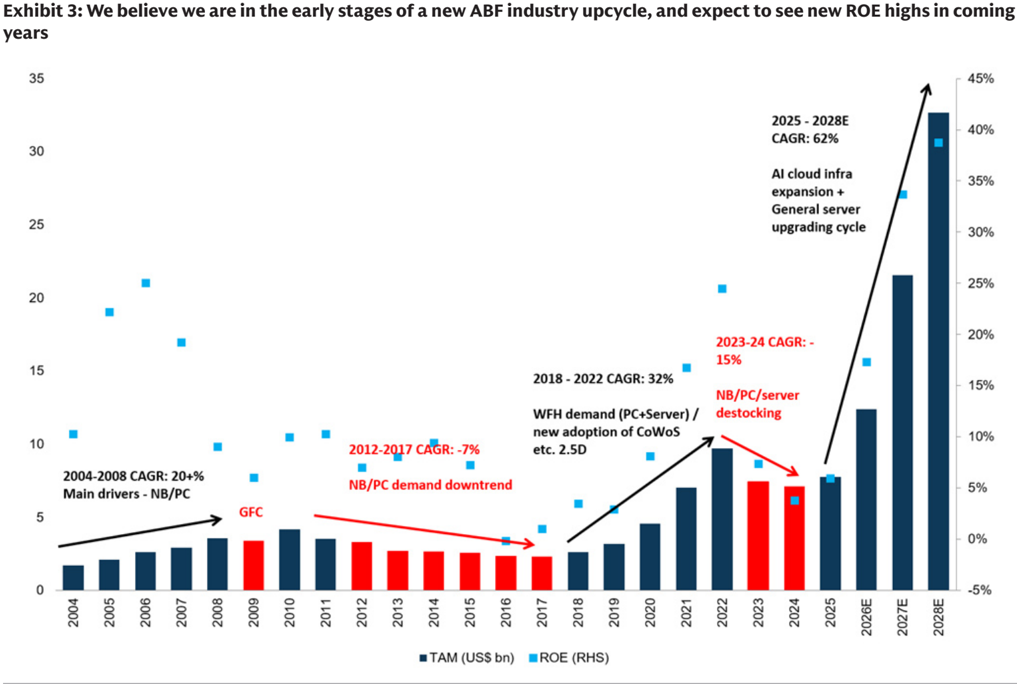
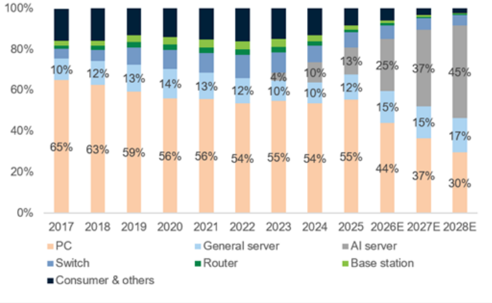
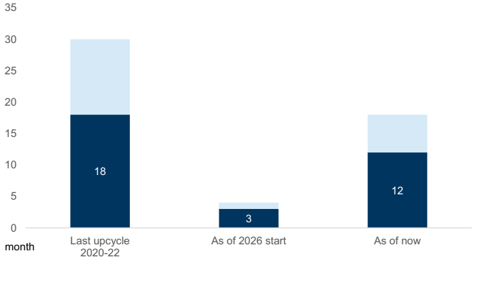
Following up on our ABF upgrade report from early this year (see here), we are seeing ABF substrate demand grow much faster than our original expectation. We now expect the ABF TAM to expand at a 62% 2025-28E CAGR to US$33bn in 2028, up from US$7.7bn in 2025 (Exhibit 3, vs. our prior estimate of a 33% CAGR) . Moreover, we expect the S/D gap for ABF substrates to widen from an 8% undersupply in 2026 to 34/51% in 2027/28 (Exhibit 1 vs. 5%/21%/42% undersupply in 2026/27/28 previously) , driven by stronger than expected demand from AI servers and general server CPU substrates, which together accounted for 26% of ABF industry demand in 2025, and should increase to 41/53/62% of demand in 2026/27/28; Exhibit 4). As a result, we expect the ABF substrate LTA/Spot prices to increase by 10-15%/20%+ QoQ per quarter from 3Q26 through at least the end of 2027, with shortages likely extending into 2028 or possibly beyond as ABF lead times have lengthened from 3-4 months at the start of the year to more than 12 months currently.
Given our bullish view on the ABF substrate pricing/pro fi tability outlook, we raise our TPs for NYPCB/Kinsus/Unimicron/ZDT to NT$2,310/1,120/1,140/824 from NT$1,115/555/630/388 with 4-22%/10-38% upward earnings revisions in 2027/28 and introduce our 2029 earnings estimates. Maintain our Buy rating on NYPCB (on CL)/Kinsus/ZDT, but stay Neutral on Unimicron.
ABF substrates could become a key bottleneck for the overall AI/server industry, supporting a solid price hike outlook
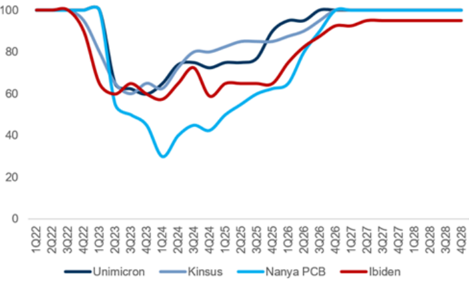
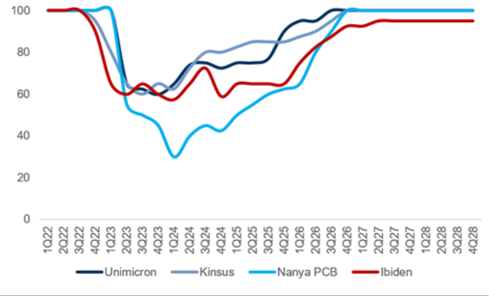
We began to see NYPCB/Kinsus UTR pick up rapidly (Exhibit 2) in 1H26, following Ibiden's nearly full utilization for GPU applications from 2H24 and Unimicron's full utilization from 2H25, and started seeing spot price hikes from April, which implies that shortages of substrate supply likely began much earlier than our original expectation, as we had expected them to emerge only from 2H26, thanks to the stronger than anticipated demand.
Our latest industry checks suggest that the ABF substrate lead times have now reached 12 months (vs. only 3-4 months as of early 2026), with more customers asking for ABF substrate capacity beyond 2029. Moreover, we started to see some tier 2/3 ABF substrate suppliers selling their on-hand capacity based on bidding, suggesting a much more favorable pricing/pro fi tability outlook for the spot price for
Goldman Sachs does and seeks to do business with companies covered in its research reports. As a result, investors should be aware that the fi rm may have a con fl ict of interest that could a ff ect the objectivity of this report. Investors should consider this report as only a single factor in making their investment decision. For Reg AC certi fi cation and other important disclosures, see the Disclosure Appendix, or go to www.gs.com/research/hedge.html. Analysts employed by non-US a ffi liates are not registered/quali fi ed as research analysts with FINRA in the U.S.
Chao Wang
+886(2)2730-4195 | kuanchao.wang@gs.com Goldman Sachs (Asia) L.L.C., Taipei Branch
Daiki Takayama
+81(3)4587-9870 | daiki.takayama@gs.com Goldman Sachs Japan Co., Ltd.
Allen Chang
+852-2978-2930 | allen.k.chang@gs.com Goldman Sachs (Asia) L.L.C.
Al Wang
+886(2)2730-4081 | al.wang@gs.com Goldman Sachs (Asia) L.L.C., Taipei Branch c45a43530f604d12bcb9a82b5aa6b9f6
ABF substrate suppliers.
All the above industry signs and data-point suggests to us that the ABF substrate shortage could last for more than 30 months, and our supply demand analysis suggests the shortage ratio of ABF substrates could reach 14%/34%/51% in 2H26/2027/2028, indicating potential for an even faster pace of price increases for ABF substrates. We expect the market to eventually recognize that substrate supply constraints could impact the overall AI server ramp up speed. Overall, we expect substrate LTA/spot prices to increase 10-15%/20%+ QoQ from 3Q26 through to the end of 2027, suggesting a solid upside potential to our GM estimate for all 4 ABF substrate players in Taiwan.
AI ASIC servers and general server CPUs are the key drivers of stronger than expected demand growth
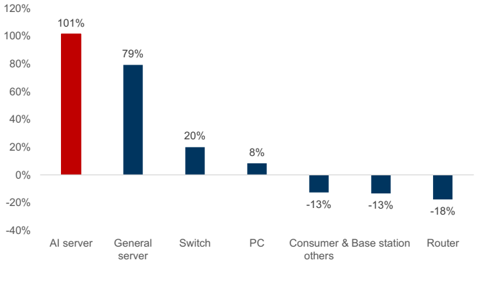
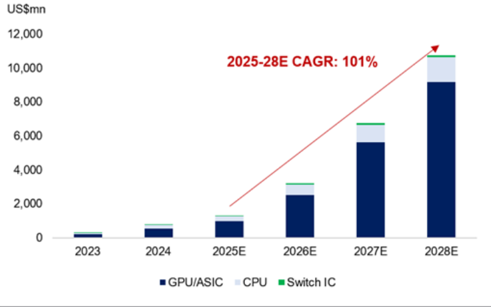
We now see the overall ABF substrate TAM expanding at a 62% 2025-28E CAGR vs. our original expectation of a 33% 2025-28E CAGR, with the stronger than expected demand growth mainly driven by (1) the stronger than expected AI ASIC substrate volume/pricing growth, and (2) much more favorable than expected server CPU substrate demand growth. We expect AI server demand (25% of ABF demand in 2026E) to grow at a 101% 2025-28E CAGR, bene fi ting Ibiden/Unimicron the most, as the two companies together still account for 74% of the AI server share in 2026. We also expect general server demand (15% of ABF demand in 2026E) to grow at a 47% 2025-28E CAGR, bene fi ting Kinsus the most, as server CPUs could account for 40%+ of the company's total ABF revenue in 2028, thanks to rising demand for high computing performance ICs and IC substrate technology migration.
For the other applications, we expect switches to grow the fastest, at a 20% 2025-28E CAGR, driven by solid expansion in ABF substrate size and layer count following the adoption of 1.6T/3.2T switch ICs starting in 2H26/2028. This should bene fi t NYPCB the most given the company's current 40%+ ABF revenue exposure to high-end networking ICs.
2Q26 preview and 3Q26 outlook: Spot price player to strongly outperform with a signi fi cant jump in GM/OPM
For the upcoming 2Q results, we believe all four TW ABF substrate companies will report better than expected earnings, 4-38% above BBG consensus , mainly driven by much stronger ABF substrate shipment volumes and better ASP/pricing. We also expect key spot price supplier, NYPCB, to enjoy the strongest GM/OPM expansion, from 15.8%/12.1% in 1Q26 to 26.3%/23.2% in 2Q26 (vs. consensus of 19.8%/17.5%) , supported by the 40%+ spot price hikes in 2Q26.
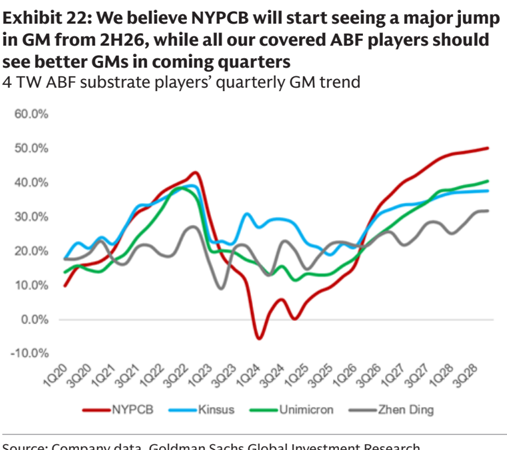
Going into 3Q, we expect all four TW ABF substrate suppliers to deliver even stronger earnings growth, while our 3Q26 operating income estimates for all 4 ABF substrate suppliers are 9-53% above BBG consensus . We expect the 4 TW ABF players' GM/OPM to expand by 3.5ppt/4.7ppt in 3Q26 , considering the even more positive ABF substrate ASP/price hike trend from 3Q26. For NYPCB, we believe GM/OPM will again expand the most in 3Q26, by +6.7ppt/+7.2ppt GM/OPM QoQ , further supported by our more favorable ABF substrate spot price outlook.
c45a43530f604d12bcb9a82b5aa6b9f6
100
80
60
40
20
0
ABF substrate supply/demand gap to widen to 14%/34%/51% in 2H26/2027/2028, with a much stronger pricing outlook
1Q24
— Unimicron
—Kinsus
We revise up our ABF substrate TAM 2025-28E CAGR from 33% to 62%, driven by (1) our faster than expected AI IC substrate demand outlook, mainly from ASIC volume growth, as well as solid progress on speci fi cation upgrades, and (2) solid demand for agentic AI server CPUs. We also see NVDA's launch of the new Vera standalone rack suggesting further upside demand potential for server CPU substrate suppliers in the coming years.
On the other hand, we are starting to see all ABF substrate players' capacity located in Japan/Korea/Taiwan become fully utilized, thanks to the solid demand outlook and the comparatively slower capacity expansion plans from key suppliers. Also, we have started to see ABF substrate lead times reach 12+ months currently vs. 3-4 months at the beginning of this year, which further echos our view on the solid demand growth since 2Q25.
As such, we now expect the overall ABF substrate supply/demand gap to reach 8/34/51% in 2026/27/28 (vs. our original expectation at 5%/21%/42%), while we see the faster than expected demand ramp up from April 2026, creating a supply shortage 1 quarter ahead of our estimate-we originally expected a shortage to begin in 2H26, with spot price product pricing hikes, but the shortage actually started in early 2Q26. The ABF substrate supply shortage beginning from April this year has directly led to a 40-60% pricing increase in the spot price market in 2Q26. We believe the pricing outlook for spot ABF substrates may accelerate in 2H26, as the shortage ratio likely rises further from 2% in 1H26 to 14% in 2H26E. Heading into 2027/28, we believe ABF substrate supply could be the IC supply chain bottleneck, potentially suggesting an even stronger pricing outlook for ABF substrates, as most all AI related customers have been focusing more on time to market timing than cost control. Accordingly, we believe the spot price of ABF substrates is poised to rise further by 60-80% YoY in both 2027 and 2028.
Exhibit 1: We expect the ABF industry S/D gap to continue expanding in coming years Supply shortage ratio
Source: Company data, Goldman Sachs Global Investment Research
Exhibit 2: We believe the ABF substrate industry UTR will continue trending up in 2H26 and reach full UTR
Source: Company data, Goldman Sachs Global Investment Research
c45a43530f604d12bcb9a82b5aa6b9f6
years
35
30
25
20
15
10
5
2004
2025 - 2028E
CAGR: 62%
- 40%
Source: Company data, Goldman Sachs Global Investment Research
Demand update: AI servers and server CPUs are the key drivers the ABF substrate demand
We expect ABF substrate TAM to reach US$33bn by 2028, up from US$7.7bn in 2025, implying a 62% 2025-28E CAGR (vs. our prior 33% estimate). Our upward revision is mainly due to (1) strong AI ABF substrate demand, driven primarily by a stronger ASIC substrate volume/price growth than we had expected, and (2) solid demand from general server CPUs, driven by agentic AI. We expect AI servers/general servers to account for 45%/17% of total 2028E demand, up from 13/12% in 2025 (Exhibit 4), and expect AI servers/general server ABF demand to grow at a 101/47% 2025-28E CAGR (Exhibit 5).
c45a43530f604d12bcb9a82b5aa6b9f6
ion|
100%
100
80%
80
60%
60
40%
40
-18%
20%
20
Router
0%
0
4%
10%
25%
37%
45%
Exhibit 4: ABF demand by application - AI server contribution continues to increase 15%
65% 63% 59% 56% 56% 54% 55% 54%
•PC
• Switch
• Consumer & others
55%
Source: Company data, Goldman Sachs Global Investment Research
Exhibit 5: AI servers to see strong 2025-28E demand growth, with a CAGR of 101%, followed by general servers at 79%
Source: Company data, Goldman Sachs Global Investment Research
The substrate supply shortage started much earlier than our original expectation (we had expected that shortages would only start from 2H26), which is re fl ected in (1) increasing UTR, as NYPCB and Kinsus have already seen their UTRs trend up in 1H26, and we expect all major ABF suppliers to operate at full UTR from 2H26 through at least 2028; and (2) lengthening lead times, which have now extended to 12+ months, vs. 3-4 months in early 2026, and are likely to move closer to the 18-30 months range observed during the previous upcycle in 2020-22.
Exhibit 6: We believe the ABF substrate industry UTR will continue trending up in 2H26 and reach full UTR
Source: Company data, Goldman Sachs Global Investment Research
Exhibit 7: ABF substrate lead times have now reached 12+ months vs. 3-4 months at the start of 2026
Lead time lower end and upper end
Source: Company data, Goldman Sachs Global Investment Research
We continue to see higher layer counts and larger body sizes for ABF substrates used in general server CPUs and AI chips, resulting in higher ABF area consumption per package. The ABF speci fi cation upgrade for general server CPUs is relatively moderate, and we expect a 30%+ increase in ABF area consumption for the next generation of Intel/AMD CPUs. However, we expect AI GPU's ABF area consumption to increase the most signi fi cantly. For example, we expect Nvidia's Rubin GPU to consume 123% more ABF area compared with the current Blackwell GPU, while the corresponding AI CPU is expected to see a 47% increase in ABF area consumption when comparing Nvidia's Vera and Grace CPUs. Current ASIC and switch platform upgrades also imply more ABF area consumption, but we expect their increase to fall behind that of AI GPUs.
17%
13%
44%
c45a43530f604d12bcb9a82b5aa6b9f6
LULS LOT
Cambro. nigel dor dred consumpton unver by moms layer count anu largel bouy size
60
Company
50
Intel
40
AMD
30
Nvidia
20
10
Nvidia
Type
Server CPU
Chip
Eagle Stream
Birch Stream outpace sipments growul tor
160%
Layer count Length (mm)
16
100.0
2025-28E shipment
Oak Stream
18
140%
20
104.5
109.2
Width (mm) Body size (mm') ABF area consumption
56.5
70.5
88.0
5,650
145%
7,367
9,606
CAGR at 47%
120%
Exhibit 8: Higher ABF area consumption driven by rising layer count and larger body size
2024
mn units
Amazon
Broadcom
90,400
192,129
132,611
97,718
| Venice | 20 80.1 | 83.8 80% 66% | 6,711 | 134,224 59% | |||
|---|---|---|---|---|---|---|---|
| AI CPU | Grace | 14 | 68.0 | 73.0 60% | 4,964 | 69,496 | |
| Vera | 18 14 | 76.0 | 75.0 40% | 5,700 | 102,600 | ||
| Hopper | 60.0 | 55.0 70.0 | 3,300 | 46,200 | |||
| AI GPU | Blackwell | 16 80.0 | 20% | 5,600 | 89,600 | ||
| Rubin | 20 100.0 | 100.0 0% | 10,000 | 200,000 | |||
| ASIC 2025 | Trainium 2 2026E | 2027E | 14 87.5 2028E | 72.5 2025 | 6,344 2026E | 2027E | 88,813 2028E |
| Trainium 3 | • Nvidia GPU Other GPU/ASIC AI CPU #Al Switches | 16 100.0 | 87.5 | 8,750 • Al chip shipment YoY | •AI ABF demand YoY | 140,000 | |
| Trainium 4 | 18 120.0 | 100.0 | 12,000 | 216,000 | |||
| Tomahawk 4 | 12 77.5 | 77.5 | 6,006 | 72,075 | |||
| Switch | Tomahawk 5 | 16 87.5 | 87.5 | 7,656 | 122,500 | ||
| Tomahawk 6 | 18 | 110.0 | 120.0 | 13.200 | 237,600 |
Source: Company data, Goldman Sachs Global Investment Research
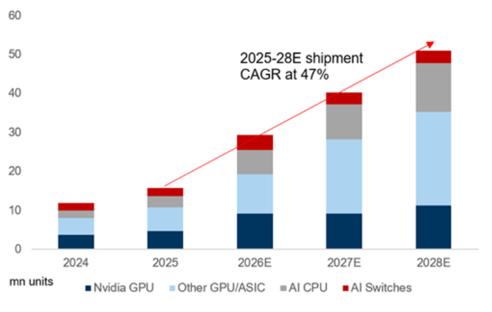
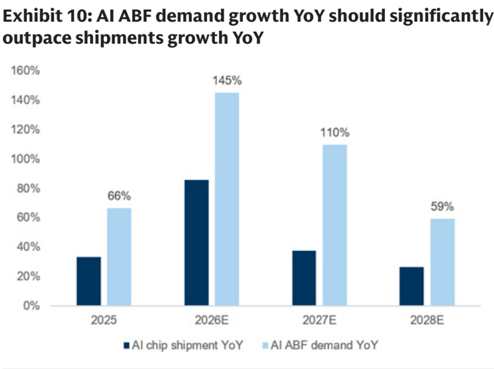
We expect AI ABF demand to grow at a 101% 2025-28E CAGR and account for 45% of total ABF demand by 2028, up from 13% in 2025, supported by strong shipment growth across all AI chips, especially for ASICs. For Nvidia GPUs, ABF demand growth is increasing driven by higher ABF content per chip, outpacing that of other AI chips. While we also expect increasing ABF content per chip for ASICs, ABF demand growth from ASICs over 2025-28E will likely be driven more by shipment volume growth, at a 58% 2025-28E CAGR. For AI CPUs, we also see NVDA's launch of the new Vera standalone rack implying more demand upside for AI CPU shipments. Overall, the increasing ABF area consumption for next gen AI chips should continue to drive overall ABF demand, and we expect AI ABF demand YoY growth to outpace AI chip shipment YoY growth in 2025-28E (Exhibit 10).
Exhibit 9: AI chip shipments to grow at a 47% CAGR from 2025-28E
Source: Company data, Goldman Sachs Global Investment Research
Source: Company data, Goldman Sachs Global Investment Research
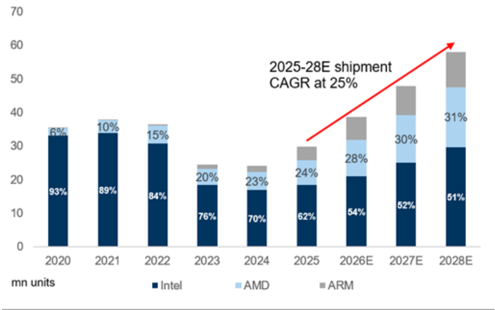
We expect general server CPU ABF demand to grow at a 47% 2025-28E CAGR and account for 17% of total ABF demand by 2028, up from 12% in 2025, with stable CPU shipments growing at a 25% 2025-28E CAGR. General server CPU demand is primarily driven by the growing adoption of agentic AI, which we could see lasting for another 3-5 years. As agentic AI applications become mainstream, we expect the GPU/CPU attach rates to move from 2x to 1.1-1.4x over time, implying that each GPU deployment will
97,718
110%
c45a43530f604d12bcb9a82b5aa6b9f6
Touciale colo chun Tune 405
70
60
50
40
30
20
10
2020
mn units
6%
93%
10%
89%
15%
84%
20%
76%
2025-28E shipment
23%
50%
43%
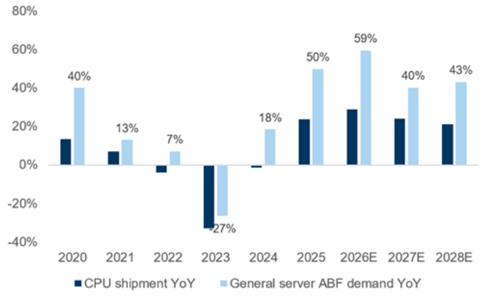
require more CPUs (see GS analyst Jim Schneider's Intel initiation). We expect a modest increase in ABF area consumption for general server CPUs compared with AI chips, with ABF area consumption increasing by 30%+ for next generation of Intel/AMD CPUs. As a result, we continue to expect general server CPU ABF demand YoY growth to outpace general server CPU shipments YoY in 2025-28E (Exhibit 12).
70%
62%
Exhibit 11: General server CPU shipments to grow at a moderate 25% CAGR from 2025-28E
Source: Company data, Goldman Sachs Global Investment Research
27%
Exhibit 12: General server ABF demand YoY will continue to outpace shipments YoY
Source: Company data, Goldman Sachs Global Investment Research
Supply update: We expect ABF suppliers will start to announce more CAPEX plans in coming quarters, although new capacity will likely only come online after 2H28 Compared with our previous ABF report update, we have seen some Taiwan ABF suppliers revise up their 2026 CAPEX plans since then: ZDT raised its plan from NT$50bn to NT$80bn in April and Unimicron raised theirs from NT$25bn to NT$34bn on their 1Q26 results call). Considering ongoing upgrades in ABF substrate speci fi cations (including higher layer count, larger body size, etc.) and ABF suppliers continuing to invest in technology upgrades to support next generation packaging (including CoPoS, glass substrate, EMIB-T, etc.), customers are requesting more long-term capacity, with some already requesting capacity beyond 2029. As a result, we expect ABF suppliers to announce additional CAPEX plans over the coming quarters/years to support sustained demand growth.
However, ABF substrate capacity volume will continue to decline as packaging body sizes increase and layer counts rise. This capacity ine ffi ciency is driven by increasing production complexity associated with more advanced substrate designs; hence, we expect existing capacity e ffi ciency to continue declining by ~10% annually if speci fi cation upgrades continue at their current pace.
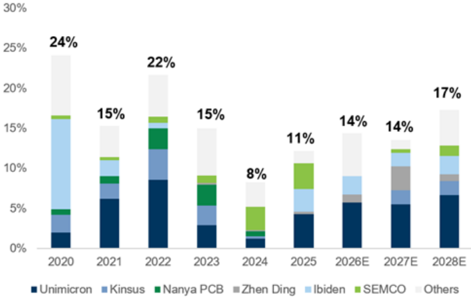
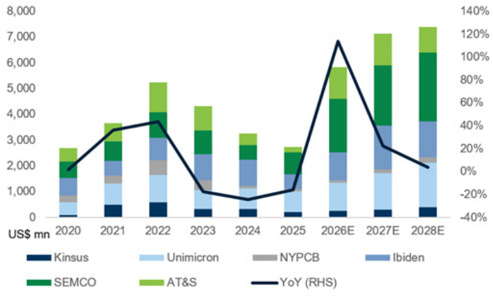
We expect overall ABF supply to reach a 15% CAGR in 2025-28E (Exhibit 14), supported by elevated CAPEX plans across the major ABF suppliers growing at 40% CAGR in 2025-28E (Exhibit 13). The current pace of capacity expansion is tracking behind CAPEX increases mainly due to (1) long equipment lead times, with some newly announced capacity becoming available only after 2028 and (2) some suppliers are also allocating CAPEX to other segment of their businesses (including MLCC, PCB, etc). However, we are seeing more ABF suppliers planning capacity beyond 2029, as their customers request more long-term capacity (Exhibit 15).
80%
60%
59%
c45a43530f604d12bcb9a82b5aa6b9f6
years
Camble 19. aersupphers capacity expansion pial Sums l0r waru
Company
8,000
Unimicron
7,000
6,000
Kinsus
5,000
Ibiden
4,000
AT&S
3,000
ZDT
2,000
1,000
TOPPAN
01
USS mn 2020
SEMCO
- Kinsus
• SEMCO
140%
30%
Time of new capacity come on-line
KF plant 1 phase 3: starts in 3Q26
120%
YM plant 2: start in mid 2028
100%
Capex
KF plant 1: NTS30bn+
YM plant 2: NT35-40bn
KF plant 2: NTS35-40bn
Yangmei K6 plant phase 2: NTS7bn in 2026
KF plant 2: start in 2H27
25%
24%
Yangmei K6 plant phase 2: 2027
Yangmei K6 plant phase 4: NTS8bn+ in 2028 per GSe
80%
Yangmei K6 plant phase 3: 2028
Yangmei K6 plant phase 4: 2029
20%
Exhibit 13: We expect ABF suppliers' combined CAPEX to remain elevated in order to meet growing capacity requirements 20% 15%
Shenzhen plant
0%
10%
Kaohsiung Al fab: MP in 2H26
Capacity expansion
KF plant 1 phase 3: Additional 15-20% of total capacity per GSe
YM plant 2: Additional 10-15% of total capacity per GSe
KF plant 2: Additional 15-20% of total capacity per GSe
Yangmei K6 plant phase 2: 10mn units
22%
Yangmei K6 plant phase 4: 15mn units
Yangmei K6 plant phase 3: 15mn units
Exhibit 14: We believe the overall pace of ABF substrate industry capacity will increase gradually in the coming years
8%
Kaohsiung: Additional 38% capacity expansion per GSe
AST Phase1 line: Mass production launch scheduled for FY27
Ishikawa (Advanced packaging) : Statup schedules for July 2026, mass production scheduled for FY28 or later
New Ishikawa FC-BGA line: Mass production scheduled for FY30 or later
AST Phase2 line : Timing TBD
Vietnam plant: operation starts in 2H27
2020
Yangmei K6 plant phase 3: NTSbn in 2027 per GSe
Capex for IC substrate at NTS12-16bn in 2026
Source: Company data, Goldman Sachs Global Investment Research
Source: Company data, Goldman Sachs Global Investment Research
Exhibit 15: ABF suppliers' capacity expansion plan going forward
Source: Company data, Goldman Sachs Global Investment Research
Supply / demand update: We believe the overall ABF substrate industry will see shortage ratios of 14%/34%/51% in 2H26/2027/2028, leading to a favorable pricing outlook
We update our ABF industry model, and now expect the ABF TAM to grow at a 62% 2025-28E CAGR (vs. 33% over 2025-28E, previously). The upward revision is mainly driven by (1) the strong AI server growth, especially on the ASIC shipments, and (2) rapid growth in general server CPU shipments which we expect to continue ramping at a 25% 2025-28E CAGR, driven mainly by solid agentic AI demand. Furthermore, while several suppliers have announced new capacity expansion plan for the coming years and some ABF substrate suppliers are even evaluating new CAPEX plans for the long term (beyond 2029), we expect near term supply to remain constrained by long equipment lead times, resulting in overall ABF supply growing at only a 15% 2025-28E CAGR, leading to overall undersupply ratios of 14%/34%/51% in 2H26/27/28, respectively.
Expansion plant
Yangmei K6 plant c45a43530f604d12bcb9a82b5aa6b9f6
will acccica.cleuce cor
Tom Oo 70)
35%
US$mn
12,000
30%
25%
10,000
20%
8,000
15%
6,000
10%
4,000
5%
2,000
0%
0
22%
2025-28E CAGR: 101%
we Miner ma neth commis years
100%
USSmn
90%
12,000
80%
10,000
70%
Exhibit 16: We forecast key AI IC substrate TAM will continue to grow at a 101% 2025-28E CAGR (revised up from 66%) 8,000 60% 40%
4,000
30%
2023
Source: Company data, Goldman Sachs Global Investment Research
60%
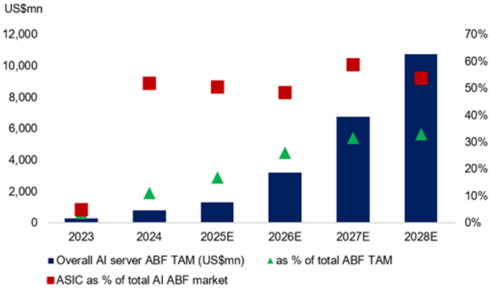
Exhibit 17: ASIC to account for 50%+ of total AI ABF substrate demand in 2028E 40%
9%
30%
20%
7%
2023
2024
Source: Company data, Goldman Sachs Global Investment Research
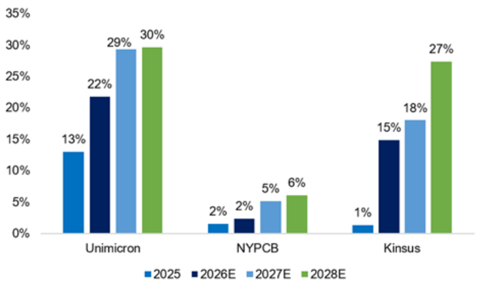
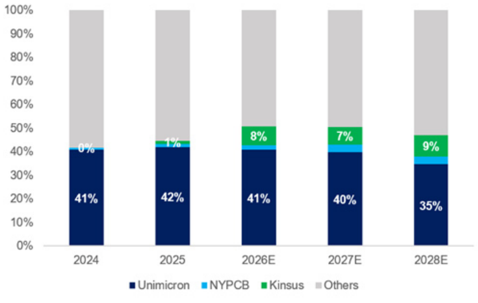
In terms of market share, we continue to see Kinsus gaining market share in the NVDA supply chain (especially for AI server CPUs and NVSwitch ICs). We expect Kinsus to hold 8/7/9% of AI substrate market share in 2026/27/28E (up from 1% in 2025E) and AI to account for 15%/18%/27% of the company's total revenue in 2026/27/28E (vs. 2% in 2025).
Exhibit 18: We believe Kinsus' AI ABF revenue exposure will accelerate in 2025-28E
Source: Company data, Goldman Sachs Global Investment Research
Exhibit 19: We expect Kinsus will continue to gain share in the AI ABF market in coming years
Source: Company data, Goldman Sachs Global Investment Research
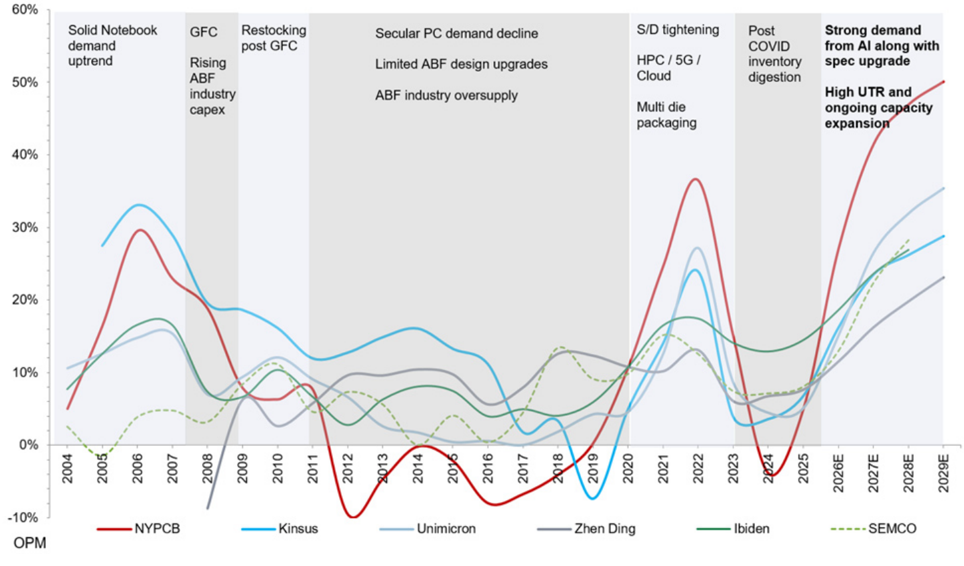
Due to the accelerating shortage ratio we anticipate in 2025-28E, we now expect the ABF substrate LTA/spot prices to increase by 10-15%/20%+ QoQ per quarter from 3Q26 through to at least the end of 2027, and expect the shortages will continue into 2028 and possibly beyond. The stronger ABF pricing environment suggests a solid upside potential to our OPM estimates for all 4 ABF substrate players in Taiwan in the coming quarters/years (Exhibit 20).
27%
c45a43530f604d12bcb9a82b5aa6b9f6
strongest orM growult coms yudrters/yedis
60%
12,000
50%
10,000
40%
8,000
30%
6,000
20%
4,000
10%
2,000
0
US$ mn
0%
2028 AI ABF TAM (old)
-10%
OPM
2004
demand uptrend
GFC
Rising
Secular PC demand decline
1,397
Limited ABF design upgrades
S/D tightening
HPC / 5G /
Post
COVID
inventory
Strong demand spec upgrade
from Al along with
10,754
Exhibit 20: We expect the ongoing OPM uptrend to continue, while we believe spot price players could deliver their strongest OPM growth in coming quarters/years Multi die packaging ongoing capacity expansion
8,269
OPMs are on a companywide basis
Source: Company data, Goldman Sachs Global Investment Research
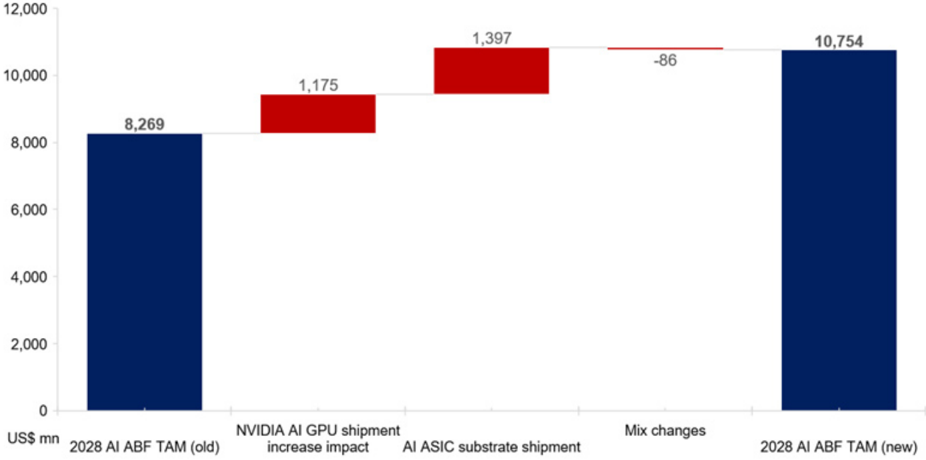
Exhibit 21: We revise up our 2028E AI ABF substrate TAM by 30% to factor in our more positive view on stronger AI substrate shipments and larger AI substrate sizes
Source: Company data, Goldman Sachs Global Investment Research
Restocking post GFC
c45a43530f604d12bcb9a82b5aa6b9f6
2Q26 & 3Q26 preview - stronger ABF substrate pricing to drive GM expansion
For the upcoming 2Q result, we believe all four TW ABF substrate companies will see better than expected earnings (4-38% higher than BBG consensus) , mainly driven by much higher ABF substrate volume shipments and stronger ASP/pricing thanks to the substrate supply tightness from 2Q.
Considering that spot prices increased by 40%+ from April, we expect key spot price player NYPCB, which had 80% exposure to the spot price market in 1Q26, to see its GM expand from <16% in 1Q26 to 26%+ in 2Q26. The 10ppt QoQ GM expansion should mainly be due to better pricing, likely allowing NYPCB to continue to outgrow all other ABF substrate suppliers who have greater LTA exposure. For Unimicron/Kinsus/ZDT, we expect the three companies' GM to surpass BBG consensus by 0.2/1.2/0.3ppt, respectively, on strengthening product mix and improving pricing conditions.
Going into 3Q, we expect all four TW ABF substrate suppliers to deliver even stronger earnings growth, while our 3Q26 operating income estimate for all 4 ABF substrate suppliers are 9-53% higher than BBG consensus . We expect the 4 TW ABF players' GM/OPM to expand by 3.5ppt/4.7ppt in 3Q26 , re fl ecting even more positive ABF substrate ASP/price hike trends in 3Q26. For NYPCB, we believe the GM/OPM will again expand the most in 3Q26 with +6.7ppt/+7.2ppt GM/OPM QoQ , again supported by a more favorable ABF substrate spot price outlook. For Unimicron/Kinsus/ZDT, we expect these three companies' OPM to surpass BBG consensus by 1.5/3.7/0.9ppt, on a stronger product mix and improved pricing conditions.
Overall, we believe the ABF substrate pricing uptrend just started in 2Q26, and we should see further acceleration in ABF substrate pricing given the shortage conditions (i.e., no IC can be packaged without a substrate), leading to a favorable pro fi tability outlook over the coming quarters/years. Within the Taiwan ABF substrate industry, we prefer the spot price players (with NYPCB (CL-Buy) as the key spot price player here), considering the potential upside to their GM/OPM outlook, which are both still 15ppt below the peak level. We believe sustained AI infrastructure investment demand and long equipment lead times will continue to drive spot prices much more strongly than LTA pricing, suggesting solid earnings upside potential, which we should start seeing in 2Q26 results.
c45a43530f604d12bcb9a82b5aa6b9f6
Calll 4t 4240 8 9240 Coe v9. boo consensus comp labie
NT$ mn
60.0%
NTS mn; GSe
GSe
Sales
Gross Profit
Sales
50.0%
Gross Profit
40.0%
EBIT
Net Income
EBIT
3,568
3,144
Net Income
EPS (NTS)
30.0%
EPS (NT$)
GM (%)
OPM (%)
20.0%
GM (%)
OPM (%)
BBG consensus sth
Sales
10.0%
0.0%
Gross Profit
EBIT
-10.0%
Net Income
EPS (NTS)
OPM (%)
-Kinsus
—NYPCB
GM (%)
Differences (GSe vs. BBG)
Sales
Gross Profit
EBIT
Net Income
EPS (NT$)
GM (%)
OPM (%)
2,755
4.26
26.3%
23.2%
7339388
NYPCB
13.575
3.144
3.568
2,755
.4.26
26.3%
23.2%
NYPCB
13.318
2,329
2,633
1.953
3.10
19.8%
— Unimicron
17.5%
NYPCB
2%
35%
35%
41%
38%
6.50pt
5.7ppt
2Q26E
Kinsus
Unimicron
12,496
1.717
42,920
5,743
9,306
ZDT
2Q26
42,920
9,306
48.431
5,743
NYPCB
17,659
5,354
5,815
10,430
3.282
3Q26E
Kinsus
Unimicron
14,756
2,814
50.138
8,474
12,435
6.225
24.8%
4.05
16.9%
3:366089
Unimicron
18.00%
11,446
7,542
6,348
4.11
23.4%
15.4%
Unimicron
3%
9%
12%
-2%
-2%
1.4ppt
1.5ppt
4,533
Source: Company data, Goldman Sachs Global Investment Research
Exhibit 23: 4 TW ABF substrate players' 3Q26 vs 2Q26 earnings estimate, we expect solid margin expansion for NYPCB/Kinsus
Source: Company data, Goldman Sachs Global Investment Research
Exhibit 24: 2Q26 & 3Q26 GSe vs. BBG consensus comp table
Source: Company data, Goldman Sachs Global Investment Research, Bloomberg
Earnings estimate changes: Faster than expected margin expansion driven by better ABF substrate
4,013
15,637
5,393
8,488
5.03
24.5%
13.3%
ZDT
62,737
7,802
15.367
4,899
4.50
24.5%
12.4%
ZDT
2%
2%
9%
10%
12%
0.0ppt
0.9ppt c45a43530f604d12bcb9a82b5aa6b9f6
Exmolt 4o. NTr eD edrmlings reviston labie
Exmore 4o. ninsus earmlos revision table
NYPCB P&L (NT$ mn)
Kinsus P&L (NT$ mn)
Sales
Sales
Gross Profit
Gross Profit
EBIT
EBIT
Net Income
Net Income
EPS (NT$)
pricing
Ratio analysis
EPS (NTS)
Gross margin
Ratio analysis
Gross margin
EBIT margin
EBIT margin
Net margin
Net margin
2026E New
2026E New
64,805
19,351
17,488
14,478
22.41
29.9%
27.0%
22.3%
2026E Olc
2026E Old
73,477
18,378
16,279
13,232
20.48
25.0%
2027E New
2027E New
127,361
55.812
52,764
41,783
64.66
43.8%
22.2%
Diff.
-12%
5%
7%
9%
9%
4.8pp
4.8pp.
41.4%
Earnings revisions NYPCB
2029E New
2029E New
148,104
68,211
116,387
www
54,488
180.12
116.52
52.4%
50.1%
40.0%
28.8%
39.4%
23.0%
......•••••••••••••
We revise up our 2026/27/28E earnings estimates by 9%/22%/36% to factor in much more favorable supply/demand outlook for ABF substrate, with higher pricing driven by supply constraints. The stronger-than-expected demand pull-in for ABF substrates should continue to support pricing uplift longer term. Considering the stronger ABF substrate pricing outlook, we revise up our 2026/27/28E GM by 4.8/8.3/10.5ppt. We revise down 2026E revenue by 12% due to the weaker-than-expected shipments driven by material shortages the in near term but revise up our 2028E revenue by 9% to factor in stronger long-term demand for ABF substrates.
Also, we introduce our 2029E earnings estimates in this report.
Exhibit 25: NYPCB earnings revision table
Source: Goldman Sachs Global Investment Research
Kinsus
We revise down our 2026E net earnings by 2% after applying a more conservative margin assumption on its IC substrate business in 2Q26E but revise up our 2027/28E net earnings by 8/38%, driven by a better ABF substrate pricing outlook and a much more favorable supply demand outlook for the overall ABF substrate market. We revise up our 2027/28 revenue estimate by 9%/34% and revise up our 2028 GM by 0.5ppt.
Also, we introduce our 2029E earnings estimates in this report.
Exhibit 26: Kinsus earnings revision table
Source: Goldman Sachs Global Investment Research
Unimicron
We revise down our 2026E revenue by 1% to re fl ect weaker-than-expected shipments due to material shortages but revise up our 2027/28E revenue estimate by 2/6% to factor in the better demand visibility for ABF substrates, supporting a steeper pricing
2027E Old
2027E Old
127.932
45,427
42,363
34,166
52.88
35.5%
34.7%
23.5%
33.1%
26.7%
17.9%
Diff.
Diff.
0%
9%
23%
9%
25%
22%
9%
8%
22%
8%
8.3pp
8.3pp
6.1pp
2028E New
2028E New
194,486
95,782
154,185
57,734
91,270
71,191
40,422
110.17
31,701
67.79
49.2%
46.9%
36.6%
2028E Old
2028E Old
178.551
69,255
65,114
52,209
80.80
38.8%
36.5%
37.0%
25.7%
20.0%
29.2%
Diff.
9%
40%
38%
36%
36%
10.5pp
10.5pp
7.4pp.
c45a43530f604d12bcb9a82b5aa6b9f6
canoner emmicron carmings revision lavie
Exmoll 40. 401 earnings revision labie
ZD Tech P&L (NT$ mn)
Unimicron P&L (NTS mn)
Sales
Sales
Gross Profit
EBIT
Gross Profit
EBIT
Net Income
Net Income
EPS (NTS)
Ratio analysis
EPS (NTS)
Gross margin
Ratio analysis
Gross margin
EBIT margin
EBIT margin
Net margin
Net margin
2026E New
2026E New
2026E Old
224,680
188,516
53,140
25,882
44,333
28,373
25,490
16,363
15.27
16.58
23.7%
11.5%
23.5%
15.1%
13.5%
2029E New
2029E New
139,326
206,613
2027E Old
2027E Old
293,972
82,163
321,782
92,603
70,995
2026E Old
226,449
191,063
54,060
26,593
43,497
27,336
2028E New
2028E New
454,047
424,900
133,376
89,985
166,786
135,710
2028E Old
2028E Old
407,834
402,458
110,548
71,561
149.463
120,028
Diff.
Diff.
-1%
-1%
-2%
-3%
2%
4%
2027E New
2027E New
327,764
85,019
299,174
101,274
79,287
Diff.
Diff.
2%
2%
3%
4%
9%
12%
Diff.
Diff.
11%
21%
6%
12%
26%
13%
53,206
50,922
uplift in the longer term. We revise up our 2026/27/28E GM by 0.8/2.4/2.1ppt, resulting in 7/12/10% higher EPS estimates with improvement in operating leverage.
22.8%
0.8pp
Also, we introduce our 2029E earnings estimates in this report. 16.2% 19.8%
1.0pp
Exhibit 27: Unimicron earnings revision table
Source: Goldman Sachs Global Investment Research
ZDT
We revise down our 2026E revenue by 1% considering the material shortage, which has led to weaker-than-expected shipments and revise up our 2027/28E revenue estimates by 2/11% to factor in the stronger-than-expected ABF substrate pull-ins and a better pricing outlook. We revised down ZDT's 2026E GM by 0.2ppt due to weaker shipments, resulting in 3% lower 2026E EPS estimates, but we revise up 2027/28 GM by 0.4/2.3ppt to re fl ect a much stronger than expected ABF substrate pricing outlook, resulting in 4/25% higher EPS estimates.
Also, we introduce our 2029E earnings estimates in this report
Exhibit 28: ZDT earnings revision table
Source: Goldman Sachs Global Investment Research
Valuation NYPCB
We are Buy rated (on CL) with a new 12-month TP of NT$2,310 (from NT$1,115), based on the same 21.0x P/E on 2028E EPS (rolled over from 2027E). We believe the company could trade at 1.5x STDV above the past upcycle average P/E of 13.3x, as we continue to expect better pricing condition for ABF substrates, and factor in our latest earnings revisions.
33.9%
31.5%
24pp
39.3%
37.1%
2.1pp.
2.3pp
1.3pp
2.1pp
0.9pp
42.3%
23.1%
13.9%
27.8%
35.4%
7.3%
c45a43530f604d12bcb9a82b5aa6b9f6
calvis ou nilsus raL lavic
NTSmn
2Q25
2Q25
1Q25
1Q25
NTSmn
Revenue
Revenue
Gross profit
Gross profit
Operating expense
Operating expense
Operating income
3Q25
3Q25
10.356
10,967
1,050
1.964
(429)
620
4Q25
4Q25
10.811|
11,165
1,398
2,393
(435)
963
(403)
366
(1,396)
620
(397)
33
Operating income
Pretax income
256
907
Taxes expense
Pretax income
(227)
(1,336)
628
(1,473)
921
(1,440)
501
700
713
619
Taxes expense
Net income
1,409
1,055
Exhibit 29: NYPCB P&L table
Net income
EPS, NT$
0.32
1.12
(0.29)
EPS, NTS
Ratio analysis and assumption
As % of sales
Ratio analysis and assumption
As % of sales
Gross margin
Gross margin
Operating expense ratio
Operating margin
Operating expense ratio
Operating margin
Net margin
Net margin
QoQ growth (%)
Revenue
2024
2024
30,535
32,283
358
8,668
(1,624)
(1,267)
(7,572)
1,095
163
41
1,603
(272)
49
204
0.32
2025
2025E
40,173
39.351
3.647
8.314
(1,665)
1,982
(5,645)
2,670
3,087
2.346
(399)
1.947
(370)
1,596
2026E
2026E
54.949
64,805
19,351
(1,863)
15,529
(6,634)
17.488
8.895
18.394
(3,916)
9,168
(1,483)
6,250
14.478
22.41
2027E
2027E
127,361
95,645
55,812
33.138
(3,048)
(10,645)
52.764
22.494
52,764
(10,981)
22,579
(4,064)
17,030
41.783
64.66
2028E
2028E
154.185
194,486
95,782
57.734
(4,511)
91,270
(17,311)
40.422
91,270
(20,079)
40,507
(7,291)
31,701
71,191
110.17
2029E
2029E
236,684
295,639
(26,486)
68,211
148.104
148.824
(32,437)
68,396
(12,311)
54,488
116.387
180.12
4Q26E
4Q26E
16.592
22,393
8,197
5,365
(559)
7.638
1Q27E
1Q27E
17.988
25,209
10.106
6.037
(1,891)
3.473
7.818
(1,720)
3,473
(590)
2,543
6,098
9.44
26.8%
(635)
9.471
2Q27E
2Q27E
22.768
29,637-
7.695
12,457.
(2,065)
3,972
4,022
9.471
(706)
11.751
3Q27E
3Q27E
34,098
26.835
15,202
9,290
(2,459)
5,236
5,286
11.751
(1,800)
7.672
(724)
2,978
(2,585)
9.166
(808)
14.394
4Q27E
38,417
18,047
(2,979)
6,311
14.394
(3,167)
6.311
(952)
3,920
11.228
17,147
(899)
17,147
(3,429)
13,718
(1,136)
4.793
2Q26E
2Q26E
12.496
13,575
3.282
3,568
(424)
3.144
(1,565)
1.717
3.444
1.817
(689)
2,755
(309)
1,093
3Q26E
3Q26E
14.756
17,659
4.533
5,815
(461)
5,354
(1,719)
2.814
5.534
(1,217)
2,914
(495)
2,065
4.316
6.68
30.1%
| 0.61 | 0.74 0.75 | 1.41 | 2.34 | 4.42 5.44 | 6.37 | 8.38 | 10.25 | 0.11 | 3.52 13.36 | 36.42 67.79 | 116.52 | |||
|---|---|---|---|---|---|---|---|---|---|---|---|---|---|---|
| 5.1% | 8.0% 9.6% | 12.5% | 15.8% | 26.3% | 32.9% | 36.6% | 42.0% | 44.6% | 47.0% | 9.1% 29.9% | 43.8% 49.2% | |||
| 4.7% 22.5% | 4.2% 3.9% 21.1% 19.0% | 22.1% | 3.8% | 3.1% 26.3% | 2.6% 30.7% | 2.5% 32.3% | 40.1% 2.5% 2.4% 33.6% 33.8% | 2.4% 34.6% | 2.3% 36.1% | 1.1% 5.0% 28.4% | 4.1% 2.9% 21.1% 28.3% | 2.4% 34.6% 37.4% | 2.3% 40.0% | 52.4% 2.4% |
| 0.4% 16.7% | 3.8% 5.7% 14.6% 12.9% | 3.9% 8.6% 13.6% | 12.1% | 23.2% 12.5% | 30.3% 11.7% | 34.1% 11.4% | 37.6% 39.6% 11.5% 10.8% | 42.2% 11.1% | 44.6% 11.2% | -3.9% 24.8% | 4.9% 27.0% 12.1% | 41.4% 11.1% 11.2% | 46.9% 11.2% | 50.1% |
| 2.5% 5.8% | 6.6% 6.5% 6.1% | 10.8% 8.5% | 11.7% | 20.3% 13.7% | 24.4% 19.1% | 27.2% 20.9% | 30.4% 30.9% 22.1% 23.0% | 32.9% 23.5% | 35.7% 24.9% | 0.6% 3.6% 14.3% 6.8% | 22.3% 16.2% | 32.8% 36.6% 26.2% | 28.8% | 39.4% |
| 3.2% | -2.0% 3.5% 3.3% | 5.9% | 4.9% | 8.7% | 14.0% | 15.3% | 16.6% 17.2% | 17.9% | 19.0% | 0.2% 4.1% | 4.8% 11.4% | 23.5% 17.8% 20.6% | 23.0% |
Revenue
Gross profit
QoQ growth (%)
Operating income
Net income
Gross profit
Operating income
Net income
YoY growth (%)
Revenue
Gross profit
Operating income
Revenue
Gross profit
Operating income
Net income
Net income
14.4%
36.5%
8.3%
0.1%
26.7%
2.7%
1.86
1.8%
33.2%
4.4%
13.3%
78.7%
11.0%
4.26
21.5%
101.4%
12.5%
7.5%
2441.0%
7.2%
11.87
12.6%
8.4%
23.3%
14.19
17.6%
23.3%
26.6%
17.38
15.1%
22.0%
17.9%
21.23
12.7%
18.7%
4.5%
| -108.5% 1006.2% 69.4% 55.2% 40.4% 132.5% 70.3% 42.7% 24.0% 24.1% 22.5% 19.1% -13.6% 3.8% -2.6% 21.9% -1.8% 39.7% 38.1% 18.4% 12.5% 8.9% | -108.5% 1006.2% 69.4% 55.2% 40.4% 132.5% 70.3% 42.7% 24.0% 24.1% 22.5% 19.1% -13.6% 3.8% -2.6% 21.9% -1.8% 39.7% 38.1% 18.4% 12.5% 8.9% | -108.5% 1006.2% 69.4% 55.2% 40.4% 132.5% 70.3% 42.7% 24.0% 24.1% 22.5% 19.1% -13.6% 3.8% -2.6% 21.9% -1.8% 39.7% 38.1% 18.4% 12.5% 8.9% | -108.5% 1006.2% 69.4% 55.2% 40.4% 132.5% 70.3% 42.7% 24.0% 24.1% 22.5% 19.1% -13.6% 3.8% -2.6% 21.9% -1.8% 39.7% 38.1% 18.4% 12.5% 8.9% | -108.5% 1006.2% 69.4% 55.2% 40.4% 132.5% 70.3% 42.7% 24.0% 24.1% 22.5% 19.1% -13.6% 3.8% -2.6% 21.9% -1.8% 39.7% 38.1% 18.4% 12.5% 8.9% | -108.5% 1006.2% 69.4% 55.2% 40.4% 132.5% 70.3% 42.7% 24.0% 24.1% 22.5% 19.1% -13.6% 3.8% -2.6% 21.9% -1.8% 39.7% 38.1% 18.4% 12.5% 8.9% | -108.5% 1006.2% 69.4% 55.2% 40.4% 132.5% 70.3% 42.7% 24.0% 24.1% 22.5% 19.1% -13.6% 3.8% -2.6% 21.9% -1.8% 39.7% 38.1% 18.4% 12.5% 8.9% | -108.5% 1006.2% 69.4% 55.2% 40.4% 132.5% 70.3% 42.7% 24.0% 24.1% 22.5% 19.1% -13.6% 3.8% -2.6% 21.9% -1.8% 39.7% 38.1% 18.4% 12.5% 8.9% | -108.5% 1006.2% 69.4% 55.2% 40.4% 132.5% 70.3% 42.7% 24.0% 24.1% 22.5% 19.1% -13.6% 3.8% -2.6% 21.9% -1.8% 39.7% 38.1% 18.4% 12.5% 8.9% | -108.5% 1006.2% 69.4% 55.2% 40.4% 132.5% 70.3% 42.7% 24.0% 24.1% 22.5% 19.1% -13.6% 3.8% -2.6% 21.9% -1.8% 39.7% 38.1% 18.4% 12.5% 8.9% | -108.5% 1006.2% 69.4% 55.2% 40.4% 132.5% 70.3% 42.7% 24.0% 24.1% 22.5% 19.1% -13.6% 3.8% -2.6% 21.9% -1.8% 39.7% 38.1% 18.4% 12.5% 8.9% | -108.5% 1006.2% 69.4% 55.2% 40.4% 132.5% 70.3% 42.7% 24.0% 24.1% 22.5% 19.1% -13.6% 3.8% -2.6% 21.9% -1.8% 39.7% 38.1% 18.4% 12.5% 8.9% | -108.5% 1006.2% 69.4% 55.2% 40.4% 132.5% 70.3% 42.7% 24.0% 24.1% 22.5% 19.1% -13.6% 3.8% -2.6% 21.9% -1.8% 39.7% 38.1% 18.4% 12.5% 8.9% | |||||
|---|---|---|---|---|---|---|---|---|---|---|---|---|---|---|---|---|---|
| 16.1% -190.3% -486.7% 65.8% 8.9% 110.5% 56.7% 41.3% 25.8% 19.5% 22.5% 22.2% 23.7% 1.3% 46.6% -3.3% 92.8% 63.9% 23.4% 14.4% 27.5% 31.8% 20.7% 20.5% 10.5% | 16.1% -190.3% -486.7% 65.8% 8.9% 110.5% 56.7% 41.3% 25.8% 19.5% 22.5% 22.2% 23.7% 1.3% 46.6% -3.3% 92.8% 63.9% 23.4% 14.4% 27.5% 31.8% 20.7% 20.5% 10.5% | 16.1% -190.3% -486.7% 65.8% 8.9% 110.5% 56.7% 41.3% 25.8% 19.5% 22.5% 22.2% 23.7% 1.3% 46.6% -3.3% 92.8% 63.9% 23.4% 14.4% 27.5% 31.8% 20.7% 20.5% 10.5% | 16.1% -190.3% -486.7% 65.8% 8.9% 110.5% 56.7% 41.3% 25.8% 19.5% 22.5% 22.2% 23.7% 1.3% 46.6% -3.3% 92.8% 63.9% 23.4% 14.4% 27.5% 31.8% 20.7% 20.5% 10.5% | 16.1% -190.3% -486.7% 65.8% 8.9% 110.5% 56.7% 41.3% 25.8% 19.5% 22.5% 22.2% 23.7% 1.3% 46.6% -3.3% 92.8% 63.9% 23.4% 14.4% 27.5% 31.8% 20.7% 20.5% 10.5% | 16.1% -190.3% -486.7% 65.8% 8.9% 110.5% 56.7% 41.3% 25.8% 19.5% 22.5% 22.2% 23.7% 1.3% 46.6% -3.3% 92.8% 63.9% 23.4% 14.4% 27.5% 31.8% 20.7% 20.5% 10.5% | 16.1% -190.3% -486.7% 65.8% 8.9% 110.5% 56.7% 41.3% 25.8% 19.5% 22.5% 22.2% 23.7% 1.3% 46.6% -3.3% 92.8% 63.9% 23.4% 14.4% 27.5% 31.8% 20.7% 20.5% 10.5% | 16.1% -190.3% -486.7% 65.8% 8.9% 110.5% 56.7% 41.3% 25.8% 19.5% 22.5% 22.2% 23.7% 1.3% 46.6% -3.3% 92.8% 63.9% 23.4% 14.4% 27.5% 31.8% 20.7% 20.5% 10.5% | 16.1% -190.3% -486.7% 65.8% 8.9% 110.5% 56.7% 41.3% 25.8% 19.5% 22.5% 22.2% 23.7% 1.3% 46.6% -3.3% 92.8% 63.9% 23.4% 14.4% 27.5% 31.8% 20.7% 20.5% 10.5% | 16.1% -190.3% -486.7% 65.8% 8.9% 110.5% 56.7% 41.3% 25.8% 19.5% 22.5% 22.2% 23.7% 1.3% 46.6% -3.3% 92.8% 63.9% 23.4% 14.4% 27.5% 31.8% 20.7% 20.5% 10.5% | 16.1% -190.3% -486.7% 65.8% 8.9% 110.5% 56.7% 41.3% 25.8% 19.5% 22.5% 22.2% 23.7% 1.3% 46.6% -3.3% 92.8% 63.9% 23.4% 14.4% 27.5% 31.8% 20.7% 20.5% 10.5% | 16.1% -190.3% -486.7% 65.8% 8.9% 110.5% 56.7% 41.3% 25.8% 19.5% 22.5% 22.2% 23.7% 1.3% 46.6% -3.3% 92.8% 63.9% 23.4% 14.4% 27.5% 31.8% 20.7% 20.5% 10.5% | 16.1% -190.3% -486.7% 65.8% 8.9% 110.5% 56.7% 41.3% 25.8% 19.5% 22.5% 22.2% 23.7% 1.3% 46.6% -3.3% 92.8% 63.9% 23.4% 14.4% 27.5% 31.8% 20.7% 20.5% 10.5% | |||||
| NM | 99.1% | ||||||||||||||||
| 19.1% 18.0% -210.7% 22.5% | 19.3% 0.3% | 41.9% 89.3% | 32.1% -14.5% | 41.7% 61.0% 88.9% | 100.6% 23.2% | 125.5% 17.1% | 118.3% 31.6% | 93.1% 22.3% | 71.6% 11.4% | -24% | 24% 61% | ||||||
| -213.1% 23.2% | 319.0% 95.2% | N.A | 311.7% 364.0% | 453.9% | 486.3% | 470.5% | 249.2% | 161.4% | 120.2% | -96% | 920% 431% | 188% | 97% | 53% 72% | 52% 62% | ||
| 396.4% 31.0% 26.3% | -346.5% 34.4% 6.5% | 3986.2% 758.8% 28.8% 21.0% | 763.1% 30.7% 62.8% 42.5% 130.8% | 693.2% 53.5% 124.2% | 600.4% 62.0% 157.0% | 273.8% 82.2% 134.5% | 168.9% 81.9% 104.9% | 124.5% | -120% 14% 28% | -257% 782% 29% -4% 40% 87% | 202% 74% 113% | 61% 74% | 73% 54% 64% | 62% | |||
| -236.1% | -104 2% -276.9% -258.0% 1130.9% 2.7% -5.1% -18.4% | -104 2% -276.9% -258.0% 1130.9% 2.7% -5.1% -18.4% | -104 2% -276.9% -258.0% 1130.9% 2.7% -5.1% -18.4% | -104 2% -276.9% -258.0% 1130.9% 2.7% -5.1% -18.4% | -104 2% -276.9% -258.0% 1130.9% 2.7% -5.1% -18.4% | -104 2% -276.9% -258.0% 1130.9% 2.7% -5.1% -18.4% | -104 2% -276.9% -258.0% 1130.9% 2.7% -5.1% -18.4% | -104 2% -276.9% -258.0% 1130.9% 2.7% -5.1% -18.4% | -104 2% -276.9% -258.0% 1130.9% 2.7% -5.1% -18.4% | -104 2% -276.9% -258.0% 1130.9% 2.7% -5.1% -18.4% | 856% 644% | 189% | -104 2% -276.9% -258.0% 1130.9% 2.7% -5.1% -18.4% | 70% | 63% | -104 2% -276.9% -258.0% 1130.9% 2.7% -5.1% -18.4% | -104 2% -276.9% -258.0% 1130.9% 2.7% -5.1% -18.4% |
| 56.0% | 74.5% 48.8% | 572.7% NM | 530.8% -1569.9% 77.7% | 495.5% 176.9% 348.1% | 407.4% 277.2% | 486.2% 346.1% | 232.7% 205.0% | 160.1% 124.3% | 125.0% | -96% 5% | 144% 233% | 153% | 80% | 69% | |||
| 1026.8% | 281.9% 83.2% | -357.5% | 98.9% | 223.2% 508.5% | 295.9% | 442.5% | 258.6% | 132.1% | 1883 | 3% | 3164% 292% | 173% | 86% | 72% |
Source: Company data, Goldman Sachs Global Investment Research
Kinsus
We are Buy rated with a new 12-month TP of NT$1,120 (from NT$555), based on the same 16.5x P/E on 2028E EPS (rolled over from 2027E). We believe the company could trade at 1.2x STDV above the average PE multiple during previous upcycle of 14.2x as we expect the company's pro fi tability to continue improving driven by increasing AI exposure and better ABF substrate pricing conditions, and factor in our latest earnings revisions.
Exhibit 30: Kinsus P&L table
Source: Company data, Goldman Sachs Global Investment Research
Unimicron
We are Neutral rated with a new 12-month TP of NT$1,140 (from NT$630), based on the same 17.4x P/E on 2028E EPS (rolled over from 2027E). We believe the company could trade at 2.7x STDV higher than past upcycle average P/E of 10.3x, and factor in our latest earnings revisions.
63.0%
18.1%
41.0%
12.4%
3.01
c45a43530f604d12bcb9a82b5aa6b9f6
NTSmn
NTSmn
Revenue
Revenue
Gross profit
Gross profit
Operating expense
Operating income
Operating expense
Pretax income
Operating income
Pretax income
Taxes expense
Taxes expense
Net income
4Q25
56.870
12,830|
(6,909)
5,921
3Q25
47.366
10.410
(5,880)
4,530
1Q25
(4,829)
1,056
1,457
5,673
2025
2Q25
(4,586)
2,425
2,272
4,661
Exhibit 31: Unimicron P&L table
Net income
EPS, NTS
EPS, NTS
Ratio analysis and assumption
As % of sales
Ratio analysis and assumption
As % of sales
Gross margin
Operating expense ratio
Gross margin
Operating expense ratio
Operating margin
Net margin
Operating margin
Net margin
QoQ growth (%)
QoQ growth (%)
Revenue
2024
171,664
32,461
(20,875)
11,586
15,045
(1,948)
9.180
2025
182,522
36,136
(22,205)
13,932
14,063
(3,458)
6,791
2026E
224,680
53,140
(27,258)
25,882
27,378
(4,182)
16,363
2027E
327,764
85,019
(31,813)
53,206
55,806
(8,736)
33,322
2029E
2029E
583,347
602,605
(39,941)
(57,767)
139,326
206,613
206,613
140,626
(43,676)
(22,308)
162.368
106.66
33%
48%
55%
54%
2028E
454,047
133,376
(43,392)
89,985
91,285
(14,310)
54.498
83,856
1Q27E
64,038
13,929
(6,480)
7,449
8,249
(1,402)
4,908
2027E
70,652
16,830
(7,542)
9,288
9,988
(1,698)
5,873
3Q27E
89,912
25,231
(8,714)
16,517
16,617
(2,493)
9,970
3Q26E
63.831
15,637
(7,149)
8,488
8,988
(1,348)
5,393
4Q26E
71.690
18.261
(7,384)
10,877
11,877
(1,782)
7,126
2Q26E
48.431
10,430
(6,417)
4,013
4,113
(699)
2,418
| 0.66 | 2.46 | 3.16 | 2.26 | 5.03 | 6.65 | 4.58 5.48 | 9.30 | 9.67 | 6.91 15.27 | 31.09 | 50.84 | 78.23 | ||||
|---|---|---|---|---|---|---|---|---|---|---|---|---|---|---|---|---|
| 13.4% | 13.1% | 21.7% | 27.3% | 32.2% | 34.3% | 13.9% 23.5% | 33.9% | 39.3% | 42.3% | |||||||
| 9.2% 14.7% | 8.4% 13.4% 22.0% | 15.8% 9.0% 22.6% | 8.3% 21.5% | 24.5% | 7.7% 25.5% | 21.8% 23.8% | 7.3% 37.3% 7.3% 28.1% | 28.1% | 18.9% | 8.9% 19.8% | 8.5% 23.7% | 25.9% | 7.3% 29.4% | 6.8% 32.7% | ||
| 12.0% | 4.6% 8.9% 12.4% | 12.1% | 13.3% | 11.2% | 10.3% | 7.3% 24.9% 10.1% 10.7% | 26.9% 30.0% 9.7% | 8.8% | 12.2% | 12.2% | 12.1% | 7.3% 9.7% | 9.6% | 35.4% 9.6% | ||
| 4.2% 3.0% 2.6% 1.6% | 0.1% 4.5% 6.5% 9.6% | 6.8% 10.2% 10.4% | 13.4% 12.4% 8.3% | 13.3% | 19.6% 15.3% 15.2% | 11.6% | 19.0% 13.1% | 23.8% 18.4% | 19.3% | 6.7% | 5.1% 5.1% 15.1% 13.5% 7.6% | 26.5% 20.5% 11.5% | 31.9% 24.2% 16.2% | 27.8% 19.8% 23.1% | ||
| 5.0% | 5.6% | 5.0% | 8.4% | 9.9% | 7.7% 8.3% | 20.4% 11.1% | 12.2% | 5.3% | 3.7% | 7.3% | 10.2% | 12.0% | 13.9% | |||
| 2.4% | 7.9% 4.7% | 7.9% | 14.6% | 15.7% | 75.8% | 11.1% 10.3% | 17.8% 13.6% 27.3% |
Gross profit
Revenue
Gross profit
Operating income
Operating income
Net income
YoY growth (%)
Net income
YoY growth (%)
Revenue
Gross profit
Revenue
Gross profit
Operating income
Operating income
Net income
Net income
2.4%
18.5%
-28.6%
-48.7%
-81.0%
86.5%
1531.2%
-85.5%
14.0%
-6.2%
23.3%
10.3%
42.2%
-19.7%
-62.4%
20.1%
23.2%
30.7%
32.2%
1.3%
11.9%
6.6%
-27.5%
43501
-28.4%
7.9%
22.9%
16.5%
-31.3%
-57.7%
-54.9%
42.7%
24.4%
67.1%
1.6%
49.7%
137.1%
117.6%
451.4%
125.4%
15.7%
27.6%
12.3%
16.8%
28.1%
34.5%
42.7%
32.1%
67.2%
189.9%
26.1%
42.3%
83.7%
381.9%
151.3%
125.4%
RE0E35009
31.8%
49.9%
111.5%
123.0%
47.5%
173.4%
34.8%
50.2%
87.4%
452.9%
183.7%
125.5%
24.0%
4.7%
7.1%
-4.7%
7.9%
5.5%
19.1%
1.5%
19.1%
129.6%
-4.3%
48.5%
86.8%
295.3%
7312.1%
-96.8%
16.5%
15.3%
17.9%
65.1%
-476.8%
68.3%
-98.1%
-6.4%
7.2%
-8.0%
-21.9%
-8.7%
-23.6%
-28.7%
-35.3%
18.9%
14.6%
38.4%
108.3%
18.4%
60.3%
69.6%
5.9%
32.2%
119.2%
26.8%
48.8%
65.5%
280 5%
N/A
299.7%
24.5%
120.1%
Source: Company data, Goldman Sachs Global Investment Research
ZDT
We are Buy rated with a new 12-month TP NT$824 (from NT$388), still based on our SOTP based valuation methodology of (1) 3.5x blended P/B (was 3.0x blended P/B) for ABF & BT substrate, which is 1 STDV above early upcycle industry average, (2) 20x P/E for high-growth AI server/switch related PCB (in line with industry average), and (3) 8x P/E for low-growth consumer electronics PCB (in-line with industry downcycle average valuation), and roll over our valuation period from 4Q26-3Q27 to 2028E, and factor in our latest earnings revision.
75.8%
234.4%
-10.7%
-23.7%
-31.5%
481.6%
202.9%
-31.1%
102.7%
354.5%
57.2%
11.1%
19.2%
10.3%
20.8%
24.7%
22.6%
20.1%
19.7%
108.7%
413.9%
45.9%
58.1%
197.6%
986.1%
1070.8%
1017.3%
244.3%
17.8%
25.3%
27.3%
49.9%
77.8%
27.4%
26.4%
69.8%
134.7%
501.0%
40.9%
61.4%
13.6%
23.7%
14.7%
15.1%
20.8%
26.4%
32.9%
26.1%
161.3%
518.0%
1048.5%
1302.5%
N/A
61.4%
131.5%
94.6%
142.8%
84.9%
640.5% 510.8%
885133
23%
47%
86%
141%
Exhibit 32: ZDT P&L table
Source: Company data, Goldman Sachs Global Investment Research
13%
18%
26%
48%
6%
11%
20%
-26%
46%
60%
106%
104%
39%
57%
69%
64%
c45a43530f604d12bcb9a82b5aa6b9f6
Investment thesis, PT methodology and risks
Investment Thesis - NYPCB
NYPCB manufactures and markets printed circuit boards (PCBs) and integrated circuit (IC) substrates (including ABF and BT substrates). We are Buy-rated on NYPCB considering the company's high exposure to BT substrates and non-LTA ABF substrate (70%+ of total revenue), where we expect GM/OPM to increase signi fi cantly in the coming quarters (from breakeven in OPM in 1H25 to 27/41% in 2026/27E) due to the favorable substrate pricing outlook. Despite the company's low exposure to high-end ABF substrate industry (<20% of total revenue in 1H25), we believe the expanding demand from ASIC AI server and high-end switch IC demand will drive the company's high-end ABF revenue exposure to 40%+ by 2027E, suggesting better GM/OPM outlook in the long term. In 2H25-2H26, we believe NYPCB will continue to bene fi t from stronger ABF/BT pricing and should be a key bene fi ciary of the pricing uptrend considering the company's key focus on BT and non-LTA ABF substrate industries. Moreover, in the long term (after 2026), we expect the ABF industry to return to supply tightness, and NYPCB's expanding high-end exposure will lead to a long term earnings growth outlook (122% 2026-28E earnings CAGR). As a result, we see solid upside potential for NYPCB's earnings and stock performance.
Price Target Risks and Methodology - NYPCB
Valuation methodology: Our 12-month target price of NT$2,310 for NYPCB is based on 21x 2028 P/E, which is +1.5x STDV higher than the past upcycle average P/E (13.3x).
Key downside risks: (1) Slower-than-expected PC demand recovery, (2) Slower-than-expected ABF substrates pricing upgrading outlook, and (3) Slower-than-expected NYPCB new high-end capacity quali fi cation progress.
Investment Thesis - Kinsus
Kinsus is one of the key IC substrates suppliers globally with ~10% ABF/BT substrates market share in 2024, with ~18% of total 2025 revenue contributed by its contact lens subsidiary, Pegavision (6941.TW, Not Covered). With our view that the ABF substrate shortage started from 2Q26 (ABF substrate return to supply demand balance from late 2025), we believe Kinsus' performance will continue to improve compared with high-end ABF peers considering the company's increasing market share in the high-end ABF substrate market; however, ~36% of the company's revenue was contributed by BT substrates in 2025 and 30% of the company's ABF revenue is from non-LTA customers, which we believe will continue to enjoy a better pricing outlook. As a result, we believe Kinsus' earnings outlook should continue to be strong (~125% 2026-28E CAGR), mainly driven by better BT substrate and non-LTA ABF substrate pricing outlook, despite the unfavorable demand outlook before 2H26. We believe Kinsus is an experienced substrate supplier with a clear capacity expansion plan that can also upgrade its product portfolio in the long term. We believe we are at the beginning of an industry upcycle, making us positive on Kinsus' stock performance over the next 12 months.
Price Target Risks and Methodology - Kinsus
Valuation methodology: Our 12-month target price of NT$1,120 for Kinsus is based on c45a43530f604d12bcb9a82b5aa6b9f6
16.5x 2028E P/E, which is +1.2x STDV higher than Kinsus' past upcycle average P/E (14.2x).
Key downside risks: (1) Slower-than-expected PC demand recovery, (2) Slower-than-expected ABF substrates pricing upgrading outlook, (3) Slower/Less-than-expected AI server orders from 2H26.
Investment Thesis - Unimicron Technology
Unimicron is a key supplier of ABF substrates (25% market share in 2025) and BT substrates and also produces FPC/HDI/PCB products. We are Neutral rated on the shares given long-term growth opportunity prospects: (1) over 70% of ABF shipments are covered by long-term agreements (LTA), which limits pricing fl exibility and makes price hike less likely; (2) the company's execution track record has been weaker than peers; (3) capacity expansion plan remains slower than peers, constraining its ability to capture incremental AI demand. The current ABF substrates market is seeing more favorable supply demand outlook, and Unimicron is likely to see better pricing outlook to re fl ect rising material costs in the coming quarters. AI ABF account for 10% of the company's total revenue, but the growth is likely to be slower than peers due to the company continuing to lose market share to peers given its less favourable production yield and slow capacity expansion. Overall, we are Neutral rated on Unimicron given our outlook for the limited upside potential, barring ASIC AI servers, despite our generally positive view on the long term on pro fi tability trajectory.
Price Target Risks and Methodology - Unimicron Technology
Valuation methodology: Our 12-month target price of NT$1,140 for Unimicron is based on 17.4x 2028E P/E, which is 2.7x STDV higher than the past upcycle average P/E (10.3x).
Key upside/downside risks: (1) Slower/faster-than-expected PC demand recovery, (2) Slower/faster-than-expected ABF substrates upgrading pace, and (3) Slower/faster than-expected AI server PCB market share loss progress.
Zhen Ding Technology (ZDT) is the global leading PCB supplier (top 1 in market share in sales) with 7-10% market share, and started its ABF substrate business from 2023 in Shenzhen, China, and has the highest ABF revenue exposure to the China market compared to all other ABF substrate suppliers. We believe ZDT will hold more than 40% ABF substrate market share in China by 2027E (up from 31% in 2024) and bene fi t the most from the strong and growing China ABF substrate market (53% 2025E-27E CAGR) due to the increasing in-sourcing ratio for the AI computing ASIC/GPU market in China. We also expect the increasing foldable smartphone penetration rate in the long term to drive ZDT's FPC TAM, and account for 50% of the company's total revenue in 2027E. We see further revenue upside potential from foldable phones. We are Buy rated mainly due to our positive view on the company's China ABF substrate business opportunity, which should not only drive ZDT's revenue growth, but also improve its OPM level in the long term. We see upside for the stock price considering the company's solid growth opportunity, and our TP implied P/E multiple is still lower than the company's past 10+ year P/E average, which we believe is fair considering the potential upside from China ABF substrate market and increasing foldable phone penetration rate.
Valuation : Our 12-month TP of NT$824 is based on a SOTP valuation methodology, c45a43530f604d12bcb9a82b5aa6b9f6
including (1) 3.5x blended 2028E P/B for ABF & BT substrate, (2) 20x 2028E P/E for high-growth AI server/switch related PCB (in line with industry average), and (3) 8x 2028E P/E for low-growth consumer electronics PCB (in-line with industry downcycle average valuation).
Key downside risks include : (1) weaker-than-expected iPhone demand or slower content upgrade, (2) delay in new substrate capacity or slower-than-expected yield rate ramp up progress, and (3) fi ercer competition in China ABF market.
c45a43530f604d12bcb9a82b5aa6b9f6