PDF 原檔:報告_ChipScaleReview_Winter2026期刊_20260122_original.pdf
圖片清單(已驗證 2026-09-29)
131 張全數以縮圖拼版逐張目視;<40KB 未列者為 logo(002 LEENO、006 EVG、009 ASE、026 PacTech、048 TSE、049/051 TSE 廣告、118 ECTC、127/131 廣告)。lib 嵌圖只挑「真資料圖」。
| 檔名 | size | 分類 | 親眼所見內容 |
|---|---|---|---|
報告_ChipScaleReview_Winter2026期刊_20260122_001.png |
549KB | 裝飾·logo·banner | 封面插圖 |
報告_ChipScaleReview_Winter2026期刊_20260122_003.png |
303KB | 裝飾·logo·banner | LEENO 探針/probe head 廣告 |
報告_ChipScaleReview_Winter2026期刊_20260122_004.png |
299KB | 裝飾·logo·banner | LEENO socket 量測曲線廣告 |
報告_ChipScaleReview_Winter2026期刊_20260122_005.png |
344KB | 裝飾·logo·banner | 目錄頁插圖 |
報告_ChipScaleReview_Winter2026期刊_20260122_007.png |
479KB | 裝飾·logo·banner | EVG 混合鍵合設備廣告 |
報告_ChipScaleReview_Winter2026期刊_20260122_008.png |
363KB | 裝飾·logo·banner | 目錄頁無塵室照片 |
報告_ChipScaleReview_Winter2026期刊_20260122_010.png |
194KB | 裝飾·logo·banner | ASE VIPack/FOCoS/FOPoP 廣告圖 |
報告_ChipScaleReview_Winter2026期刊_20260122_011.png |
608KB | 裝飾·logo·banner | ASE 廣告插圖 |
報告_ChipScaleReview_Winter2026期刊_20260122_012.png |
150KB | 真資料圖 | Si-IF 上無焊料 Cu-Cu TCB 截面:10µm Cu pillar pitch,上為 dielet、下為 Si-IF 基板,標出 Cu pad/Cu pillar/Ti-Cu seed layer 與 bonding interface(ion-milled) |
報告_ChipScaleReview_Winter2026期刊_20260122_013.png |
30KB | 真資料圖 | 混合鍵合介面截面 SEM:Cu pad、via、metal line、oxide 與 bonding interface,比例尺 5µm(30KB,小但為真資料) |
報告_ChipScaleReview_Winter2026期刊_20260122_015.png |
79KB | 真資料圖 | JESD22-A101D 85°C/85%RH 500 小時濕度測試:未鈍化樣品 daisy chain 電阻均值約 37Ω 且誤差極大,Al2O3 鈍化樣品(LT/HT 退火)維持約 4–5Ω |
報告_ChipScaleReview_Winter2026期刊_20260122_016.png |
55KB | 真資料圖 | TCT 110 cycles 後剪力強度長條圖:測前約 100N、未鈍化約 90N、10nm Al2O3 鈍化約 100N |
報告_ChipScaleReview_Winter2026期刊_20260122_017.png |
755KB | 裝飾·logo·banner | Nordson SQ7000+ 設備廣告 |
報告_ChipScaleReview_Winter2026期刊_20260122_018.png |
44KB | 真資料圖 | 處理器封裝兩型截面示意:a) lidless、b) lidded,標 I lid/II TIM/III die/IV underfill/V stiffener/VI substrate/VII BGA |
報告_ChipScaleReview_Winter2026期刊_20260122_019.png |
75KB | 真資料圖 | CSAM 原理示意:a) 聲波遇 TIM 空洞(air)全反射、b) 各材料介面部分反射 |
報告_ChipScaleReview_Winter2026期刊_20260122_020.png |
73KB | 真資料圖 | a) SEM 截面:Si die 與 Cu lid 間的 In TIM 出現大空洞;b) 同樣品 TIM CSAM 平面影像並標截面位置 |
報告_ChipScaleReview_Winter2026期刊_20260122_021.png |
363KB | 真資料圖 | 機械研磨拋光後 In TIM 截面 SEM:大量研磨碎屑嵌入 In TIM(上 Cu lid、下 Si die) |
報告_ChipScaleReview_Winter2026期刊_20260122_022.png |
104KB | 真資料圖 | 離子研磨原理示意:Ar+ ion gun 去除表層非晶層,得到可做 TEM/EBSD/SEM 的乾淨截面 |
報告_ChipScaleReview_Winter2026期刊_20260122_023.png |
159KB | 真資料圖 | 離子研磨截面比較:a) 無冷卻台出現熱損傷與 curtaining、b) 有冷卻台表面平整(Lid/TIM 交界) |
報告_ChipScaleReview_Winter2026期刊_20260122_024.png |
59KB | 真資料圖 | TCJ3000 後 acoustic through-scan 影像:暗區為 TIM 異常,紅框為 FIB 位置 |
報告_ChipScaleReview_Winter2026期刊_20260122_025.png |
86KB | 真資料圖 | FIB 截面:Lid 與 Metal TIM 間的 TIM crack 與 void,下方為 MC |
報告_ChipScaleReview_Winter2026期刊_20260122_027.png |
74KB | 真資料圖 | TCJ3000 樣品三種聲學影像:CSAM LID-TIM、CSAM TIM-DIE、TSAM through-scan |
報告_ChipScaleReview_Winter2026期刊_20260122_028.png |
128KB | 真資料圖 | CSAM TIM-DIE 與 TSAM through-scan 局部(CCD6/CCD7 區),黃線為截面方向 |
報告_ChipScaleReview_Winter2026期刊_20260122_029.png |
272KB | 真資料圖 | 機械研磨+拋光後光學影像:Cu lid/In TIM/Si die,TIM 內可見 cracks 與嵌入碎屑(黃箭頭) |
報告_ChipScaleReview_Winter2026期刊_20260122_030.png |
318KB | 真資料圖 | 改用上蠟 SiC 砂紙研磨後的全長光學影像,a) 明場 b) 暗場,紅箭頭標 TIM cracks |
報告_ChipScaleReview_Winter2026期刊_20260122_031.png |
139KB | 真資料圖 | 上蠟 SiC 砂紙研磨後 SEM:In TIM cracks 清楚,右圖標 Cu smearing |
報告_ChipScaleReview_Winter2026期刊_20260122_032.png |
75KB | 真資料圖 | CSAM 局部影像標機械研磨位置與方向 |
報告_ChipScaleReview_Winter2026期刊_20260122_033.png |
133KB | 真資料圖 | Sample A 的 CSAM TIM-DIE 與 TSAM 影像,標 ion-milling 方向 |
報告_ChipScaleReview_Winter2026期刊_20260122_034.png |
143KB | 真資料圖 | 離子研磨後截面:a) 光學、b) SEM,LID/TIM/DIE,標 large TIM cracks/voids(CCD0) |
報告_ChipScaleReview_Winter2026期刊_20260122_035.png |
41KB | 真資料圖 | 表格:TCJ3000 案例機械研磨 vs 離子研磨(2 天 vs 5 天、>50mm vs 4.8mm、表面差 vs 佳)(表格影像) |
報告_ChipScaleReview_Winter2026期刊_20260122_036.png |
58KB | 裝飾·logo·banner | WinWay(穎崴)socket 產品照廣告 |
報告_ChipScaleReview_Winter2026期刊_20260122_037.png |
129KB | 真資料圖 | VCL 樣品一般 X-ray 影像:多層結構重疊 |
報告_ChipScaleReview_Winter2026期刊_20260122_038.png |
56KB | 真資料圖 | 同 VCL 樣品 X-ray laminography:只取 TIM 平面,可見兩塊 die 區域內的空洞 |
報告_ChipScaleReview_Winter2026期刊_20260122_039.png |
200KB | 真資料圖 | VCL(vapor chamber lid)示意:a) 封裝截面 Wick/Vapor space/TIM/Chip,b) 蒸發—冷凝—液體回流工作原理 |
報告_ChipScaleReview_Winter2026期刊_20260122_040.png |
55KB | 真資料圖 | X-ray laminography 架構示意:X-ray source、傾斜 detector、樣品繞軸旋轉 |
報告_ChipScaleReview_Winter2026期刊_20260122_041.png |
134KB | 真資料圖 | VCL 樣品機械研磨截面 SEM:VCL/In TIM(含碎屑)/Si die,綠線為 BLT 量測 |
報告_ChipScaleReview_Winter2026期刊_20260122_042.png |
50KB | 真資料圖 | VCL 樣品離子研磨截面 SEM:In TIM 表面乾淨無碎屑,未見分層 |
報告_ChipScaleReview_Winter2026期刊_20260122_043.png |
193KB | 真資料圖 | power cycling 樣品 CSAM:紅色為 TIM-die 介面 TIM 未接觸區,黃線為截面位置 |
報告_ChipScaleReview_Winter2026期刊_20260122_044.png |
234KB | 真資料圖 | 離子研磨截面 SEM+EDX:Si die 背面 BSM 疊層與 Ni-Au lid plating 元素分布與厚度 |
報告_ChipScaleReview_Winter2026期刊_20260122_045.png |
141KB | 真資料圖 | TIM 截面製樣 BKM 流程圖:NDT → 模封切割 → 依需求走上蠟 SiC 研磨或 trimming+離子研磨 |
報告_ChipScaleReview_Winter2026期刊_20260122_047.png |
246KB | 裝飾·logo·banner | Micro Control 車用廣告插圖 |
報告_ChipScaleReview_Winter2026期刊_20260122_050.png |
337KB | 裝飾·logo·banner | TSE ELTUNE-air 廣告 |
報告_ChipScaleReview_Winter2026期刊_20260122_052.png |
79KB | 裝飾·logo·banner | TSE 廣告內截面放大影像 |
報告_ChipScaleReview_Winter2026期刊_20260122_053.png |
100KB | 裝飾·logo·banner | TSE 廣告局部 |
報告_ChipScaleReview_Winter2026期刊_20260122_054.png |
42KB | 裝飾·logo·banner | TSE 回損曲線廣告 |
報告_ChipScaleReview_Winter2026期刊_20260122_055.png |
35KB | 真資料圖 | 雙 die 封裝應力預測模型:Die A/Die B 各 0.5mm、間距 0.2mm,EMC 包覆,probe 位於 die 角(35KB) |
報告_ChipScaleReview_Winter2026期刊_20260122_056.png |
112KB | 真資料圖 | 3D 曲面:Sz 應力隨 EMC CTE 與 EMC modulus 變化,呈不對稱馬鞍形 |
報告_ChipScaleReview_Winter2026期刊_20260122_057.png |
372KB | 真資料圖 | 表格影像:100 組訓練資料(EMC modulus vs Sz) |
報告_ChipScaleReview_Winter2026期刊_20260122_058.png |
6KB | 文字卡 | 公式 Eq.1 抽取失敗(黑塊) |
報告_ChipScaleReview_Winter2026期刊_20260122_059.png |
114KB | 真資料圖 | Sz vs EMC modulus:FEA 點與 ANN/SVR/KNN 擬合曲線,SVR 無法擬合低模數段的陡降 |
報告_ChipScaleReview_Winter2026期刊_20260122_060.png |
93KB | 真資料圖 | 表格影像:邊界條件二進位取樣表(BC 1–32) |
報告_ChipScaleReview_Winter2026期刊_20260122_061.png |
24KB | 真資料圖 | AI 模型誤差比較長條圖:ANN MAE 4.2/max 14.5、SVR 23.9/127.6、KNN 2.6/17.2 MPa(24KB) |
報告_ChipScaleReview_Winter2026期刊_20260122_062.png |
31KB | 真資料圖 | polynomial deep regression 訓練誤差收斂曲線(約 5k iterations 收斂,有尖峰)(31KB) |
報告_ChipScaleReview_Winter2026期刊_20260122_063.png |
405KB | 真資料圖 | 表格影像:雙參數(EMC modulus、CTE)四輸出 FEA 與 AI 預測比較 |
報告_ChipScaleReview_Winter2026期刊_20260122_064.png |
195KB | 真資料圖 | 四張子圖:Sz/Sx/S1/Svon 對 EMC modulus 的 AI 預測 vs FEA(不同 CTE 曲線) |
報告_ChipScaleReview_Winter2026期刊_20260122_065.png |
42KB | 真資料圖 | full DOE 625 cases vs SST 344 cases:最大絕對誤差 14MPa vs 15MPa |
報告_ChipScaleReview_Winter2026期刊_20260122_066.png |
330KB | 裝飾·logo·banner | Test Tooling Solutions socket 廣告照 |
報告_ChipScaleReview_Winter2026期刊_20260122_067.png |
128KB | 真資料圖 | 資料中心 CPO 示意:switch ASIC 四周 16 個 OE,OE 內含 Driver/Laser(TOSA)與 TIA/PD(ROSA) |
報告_ChipScaleReview_Winter2026期刊_20260122_068.png |
200KB | 真資料圖 | CPO 三種形態:基本 chiplet(photonic devices)、進階 chiplet(矽光子)、holy grail 全整合矽光子晶片 |
報告_ChipScaleReview_Winter2026期刊_20260122_069.png |
139KB | 真資料圖 | Pluggable/OBO/NPO/CPO 四種架構截面與俯視對照,右欄文字說明距離與功耗差異 |
報告_ChipScaleReview_Winter2026期刊_20260122_070.png |
57KB | 真資料圖 | 長條圖:400G/800G/1.6T 下 pluggable vs CPO 功耗,1.6T 標 >50% power saving |
報告_ChipScaleReview_Winter2026期刊_20260122_071.png |
114KB | 真資料圖 | CPO 於 organic interposer(2.3D IC integration)截面與俯視:ASIC switch、EIC、PIC、FAU、fiber coupler(US 11,860,428) |
報告_ChipScaleReview_Winter2026期刊_20260122_072.png |
246KB | 真資料圖 | a–l 共 12 種 PIC/EIC 3D 堆疊方式:μbump、TSV、Cu-Cu 混合鍵合、TSV/organic/TGV interposer、PoP |
報告_ChipScaleReview_Winter2026期刊_20260122_073.png |
123KB | 真資料圖 | US 12,412,879 專利圖:EIC 與 PIC 透過 organic interposer 堆疊,與 ASIC switch 並排於 build-up 載板 |
報告_ChipScaleReview_Winter2026期刊_20260122_074.png |
544KB | 裝飾·logo·banner | FINECS Copper Pillar Pin 廣告 |
報告_ChipScaleReview_Winter2026期刊_20260122_075.png |
71KB | 真資料圖 | CPO 基板三選項:a) organic-core build-up、b) glass-core build-up、c) TSV/TGV/organic interposer+build-up |
報告_ChipScaleReview_Winter2026期刊_20260122_076.png |
84KB | 真資料圖 | a) Si bridge 埋入 fan-out EMC 連接 ASIC 與 PIC(含 TMV);b) 類似專利結構 |
報告_ChipScaleReview_Winter2026期刊_20260122_077.png |
91KB | 真資料圖 | 表格圖:三種 CPO 橋接結構(EMIB 埋入、Si bridge μbump、Si bridge 混合鍵合)的優缺點 |
報告_ChipScaleReview_Winter2026期刊_20260122_078.png |
44KB | 真資料圖 | CPO 於 fan-out RDL 基板:51.2T switch 四周 3.2T OE,PIC/EIC 以 Cu-Cu 混合鍵合 |
報告_ChipScaleReview_Winter2026期刊_20260122_079.png |
77KB | 真資料圖 | fan-out RDL 基板開孔+PCB 內埋 polymer waveguide(兩端 45° 鏡面)導光至 PIC |
報告_ChipScaleReview_Winter2026期刊_20260122_080.png |
85KB | 真資料圖 | organic interposer 開孔並內埋 polymer waveguide 的 CPO 結構 |
報告_ChipScaleReview_Winter2026期刊_20260122_081.png |
74KB | 真資料圖 | EIC/PIC 經 TGV glass interposer 以 Cu-Cu 堆疊,glass waveguide 接光纖 |
報告_ChipScaleReview_Winter2026期刊_20260122_082.png |
65KB | 真資料圖 | PIC 半埋入 CPO glass substrate 凹槽、與 EIC 混合鍵合,glass waveguide |
報告_ChipScaleReview_Winter2026期刊_20260122_083.png |
168KB | 真資料圖 | GPU+HBM 與 ASIC switch 各自四周圍 OE、以光纖互連的 AI 系統 CPO 構想 |
報告_ChipScaleReview_Winter2026期刊_20260122_084.png |
324KB | 裝飾·logo·banner | Technic 鍍金液廣告 |
報告_ChipScaleReview_Winter2026期刊_20260122_085.png |
411KB | 裝飾·logo·banner | Sonix 廣告 |
報告_ChipScaleReview_Winter2026期刊_20260122_086.png |
336KB | 裝飾·logo·banner | Ironwood Electronics 廣告 |
報告_ChipScaleReview_Winter2026期刊_20260122_087.png |
54KB | 真資料圖 | TMR 感測器原理:外加磁場旋轉時電阻呈正弦變化(free/reference layer 與 tunnel barrier) |
報告_ChipScaleReview_Winter2026期刊_20260122_088.png |
51KB | 真資料圖 | Hprobe 3D 磁場產生器配置:Hz vs Hx,y 強度範圍,以及場強 vs 均勻區域取捨曲線 |
報告_ChipScaleReview_Winter2026期刊_20260122_089.png |
115KB | 裝飾·logo·banner | ISC socket 廣告照 |
報告_ChipScaleReview_Winter2026期刊_20260122_090.png |
353KB | 裝飾·logo·banner | ISC 產品線廣告 |
報告_ChipScaleReview_Winter2026期刊_20260122_091.png |
53KB | 真資料圖 | WFPI 原理:波前相位經反射(表面 s(x,y))或穿透(厚度 t(x,y))而改變 |
報告_ChipScaleReview_Winter2026期刊_20260122_092.png |
85KB | 真資料圖 | WFPI 光路:590nm LED、準直光、beam splitter、兩張離焦影像 ±Δz |
報告_ChipScaleReview_Winter2026期刊_20260122_093.png |
225KB | 真資料圖 | WFPI 量測結果:a) 200mm BCD patterned wafer、b) 300mm bare Si wafer 的 2D/3D 形貌 |
報告_ChipScaleReview_Winter2026期刊_20260122_094.png |
59KB | 真資料圖 | feed-forward 流程示意:Shape metrology → Bonding → Shape metrology → Lithography → Overlay metrology |
報告_ChipScaleReview_Winter2026期刊_20260122_095.png |
272KB | 真資料圖 | D2W 鍵合後 die bond shape 2D 高度圖與 3D 曲面(高解析 WFPI) |
報告_ChipScaleReview_Winter2026期刊_20260122_096.png |
547KB | 裝飾·logo·banner | TestConX 2026 活動廣告 |
報告_ChipScaleReview_Winter2026期刊_20260122_097.png |
97KB | 真資料圖 | clip-bond 封裝截面示意:Encapsulation、Clip interconnect、Silicon die、Die paddle、clip/die attach solder |
報告_ChipScaleReview_Winter2026期刊_20260122_098.png |
22KB | 真資料圖 | clip-bond MOSFET 熱模擬模型:Clip、Si chip、Drain tab,Tc=25°C(22KB) |
報告_ChipScaleReview_Winter2026期刊_20260122_099.png |
8KB | 真資料圖 | die-attach 空洞模擬圖樣:a) 10% 單一大空洞 b) 10% 多個小空洞(8KB) |
報告_ChipScaleReview_Winter2026期刊_20260122_100.png |
339KB | 裝飾·logo·banner | Brewer Science 暫時鍵合廣告 |
報告_ChipScaleReview_Winter2026期刊_20260122_101.png |
217KB | 真資料圖 | Sample A–D 截面:die-attach 單一空洞約 5%/20%/40%/60% |
報告_ChipScaleReview_Winter2026期刊_20260122_102.png |
788KB | 裝飾·logo·banner | JC Cherry 功率元件 socket 廣告 |
報告_ChipScaleReview_Winter2026期刊_20260122_103.png |
58KB | 真資料圖 | 模擬:Rth(J-C) vs 空洞比例,單一空洞在 5% 組裝標準線後明顯上升(20% 約 0.3),多小空洞約 0.2 °C/W |
報告_ChipScaleReview_Winter2026期刊_20260122_104.png |
44KB | 真資料圖 | 模擬:矽溫升 vs 空洞比例,20% 時多小空洞 1.85%、單一大空洞 9% |
報告_ChipScaleReview_Winter2026期刊_20260122_105.png |
114KB | 真資料圖 | 晶片表面溫度分布:10% 多小空洞 vs 10% 單一空洞(中心熱點,max 36.142) |
報告_ChipScaleReview_Winter2026期刊_20260122_106.png |
56KB | 真資料圖 | 熱流路徑示意:大空洞迫使熱橫向繞行 vs 多小空洞 |
報告_ChipScaleReview_Winter2026期刊_20260122_107.png |
285KB | 真資料圖 | 實測:a) 不同空洞比例的 Zth 曲線、b) Rth vs void ratio 指數上升至 60% 約 1.4 °C/W |
報告_ChipScaleReview_Winter2026期刊_20260122_111.png |
65KB | 真資料圖 | Adeia 測試載具:CSAM 無空洞鍵合,截面顯示 hybrid bond 與 2 層 organic dielectric RDL(die-to-substrate) |
報告_ChipScaleReview_Winter2026期刊_20260122_112.png |
103KB | 真資料圖 | 表格:Solder bump/Cu pillar/μbump/Hybrid bond 的 bump pitch、高度、直徑、缺陷敏感度、overlay、量測精度(HB <10µm pitch、overlay 0.05–0.25µm、量測 0.001µm) |
報告_ChipScaleReview_Winter2026期刊_20260122_113.png |
305KB | 真資料圖 | Toray 簡報:3D-IC 堆疊背景、無機 SiO2 混合鍵合問題(>350°C 退火、微粒敏感、翹曲),解法為 polymer hybrid bonding(<250°C) |
報告_ChipScaleReview_Winter2026期刊_20260122_114.png |
82KB | 真資料圖 | 混合鍵合最小 pitch 演進(log scale):D2W 與 W2W 兩條線,CIS→NAND→Logic,標 Sony 2015、YMTC 2017、AMD 2022、Samsung |
報告_ChipScaleReview_Winter2026期刊_20260122_115.png |
93KB | 真資料圖 | AMD 圖:線性互連密度 vs 連結能力,DDR memory/HBM/On-die cache,2D MCM、2.5D Si INT/EFB、3D Chiplets |
報告_ChipScaleReview_Winter2026期刊_20260122_116.png |
255KB | 裝飾·logo·banner | DL Technology 點膠廣告 |
報告_ChipScaleReview_Winter2026期刊_20260122_117.png |
363KB | 裝飾·logo·banner | Plasma Etch 廣告 |
報告_ChipScaleReview_Winter2026期刊_20260122_125.png |
554KB | 裝飾·logo·banner | SWTest 2026 活動廣告 |
報告_ChipScaleReview_Winter2026期刊_20260122_126.png |
79KB | 裝飾·logo·banner | LEENO probe head 廣告 |
報告_ChipScaleReview_Winter2026期刊_20260122_128.png |
69KB | 裝飾·logo·banner | LEENO 大尺寸 socket 廣告 |
報告_ChipScaleReview_Winter2026期刊_20260122_129.png |
78KB | 裝飾·logo·banner | LEENO socket 廣告 |
報告_ChipScaleReview_Winter2026期刊_20260122_130.png |
107KB | 裝飾·logo·banner | LEENO coaxial socket 廣告 |
原始內容
ChipScaleReview
ChipScaleReview.com
Volume 30, Number 1 Volume 30, Number 1
The Future of Semiconductor Packaging
Winter 2026
- Co-packaged optics: Heterogeneous integration of chiplets in switches, PICs, and EICs
- Evaluation of indium TIM cross-sectioning methods high-performance microprocessors
- Impact of die-attach voids on the thermal performance of clip-bonded packages
- m g gs es
- Usms sss d su s od ng.
- Wafer-level testing of TMR sensors using 3D magnetic field excitation
LEENO
www.leeno.com
Fine Pitch Probe & Probe Head
Proven Mass Production Capability
5G MP 100GHz Coaxial Socket
HEAD OFFICE
10 105beon-gil MieumSandan-ro Gangseo-gu, Busan Metropolitan City, Korea
CONTENTS
FEATURE ARTICLES
- 5 Heterogeneous wafer-scale integration: The new front line of semiconductor scaling
By Krutikesh Sahoo, Subramanian S. Iyer [Samueli School of Engineering, University of California, Los Angeles]
- 12 Evaluation of indium TIM cross-sectioning methods on lidded high-performance microprocessors
By Neo Shao Ming, Song Mei Hui, Kevin Tan Bo Lin, Lee Xi Wen, Oh Zi-Ying, Foo Fang-Jie [Advanced Micro Devices (Singapore) Pte Ltd]
26 Using polynomial regression for heterogeneous package stress modeling
By Kart Leong Lim, Ji Lin
[Institute of Microelectronics (IME), Agency for Science, Technology and Research (A*STAR)]
Volume 30, Number 1 Winter 2026
FUSION AND HYBRID BONDING FOR HETEROGENEOUS INTEGRATION
- Enabling advanced 3D device stacking and chiplet integration for CMOS image sensors, memory and 3D system-on-chip (SoC)
- High-volume production equipment and process technology for Wafer-to-Wafer (W2W) and Die-to-Wafer (D2W) hybrid bonding
- GEMINI® FB Automated Production Wafer Bonding System delivers industry leading alignment accuracy and bonding performance
- New, unique EVG40 D2W system provides 100% die overlay measurement with high precision and throughput for HVM
CONTENTS
The Future of Semiconductor Packaging
STAFF
Kim Newman
Publisher
knewman@chipscalereview.com
Lawrence Michaels
Managing Director Editor-in-Chief
lmichaels@chipscalereview.com
Debra Vogler
Senior Technical Editor
debravogler@me.com
SUBSCRIPTION-INQUIRIES
Chip Scale Review
All subscription changes, additions, deletions to any and all subscriptions should be made by email only to subs@chipscalereview.com
Advertising Production Inquiries:
Lawrence Michaels
lmichaels@chipscalereview.com
Copyright © 2026 Haley Publishing Inc. Chip Scale Review is a registered trademark of Haley Publishing Inc. All rights reserved.
Subscriptions in the U.S. are available without charge to qualified individuals in the electronics industry.
Chip Scale Review is published four times a year with issues in Winter, Spring, Summer and Fall.
P.O. Box 2165
Morgan Hill, CA 95038
E-Mail: info@chipscalereview.com
Printed in the United States
FEATURE ARTICLES (continued)
- 32 Co-packaged optics: Heterogeneous integration of chiplets in switches, PICs, and EICs
By John H. Lau [Unimicron Technology Corporation]
- 42 Wafer-level testing of TMR sensors using 3D magnetic field excitation
By Siamak Salimy [Hprobe]
- 46 Impact of wave front phase imaging on semiconductor metrology challenges
By Miguel Jimenez-Gomis, Marco Franchi [Wooptix]
- 50 Impact of die-attach voids on the thermal performance of clip-bonded packages
By Ilyas Dchar, Ding Yandoc [Nexperia]
DEPARTMENTS
INDUSTRY EVENTS
- 56 Summary of the ECTC 2025 special session on hybrid bonding
By Mariia Gorchichko [Applied Materials, Inc./IEEE] Dishit P. Parekh [AMD/IEEE] Benson Chan [Binghamton University/IEEE]
Srinidhi Ramamoorthy [Applied Materials, Inc./IEEE]
- 62 The 6th SWTest Asia Conference and EXPO was an overwhelming success!
By Jerry Broz [General Chair, SWTest US and SWTest Asia Conferences, and Delphon Industries]
and chiplets era through VIPack™ while delivering sustainable advanced packaging innovations for:
AI·HPC·DATACENTER·ROBOTICS AUTOMOTIVE · IoT · 6G · AEROSPACE ·And more.
laoaea X in @aseglobal aseglobal.com
Heterogeneous wafer-scale integration: The new front line of semiconductor scaling
By Krutikesh Sahoo, Subramanian S. Iyer [Samueli School of Engineering, University of California, Los Angeles]
or over five decades, the semiconductor industry lived by a simple, powerful rule: Moore's Law [1]. By shrinking the transistor, we gained speed, reduced power, and lowered costs. An equally important, but somewhat lesser known law that relates to the economics of Moore's Law, is Rock's Law [1]. However, as we navigate the sub-5nm era, the economic and physical foundations of monolithic scaling are fracturing. The reticle limit-the maximum size of a single chip-has become a wall that artificial intelligence (AI) and high-performance computing (HPC) workloads are crashing into. AI machines emphasize bandwidth while conventional HPC focuses on latency. But both are important at the system level. F
To bridge the gap between the exponential demand for compute and the physical limits of silicon, the industry is pivoting. The focus has shifted from the transistor to the package [2]. We are entering the era of heterogeneous integration (HI), where the system is no longer a single piece of silicon, but a collection of optimized 'dielets' or chiplets. It should be pointed out that there is some confusion between the terms chip and die. A circuit designer designs a chip-it is an abstraction of the design. The foundry converts that abstraction via masks and processes into hard wafers. The wafers are tested and diced into dies. Known good dies are then packaged and retransformed into chips. Chiplets and dielets have the same connotation, but chiplets and dielets are not merely small chips or dies. They are nonfunctional by themselves and need to be connected to other chiplets and dielets to exhibit functionality. To reiterate, chiplets are designed, dielets are assembled onto advanced packages-but this time, the assembly of packaged dielets is called a module or sub-assembly.
The transition to heterogeneous waferscale integration requires a fundamental rethinking of how we connect chips. In this article, we review the landscape of modern interconnect technologies-from traditional solder to cutting-edge hybrid bonding-and present a deep dive into a high-throughput copper-to-copper (Cu-Cu) thermal compression bonding (TCB) scheme that enables true wafer-scale integration.
The architectural pivot: Scale down vs. scale out
To understand the current state of advanced packaging, one must understand two primary scaling philosophies: scale down and scale out.
Scale down: The pursuit of density. Scale down is the packaging equivalent of traditional Moore's Law. The goal is to shrink every dimension: finer bump pitches, thinner dielectrics, and narrower metal lines. This approach is epitomized by direct metal-to-metal bonding such as thermal compression bonding (TCB), which targets pitches well below 10µm, eventually aiming for sub-micron levels [3]. Scale down is essential for 3D-IC stacks where vertical bandwidth between stacked dielets is being addressed.
Scale out: The pursuit of reach. Scale out, by contrast, is about area. It involves expanding the footprint of the scaled-down entity to the scale of a system or sub-system-potentially an entire 300mm wafer, or even a 600mm panel to accommodate massive amounts of memory and thousands of processing cores-all intimately connected at almost monolithic levels. This mimics the functionality of a giant monolithic chip but uses smaller, high-yield heterogeneous dielets (meaning dielets from different technologies, material systems and nodes). The challenge here isn't just pitch-it is the mechanical stability, warpage control, and the throughput and system functionality required to assemble thousands of dielets on a single substrate.
Navigating the interconnect landscape
The industry currently relies on four primary methods to join dies or dielets to substrates or wafers. Each comes with a specific 'sweet spot' in terms of pitch and manufacturing complexity.
Solder-based flip chip. Mass reflow of solder bumps has been the workhorse of the industry for 30 years. However, as pitches shrink below 40µm, solder encounters physical limits. The risk of solder bridging (shorts) increases, and the intermetallic compounds (IMCs) that form the bond become brittle, thereby compromising performance and reliability. Furthermore, the volume of solder required at fine pitches is so small that it becomes difficult to control the joint's consistency.
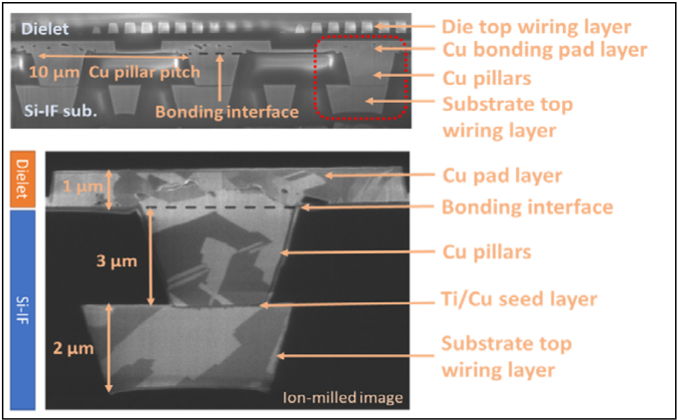
Thermal compression bonding (TCB). TCB was developed to extend solder life. By applying heat and pressure simultaneously via a bond-head, TCB allows for finer control than just thermally-assisted mass reflow. While often used with solder-tipped microbumps, the industry is increasingly looking at solderless Cu-Cu TCB. By bonding copper pillars directly to copper pads, we eliminate the risks of solder bridging and IMC formation. Furthermore, copper-copper interdiffusion results in a robust metallurgical bond-basically acting like a continuous piece of metal so long as any surface films can be removed by pretreatment. Figure 1 shows such a solder-less Cu-Cu contact.
Hybrid bonding (HB). Hybrid bonding represents another approach to 'scale down.' It involves a perfectly flat surface where both the copper interconnects and the surrounding dielectric (usually SiO2 or SiCN) are bonded together (Figure 2). The dielectric is bonded first and a thermal cycle is used to expand the recessed copper to connect. While HB has the potential to offer the highest interconnect density, its requirements are extreme: Class 1 cleanroom environments, sub-nanometer surface roughness, and expensive chemical mechanical polishing (CMP) steps. The nature and strength of the dielectric bond is just as important as the CuCu bond. This puts restrictions on the nature of the dielectric and processes need to be optimized for a specific dielectric. This makes the realization of heterogeneous hybrid bonding more difficult, especially if multiple foundries and material sets are involved. Hybrid bonding does have an advantage in alignment and overlay tolerance as the initial dielectric bond is performed at room temperature.
Figure 1: Cross section of solderless Cu-Cu thermal compression bonding interconnects from [5]. The micrograph shows grain growth across the bonding interface.
Fan-out wafer-level packaging (FOWLP). FOWLP is another approach that uses molding compounds. It has the potential to reach fine pitch as well as panel scale. In this method, dies are embedded in an epoxy matrix and connected-typically lithographically-to wiring layers. We mention this for completeness and will discuss it in a forthcoming article.
Figure 2: Cross section of a hybrid bonded interface based on [6].
The wafer-scale vision: Silicon interconnect fabric (Si-IF)
To achieve true scale out, the substrate itself must evolve. Traditional organic substrates (like FR4 or build-up films) suffer from high coefficients of thermal expansion (CTE) mismatch with silicon, leading to significant warpage.
At UCLA CHIPS, we have pioneered the silicon interconnect fabric (Si-IF) [4]. The Si-IF is an active or passive silicon wafer used as a high-density wiring platform. Because the substrate is silicon and the dielets are also silicon, the CTE is perfectly matched. This eliminates warpage issues during thermal cycling and allows for incredibly tight integration. On the Si-IF, we can achieve interconnect pitches of 7µm and below across an entire wafer [5].
Engineering the perfect bond: The physics of Cu-Cu TCB
The heart of our recent research involves optimizing the Cu-Cu TCB process to make it viable for high-volume manufacturing. Direct Cu-Cu bonding relies on solid-state diffusion. When two copper surfaces are pressed together under heat, atoms migrate across the interface, eliminating the boundary and forming a continuous metallic grain. (This happens in hybrid bonding as well, but the force is internally generated by thermal expansion of the copper.) The pressure in TCB is externally impressed and independent of the material system, and therefore, more controllable and process tolerant.
The challenge of oxidation. The big enemy of Cu-Cu bonding is oxide. Copper oxidizes almost instantly in air, forming a stable Cu2O film layer, the thickness of which can increase and eventually saturate with increasing temperature. This oxide acts as a barrier to diffusion. To achieve a successful bond, this oxide must be removed or bypassed. Historically, this required bonding in a vacuum or using reducing gases like formic acid, both of which slow down the manufacturing process.
Surface preparation and roughness. Before bonding, we employ a pre-bond treatment. This typically involves an ion beam or plasma clean to remove the native oxide and activate the surface. We have found that the root mean square (RMS) roughness of the copper pillars must be kept below 3nm to ensure sufficient contact area for diffusion to occur at reasonable temperatures (300°C-400°C). During bonding, an in situ reducing atmosphere of formic acid is provided locally within the bonding tool to remove oxide residues and prevent oxidation at higher bonding temperatures. This step can be removed so long as a low-oxygen environment can be created within the bonding tool, such as by continuous purging with nitrogen.
Solving the throughput problem: The two-step process
In a trade environment, 'cool technology' is useless if it is not 'profitable technology.' Traditional TCB Cu-Cu is notoriously slow [6]. A single-step TCB cycle-including die transfer, alignment, and the time the bond head holds the die in place while heating it to 300°C and cooling it back down-takes roughly 30 to 60 seconds. If a wafer-scale system requires 1,000 dielets, a single-step process would take over 16 hours to populate one wafer. This is commercially nonviable.
The breakthrough: Tacking and batch annealing
To solve the issues discussed above, we developed a two-step TCB process [5] that decouples the alignment from the permanent bonding. The two-step process is discussed below.
Step 1: High-speed tacking. A highprecision flip-chip bonder picks the dielet, aligns it to the Si-IF, and applies a lowtemperature (120°C), low-force pulse. This 'tacks' the dielet in place. The tacking force is sufficient to overcome initial surface roughness and keep the M-Series™ with Adaptive Patterning a world of possibilites MDQFN°
Free of leadframe limitations Eliminates capture pads on all layers
Standard & custom footprints Ultra-high-density interconnects
Fan-in and Fan-out Molded fan-out interposer technology
Multi-die or chiplet integration Dual-sided RDL interconnect
Copper post vias [CPV] through body
Passive integration Ideal for memory integration on processor coming soon..
www.thinkdeca.com dielet from moving during transport. This step takes less than 10 seconds.
Step 2: Batch annealing. Once the entire 300mm wafer is populated with tacked dielets, the whole assembly is placed in a furnace. The entire wafer is annealed at 300°C-400°C for 30 to 60 minutes. Because thousands of bonds are being finalized simultaneously in the furnace, the effective throughput jumps to over 1,100 dielets per hour (DPH). This brings Cu-Cu TCB into the realm of highvolume manufacturing.
Manufacturing yield and self alignment
In wafer-scale systems, yield is everything. If you have 1,000 dielets and one fails due to a bonding defect, the entire wafer-scale system may be compromised. Discussion of some of these issues follows below.
The tooling factor. Our research utilized a KNS APAMA [7] flip-chip bonder. We identified that the planarity of the bond head is the most critical tool parameter. If the head is tilted by even a fraction of a degree, the pressure across the dielet becomes nonuniform, leading to cold joints on one side and deformed pillars on the other. Clean particle-free die edges (determined by dicing strategy) are also critical to ensure reliable contact, especially in metal-metal TCB and HB where the gap between die pads and substrate pads/pillars is usually small or nonexistent. Newer models such as the KNS Aptura allow for much greater control, alignment capability, and throughput with Cu-Cu TCB as the go-to process for heterogeneous 3D integration.
Solder-assisted TCB? While our primary focus is solderless, we also evaluated a hybrid approach using a thin (2µm) cap of tin (Sn) on the copper pillars. This solder-capped TCB is much more forgiving of surface roughness and planarity issues because the liquid solder fills the gaps. However, for the highest performance and the tightest pitches, the industry consensus is moving toward the 'pure' Cu-Cu approach to avoid the Kirkendall voiding associated with solder. Eliminating solder enables a simpler foundry-friendly process.
Reliability: Passing the JEDEC gauntlet
For the Si-IF and Cu-Cu TCB to be adopted by industry leaders, they must survive extreme environmental stress. We subjected our wafer-scale assemblies to a series of rigorous tests described below.
Figure 3: Steady-state humidity tests (JESD22-A101D) for passivated and unpassivated samples, showing passivated samples have <10% resistance change. LT and HT refer to Cu-Cu annealing done at 300ºC and 400ºC, respectively. This shows the effectiveness of alumina in passivating Cu-Cu interconnections after bonding. SOURCE: [9] (available online after 2/12/26)
Humidity and passivation. Copper is prone to corrosion. To protect the waferscale system, we implemented atomic layer deposition (ALD) of alumina [8]. By coating the entire assembly in a nanometer-thin layer of alumina (Al2O3), we created a moisture barrier that effectively 'hermetically seals' the interconnects. Figure 3 shows results of resistance change of daisy chains bonded using Cu-Cu TCB, where one set of samples was passivated with alumina after TCB, and another set of samples was not passivated after TCB [9]. Results of our evaluation are as follows: 1) Without passivation: Samples failed the 85°C/85% relative humidity test within 100 hours; and 2) With ALD passivation: Samples maintained their electrical resistance and mechanical integrity for over 500 hours.
Thermal cycling (TC). We cycled the assemblies from 0°C to 125°C. Thanks to the CTE-matched nature of the Si die and Si substrate, we saw zero bond failures after 110 cycles. The shear strength of the bonds actually increased slightly after cycling because the additional heat prompted further grain growth. Figure 4 shows results of shear strength after temperature cycling of samples, with and without passivation.
Figure 4: Temperature cycling test (TCT) for 110 cycles showing no change in shear strength in case of Al2O3 passivated samples. SOURCE: [9] (available online after 2/12/26)
The road ahead: 2025 and beyond [11]
The transition to heterogeneous waferscale integration is no longer a research project-it is a manufacturing necessity. As we look toward the next five years, several trends will dominate the chipscale landscape in three main areas discussed below.
Standardization of chiplet interfaces. For the scale-out model to work, dielets from different vendors must be able to 'talk' to each other. Simple, protocol-independent communication methods such as the simple universal parallel interface for chips (SuperCHIPS), or bunch of wires (BoW), will be critical.
The rise of direct Cu-Cu bonding. Thermal compression bonding-the mainstay of today's advanced packaging assembly methods-will continue to make progress and potentially extend to the 5µmpitch regime. Hybrid bonding is also a contender, especially when all the dielets are from the same foundry.
Thermal management. Packing thousands of dielets on a single wafer generates immense heat. We are seeing a move toward integrated liquid and twophase cooling and micro-channel heat sinks intimately bonded to the assembly, preferably without the use of thermal interface material.
Summary
Heterogeneous integration on the silicon interconnect fabric represents the most viable path to maintaining the trajectory of system-level scaling. By utilizing a high-throughput, two-step CuCu TCB process, we have demonstrated that wafer-scale systems can be potentially manufactured with the speed and reliability the industry demands.
The scale-out revolution is here. It is no longer about how many transistors we
Biographies
Krutikesh Sahoo recently graduated with a PhD in Electrical Engineering from UCLA-CHIPS, focusing on advanced assembly and reliability. He is currently with Micron Technology, Inc.
Contact author: Subramanian S. Iyer (Subu) is Distinguished Professor and holds the Charles P. Reames Endowed Chair in the Electrical Engineering Department and a joint appointment in the Materials Science and Engineering Department at the University of California at Los Angeles. He is Director of the Center for Heterogeneous Integration and Performance Scaling (UCLA CHIPS). He is a fellow of IEEE, APS, iMAPS and NAI, as well as a Distinguished Lecturer of IEEE EDS and EPS. He is a Distinguished Alumnus of IIT Bombay. He received the IEEE Daniel Noble Medal for Emerging Technologies in 2012, and the 2020 iMAPS Daniel C. Hughes Jr. Memorial award, and the iMAPS Distinguished Educator Award in 2021. In 2023-2024, he was the Director of the NAPMP program. Email s.s.iyer@ucla.edu
can fit on a chip, but how many chips we can weave into a single, seamless, waferscale fabric. A deep dive into bonding mechanisms and influencing parameters for solder-based flip-chip, metal-metal TCB and hybrid bonding have been published in our previous work in IEEE Electron Device Reviews [10]. The reader is highly encouraged to read the document for deeper insight into how these bonding schemes fit with the interconnect roadmap.
References
- P. E. Ross, '5 Commandments [technology laws and rules of thumb],' IEEE Spectrum, vol. 40, no. 12, pp. 30-35, Dec. 2003, doi: 10.1109/MSPEC.2003.1249976.
- S. S. Iyer, 'Heterogeneous integration for performance and scaling,' IEEE Trans. on Components, Packaging and Manufacturing Tech. 6, no. 7 (2016): 973-982.
- S. Jangam, S. S. Iyer, 'Siliconinterconnect fabric for finepitch (≤10μm) heterogeneous integration,' IEEE Trans. on Components, Packaging and Manufacturing Tech. 11, no. 5 (2021): 727-738.
- S. S. Iyer, S. Jangam, B. Vaisband, 'Silicon interconnect fabric: A versatile heterogeneous integration platform for AI systems,' IBM Journal of Research and Development, vol. 63, no. 6, p. 5:1-5:16, Nov. 2019, doi: 10.1147/ JRD.2019.2940427.
- K. Sahoo, H. Ren, S. S. Iyer, 'A high throughput two-stage dieto-wafer thermal compression bonding scheme for heterogeneous integration,' IEEE 73rd Electronic
- Components and Technology Conf. (ECTC), 2023, pp. 362-366. doi: 10.1109/ECTC51909.2023.00067.
- E. Bourjot, et al., '10μm and 5μm die-to-wafer direct hybrid bonding,' IEEE 9th Electronics System-Integration Technology Conf. (ESTC), Sep. 2022, pp. 31-38. doi: 10.1109/ ESTC55720.2022.9939476.
- Kulicke and Soffa APAMA C2W bonder, online available: ht t ps: //www.k ns .com / Produc t s / Equipment/Advanced-Packaging(TCB)/APAMA-C2W
- N. Shakoorzadeh Chase, K. Sahoo, Y. Tao Yang, S. S. Iyer, 'Atomic layer deposited Al2O3 encapsulation for the silicon interconnect fabric,' IEEE 70th ECTC, Jun. 2020, pp. 1241-1246. doi: 10.1109/ ECTC32862.2020.00198.
- K. Sahoo, 'High throughput finepitch (≤10μm) assembly using CuCu thermal compression bonding and protocol integration strategies for wafer-scale systems,' 2025, Accessed: Jan. 07, 2026. [Online]. Available: https://escholarship.org/ uc/item/13w5h0wq
- K. Sahoo, V. Harish, H. Ren, S. S. Iyer, 'A review of die-to-die, die-to-substrate and die-to-wafer heterogeneous integration,' IEEE Electron Devices Reviews, vol. 2, pp. 6-31, 2025, doi: 10.1109/ EDR.2024.3501214.
- 'Manufacturing Roadmap for Heterogeneous Integration and Electronics Packaging (MRHIEP),' available at http://chips.ucla.edu/ p a ge / MRH I EP/ MRH I EP%20 Final%20Report
Think Fast. See Small. SQ7000M+ TM
SQ7000™ + All-in-One Solution
Save Time. Save Expense. Improve Yields.
nordson.com/testinspect | +1 760.918.8471 Copyright © Nordson Corporation.All rights reserved.
Transmission image
Slice 2
Slice 3
Look Past The Impossible. Dynamic Planar CT
Superior Software for Next Generation 3D Planar X-ray Inspection
Evaluation of indium TIM cross-sectioning methods on lidded high-performance microprocessors
By Neo Shao Ming, Song Mei Hui, Kevin Tan Bo Lin, Lee Xi Wen, Oh Zi-Ying, Foo Fang-Jie [Advanced Micro Devices (Singapore) Pte Ltd]
oids, cracks, and insufficient thermal interface material (TIM) volume hinder heat dissipation and jeopardize reliability of lidded high-performance microprocessors. Nondestructive tests can effectively be used to inspect voiding conditions in TIMs, but destructive cross sectioning is imperative for indepth analysis. A soft indium (In) TIM is sandwiched between the hard silicon die and the copper lid. Artifacts are, therefore, inevitably induced on the TIM during mechanical cross sectioning. In this paper, two cross-sectioning techniques were evaluated for an In TIM in lidded microprocessors: 1) Mechanical grinding with wax-coated silicon carbide papers, and 2) Ion milling. A thorough investigation on the pros and cons of each technique was conducted in order to conclusively select the most appropriate technique with respect to the requirements of turnaround time, area exposed and surface finish quality. V
Introduction
High-performance computing (HPC) microprocessors such as servers, artificial intelligence (AI) chips, and machine learning solutions tend to demand more power, and therefore, they tend to generate more heat as well. Without proper thermal dissipation, there is a high likelihood that a catastrophic failure could occur to the device, such as thermal overstress and thermal runaway [1]. There is a significant interest, therefore, to look at ways to improve on the thermal dissipation from such HPC microprocessors [2].
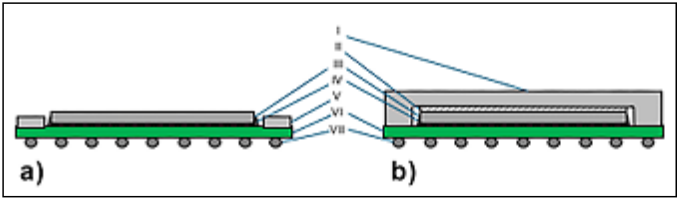
There are two main types of microprocessors as illustrated in Figure 1: 1) Lidless, and 2) Lidded. The lidless design in Figure 1a is typically used in laptop or embedded applications, while the lidded design in Figure 1b is typically used in desktop and server applications.
Figure 1: Schematic cross-sectional illustration of two general microprocessor designs used: a) Lidless and b) Lidded. (Legend: I - lid, II - TIM, III - die, IV - underfill and interconnects, V - stiffener, VI - substrate, VII - ball grid array).
More recently, the lidded design can also be found in AI graphics applications.
The TIM plays a vital role in thermal dissipation-it is sandwiched between the die and lid, which is also referred to as the bond line. A bond line of a material is used to describe where a material contacts between two components. The TIM is an integral part of the lidded design because it provides a direct path between the die and the lid for thermal dissipation away from the die.
Traditionally, the TIM interface is analyzed via nondestructive testing (NDT) methods, such as a C-mode scanning acoustic microscope (CSAM), and twodimensional (2D) X-ray. The working principle of the CSAM is based on the reflection of acoustic signals at a set interface to detect materials of differing densities [3]. The acoustic signal will be fully reflected in the presence of air, so the analysis will have to take place in a liquid medium-usually water. At every material interface, some signal will be reflected. The working principle is further illustrated in Figure 2. CSAM helps with detecting voids and delamination at a set interface. X-rays utilize electromagnetic energy at the X-ray wavelength to generate an image with the image contrast being determined by the difference in absorption of X-rays by the different components in the materials [4]. Such NDTs help provide information on the presence of voids and the state of degradation of the TIM after various package reliability stress testing conditions, such as temperature cycling (TC) and hightemperature storage (HTS) tests.
Figure 2: Illustration of the basic working principle of CSAM to analyze a TIM interface with the device submerged in water: a) Full reflection of an acoustic signal upon contact with a void; and b) Partial reflection of an acoustic signal at material interfaces.
Figure 3: a) Cross-section image of a TIM void captured under scanning electron microscope (SEM); and b) TIM CSAM image of the sample with an indication of the cross-section location.
Because NDTs only provide useful information from a planar perspectivea physically-destructive cross section must be performed on the device to collect cross-sectional information, such as bond line thickness (BLT) measurements and elemental analysis. For example, in Figure 3a we can see a void that was revealed via a physical cross section. The TIM CSAM image in Figure 3b was only able to detect the presence of the void, but the physical cross section was able to characterize the severity of the void.
Problem statement
Currently, the complexity of microprocessors poses challenges when performing a physical cross section. In the above-mentioned high-performance applications, In TIM is sandwiched between the silicon (Si) die and copper (Cu) lid. The Mohs hardness values of these three materials are shown in Table 1, as well as typical abrasives used, such as silicon carbide (SiC) and alumina (Al2O3). Mohs hardness is a measure of the resistance of a smooth surface to scratching or abrasion, expressed on an ordinal scale from 1-10 [5-6].
Physical cross sectioning is traditionally done by using a mechanical sample preparation method via grinding and polishing of the device. This is done using SiC sandpapers, followed by polishing using an alumina polishing suspension to obtain a mirror surface finish. However, the broad range of Mohs hardness values of the three materials (1.2-6.5) made it difficult to prepare the sample for further analysis because grinding debris accumulate and become embedded in the In because In is softer compared to Cu and Si (see Figure 4). The presence of such embedded materials will affect the surface finish quality and will hinder elemental composition or microstructural analysis.
Table 1: Mohs hardness values of the main materials present at the bond line interface, and abrasives used.
| Material Name | Symbol | Mohs Hardness [6][7][8] |
|---|---|---|
| Indium | In | 1.2 |
| Copper | Cu | 3.0 |
| Silicon | Si | 6.5 |
| Aluminum Oxide (Alumina) | Al2O3 | 9 |
| Silicon Carbide | SiC | 9.5 |
With the recent rise in interest to study In TIM reliability and the behavior of degradation for HPC products, there is also a growing interest in the refinement of sample preparation methods to achieve better surface finishing quality for such analyses.
The ability to perform such analyses will help to better understand the bond line interactions with the die and lid, which in turn, will help in improving the overall HPC product performance and reliability.
Procedures
In general, sample preparation must be done prior to performing the cross section. The sample must be molded with epoxy to fill the gaps between the lid and substrate, as well as to encapsulate the full device. Encapsulation provides more structural support to the soft In TIM and prevents any alterations to the initial structural integrity of the sample. For lids without cutouts, the sides of the lid will have to be sawed off to create an opening into which the epoxy can flow. Afterwards, besides mechanical grinding, the sample must be trimmed down by cutting and parallel lapping due to equipment size limitations. The sections below discuss the new mechanical grinding and ion milling processes used in sample preparation.
Mechanical grinding with wax-coated SiC grinding papers. This method is a modification to the current mechanical grinding and polishing process. Instead of using a regular SiC grinding paper, a novel wax-coated SiC grinding paper is used.
Figure 4: Image of embedded particles in In TIM captured under SEM after mechanical grinding and polishing.
Before using the grinding paper, candle wax is first coated on the grinding paper surface. Wax has a Mohs hardness value of less than 1 [6], which is softer than In with a value of 1.2. This means that grinding debris will tend to get embedded in the wax instead of in the In during cross sectioning, which will then help to improve on the surface finish. The polishing step using the alumina polishing suspension was excluded to prevent alumina particles with a Mohs hardness of 9 from being embedded into the soft In TIM.
Ion milling. Ion milling is a process involving the removal of the top amorphous layer on a material to reveal the pristine sample surface for high-resolution imaging and post processing. It is typically used for transmission electron microscopy (TEM)
and electron back-scattered diffraction (EBSD) studies [9]. The removal of the top layer material is achieved via the physical bombardment of high-energy noble ions, usually argon ions (Ar+) across the surface. Figure 5 is a schematic diagram showing the basic working principle.
Although the scope of this project does not cover TEM and EBSD analyses specifically, a defect-free sample surface is still beneficial to providing accurate analysis results, especially for material characterization. However, In has a relatively low melting point of 156.6ºC. Peak temperatures during ion milling can reach up to 376.9ºC [10] and induce heataffected zones, which are areas that have undergone changes in the microstructures of the material due to exposure to high heat. As such, a cooling stage that uses liquid nitrogen as the cooling agent is utilized to mitigate the formation of the heat-affected zones. A comparison can be found in Figure 6. Figure 6a shows what happened without a cooling stage: the results were heating [11] and a curtaining effect [12]. These occurrences are largely mitigated when using a cooling stage, as demonstrated in Figure 6b.
Figure 5: Basic working principle of an ion miller.
Figure 6: Image of a sample that underwent ion milling: a) Without a cooling stage; and b) With a cooling stage.
After removing the top layer of material to expose the cross-sectional surface, a physical inspection and characterization in a SEM, were done, including TIM BLT and backside metallization (BSM) thickness measurements, and subsequently, material characterization using energy dispersive X-ray (EDX) spectroscopy or EBSD.
Case study 1: TIM defect characterization on temperature cycling units
TIM cracks were reported on samples that were subjected to 3,000 cycles of temperature cycling at condition J (TCJ
Figure 7: a) An acoustic through-scan micrograph after TCJ3000 showing TIM cracks; and b) FIB cross section at an acoustic through-scan dark area [red boxed area in Figure 7a] showing a metal TIM crack and void.
BALL PLACEMENT & LASER SOLDERING
3D-Soldering
Wire Soldering
Pre-Soldering of SMD Connector Elements
BGA Soldering
Lid Sealing for Connectors & IR-Sensors
LASER ASSISTED BONDING (LAB, LCB, LAR)
3D Multi Layer Stacked Packaging
Optoelectronic Device Assembly
SOLDER & CHIP REPAIR
Interconnects of Camera Module
BGA Package Assembly onto Substrate
WE MANUFACTURE EQUIPMENT FOR YOUR NEEDS
3,000 cycles) based on JEDEC JESD22A104D standards, where the temperature conditions are from 0-100ºC.
Acoustic through-scanning was employed to inspect for TIM anomalies as seen in Figure 7a, where they showed up as dark areas. Through-scanning detects the transmitted acoustic signals instead of the reflected ones from CSAM [13]. The dark areas were subsequently verified with focused ion beam (FIB) cross sectioning to be TIM cracks (Figure 7b). FIB milling is similar to ion milling, but instead of low energy Ar+ ions, high energy Ga+ ions were used [9].
The inspection window of the FIB cross section revealed was only about 300µm wide and therefore, could not fully characterize this TIM anomaly and represent the TIM condition across its full length. We were then tasked to characterize the TIM condition across its full length. CSAM and throughscanning were first performed to inspect the TIM conditions on these units.
The sections below discuss the details with respect to mechanical grinding and ion milling.
Mechanical grinding. Dark areas were first observed on the throughscan micrograph as seen in Figure 8. These areas also showed up as bright patches in CSAM micrographs at the TIM-die interface. The first attempt to characterize these acoustic signatures was via the traditional cross-sectioning method of mechanical grinding using SiC papers, followed by polishing with an alumina suspension. The cross section was performed at the location as shown in Figure 9.
Large cracks were observed under an optical microscope (Figure 10) after mechanical grinding and polishing. However, embedded polishing debris and mechanically-induced artifacts were present after performing this method, as well as smearing of Cu from the lid into the In TIM. This smearing obstructs the view of In TIM cracks.
To minimize polishing debris and artifacts embedded in the In TIM interface, the mechanical grinding was subsequently performed using the wax-coated SiC grinding paper. A significant reduction in the amount of embedded debris was observed on the In TIM interface as seen from an optical microscope and SEM (Figures 11-12).
Figure 8: Acoustic CSAM and through-scan micrographs of a sample after TCJ3000 cycles.
Figure 9: a) An acoustic CSAM; and b) A through-scan micrograph zoom-in view of the sample, while indicating the cross-section location and direction.
Figure 10: Optical image showing embedded debris in a TIM of sample after mechanical grinding and polishing as seen under an optical microscope with bright-field illumination.
Figure 11: Optical overview at the TIM interface after performing mechanical grinding using wax-coated SiC grinding paper as seen under an optical microscope with zoom-in images under: a) Bright-field; and b) Darkfield illumination.
Figure 12: SEM Image of In TIM captured: a) After mechanical grinding with wax-coated SiC paper; and b) Zoomed-in with the focus on the presence of Cu smearing.
Figure 13: Acoustic CSAM micrograph zoom-in view showing the mechanical grinding location and direction.
Comparing the two mechanical grinding methods, the wax-coated SiC grinding paper helped in improving the overall surface finishing. TIM cracks appear clearer and more distinct due to much lesser embedded debris present at the In TIM crosssectional surface. Although Cu smearing was still induced via this method, the smearing did not affect characterization of physical In TIM cracks to bright areas in the CSAM TIM-die interface across the full length as seen in Figure 13.
Figure 14: a) Acoustic CSAM; and b) Zoomed-in through-scan micrographs of Sample A denoting the ion-milling location and direction.
Figure 15: a) (top) Images showing the cross-section area exposed after ion milling under the optical microscope; and b) (bottom) In the SEM.
This case study successfully validated the inference of TIM cracks from through-scan observations and established that mechanical grinding with wax-coated SiC paper would be the best-known method for large area TIM cross-sectional analysis.
Ion milling. Alternatively, a cross-sectional surface exposed by mechanical grinding methods can be further improved using an ion milling method to achieve a clean surface finishing without surface defects. This is demonstrated on Sample A where the area with TIM cracks is subjected to ion milling (Figure 14). The exposed surface finish shows vast improvement, and is suitable for further material analysis such as EDX and EBSD. However, the crosssection surface exposed via this method is only limited to a small region (~4mm) as seen in Figure 15. Therefore, the reliability in understanding the cracks across the full length of TIM interface would be compromised. Furthermore, the ion milling method requires additional sample preparation compared to mechanical grinding. Coupled with the long milling time required, this significantly increases the turnaround time to achieve better finishing.
This successful characterization work helps to establish correlation between the CSAM signature on both the TIM-die interface and the through-scan to TIM cracks. This result simplifies future TIM crack screening via only CSAM, eliminating the need for constant cross-section verification. Details and outcomes of the various cross-section techniques used are summarized in Table 2.
Table 2: Summary of cross-sectional methods used for the case study: TCJ3000 TIM characterization.
| Criteria Method | Mechanical Grinding and Polishing | Ion Milling |
|---|---|---|
| Approx. Time | 2 days (1 day molding+1 day grinding) | 5 days (1 day molding + 2 days sample prep + 2 days ion milling) |
| Length of TIM Cross-Section Surface Exposed | >50mm | 4.8mm |
| Section Surface TIM Cross- Finishing | Poor (with embedded debris, scratches and smearing) | Good (artifact-free fnishing) |
| Remarks | Wax coating on SiC paper improves cross-section finish. For overview inspection of gross TIM cracks. | For fine cracks inspection in TIM |
HyperSocket™M
High-Speed >224Gbps
Total Solution for Advanced Semiconductor Test
ertical Probe Card inimum pitch : 75 um gh pin count ≤ 40,000pins Vertical Probe Card Minimum pitch : 75 um High pin count ≤ 40,000pins
Coaxial Socket
Functional Burn-in Functional Burn-in
Optical Socket SerDes 224Gbps PAM4
Spring Probe In-house manufacturing
Thermal Product 3500W cooling capacity Temperature : -40 to 150°C
Case study 2: TIM analysis for VCL samples
There is a new type of lid that is available on the market called a vapor chamber lid (VCL). A VCL utilizes a two-phase evaporative cooling system to provide higher thermal conductivity as compared to commonly used heat spreading materials. The working principle is illustrated in Figure 16, as well as a sample cross-section schematic of a microprocessor using VCL.
To analyze the TIM condition in VCL design, CSAM is not a suitable technique because acoustic signals are unable to penetrate through vapor and will be reflected before reaching the TIM interface. As such, X-ray methodology is used instead to inspect the TIM void condition. Denser materials will appear darker in contrast, and the reverse is true for lighter materials. An example of an image captured using X-rays is shown in Figure 17.
As seen in Figure 17, information with respect to the entire stack of the sample is being revealed as the X-ray penetrates through the whole sample. This causes difficulty in inspecting the TIM void condition because the overlapping layers provide unwanted information. In this case, a special type of imaging technique known as X-ray laminography [14] was used to obtain the specific plane of the TIM interface as shown in Figure 18 for further TIM void characterization. For this technique, the detector is set at an oblique angle to the source (Figure 19). 2D projections are then captured 360° around the sample and the specific plane of the TIM interface can be obtained with the reconstructed data.
Figure 17: X-ray image of a VCL sample.
Figure 18: X-ray laminography image of the TIM interface on the same VCL sample.
Figure 16: Illustration of: a) (top) Cross section of a package with VCL; and b) (bottom) Working principle of a VCL.
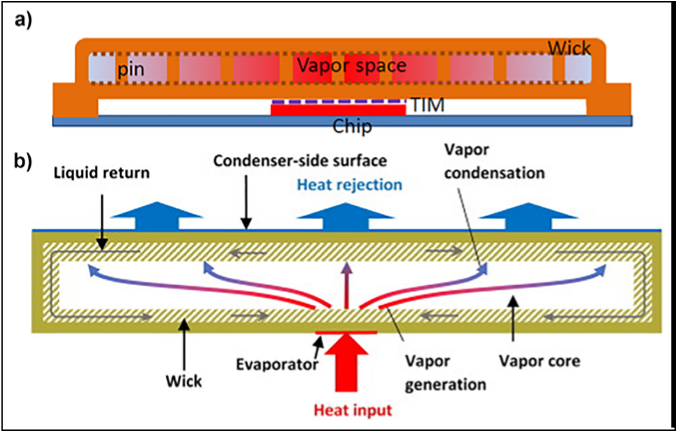
Figure 19: Schematic diagram showing the setup for X-ray laminography [15].
Subsequently, cross sections were performed on the samples via different methods for BLT measurement of the TIM interface, as well as to look for any potential delamination at both the VCLTIM and TIM-die interfaces. The first method was done via mechanical grinding and polishing, which can be seen in Figure 20. The embedded debris present did not inhibit the measurement of the TIM BLT.
Figure 20: SEM image of a VCL cross-section sample done via the traditional mechanical grinding and polishing method; the green line represents the BLT measurement taken.
Figure 21: SEM image of a VCL sample after performing an ion milling cross-section method.
Inspection of fine-pitch delamination (<10μm) demands a high-quality surface finish. As such, ion milling cross sectioning is done on the VCL sample. Results of the ion milling process can be seen in Figure 21, where the surface is free from defects and debris, aside from inherent voids that were present in the sample. Delamination was not observed in the milled sample.
For TIM BLT analysis, both methods can obtain results, but when fine-pitch delamination is of interest, only ion milling can be used for analysis because the artifact-free surface finishing that it can achieve. Any artifacts, such as debris embedment and metal smearing, may mask any inherent fine-pitch delamination observations. Details and outcome of the various cross-section techniques used are summarized in Table 3.
Table 3: Summary of cross-sectional methods used for TIM analysis for VCL samples.
| Method Criteria | Mechanical Grinding and Polishing | Ion Milling |
|---|---|---|
| Approx. Time Taken / day | 2 days (1 day molding + 1 day grinding) | 7 days (1 day molding + 3 days sample prep + 3 days ion milling) |
| Length of TIM Cross-Section Surface Exposed | >22 mm | 2.5 mm |
| TIM Cross-Section Surface Finishing | Poor (with embedded debris) | Good (free from artifacts and debris) |
| Remarks | For TIM BLT mcasurcmcnt | For inspection of TIM interfacial delamination (Preferred method) |
Case study 3: TIM analysis on power cycling units
The main objective for this case study is to compare the TIM degradation condition of a sample at T=0 and after powercycling 4,600 cycles, and to see if there is any difference in thermal resistance as a result of TIM degradation.
CSAM and through-scanning were done to first compare and characterize the TIM degradation condition. Subsequently, a cross section was performed at TIM noncontact regions based on CSAM results. An example can be seen in Figure 22 where the CSAM's void detection software is used to determine areas where the In TIM has no contact with the lid or die. The areas highlighted in red are areas where the TIM has no contact at the TIM-die interface.
A physical correlation study of the TIM condition is then done by performing cross sectioning-more specifically by looking at the BSM-a complex layer comprising aluminumtitanium-nickel vanadium-gold (Al-Ti-NiV-Au). This complex layer is in contact with the Si die and the In TIM, as well as the nickel-gold (Ni-Au) lid plating that is in contact with the In TIM. As BSM is of sub-micron thickness, any irregularities or induced defects would make the measurement inaccurate. Hence, ion milling was the chosen method to perform this analysis, because a pristine surface finish can be achieved to minimize any defects that would affect the final measurement results (see Figure 23a). Delamination was observed at the TIM-die interface, which correlates to the TIM non-contact regions as seen from the CSAM results in Figure 22.
In Figures 23b-c, the SEM and EDX can effectively capture the different layers of the BSM, as well as make measurements with a reasonable degree of accuracy due to the absence of cross-section-induced defects. Likewise, in Figures 23d-e, the Ni-Au lid plating thickness can be measured, along with the respective elemental compositions. Details and outcomes of the various cross-section techniques we used are summarized in Table 4.
Figure 22: CSAM image of a sample with TIM non-contact regions highlighted in red by the CSAM's void detection software at the TIM-DIE interface-while also showing the cross-section location and direction.
Figure 23: SEM images of a cross-section sample: a) After performing the ion milling cross-section method; b) With a focus on the BSM interface; c) After EDX was performed showing the breakdown of elements present at the BSM interface and their thickness measurements in yellow; d) With a focus on the Ni-Au plating interface; and e) After EDX was performed showing the breakdown of elements at the Ni-Au plating interface along with their thickness measurements in yellow.
Table 4: Summary of cross-sectional methods used for TIM analysis on power cycling units.
| Method Criteria | Ion Milling |
|---|---|
| Approx. Time Taken / day | 7 days (1 day molding + 3 days sample prep + 3 days ion milling) |
| Length of TIM Cross-Section Surface Exposed | 4mm |
| TIM Cross-Section Surface Finishing | Good (without any artifacts and debris) |
| Remarks | Elemental analysis at TIM interfaces (BSM and lid plating) |
Table 5: Comparison of the time taken, length of surface exposed, and surface finishing of the three cross-sectional methods, as well as the type of applications for each method.
| Method Criteria | Mechanical Grinding and Polishing | Ion Milling |
|---|---|---|
| Approx. Time Taken / day | 2 | 5-7 |
| Length of TIM Cross-Section Surface Exposed | Full length (Sample B TIM Length: 50mm) | 4.8mm |
| TIM Cross- Section Surface Finishing | Poor (Embedment of grinding debris) | Good (Free from artifacts and debris) |
| Type of Applications | For BLT measurements and gross TIM defect observations | For elemental studies, submicron measurements and fine defect observation |
Each method of sample preparation comes with its own pros and cons, which are listed in Table 5, where the time taken to perform the method, the surface area of the sample able to be prepared by the method, as well as the surface finishing quality are investigated and ranked. The two techniques complement each other by allowing all analyses to be done in-house, removing the need for outsourcing, thereby saving cost. Figure 24 serves as a comprehensive toolkit and guide to the optimized sample preparation techniques for various analysis requirements.
Summary
From this evaluation, a comprehensive toolkit was developed to curate the best-known sample preparation method for various analysis requirements. This evaluation took place after thorough consideration of the time taken for cross sectioning, the size of area exposed, as well as the surface finish. The evaluation also showcased our ability to incorporate unconventional solutions such as common household items (in the case of candle wax), and nonstandard upgrades (in the case of cold stage in ion milling) to industry standard cross-sectional techniques to meet the ever-changing failure analysis demands for new products, especially in the server and AI segments. By deploying the appropriate cross-sectional methods, we can effectively characterize the samples and optimize the time taken based on the requirements-be it for failure analysis or construction analysis. This will help to determine the root cause of failure or facilitate the understanding of the buildup and interactions of the device, which will then help to provide the appropriate corrective action or improvements. To date, these crosssectional methods have been effectively demonstrated in multiple reliability characterization studies, as well as with respect to customer returns within AMD.
Figure 24: Flowchart of the TIM cross-section sample preparation best-known method (BKM).
Acknowledgments
Many thanks to DA Lab Package Team members who have helped in one way or another, such as to collect valuable analysis data and providing their knowledge and expertise, which led to the completion of this evaluation. AMD, the AMD Arrow logo and combinations thereof are trademarks of Advanced Micro Devices, Inc. Portions of this article were presented at EPTC 2024this version was edited for publication in Chip Scale Review.
References
- V. Lakshminarayanan, N. Sriraam, 'Analyzing thermal runaway in semiconductor devices using the constrained method of optimization,' International Conf. on Circuits, Controls and Communications (CCUBE), 2013.
- R. Mahajan, C. Chiu, R. Prasher, 'Thermal interface materials: A brief review of design characteristics and materials,' Electronics Cooling, vol. 10, no. 1, p. 10, 2004.
- F. J. A. Rebollo, 'Working Process Of C-SAM In EEE Parts | doEEEt. com,' Alter Technology, 28 March 2019. [Online]. Available: https:// www.doeeet.com/content/testingeee-par t s/inspect ion-elect r icalver i f icat ion /work i ng-process - of-scanning-microscopy-c-sam/. [Accessed 27 January 2023].
- G. T. X Zhou, 'Electron and Photon Based Spatially Resolved Techniques,' Reference Module in Materials Science and Materials Engineering, 2017.
- The Editors of Encyclopaedia Britannica, 'Mohs hardness,' Encyclopaedia Britannica, 15 September 2022. [Online].
Biographies
Neo Shao Ming is a Senior Product Development Engineer at Advanced Micro Devices (Singapore) Pte Ltd, Singapore. He specializes in semiconductor packaging failure analysis with a strong emphasis on advanced sample preparation of complex packaging technologies. His work focuses on enabling accurate defect localization, supporting root-cause investigations, and driving process optimizations and improvements. He is passionate about advancing analytical capabilities to improve product performance and reliability. Email neo.shaoming@amd.com
Song Mei Hui is a Senior Product Development Engineer at Advanced Micro Devices (Singapore) Pte Ltd, Singapore. She brings extensive experience in nondestructive analysis techniques-specializing in thermal interface materials characterization and voiding studies. Her technical expertise encompasses advanced failure analysis methodologies for highperformance microprocessors, with a focus on material integrity assessment and process optimization. She has contributed significantly to developing cross-sectioning evaluation methods for indium TIM applications in lidded packages.
- Available: https://www.britannica. com/science/Mohs-hardness. [Accessed 21 November 2022].
- Editorial Team, 'Mohs Hardness Scale Meaning and How to Use It to Test Hardness | Science Drill,' 6 July 2022. [Online]. Available: ht t ps: //scienced r i l l .com/mohshardness-scale/. [Accessed 3 May 2023].
- G. V. Samsonov, Ed., 'Mechanical properties of the elements,' in Handbook of the Physicochemical Properties of the Elements, New York: Plenum Publishing Corporation, 1968, pp. 387-446.
- 'Reade Advanced Materials - Mohs' Hardness (Typical) of Abrasives,' Reade International Corp., 2022. [Online]. Available: ht t ps: //www. reade.com/ reade - resources/reference-educat ional / reade-reference-char t-par t icleproperty-briefings/mohs-hardnesstypical-of-abrasives. [Accessed 17 January 2023].
- Nanoscience Instruments, 'Ion Milling - Nanoscience Instruments,' 2023. [Online]. Available: https://www.nanoscience. com/techniques/ion-milling/. [Accessed 8 February 2023].
- B. Viguier, A. Mortensen, 'Heating of TEM specimens during ion milling,' Ultramicroscopy, vol. 87, pp. 123-133, April 2001.
- A. W. Thompson, Z. D. Harris, J. T. Burns, 'Examination of focused ion beam-induced damage during platinum deposition in the nearsurface region of an aerospace aluminum alloy,' Micron, vol. 118, pp. 43-49, 2019.
- K. Larsen, 'The Effects of Ga FIB Milling on Analysis - Oxford Instruments,' 28 July 2021.
- [Online]. Available: https://www. oxinst.com/blogs/the-effects-of-gafib-milling-on-analysis. [Accessed 12 May 2023].
- K. Mugunan, L. C. Ying, C. C. Fei, 'Verification of delamination observed in SAM transmission mode (Thru-scan) using reflection mode (C-SAM Bottom Scan),' IEEE 38th International Electronics Manufacturing Technology Conf. (IEMT), Melaka, Malaysia, 2018.
- M. Holler, M. Odstrčil, M. Guizar-Sicairos, M. Lebugle, U. Frommherz, T. Lachat, et al., 'LamNI - an instrument for X-ray scanning microscopy in laminography geometry,' Jour. of Synchrotron Radiation, vol. 27, no. 3, pp. 730-736, 2020.
- A. Gerwe, 'Utilizing Computed Tomography (CT) for Printed Circuit Board (PCB) Inspections and Reverse Engineering - 3D Engineering Solutions,' 4 June 2020. [Online]. Available: ht t ps: //3d-engineer ing.net /ctscann i ng-for-pcb - i nspec t ionreverse-engineering/. [Accessed 24 May 2023].
Enjoy the Ride When Burn-In Has Been Applied
For the long road ahead, turn to Micro Control Company, The Advanced Burn-In Solution Provider.
3 unify i3
Enabling Tomorrow's Semiconductor
TSE
Optimized Advanced InterconneXion Solution
"Innovating Semiconductor Testing" Three-in-One intergrated
InterconneXion
Probe Card
Test Interface Board
A revolutionarų three-in-one integrated solution shaping the future of semiconductor testing
ELTUNE-air TM
Independent Stroke and Enhanced SI Performance bų air gap
<Section View>
<Toρ View>
Insertion Loss(dB)
TSE Co., LTD www.tse21.com salesaρ@tse21.com
Using polynomial regression for heterogeneous package stress modeling
By Kart Leong Lim, Ji Lin [Institute of Microelectronics (IME), Agency for Science, Technology and Research (A*STAR)]
igh stress occurs when 3D heterogeneous integrated circuit (IC) packages are subjected to thermal cycling at extreme temperatures. Finite element analysis (FEA) is widely used to predict such stresses without the need of an actual prototype. FEA, however, does require specialized knowledge and usually is computationally expensive, as well as time consuming. However, testing in a production environment requires simplified, but accurate, stress prediction tools to provide quick answers and solutions within a short time frame. Therefore, FEA may not be the right tool for stress prediction. We present an artificial intelligence (AI)-based stress predictor tool that allows engineers with no FEA background to perform fast and efficient routine package stress checks for testing and production purposes. H Nonlinearity. Although vanilla deep regression has the capability to perform stress modeling, the input (design and material variables) and output (various stress vectors) of the problem is highly nonlinear. The nonlinearity can be studied from the simple viewpoint of a two-input variable problem. Figure 2 shows that the response of the stress Sz to the epoxy molding compound (EMC) modulus and
To demonstrate the AI-assisted stress predictor tool, stress in a simple two-chip package (Figure 1) was studied. There are two main problems encountered when developing a stress predictor tool-the development of the AI stress predictor tool was focused on addressing them (see the sections below).
Figure 1: Probe on a 2-dies package for stress prediction. Stress (MPa) occurs at the bond between different materials when subjected to thermal cycling (-55deg to 150deg). The X and Y axes refer to the plane, while the Z and X axes refer to the side view.
AI in the first place. Other practical issues include the number of man-hours and equipment cost (i.e., scientist/engineer with a mechanical stress background, ANSYS subscription, and a powerful workstation).
Recent excellent works related to mechanical stress modeling using state-of-the-art deep learning include papers found in [1-5]. Nie, et al. [5], first published an image-based stress dataset
Figure 2: Stress response corresponding to a two-input variables case is asymmetric and saddle shaped.
coefficient of thermal expansion (CTE) is in the shape of an asymmetrical saddle. Such a nonlinear response is a challenge for AI to model Sz accurately when a limited training dataset is available. Furthermore, for stress prediction to be useful to real-world problems, it has to cope with more than two inputs and one output variable.
Dataset. We used commercial FEA software (ANSYS) to generate a training dataset (Table 1). Generating a large dataset with more variables is not only computationally demanding, but having a full DOE defeats the purpose of using of 2D structures with 120,960 samples. The authors used shape, boundary conditions and load conditions of a finemesh structure as inputs for training convolutional neural networks (CNN), which they call StressNet. Subsequently, Jiang, et al. [1], trained a generative adversarial net (GAN) known as StressGAN to perform a stress prediction. The generator takes in the shape, boundary and load conditions and outputs a stress image, while the discriminator tries to identify it. Concurrently, Yang, et al. [2], also used GAN to predict the stress field for a material composite.
Table 1: Full-factorial FEA dataset for Sz vs. EMC modulus. There are 100 training and 14 test cases in total.
They collected a dataset of 2000 stress field images, then used a U-net for the generator and PatchGAN for the discriminator. Gao, et al. [4], predicted the stress field of a crust and rock formation using several CNNs in parallel, which they claim further reduced the test error for 877 cases. Wang, et al. [3], used spatial and temporal feature propagation for stress-field prediction using TI-CNN and Bi-LSTM with 61 simulations of a time-series dataset. The above works, however, are not related to IC packages; additionally, they mainly focus on imagebased stress prediction. On the other hand, unlike a dataset that contains simple structures, it is much harder to collect an IC package dataset using FEA. Few authors have addressed the issues of using an FEA dataset for stress prediction. Kang, et al. [6], mentioned using a Monte Carlo method to prepare a large dataset. However, little is discussed on preparation and an ANN approach. Instead, the authors mainly investigated layers and nodes for low error in stress prediction, as well as compared results of ANN with FEA. Nourbakhsh, et al. [7], discussed using Latin hypercube sampling [8] for collecting a design of experiment (DOE) exercise and developing surrogate models from various structures to enable a more general model prediction for the same class with different topology and boundary conditions. More recently, Chen, et al. [9], has discussed using ANN to learn from past FEA simulations of packaged components in an effort to shorten the design cycle for IC packaged products.
Inspired by statistical sampling, we applied polynomial mapping to our dataset prior to deep learning. This has the effect of mapping the input space to a higher dimension space, thereby reducing the nonlinearity. In the second problem, we combined a statistical method with commercial FEA. Specifically, we used Latin hypercube sampling to generate near-random points for FEA. These strategic points contain useful information for modeling the unknown underlying physics of the stress problem. We demonstrate our abovementioned approach on three different in-house stress datasets for a 2-dies package (Figure 1): 1) 1D input and 1D output dataset; 2) 2D input and 4D output dataset; and 3) a 4D input 4D and output dataset. The second stress dataset (Figure 2) shows an asymmetric saddle when plotted with input variables EMC modulus and CTE. We further extended our dataset to include die size and gap size as different stress variables (e.g., x-axis, y-axis, S1 and Von Neumann). We reported our best results when compared with baselines such as vanillabased deep regression. We achieved very low error prediction on a 2D stress case (Figure 2) and we further showed success in a higher multidimensional case. For the data generation problem, we experimented with a sampling technique for modeling the unknown underlying physics of the stress problem. We showed (Table 2) that a partial DOE generated from such an approach can still effectively train a deep learning model as compared to a full DOE case-retaining low-error prediction while saving a large number of man-hours needed to perform an FEA.
Table 2: Comparison of SST-ANN (proposed) vs. full DOE-ANN.
| Training dats peeparation metbodolagies - Existing Al medet with Fall Dof: | Training dats peeparation metbodolagies - SST-ANN | |
|---|---|---|
| v im jo mq | 625 | 344 |
| CPU time in hoers | 52 | 29 |
| Mas absolute emor over FEA | 14M2a | 15MPa |
| Belative tax etror over FEA | 9.5% | 10.3% |
| Iime saving an Ammya | 44% |
Methodology
To conduct our studies, we used polynomial deep regression, defined a design of experiment (DOE) using Latin hypercube sampling, and used factor analysis to define boundary conditions. These efforts are described below.
Polynomial deep regression. Vanilla deep regression for Sz (stress in the z-axis in Figure 1) using a multilayer perceptron can be expressed as follows in Eq. 1:
Polynomial regression uses a single layer representation and has the following expression:
In fact, we can treat w as a multilayer representation of β by concatenating x with its power terms up to the p th order:
Eq.3
Therefore, we define polynomial deep regression (using a mean-square error loss function) as follows:
DOE using Latin hypercube sampling. Direct random sampling is just a set of random numbers without any manipulation. In contrast, Latin hypercube sampling (LHS) ensures that the set of random numbers is representative of the full DOE. LHS divides each dimension into non-overlapping subsets and reduces the variability of the estimates by uniformly covering the domains. A coverage point Xij is as follows in Eq. 5:
Eq. 5
where n is total number of points for each dimension d, and where 1
≤ i < n and 1 ≤ j ≤ d. Both uniform random permutations πj = {0, 1,...,n - 1}, and uniform distribution Uij ~ [0, 1) are used together to estimate the coverage points. A small set of coverage points, or a partial DOE (Table 3), is used to represent the full DOE for stress prediction.
Boundary conditions using factor analysis. We further constrain the training of deep regression with samples obtained from the boundary conditions. However, because the PDE is unknown, we use factor analysis to estimate the boundary conditions. For an illustrative four-dimensional input variable
Table 3: Partial DOE obtained using Latin hypercube sampling and factorial analysis.
| Mih Mes 1 1 1 4 2 4 1 11 11 11 H4 1 1 IT 11 21 34 | anpter40n | anpter40n | anpter40n | anpter40n | 44 | 44 | 44 | 44 | ||||||||
| Mih Mes 1 1 1 4 2 4 1 11 11 11 H4 1 1 IT 11 21 34 | Modals IM | Aj | OM ASS | S[] | (MN) | S+[M] | MIME | [MN) I | S[M] | [MN) TVIn | ||||||
| 8.1 | L1 | aN | 34 | 1 | 34 | 3 | 43 | 0 | ||||||||
| 3 | LI | 1 | 11 | 10 | :30 | 4T | 207 | 4 | 11 | |||||||
| 33 | LS | a | 24 | 112 | D | 6 | 100 | 2 | e | E | ||||||
| 15 | a1 | ar | 11 | 4 | 17 | M | n1 | 1 | 1 | 11 | ||||||
| u | 4LT | L7 | 41 | 1 | 170 | 4 | 3 | 4 | L | |||||||
| u | 4 | n | u | 127 | u | u | 120 | 1 | 2 | |||||||
| L | 97 | 10 | 4 | L20 | 11 | 47 | 11 | 1 | ||||||||
| D1 | L4 | 11 | 3 | 11 | 40 | 150 | 3 | 1 | 1 | |||||||
| ea | 137 | 61 | H | IN | 2 | |||||||||||
| LO | LT | L1 | n | 1 | N | a | 105 | 1 | 2 | 11 | ||||||
| na | L | 11 | 185 | 11 | 120 | 1 | E | |||||||||
| as | 4 | 15 | 4 | 4 | 1 | th | ||||||||||
| ds | D4 | L7 | 61 | is | n | 44 | 14 | ino | 24 | |||||||
| 124 | aLa | L | 11 | 4 | 47 | a | 1 | 20 | ||||||||
| 12.1 | L4 | 31 | 130 | 3 | 4 | 47 | 117 | 1 | 17 | |||||||
| 12 | L4 | D | 34 | 4 | Li0 | B | 40 | 6 | 1 | 1 | ||||||
| 20.8 | a7 | at | 17 | 8 | 1 | M. | 12 | 1 | ||||||||
| ni | L | 4 | 1 | LA | a | 1 | Ls | |||||||||
| 112 | an | E | H | 11 | 200 | H | 30 | M | 200 | 2 | 4 | I | ||||
| a | L4 | n | a | N | 45 | 156 | 2 | 4 | 19 | |||||||
| L | 10 | L | 4 | a | a | 10 | 2 | 7 | ||||||||
| Le | D | 11 | m5 | n1 | 3 | 3 | 1 | 12 | ||||||||
| 23 | O4 | 63 | 41 | Be | 41 | in | 2 | 1 | 4 | 4 | ||||||
| 204 | a7 | 61 | 4 | 200 | 41 | 44 | 2u | 2 | 7 | 13 | ||||||
| E | L1 | 11 | 120 | n | 11 | 47 | 1 | |||||||||
| 14 | a7 | 24 | IM | 3 | 56 | 110 | 1 | 1 | 5 | |||||||
| 10 | 11 | a7 | 67 | 34 | 136 | d | 1 | 46 | 155 | 2 | 2 | 1 | ||||
| a | 41 | H | 44 | P | 47 | 2 | 1 1 | |||||||||
| 114 | L | 1 | u | 110 | 4 | 47 | a | 1 | 2 | |||||||
| 31 | 11 | 04 | LI | 4 | 40 | c | : | |||||||||
| D | 05 | 64 | B | 24 | 2 | 1 | ||||||||||
| 1 | as | 314 1- | .. | H | u | us | . | 5 | 4 | 150 us | 1 | 1 | . |
Figure 3: Stress prediction using Sz vs. EMC modulus.
(E,C,G,S) problem, we can express the boundary condition of each dimension as follows in Eq. 6:
Eq. 6
where E+ refers to a random sample and E- and E+ refer to the minimum and maximum value of E (vice versa for C, G and S). We generated samples from each of these conditions in Eq. 6 to form the boundary points of the stress model. We then tabulated each boundary condition in Table 4.
Table 4: Binary system table for sampling boundary conditions.
| BC | T | BC | F | 5 | ||||
|---|---|---|---|---|---|---|---|---|
| 1 | 0 | 0 | I | 17 | a | 0 | 0 | |
| 2 | 1 | 6 | 1 | 10 | 1 | 0 | 0 | |
| 3 | 0 | 1 | I | 19 | 1 | 0 | ||
| 4 | 0 | 6 | 1 | 20 | a | 0 | - | 1 |
| 5 | 1 | 1 | I | 21 | 1 | 1 | 0 | |
| c | 1 | 0 | 1 | 22 | 1 | 0 | 1 | |
| 0 | 1 | 1 | 23 | 1 | 1 | |||
| 1 | 1 | 1 | 24 | 1 | 1 | 1 | ||
| r | 6 | 5 | BC | r | c | 5 | ||
| 9 0 | 0 | 25 | a | 0 | - | |||
| 50 | - | 6 | 25 | 1 | 0 | I | ||
| 51 0 | 1 | 37 | a | 1 | ||||
| 0 | 一 | 6 | 1 | 28 | a | 0 | 1 | |
| 13 1 | 1 | 0 | 29 | 1 | 1 | |||
| 54 1 | 0 | 1 | 30 | 1 | 0 | 1 | 一 | |
| 15 0 | 1 | 1 | 31 | a | 1 | 1 | ||
| 56 1 | 1 | 1 | 32 | 1 | 1 | 1 |
Experiments
The following sections describe the methods used in our experiments.
One parameter case. We developed a 2-die IC package design using FEA and collected 100 training and 14 test samples as shown in Table 1 for a one-parameter case. Figure 3 shows the comparison between the polynomial deep regression (ANN) with other baselines using support vector regression (SVR) and K-nearest neighbor (KNN). We can see that linear regression using SVR is unable to model the curve. This is because different values of the EMC modulus can encounter similar Sz values (e.g., EMC modulus between 5 and 15). Although not shown here, our earlier attempts using vanilla deep regression also could not accurately model the curve. Only ANN and KNN can address the nonlinearity issue. Additionally, it can be seen in Figure 4 that although KNN outperforms ANN (proposed), it suffers from a larger max absolute error.
Figure 4: Error comparison between the proposed method (ANN) vs. the baselines.
A two-parameters case. We extended our case study to two inputs (EMC modulus and CTE) and four outputs (Sz, Sx, S1, Svon) with 225 training and 225 test samples (Table 5). We trained the polynomial deep regression with p = 4 using ADAM with a learning rate of 1e - 3 for 20k iterations, and for 3 hidden layers with 50 neurons per layer. The training error is shown to converge quickly after around 5k iterations in Figure 5. There are some irregular spikes seen that we suspect could be due to
Figure 5: Convergence of the training error when using a polynomial deep regression.
setting a faster learning rate. From the test predictions in Figure 6, we observed that ANN is able to capture the curve according to the test ground rules for all stress variables (Sz, Sx, S1, Svon).
A four-parameters case. As we increased the number of input variables, it became increasingly harder to collect a full factorial number needed to generate a FEA. In the two-parameters case, we used 15 levels for each variable, yielding 225 combination cases. However, the four-parameters case, which has a mere 5 levels for each variable, yields 625 combination cases. This means that the stress predictor has to learn each variable using only 5 points. Collecting a fullfactorial DOE not only increases the size of the FEA task, but also introduces redundancy due to orthogonal sampling. Also, the combination cases grow exponentially beyond the four-parameters case. Instead, we used Latin hypercube sampling to compute collocation points for each variable, as well as to compute boundary condition points using a binary system table. We call this technique the strategic sampling technique (SST). Finally, we obtained a partial DOE of 344 near-random cases (200 collocation points and 144 boundary condition points) vs. a full DOE with 625 cases. We show a comparison of using polynomial deep regression (ANN) on full DOE vs. SST in Table 2 and in Figure 7. We note that since the sample size is effectively half, we only require half the time to run the FEA task. Despite that, SST-ANN is able to predict stress with an error (MAE and max error) for S1 very close to a full DOEANN. Therefore, SST-ANN is more applicable to real-world problems for stress prediction.
Table 5: Full-factorial FEA dataset for outputs (Sz, Sx, S1, Svon) vs. inputs (EMC modulus, EMC CTE). There are 225 training and 225 test cases in total.
Figure 6: Stress prediction for two input and four output variables. For visual analysis, different curves representing EMC CTE at [0.5, 2, 6, 10, 20, 30, 40, 50] were used to show the comparison between AI (proposed) and FEA.
Figure 7: Visual comparison of SST-ANN (proposed) vs. full DOE-ANN.
Summary
Stress prediction is a mandatory process in the testing and production phase of IC package fabrication. Stress prediction, however, is not only a labor-intensive task, but it also requires highly-skilled engineers who are adept at FEA. It involves the use of specialized software such as ANSYS, which requires a large overhead cost to license, as well as a huge computational cost to run. To overcome these burdens, we turned to a modern AI approach that uses deep regression to automate the process. There are real-world issues that arise, however, such as complexity in the representation of the domain field and difficulty in generating a sufficient dataset for deep regression. This work highlights the above-mentioned issues and how we overcome them by proposing to combine a statistical approach with deep regression. The
Biography
Kart Leong Lim is a Senior Scientist I at the Institute of Microelectronics (IME), Agency for Science, Technology and Research (A*STAR), Republic of Singapore. He leads efforts to accelerate AI adoption in heterogeneous integration and electronic design automation. He also specializes in generative models, reinforcement learning, multimodal learning, attention model and recursive networks to advance these areas. Email Lim_Kart_Leong@a-star.edu.sg
Ji Lin is a Senior Scientist II at the Institute of Microelectronics (IME), Agency for Science, Technology and Research (A*STAR), Republic of Singapore. She has more than 15 years of experience in mechanical modeling, thermal management and fluid dynamics with research environments and various industries including semiconductor and energy sectors. Her current research interests include design for reliability in advanced packaging, 2.5D/3D/FOWLP advanced packaging technology, co-design modeling and simulation, and characterization of microelectronic packaging materials.
impact from this work is as follows: 1) By exploiting polynomial regression for deep regression, we were able to converge faster for training deep regression while achieving very good accuracy; and 2) We reformulated dataset generation using ANSYS as a nearrandom sampling problem such that the man-hours needed to run ANSYS can be significantly reduced due to a more compact and efficient representation.
References
- H. Jiang, Z. Nie, R. Yeo, A. B. Farimani, L. B. Kara, 'StressGAN: A generative deep learning model for twodimensional stress distribution prediction,' Jour. of Applied Mechanics, vol. 88, no. 5, p. 051005, 2021.
- Z. Yang, C.-H. Yu, M. J. Buehler, 'Deep learning model to predict complex stress and strain fields in hierarchical composites,' Science Advances, vol. 7, no. 15, p. eabd7416, 2021.
- Y. Wang, D. Oyen, W. Guo, A. Mehta, C. B. Scott, N. Panda, et al., 'StressNet-deep learning to predict stress with fracture propagation in brittle materials,' Npj Materials Degradation, vol. 5, no. 1, p. 6, 2021.
- W. Gao, X. Lu, Y. Peng, L. Wu, 'A deep learning approach replacing the finite difference method for in situ stress prediction,' IEEE Access, vol. 8, pp. 44 063-44 074, 2020.
- Z. Nie, H. Jiang, L. B. Kara, 'Stress field prediction in cantilevered structures using convolutional neural networks,' Jour. of Computing and Information Science in Eng., vol. 20, no. 1, p. 011002, 2020.
- S. Kang, J. H. Lee, S. M. Kim, J. Lim, A.-Y. Park, S. Han, et al., 'Machine learning-based solution for thermomechanical analysis of MMIC packaging,' Advanced Materials Technologies, vol. 8, no. 5, p. 2201479, 2023.
- M. Nourbakhsh, J. Irizarry, J. Haymaker, 'Generalizable surrogate model features to approximate stress in 3D trusses,' Engineering App. of Artificial Intelligence, vol. 71, pp. 15-27, 2018.
- A. B. Owen, 'Monte Carlo theory, methods and examples,' https://artowen.su.domains/mc/, 2013.
- G.-W. Chen, Y.-C. Lin, C.-H. Hsu, T.-Y. Chen, C.-C. Wang, C.-P. Hung, H.-K. Wang, 'Thermal resistance prediction model for IC packaging optimization and design cycle reduction,' IEEE 74th Electronic Components and Tech. Conf. (ECTC), 2024, pp. 1593-1598.
ZETA SERIES
COAXIALSOLUTION
Min.Pitch ≥0.80mm HIGHSPEED
PinCount >10,000 CROSSTALK 224Gbps -75dB@56GHz
Key Features :
- . Full coaxial structure from DUT to PCB.
- Robust design with integrated dielectric.
- Simple field pin replacement identical to a standard contactor.
- High strength, highly rigid contactor body.
- Capable of high pin count applications greater than 5000 l/O's.
WLCSP SOLUTION Min. Pitch 0.125mm Pin Count ≤6000
HIGH PIN COUNT SOLUTION Min. Pitch 0.80mm Pin Count Up to 20,000
HYBRID ELASTOMER SOLUTION Transmission Speed >200Gbps Inductance <0.2nH
PoP SOLUTION Min. Pitch <0.40mm Stacked Device
CMOS SOLUTION Min. Pitch <0.40mm Imaging Device
RF & mmWAVE SOLUTION
Min. Pitch 0.35mm Insertion Loss >100GHz@-1dB
Test Tooling Solutions Group
Co-packaged optics: Heterogeneous integration of chiplets in switches, PICs, and EICs
By John H. Lau [Unimicron Technology Corporation]
here have been strong demands for lower power consumption and higher bandwidth in optical/electrical interconnects used for artificial intelligence (AI) and networks in a data center. The adoption of co-packaged optics (CPO) has been expected for both high-performance computing (HPC) driven by AI, as well as highbandwidth, low power, and high-speed communications networks in a data center. In this study, 3D heterogeneous integration of chiplets such as photonic integrated circuits (PICs), electronic integrated circuits (EICs), and application-specific IC (ASIC) switches with and without bridges on CPO substrates made of organic, silicon, and glass. Some recommendations will be provided in the article. T partitioned and split into small chiplets [1-6] and then integrated on a substrate. The key advantages of silicon photonics are better performance and easier to test. The key disadvantages of silicon photonics are higher costs and more rigid infrastructure. The key advantages of chiplets are lower costs and more flexibility. The key disadvantages of chiplets are not as good performance as silicon photonics and larger package size. This study is focused on the heterogeneous integration of the chiplets, such as the ASIC switch, the PIC, the EIC, and the silicon photonics of the PICs and EICs. Photonic devices and silicon photonics
Co-packaged optics (CPO) are heterogeneous packaging methods to integrate chiplets such as PICs (e.g., photodiode (PD) and laser) and EICs (e.g., laser driver and a transimpedance amplifier (TIA)), as well as the switch ASIC. The advantages of CPO are: 1) Reducing the length of the electrical interface between the PIC/EIC and the ASIC; 2) Reducing the energy required to drive the signal; and 3) Cutting the latency, which leads to better electrical performance.
Twenty years ago, silicon integration was very popular. Companies like Intel and Advanced Micro Foundry (AMF) have been promoting the silicon photonics that integrate some of the PICs, EICs, and waveguides on a chip from a silicon wafer with complementary metal-oxide semiconductor (CMOS) technology. The holy grail of silicon photonics is to integrate all the PICs, EICs, and waveguides on a chip fabricated from a Si wafer with CMOS technology. However, in the past few yearsdriven by cost-the PICs and EICs are Photonic devices are components that generate, manipulate, and detect light, e.g., light-emitting diodes (LEDs), lasers, photodiodes (PDs), etc.
Silicon photonics is a technology that integrates optical components onto a silicon chip, enabling the transmission of data using light instead of traditional electrical signals. In another words, silicon photonics are the semiconductor integration of some of the PICs, EICs, and waveguides on a silicon wafer with CMOS technology. Intel's hybrid laser technology is an example; and PsiQuantum's omega chipset is another example.
Data centers and optical transceivers
A data center includes switches, routers, storage solutions, etc. Their functions include the network of computing and storage resources that enable the delivery of shared applications and data. Today, more than 90% of transceivers are pluggable. However, Figure 1 shows the optical transceivers to be used more in a future data center.
An optical transceiver defines the process of converting electric signaling toward the optical transmission with the help of the transmission optical subassembly (TOSA), or the Tx module, and performing inverse action through the receiver optical subassembly (ROSA), or Rx module (Figure 1). A TOSA contains a semiconductor laser diode (LD), laser driver, etc., while a ROSA contains a photodiode (PD), an optical interface such as a lens, a transimpedance amplifier (TIA), a passive electrical interface, etc. The TOSA module converts the electrical signal to the optical transmission light that lands on the fiber. The ROSA is used to receive an optical signal from a fiber and convert it back into an electrical signal.
Figure 1: TOSA, ROSA, PIC, EIC, and switch in a data center.
There are many forms of transceivers in CPO as shown in Figure 2. The most common form is the CPO with the basic chiplets such as a switch, laser driver, TIA, and the photonic devices such as the laser, and PD. The advantages are lower cost and more flexibility. The disadvantages are larger package size and more work in testing and burnin. The next common form is the CPO with advanced chiplets such as the silicon photonic laser chip, silicon photonic PD chip, silicon photonic laser and driver chip, silicon photonic PD and TIA chip, etc. The advantages are better performance, easier to test and burn-in, and smaller package size. The disadvantages are higher costs and a more rigid infrastructure. The CPO with the holy grail silicon photonic chip that integrates all the PICs such as the laser and PD-and even all the EICs such as the driver and TIA from a silicon wafer with CMOS technologyis nowhere in sight.
Pluggable optics, on-board optics, near-package optics, and CPO
The pluggable optics, on-board optics (OBO), near-package optics (NPO), and CPO are schematically summarized in Figure 3. It can be seen that the pluggable transceivers are mounted on the edges of a printed circuit board (PCB) with the ASIC package attached to a package substrate. The distance from the PIC/ EIC of the pluggable transceivers to the ASIC chip is the farthest and therefore, the power consumption and electrical performance are the worst.
For OBO, the PIC/EIC are mounted around the ASIC switch package, which is an improvement in power and electrical performance. However, the signals are still traveling on the PCB.
For NPO, a high-performance substrate is used to support the ASIC switch package and the PIC/ EIC for better power and electrical performance. Therefore, there is no high-speed data bandwidth going through the PCB.
Figure 2: Various forms of CPO.
Figure 3: Pluggable optics, OBO, NPO, and CPO.
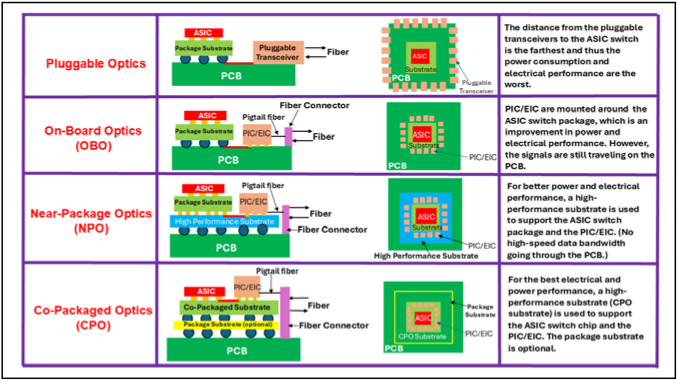
In CPO, the PIC/EIC is placed sideby-side along the four edges of the ASIC chip on the same co-packaged substrate. In this case, the distance between the ASIC and the PIC/EIC is the shortest, and therefore, has the best electrical performance. In short, NPO brings the PIC/EIC closer to the ASIC package on a high-performance substrate, while CPO brings the PIC/ EIC and the ASIC chip side-by-side on the same CPO substrate. CPO offers superior form factor, power consumption, and latency benefits compared to NPO.
CPO has the lowest power consumption (Figure 4). It has been shown [7] that by using CPO instead of the pluggable transceiver in a 1.6-terabit ASIC switch, the power saving is approximately 50%.
Figure 5 shows a 2.3D heterogeneous integration of an ASIC, EIC and PIC on a CPO organic interposer [8]. It can be seen that the ASIC switch chip, EIC chips, and PIC chips are side-by-side attached to the CPO organic interposer with µbumps, and then on a package substrate with C4 bumps, and finally, on a PCB with a solder ball.
3D heterogeneous integration of an ASIC switch, PIC and EIC
With CPO, the switch chip is typically surrounded by 16 optical engines (OEs; PIC/EIC), all placed on a package substrate (Figure 1). Currently, the 25.6-terabit Ethernet switch chip requires 16@1.6 terabits-per-second (1.6Tbps) OEs, and the 51.2-terabit switch chips use 16@3.2Tbps OEs. The coming 102.4-terabit switch chips will use 16@6.4Tbps OEs (the size of the EIC and PIC of the OE will be larger and larger). The issue is that the multi-chip module can only be so large. It is challenging with today's packaging technology to surround the 51.2Tbps ASIC with 16@3.2Tbps (or a 102.4Tbps ASIC with 16@6.4Tbps) OEs. One of the solutions is to integrate some of the PICs and EICs into a silicon photonic by CMOS technology and then attach the silicon photonic to a CPO substrate. Another solution is to stack up the PIC and the EIC (from 2D to 3D) with heterogeneous integration packaging method.
There are many different kinds of 3D heterogeneous integration (stacking) of the PICs and EICs as shown in Figure 6. It can be seen from Figure 6a that the light is coming from the fiber to the PIC and the PIC and EIC are stacked (faceto-face) with the µbumps, and the signals are fanning out through the C4 or C2 bumps from the PIC to the next level of interconnects. Figure 6b shows the EIC and the PIC stacked (face-to back) with the µbumps, and the signals are running out through the through-silicon vias (TSVs) and the C4 bumps or µbumps from the PIC. Figure 6c is basically the same as Figure 6b except the µbumps between the EIC and PIC are replaced by the Cu-Cu hybrid bonding [9-13]. Figure 6d shows that the EIC and the PIC are stacked (connected) by a TSV interposer with the µbumps, and the signals are fanning out through the RDLs and TSVs of the TSV interposer and the TSVs and C4 bumps, or µbumps, from the PIC. Figure 6e is basically the same as Figure 6d except the TSV interposer is replaced by the organic interposer and the signals are fanning out through the RDLs of the organic interposer and the TSVs and C4 bumps, or µbumps, from the PIC. Figure 6f shows that the PIC and EIC are stacked by a TSV interposer with µbumps, and the signals are running out through the µbumps of the TSV interposer. Figure 6g is basically the same as Figure 6f except the TSV interposer is replaced by the organic interposer. Figure 6h is basically the same as Figure 6f except the µbumps on both sides of the TSV interposer have been replaced by the bumpless Cu-Cu hybrid bonding. Figure 6i is basically the same as Figure 6h, except the TSV interposer is replaced by the through-glass via (TGV) interposer.
Figure 4: Power consumption of pluggable optics and CPO.
Figure 5: CPO on an organic interposer (2.3D IC integration).
Figure 6: Various 3D PIC and EIC heterogeneous integrations.
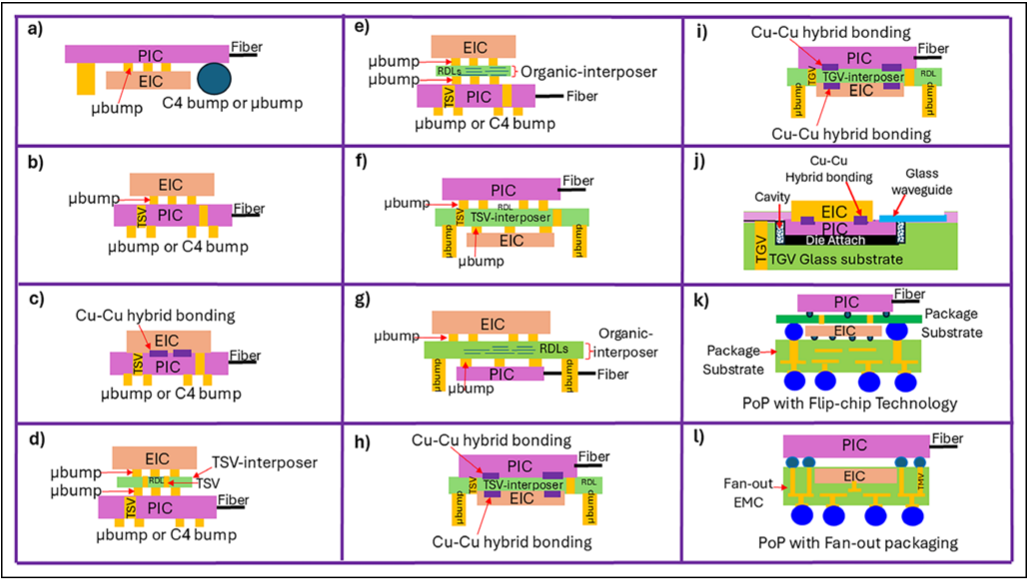
Comparing Figure 6b with Figures 6d-e, the latter figures represent the case for extremely high-density situations and the case where there are difficulties in direct stacking of the EIC and PIC. Comparing Figure 6d with Figure 6f, it can be seen that the TSVs in the PIC as shown in Figure 6d have been eliminated (see Figure 6f). Similarly, by comparing Figure 6e with Figure 6g, it can be seen that the TSVs in the PIC-as shown in Figure 6e-have been eliminated (see Figure 6g). Figure 6j shows the 3D stacking of a PIC and an EIC with a TGV glass substrate by Cu-Cu hybrid bonding. The PIC is semi-embedded on a TGV glass substrate with a cavity. Figures 6k-l are examples of the use of package-on package (PoP) for the PIC and EIC. Figure 6k is for a solderbumped EIC on a package substrate in the bottom package, while Figure 6l is for the EIC embedded in the fan-out epoxy molding compound (EMC).
The patent application of case g (in Figure 6g) has been granted
[14] and is shown in Figure 7. It can be seen that the EIC and PIC are stacked with an organic interposer and that the CPO substrate for the 3D heterogeneous integration of the PIC and EIC, as well as the switch, is a build-up package substrate.
Figure 7: 3D PIC and EIC stacking with an organic interposer and then side-by-side with the switch on a CPO package substrate.
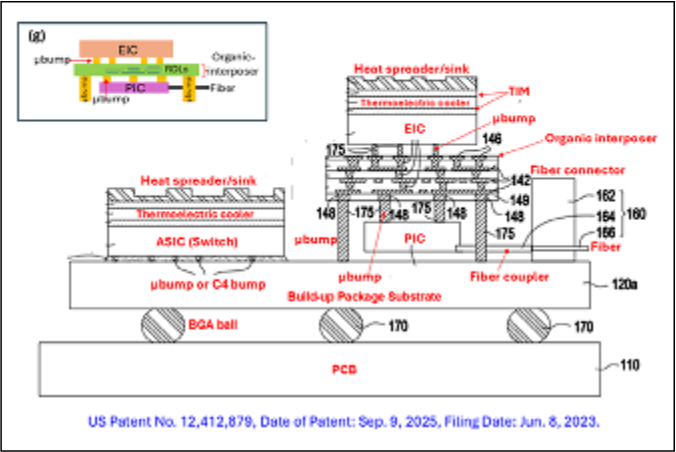
CPO substrates
There are many different types of CPO substrates such as silicon, glass, organic, etc. Figure 8a shows a 3D heterogeneous integration (stacking) of a PIC and an EIC (such as those shown in Figure 6) side-by-side with the ASIC switch with µbumps or C4 bumps on a CPO organiccore build-up package substrate. Figure 8b shows a 3D heterogeneous integration of a PIC and an EIC sideby side with the ASIC switch on the same CPO glass-core build-up package substrate. Figure 8c shows a 3D heterogeneous integration of a PIC and an EIC side-by-side with the ASIC switch on the same CPO TSV/ TGV/organic interposer. Then, the interposer is attached to a build-up package substrate. The CPO system shown in Figure 8c has the highest performance and cost. The CPO system shown in Figure 8a has the lowest performance and cost.
Heterogeneous integration of an ASIC switch, PIC and EIC with bridges
Figure 9a shows a 3D heterogeneous integration of a PIC and an EIC (such as those shown in Figure 6), as well as the ASIC switch with Intel's embedded multi-die interconnect bridge (EMIB) [15] in the cavity of a CPO organiccore package substrate. The bridge is connecting the switch and the PIC. There are two different kinds of bumps (µbumps and C4 bumps) on the ASIC and PIC.
Figure 9b shows a 3D heterogeneous integration of a PIC and an EIC, and an ASIC with silicon bridges. It can be seen that the ASIC and the 3D stacking of an EIC and a PIC are connected with a silicon bridge with µbumps. Then, the ASIC and the 3D stacking of the EIC and the PIC are attached to a CPO organic-core substrate or glasscore substrate with either µbumps or C4 bumps. The bridge is not embedded in the substrate.
Figure 9c shows a 3D heterogeneous integration of a PIC and an EIC, and an ASIC with a silicon bridge, which is exactly the same as Figure 9b, except the connection between the switch (or PIC) and the bridge is with CuCu hybrid bonding such as that shown in [16]. A comparison between these three cases is shown in Figure 9.
Figure 10a shows a 3D heterogeneous integration of a PIC, an EIC, and an ASIC switch with a Si bridge embedded in a fan-out EMC with RDLs. The signals from above the fan-out EMC are connected to those below the fan-out EMC through the throughmolded vias (TMVs). Figure 10b shows a similar pattern [17] for a Si bridge embedded in a fan-out EMC for chiplets communications.
3D heterogeneous integration of a PIC/EIC/ASIC switch on a fan-out RDL substrate
Figure 11 shows a CPO system. It can be seen that the PIC and EIC are stacked with Cu-Cu hybrid bonding, and then they are side-by-side with a switch attached to a fan-out with redistribution layers (RDLs) CPO
Figure 8: a) CPO (organic-core build-up package) substrate; b) CPO (glass-core build-up package) substrate; c) Co-packaged substrate (TSV/TGV/organic-interposer).
Figure 9: a) CPO substrate (organic with embedded EMIB); b) CPO substrate (organic or glass) with the bridge above it connecting the PIC and switch with a µbump; c) CPO substrate (organic or glass) with a bridge above it connecting the PIC and switch with Cu-Cu hybrid bonding.
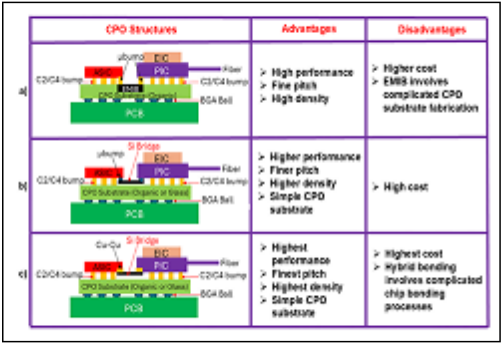
substrate. The CPO substrate is then attached to a PCB. The structure is very simple with high performance and reasonable cost.
3D heterogeneous integration of a PIC, EIC, and ASIC switch on fan-out RDLs and polymer waveguides
Figure 12 shows another CPO system. It can be seen that the PIC and EIC are 3D stacked with hybrid bonding, and then they are side-by-side with a switch attached to a fan-out RDL CPO substrate with holes. The holes are used for lights to pass through. There are polymer waveguides with 45º mirrors at both of their ends that are semi-embedded in the PCB. The light from the external fiber through the V-groove hits the 45º physical mirror and then reflects and passes through the hole and hits one end of the 45º mirror of the polymer waveguide. The light travels along the polymer waveguide, hits the other end of the 45º mirror, and then reflects on the PIC. Finally, the PD in the PIC
Figure 10: a) CPO substrate with an embedded Si bridge in fan-out EMC connecting the PIC and switch; b) A similar patent.
Figure 11: CPO on a fan-out RDL substrate.
Figure 12: CPO on a fan-out RDL substrate with holes and polymer waveguides embedded in a PCB.
Figure 13: CPO on an organic interposer with holes and embedded polymer waveguides.
Figure 14: 3D stacking of an EIC and a PIC with a glass interposer and then side-by-side with the switch on a CPO substrate.
Figure 15: 3D stacking of an EIC and a PIC with Cu-Cu hybrid bonding. The PIC is semi-embedded in a CPO glass substrate.
receives the light. This system has better performance than that shown in Figure 11, but it comes with a higher cost.
3D heterogeneous integration of EIC/ PIC/ASIC switch on an embedded polymer waveguide and organic interposer
Figure 13 shows another CPO system. It can be seen that the PIC and EIC are stacked with hybrid bonding, and then they are side-by-side with the switch attached to an organic interposer with an embedded polymer waveguide with 45º mirrors at both ends. There are holes in the organic interposer. The CPO interposer is attached to a buildup package substrate, and then on a PCB. Compared with the CPO systems shown in Figures 11-12, this system has the best performance, but has the highest cost.
3D heterogeneous integration of ASIC/PIC/EIC with a glass interposer
Figure 14 shows a CPO system with a TGV interposer. The PIC and EIC are 3D-stacked through a TGV interposer with Cu-Cu hybrid bonding. The PIC and EIC are sideby-side with the switch attached to a build-up package substrate. The package substrate is then attached to the PCB. The glass waveguide on the glass interposer receives the light from the external fiber and sends the light to the PD of the PIC.
3D heterogeneous integration of ASIC/PIC/EIC with a glass substrate
Figure 15 shows a CPO structure with a glass-core build-up package substrate. There is a cavity on the CPO glass-core substrate. The PIC and EIC are 3D-stacked with hybrid bonding and the PIC is semiembedded in the cavity of the substrate. The switch and the PIC/ EIC stack are side-by-side attached to the CPO substrate. Compared to the CPO structure shown in Figure 14, this CPO structure has better performance, but has a higher cost.
3D heterogeneous integration of ASIC/PIC/EIC and GPU/HBM
Figure 16 shows a CPO system for HPC driven by AI and low-power, high-speed and high-bandwidth communication applications. It can be seen that the graphics processing unit (GPU) is surrounded by the highbandwidth memory (HBM), and then surrounded by the OE such as the PIC and EIC. The ASIC switch is surrounded by the PIC and EIC. These two structures are connected through fibers and on a CPO substrate, which can be a TSV interposer, TGV interposer, or an organic interposer, and then on a package substrate. Finally, both units are attached to a PCB.
Figure 16: An HPC driven by AI and a low power, high-speed, and high-bandwidth communication system.
Summary
Some important results and recommendations are summarized as follows:
- Photonic devices are components that generate, manipulate, and detect light, e.g., LED lasers, PDs, etc.
- Silicon photonics is the integration of some, or all of the PICs and EICs into a 2D-chip from a silicon wafer with CMOS technology.
- Twenty years ago, silicon integration was very popular. Companies like Intel and AMF have been promoting silicon photonics. The holy grail of silicon
Chip Scale Review - Elevate Gold NBV HT 2023 - Gold savings.indd 1
3/6/2024 3:56:50 PM
photonics is to integrate all of the PIC and EIC into a single 2D-chip fabricated from a silicon wafer with CMOS technology.
- Related to the previous bullet-in the past few years, driven by cost, PICs and EICs are partitioned and split into small chiplets.
- CPO is the heterogeneous integration packaging method to integrate all the chiplets, such as the switch, PIC, EIC, and silicon photonics on a CPO substrate or interposer.
- Various forms of CPO have been shown in Figure 4. CPO with basic chiplets will be used the most. CPO with advanced chiplets (silicon photonics) will be used less. CPO with the holy grail silicon photonics is nowhere in sight.
- Twelve different 3D stacks of PICs and EICs have been given in Figure 6-some of their advantages and disadvantages have also been briefly mentioned.
- Various new structures (systems) of CPO have been proposed.
Their substrate can be fan-out RDLs, fan-out RDLs with holes, and polymer waveguides in the PCB, an organic interposer with holes and embedded polymer waveguides, a TGV interposer, a glass-core build-up package substrate, etc.
- Figure 16 shows a future CPO system for HPC driven by AI and low-power, high-speed and highbandwidth communications.
- As of this writing, there are no papers published with respect to the quality and reliability of CPO (e.g., various tests such as thermal cycling, thermal shock, mechanical vibration, mechanical shock, high-temperature storage, highly-accelerated temperature, highly-accelerated moisture resistance, etc.). In order for CPO to be more popular, these quality and reliability data are desperately needed. Thermal management of 3D CPO will be an important topic.
- Because glass has a higher ability to seamlessly integrate optical interconnects, more use of the glass substrate or glass interposer for CPO is recommended.
- Just like electrical leakage, light leakage due to coupling loss, waveguide cracks, scattering, and absorption, can all become invisible killers and should also be noted.
- Due to the requirement of higher interconnect density, finer pitch, more compact 3D integration, lower power consumption, lower latency, higher bandwidth, and better signal integrity of a CPO system-the Cu-Cu hybrid bonding [9-13] of some of the PICs and EICs are strongly recommended.
References
- J. H. Lau, K. N. Chiang, CuInterconnects, Glass, and AI Assisted Simulations for Chiplets and Heterogeneous Integration, Springer, New York, 2026.
- J. H. Lau, X. Fan, Hybrid Bonding, Advanced Substrates, Failure Mechanisms, and Thermal Management for Chiplets and Heterogeneous Integration, Springer, New York, April 2025.
- J. H. Lau, Flip Chip, Hybrid Bonding, Fan-In, and Fan-Out Technology, Springer, New York, 2024.
- J. H. Lau, Chiplet Design and Heterogeneous Integration Packaging, Springer, New York, 2023.
- J. H. Lau, Semiconductor Advanced Packaging, Springer, New York, 2021.
- J. H. Lau, Heterogeneous Integrations, Springer, New York, 2019.
- J. E. Johnson, K. Bacher, R. Schaevitz, V. Raghunathan, 'Performance and reliability of advanced CW lasers for silicon photonics applications,' Optical Fiber Comm. Conf. and Exhibition (OFC), 2022, Tu2D.1.
-
J. H. Lau, T. J. Tseng, 'Package Structure and Optical Signal Transmitter,' US Patent No. 11,860,428, Date of Patent: Jan. 2, 2024, Filing Date: Jun. 9, 2022.
-
J. H. Lau, 'State-of-the-art and outlooks of Cu-Cu hybrid bonding,' IEEE Trans. on CPMT, Vol. 16, No. 1, Jan. 2026.
- J. H. Lau, 'Current advances and outlooks in hybrid bonding,' IEEE Trans. on CPMT, Vol. 15, No. 3, Apr. 2025, pp. 651-681.
- J. H. Lau, 'State of the art of CuCu hybrid bonding,' IEEE Trans. on CPMT, Vol. 14, No. 3, Mar. 2024, pp. 376-396.
- J. H. Lau, 'Recent advances and trends in Cu-Cu hybrid bonding,' IEEE Trans. on CPMT, Vol. 13, No. 3, Mar. 2023, pp. 399-425.
- J. H. Lau, 'Recent advances and trends in advanced packaging,' IEEE Trans. on CPMT, Vol. 12, No. 2, Feb. 2022, pp. 228-252.
- J. H. Lau, T. J. Tseng, '3D Heterogeneous Integration of PIC and EIC,' US Patent No. 12,412,879, Date of Patent: Sep. 9, 2025, Filing Date: Jun. 8, 2023.
- R. Mahajan, R. Sankman, N. Patel, D. Kim, K. Aygun, Z. Qian, et al., 'Embedded multi-die interconnect bridge (EMIB) - a high-density, highbandwidth packaging interconnect,' IEEE/ECTC Proc., May 2016, pp. 557-565.
- J. H. Lau, T. J. Tseng, 'Cu-Cu Hybrid Bonding Bridges,' Patent No. TW 1848577, US Patent: filed on Oct. 20, 2022.
- J. H. Lau, C. Ko, P. Lin, T. Tseng, R. Tain, H. Yang, 'Package Structure and Manufacturing Method Thereof,' US Patent No. 11,410,933, patent date: Aug. 9, 2022, filed on May 7, 2021.
Biography
John H. Lau is a Senior Special Project Assistant at Unimicron Technology Corporation, Taoyuan City, Taiwan (ROC). He has more than 40 years of R&D and manufacturing experience in semiconductor packaging, 532 peer-reviewed papers (a principal investigator on 383), 52 issued and pending US patents (a principal inventor on 36), and 24 textbooks. He is an ASME Fellow, IEEE Fellow, and IMAPS Fellow. He earned a PhD degree from the University of Illinois at Urbana-Champaign. Email John_Lau@unimicron.com
Wafer-level testing of TMR sensors using 3D magnetic field excitation
By Siamak Salimy [Hprobe]
agnetic sensor integrated circuits (ICs) have become fundamental components in modern electronics, enabling precise detection of position, speed, current, and orientation. Among the available technologies, tunnel magnetoresistance (TMR) sensors have emerged due to their exceptional sensitivity, low power consumption, and compatibility with complementary metaloxide semiconductor (CMOS) integration. Over the past decade, TMR sensors have transitioned from research prototypes to mainstream industrial, automotive, consumer, robotics, and medical applications. Their high signal-to-noise ratio and superior linearity, compared to Hall, anisotropic magneto-resistance (AMR), or giant magneto-resistance (GMR) sensors, make them particularly attractive for precision applications, although these advantages also introduce significant challenges for wafer-level testing. Indeed, TMR devices require precise control of 3D magnetic fields with specific orientations, magnitudes and uniformity on the wafer, creating both technical and throughput constraints for sensor manufacturers, semiconductor foundries, and test equipment providers. Scope of magnetic sensor technology M dependent resistance between current and magnetization, providing higher sensitivity than Hall sensors and finding use in navigation, automotive wheel speed detection, and compass applications. However, their linearity and noise performance are inferior to more advanced technologies such as GMR and TMR. GMR sensors use thin-film multilayer structures where resistance shifts under magnetic fields due to a spin-dependent effect, offer improved sensitivity compared to AMR, and are widely used in hard-disk read heads and industrial applications, though their output remains lower than that of TMR [3]. Finally, TMR technology based on magnetic tunnel junctions (MTJs) is the latest technology and consists of two ferromagnetic layers (free and reference) separated by an ultra-thin insulating barrier, typically MgO. When a bias voltage is applied, electrons tunnel through the barrier, with conductance determined by the relative alignment of magnetizations in the free and reference layers. In the parallel configuration, resistance is lower, however, when the magnetization vectors between the two ferromagnetic layers have an angle, the resistance becomes lower while the angle increases as illustrated in Figure 1. The resulting magnetoresistance ratio can exceed 100%-significantly higher than AMR or GMR-providing a large output with low noise and enabling detection of fields as small as a few micro-tesla.
TMR sensor market and applications
The market outlook for TMR sensors reflects rapid growth driven by the increasing adoption of automation, electrification, and connected devices. The global magnetic sensor market, valued at approximately USD $3 billion in 2023, is projected to expand at a compound annual growth rate (CAGR) exceeding 4% through 2028, with TMR sensors emerging as the fastestgrowing segment because of their high sensitivity, scalability, and integration potential [4].
TMR sensors find applications across multiple sectors [5-8] due to their high sensitivity, low power, and precision. In industrial environments, they are fueled in demand in motor control, precision encoders, and current measurement, where their ability to maintain stable performance under temperature fluctuations and lowpower electromagnetic interference ensures reliable operation in factory automation, energy systems, and renewable energy inverters. The automotive sector is a major driver, with the transition to electric vehicles and advanced driver-assistance systems (ADAS) creating demand for highaccuracy sensors in electric power steering, traction motors, battery management systems, wheel speed detection, gear-shift monitoring, and in-cabin features.
Figure 1: Illustration of a TMR sensor.
The landscape of magnetic sensor technology in silicon ICs includes several distinct approaches. Hall sensors rely on the deflection of charge carriers in a semiconductor exposed to a magnetic field [1]. Similar to other CMOS-compatible magnetic sensing technologies, it is associated with application-specific ICs (ASICs) in a cost-effective manner for many applications, including wide use for position and current sensing in lowto-medium accuracy applications, even though they are subject to drift under temperature and mechanical stress [2]. AMR sensors exploit the angle- Consumer electronics also benefit from TMR sensors, which are used in smartphones, wearables, and tablets for low-power electronic, compass, orientation detection, gesture recognition and augmented reality applications. Robotics applications include collaborative robots in manufacturing and service environments, where precise joint position feedback ensures smooth and safe human interaction, high-resolution encoders improve motion control in robotic arms and mobile platforms. In medical devices, additionally, TMR sensors enable highly-sensitive detection of magnetic fields from the human body and muscles [9] Collectively, these applications highlight the versatility of TMR technology and its suitability for precision and safety-critical markets.
WLT of TMR sensors
Despite the strong application range and market outlook, wafer-level testing of TMR sensors presents significant opportunity. Unlike Hall or AMR devices, which require relatively small- to mediumfields, TMR sensors operate at microtesla to hundred millitesla levels, necessitating highly-precise and uniform magnetic fields to sort wafers. During testing, two regimes of magnetic field are required to extract the resistance dependance of the MTJ versus magnetic field. A minor loop, generally for a field in the range of few tens of millitesla is required to extract the linear response of the sensor under magnetic excitation. This minor loop requires an extremely well-controlled and high-precision magnetic field and is followed by measurement of a major loop curve so as to ensure the sensor is brought into its magnetic saturation using a magnetic field up to several hundred of millitesla. Depending on the technology and use cases, the TMR sensors can operate in an in-plane mode (with the magnetic field vector oriented parallel to the chip) and also as 3D angular sensors where an additional challenge in testing is required in order to meet the need of providing a 3-axis (X,Y,Z) controlled vectorial magnetic field.
In advanced probe systems for semiconductor applications, the waferlevel test is based on an automated wafer probing station, which is the equipment that handles and aligns the wafer to bring it to the position of test. Contact probes then land on dedicated pads on the wafer and the device under test (DUT) is electrically probed using automated test equipment (ATE). For magnetic sensors, a magnetic field vector has to be associated with the ATE-and because the wafer is placed on a metal chuck in the probing chamber, only the upper half space becomes available, thereby constraining the strategies for providing a magnetic stimuli to the sensor by using a projected field approach.
The requirements on the magnetic field excitation for TMR sensor wafer-level testing are complex and there is a need to balance characteristics that are going against each other. Indeed, the demands of field accuracy, field range, fast-sweeping capability, and parallelization are further intensified by the requirement to maintain large, uniform field areas during waferlevel testing.
Achieving field accuracy at wafer level during the minor loop can be particularly challenging because various parasitic effects interfere with the applied magnetic excitation. The metallic environment of the prober chamber, the conductive or magnetic materials of the probe card, and even small misalignments in wafer positioning, can all distort the amplitude and orientation of the applied field through shielding, eddy currents, or geometrical offsets. To counter these distortions, closed-loop calibration methods that employ in situ field sensors are typically required, together with precise mechanical positioning systems and careful engineering of the surrounding structures to minimize field perturbations.
Throughput considerations further impose the need for fast sweeping capabilities. Rapid, reproducible, and linear field sweeps are essential in manufacturing environments. Achieving such dynamic performance requires careful suppression of eddy currents in the test chamber. Parallelization of test is often the right strategy for wafer-level test. Indeed, to increase productivity, many devices must be tested simultaneously using probe cards integrated with the magnetic excitation system. Probe cards, however, often contain conductive or magnetic elements that perturb the applied field, introducing shielding effects, eddy current formation, and flux leakage. Ensuring field uniformity across multiple test sites therefore demands a co-design approach in which the electrical and magnetic requirements of the system are addressed together.
Taken as a whole, the interdependent requirements discussed above highlight the combined challenge of TMR wafer-level testing. Speed, field strength, accuracy, and spatial uniformity must all be realized simultaneously-yet improvements in one parameter often come at the expense of another. Increasing the field strength uniformly over a large area, for example, may reduce the achievable sweep speed or demand higher power consumption and cooling capacity. Similarly, raising sweep frequencies can diminish accuracy by amplifying eddy current effects, while optimizing uniformity across the wafer often necessitates trade offs in field range or dynamic response. The overarching task is, therefore, to engineer test systems that balance these competing demands in a way that enables reliable, high-throughput waferlevel characterization of TMR devices.
Dedicated magnetic test instrument for TMR sensors
To address the challenges noted above, we have developed dedicated magnetic test instruments designed to provide preciselycontrolled magnetic excitation for TMR and related magnetic sensors during waferlevel probing. Depending on the target application-research and development, single-cell parametric characterization, or full sensor-IC production test-a suitable magnetic test head model may be mounted on a wafer prober and integrated with automated test equipment (ATE) platforms. The heads embed our proprietary 3D magnetic field generator technology that enables projection of vectorial magnetic fields on the TMR sensor under electrical probing. The system operates as an arbitrary waveform generator of threedimensional magnetic vectors, with independent control over the X, Y, and Z components of the field.
Different versions of the magnetic generator are optimized for various specifications to cover. Some are engineered to maximize in-plane field strength (in the X-Y directions), others prioritize out-of-plane (Z) fields, and still others deliver balanced three-axis control as illustrated in Figure 2. Generator heads of different sizes are available to support ultra-fast field sweeping (high dB/ dt), to maximize uniform field area over large surfaces, or to achieve fine angular accuracy in 2D or full 3D operation. Typical field strength ranges include lowfield regimes down to ~1mT, and high-field operations up to ~200mT along each axis in full 360° vector space. In single-axis mode, configurations can reach ~650mT in the perpendicular direction or ~500mT in parallel (in-plane) directions, with 1D, 2D, or 3D waveforms that are user defined.
Figure 2: Representation of Hprobe 3D magnetic generator configurations.
To guarantee precision, each generator is paired in the test head with an automated field calibration unit (FCU), integrating a calibrated 3D-Hall probe located at the exact device-under-test (DUT) position. The FCU enables calibration of the three components of the magnetic vector, and automatically compensates residual fields originating in the chamber or from external sources (including the Earth's field). Demonstrated accuracy and repeatability reach better than ten microtesla for field patterns under test.
The magnetic instrument is offered as a turnkey solution for wafer-level probing and can be interfaced with commercial ATEs or custom test systems, suitable both for R&D and volume manufacturing. It is controlled via SCPI commands over TCP/IP so that magnetic excitation is synchronized with electrical testing. The heads are designed to work with standard cantilever or vertical probe cards, constructed without magnetic materials, and are compatible with large probe needle counts, temperature ranges from about -40°C to +200°C. For production deployment, the system includes field monitoring and drift control, with user-definable limits to ensure that applied magnetic fields remain within specification over time.
Biography
Siamak Salimy is CTO and co-founder of Hprobe, Eybens, France-a spin-off from Spintec, established in Grenoble in 2017 and acquired by Mycronic AB in 2025. Prior to leading Hprobe product and technology roadmap, he developed test and fabrication processes on several semiconductor technologies (CMOS, BCD, MEMS, Sensors, RF, and Spintronics) at Atmel and Teledyne Semiconductor. He holds a PhD from the University of Nantes and is Engineer from Polytech Nantes. Email Siamak.salimy@mycronic.com
Summary
The rapid evolution of TMR technology has positioned it as a cornerstone of next-generation magnetic sensor systems, enabling unprecedented levels of precision, linearity, and energy efficiency across industrial, automotive, consumer, robotics, and medical applications. However, these advantages come with demanding wafer-level test requirements - the need for accurate, stable, and fully vectorial magnetic field control across large wafer areas, combined with high throughput and tight integration with automated test equipment. Traditional test methods, originally developed for Hall or AMR devices, cannot meet these combined criteria for accuracy, dynamic range, and reproducibility.
We have addressed this opportunity through our dedicated magnetic test instruments, engineered specifically for wafer-level testing of advanced magnetic sensors. By integrating proprietary 3D magnetic field generator technology with automated calibration and field compensation, our systems provide control of magnetic field amplitude, direction, and uniformity. Their architecture allows arbitrary waveform generation in three axes, enabling both minor- and major-loop characterization within the same test flow. The result is a fully-programmable, high-speed magnetic excitation platform that ensures measurement fidelity, repeatability, and production scalability.
Our solutions provide field accuracy down to the microtesla level, compatibility with all major ATE platforms, and proven robustness from R&D to high-volume manufacturing. They bridge the gap between laboratory characterization and industrial production, empowering sensor developers and foundries to deliver highperformance magnetic ICs to market.
References
- https://www.hprobe.com/sensortest/
- S. Fischer, J. Wilde, 'Modeling package-induced effects on molded Hall sensors,' IEEE Trans. on Advanced Packaging (2008), 31. 594 - 603. 10.1109/TADVP.2008.924241.
- S. Yan, Z. Zhou, Y. Yang, Q. Leng, W. Zhao, 'Developments and applications of tunneling magnetoresistance sensors,' Tsinghua Science and Technology (2021), 27. 443-454. 10.26599/ TST.2021.9010061.
- https://www.yolegroup.com/ strategy-insights/a-new-milestonein-the-tmr-industry/
- https://www.micronas.tdk.com/ en/technologies/about-tmr-anglesensors
- https://www.allegromicro.com/en/ products/emerging-technologies/tmr
- https://www.infineon.com/ products/sensor/magnetic-positionsensors#about
- https://www.bosch-sensortec. com/produc t s /mot ion- sensor s / magnetometers/
- S. Zuo, H. Heidari, D. Farina, K. Nazarpour, 'Miniaturized magnetic sensors for implantable magnetomyography,' Adv. Mater. Technol. 2020, 5, 2000185 https:// advanced.onlinelibrary.wiley.com/ doi/10.1002/admt.202000185
Global No.1 Total Test Solution Provider
Capable of Mass Production : From Validation To SLT
HEAD OFFICE
26, Geumto-ro40beon-gil, Sujeong-gu, Seongnam-si, Gyeonggi-do, Republic of Korea
CONTACT
sales@isc21.kr +82 31 777 7675 www.isc21.kr
Impact of wave front phase imaging on semiconductor metrology challenges
By Miguel Jimenez-Gomis, Marco Franchi [Wooptix]
ave front phase imaging (WFPI) [1] is a fast, high-resolution shape metrology technique that provides the semiconductor industry with muchneeded geometric data on wafers built on silicon or other substrates. As described in Figure 1, light disturbance at position (x,y) can be described as a complex field U(x,y)=A(x,y)e , where A(x,y) is known as amplitude, and φ(x,y) is known as the wave front phase. Phase relates to the spatial distribution of the light disturbance across it; for example, in an W undisturbed flat wave front, all points have the same phase (like a flat wave), while a curved wave front means the phase varies smoothly across it (e.g., spherical). Unlike traditional interferometry techniques, WFPI directly looks at the wave front of the light reflected (or transmitted) out of the surface to quickly capture its shape by analyzing the change in its phase. WFPI works by capturing two images, I1 and I2, around a conjugated plane of the reflective sample with symmetric positions (in front of and behind the reflective sample) with a total distance between the images equal to 2×Δz, as illustrated in Figure 2. A collimated light beam, with an assumed flat phase map, is generated from a non-coherent light source using a light-emitting diode (LED) with a 590nm wavelength and an undisturbed wave front phase (φ = 0). In principle, any type of light can be used, but noncoherent light has the advantage of not producing speckle scattering. The light beam with φ = 0 passes through lens L3 and is then reflected on the beam splitter, changing direction by 90°, passing through lens L2 and then lastly passing through lens L1 (the main lens, with a 310mm clear aperture) to generate the collimated light beam with the same size, or larger, than the sample being measured, which then hits the silicon wafer.
Figure 1: WFPI technology methodology.
Figure 2: WFPI captures two images around a conjugated plane of the reflective sample with symmetric positions-with a total distance between the images equal to 2×Δz.
The collimated light beam is then reflected off the silicon wafer, which modifies the shape of the collimated beam, thereby generating a distorted outgoing phase map (φ ≠ 0) proportional to the silicon wafer surface. The imaging plane, P, of the reflected light is then translated into a conjugated plane, P', after the distorted phase map passes through lens L1 (the main lens) and lens L2. Finally, it passes through the beam splitter without changing direction, being recorded by one or more digital image sensors, which acquires the two required intensity images, I1 and I2. These intensity images are acquired around the conjugated plane P' in equidistant planes distanced Δz along the z-axis from the conjugated plane. Choosing focal lengths of L1 and L2 appropriately allows for adjusting the sample size to the image sensor size. Using these captured images and utilizing a patented phase recovery algorithm from Wooptix, we can retrieve a high-resolution shape of the reflective surface.
Applications of WFPI in the semiconductor industry
Using the capability of retrieving a high-resolution shape, WFPI technology can characterize the shape of silicon (Si; or other substrate) wafers in a single shot, providing the full dataset in less than one second. This provides the industry with real-time characterization capabilities of the shape [2]. An example of this capability [3] is the characterization of bare and patterned wafers for inline metrology (see Figure 3). In this example, we show a 200mm patterned silicon wafer developed using a bipolarCMOS-DMOS (BCD) process (where CMOS=complementary metal-oxide semiconductor, and DMOS=doublediffused MOS) with 0.35µm technology using three metal layers. It was fully measured providing insight on the warpage deformation or the measure of a 300mm bare Si wafer (before starting any process), enabling engineers to verify whether its shape is valid for the next manufacturing steps. This was measured in a configuration with a lateral resolution of 65µm per pixel, which translates to a full resolution of more than 7 million data points for the 200mm wafer, and more than 16 million data points for the 300mm wafer.
As the semiconductor industry advances, engineers have found ways to insert more layers into the chip as well as new architectures, thereby surpassing the limits of what was previously possible. The industry, therefore, is facing an increase in demand for improved process control in high-volume manufacturing, especially with the increase in production of artificial intelligence (AI)-specific chips, using the latest innovations in chip design. This includes new manufacturing methods, such as hybrid bonding, and new architectures, like 3D stacking for dynamic random access memory (DRAM) or backside power delivery networks (BSPDN) for logic.
Multiple layers applied during the various processes, however, pose significant challenges to the wafer itself and may deform it-damaging the potential chip yield and potentially adding substantial costs in time and investment. Only 50µm to 100µm of distortion can pose significant challenges to the lithography area. This is especially true if, before the lithography step, there's the additional step of bonding, which can add uncertainties to the warpage balance. In this context, it's fundamental to bring a new approach to wafer shape metrology with a 'feed-forward' methodology (see Figure 4) that gives additional information regarding the distortion budget and provides the lithography engineer with all the data needed.
The WFPI system can characterize wafer shape at all the process steps that may create warpage or stress on the wafer; just one example is the deposition area or the bonding itself, where alignment position is critical and warpage balance can compromise it. The other great advantage of WFPI technology is that it can measure blank, patterned and bonded wafersand the data from the system provides fab and yield engineers with the ability to pinpoint the origin of misalignment errors. In addition, the WFPI system is not limited to 300mm wafers because the technology can be scaled to other wafer dimensions (200mm, 150mm) and different substrates that will become increasingly important for the industry, such as gallium nitride (GaN), silicon carbide (SiC), gallium arsenide (GaAs) or glass [4], thereby allowing for greater flexibility.
High-speed capabilities with WFPI
New metrology capabilities are continuously being developed to satisfy the needs of the industry-including the capability to increase the system throughput each time, so that the capex allocation can be optimized for customers. WFPI is developed also for that-a system providing ultrafast and extremely accurate wafer shape and geometry measurements with sub-nanometer height resolution. As mentioned, the system can capture the shape of silicon wafers (or other substrates) in a single shot, providing the full dataset in less than one second, so that the measurement step will not negatively impact production time or prevent expanding the potential of warpage metrology to reach new levels. The next step now is to bring WFPI up to speed with all the possible technologies in the fab and to also use it for macro-inspection purposes.
Figure 3: In-line metrology data of patterned and blank wafer utilizing: a) (left) More than 7 million data points for the 200mm wafer; and b) (right) More than 16 million data points for the 300mm wafer.
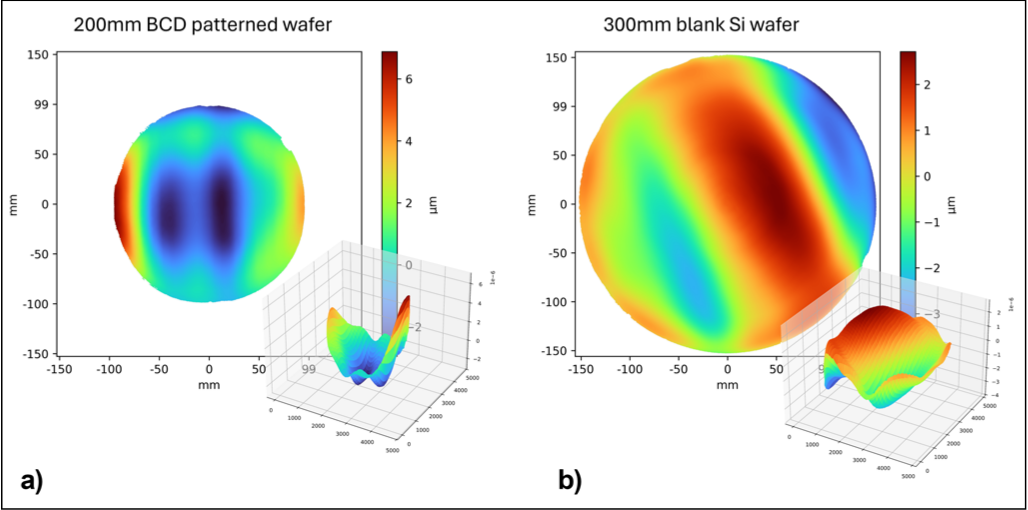
Figure 4: The 'feed-forward' methodology provides additional wafer data before important and costly process steps.
WFPI for advanced packaging
The WFPI technique also has the required flexibility to increase its resolution as metrology needs grow more demanding. For example, for novel 3D integration techniques-such as die-to-wafer or die-to-die bondinga higher resolution for knowing the shape of the die is needed. With a modification in the optical setup, WFPI can push the lateral resolution of the system down to 7.5µm, or even further [5-6]. This capability is demonstrated in Figure 5, where a die-to-wafer bond was scanned to measure the shape distortion generated by each bond. In the samples, one out of four copper (Cu) pads has a die bonded on top, which significantly impacts the overall shape of the local area of the wafer. This exemplifies the challenge to increase yield or optimize alignment when the substrate is changing with each bond, so a detailed characterization of its shape surface is critical.
Figure 5: WFPI can push the lateral resolution of the system down to 7.5µm, or even further.
Summary
The WFPI technique is showing great potential, both in terms of full wafer detection (300mm field of view) and reduced field of view, as well as increased lateral resolution-giving precise results with very low acquisition time. In addition, the technology can be further improved and applied to other substrates (glass, SiC, GaN) to inspect those materials and help characterize their warpage and other properties.
The real advantage of WFPI is that the technology is only limited, as of today, by CMOS camera sensors, so it can further be improved to achieve even higher lateral resolution within the same timing and with the same compact footprint. This enables the semiconductor industry to solve new challenges, such as emerging hybrid bonding or BSPDN logic solutions.
References
- J. M. Trujillo-Sevilla, A. RoquéVelasco, M. Jesús Sicilia, et al., 'Wave front phase imaging for silicon wafer metrology,' Proc. SPIE 12216, Novel Optical Systems, Methods and Applications XXV, 1221605 (3 Oct. 2022), doi:10.1117/12.2632499.
- J. M. Trujillo-Sevilla, R. Abrante, M, Jiménez, et al., 'New wafer shape measurement technique for 300mm blank vertically held silicon wafers,' Proc. SPIE 12618, Optical Measurement Systems for Industrial Inspection XIII, 126182X (15 Aug. 2023), doi:10.1117/12.2674201.
- J. O. Gaudestad, M. Jiménez, K.I. Kurtev, et al., '3D Shape measurements of patterned silicon wafers,' 35th Annual SEMI Advanced Semi. Mfg. Conf. (ASMC), 2024, Albany, NY, USA, 01-06, doi:10.1109/ ASMC61125.2024.10545453.
Biographies
Miguel Jimenez-Gomis is a Senior Application Engineer at Wooptix, Santa Cruz de Tenerife, Tenerife. He has worked closely to further develop and integrate the company's metrology systems into industry processes. As an application expert in semiconductor industry metrology, he guides the adoption of novel metrology solutions provided by Wooptix into the most advanced processes to keep pushing the technology forward. Email m.jimenez@wooptix.com
Marco Franchi is a Technical Marketing Manager at Wooptix, Madrid, Spain. He guides customers through the company's technologies and explains how they can improve their workflows. Marco is a chemical engineer with more than seven years of experience in the semiconductor industry and previously worked at Tokyo Electron, Ltd. (TEL).
- M. Jimenez-Gomis, J. TrujilloSevilla, S. Pauliac-Vaujour, et al., 'Novel characterization of borosilicate transparent wafers by using wave front phase imaging,' Proc. SPIE 13329, Quantitative Phase Imaging XI, 133290L (19 March 2025), doi:10.1117/12.3042976.
- K. Ivanov-Kurtev, J. M. TrujilloSevilla, J. M. Rodríguez-Ramos. 'Stitching-based resolution enhancement in wavefront phase measurement of silicon wafer surfaces,' Appl. Sci. 2025, 15, 1019, doi:10.3390/app15031019.
- M. J. Gomis, K. Ivanov-Kurtev, J. M. Trujillo-Sevilla, et al., 'Enabling 3D integration: Full pattern wafer die shape characterization using wave front phase imaging at 8μm lateral resolution,' 36th Annual SEMI ASMC, 2025, Albany, NY, USA, 1-4, doi:10.1109/ ASMC64512.2025.11010472.
Impact of die-attach voids on the thermal performance of clip-bonded packages
By Ilyas Dchar, Ding Yandoc [Nexperia]
n a clip-bonded package, dieattach solder is one of the key contributors to the overall thermal resistance of the package. The presence of solder voids formed between a semiconductor die and the lead frame can have a significant impact on the thermal performance of packaged devices. Any degradation of the heat flow path in the package may result in semiconductor overheating and potentially lead to premature failure of the device. Studies of thermal impact due to die-attach voids are essential for improving device performance and reliability. This paper presents numerical and experimental investigations conducted on clip-bonded metal-oxide semiconductor field-effect transistor (MOSFET) devices that provide vital information on the effect of solder void patterns on the thermal performance of clip-bonded packages. The data in this study quantitatively assesses the role of voids in package thermal management, and in improving the overall performance of clip-bonded devices. I
Background
Clip-bonded MOSFET packages are extensively used in automotive applications because of their lower electrical resistance and better thermal dissipation [1]. Compared with traditional packages based on wire bonds, clip-bonded packages have obvious advantages in product performance because they can offer significant improvements to MOSFET electrical and thermal properties, including increased maximum current capability, improved RDSon, lower parasitic inductance, and lower thermal resistance (Rth). During the last few years, clip-bonded MOSFET packages have achieved a mature technology status, and have been widely introduced to high-volume manufacturing. In a typical structure of a clip-bonded MOSFET package (Figure 1), the silicon die is soldered to the lead frame (die paddle or drain tab) to provide a low thermal resistance path to the printed circuit board (PCB). Moreover, copper clips are soldered in a single operation to the gate and source terminals of the die to provide power connections to the package. Finally, a mold compound is used to protect the die and the interconnects from any external contamination.
In a clip-bonded package, the dieattach layer is one of the primary contributors to the overall thermal resistance of the package. During the manufacturing process of the package, it is well known that voids are almost inevitable in solder joints. Solder voids formed between the power die and lead frame during the solder reflowing process are major challenges in the die bonding process and are detrimental to a package's thermal, mechanical, and reliability performance [2]. Previous studies showed that the mechanism of solder voids was generally caused by the outgassing of entrapped flux in solder paste and fluxing reactions during the solder reflow process [3]. Voids in the die-attach material can generally be categorized into two groups: 1) Small multiple voids; and 2) Large single voids [4]. These different groups of voids have differing impacts on the thermal performance of devices. Many papers have been published on the precise effect of small multiple voids, and large single voids on the thermal performance of power devices. For instance, Fleischer, et al. [4], used finite element analysis (FEA) to explore the thermal impact of voids on chip-scale packages (CSPs). The results showed that single large voids have a greater impact on the device's thermal resistance than small, multiple voids. Chang, et al. [5], investigated the effect of solder void patterns on the thermal resistance of power devices using finite element modeling. Their findings suggested that single large solder voids had more significant effects on the thermal impedance of power devices than small, multiple solder voids.
Although the aforementioned studies provide important information on the relationship between package thermal performance and solder void patterns, little data exists concerning the precise impact of void patterns on the thermal performance of clip-bonded devices. The present study presents numerical and actual experimental investigations that allow an in-depth analysis of the effects of die-attach solder voids on the thermal performance of clip-bonded MOSFET packages. Our investigation is organized as follows: 1) Numerical and experimental methodologies; 2) Numerical and actual experimental results illustrating the impact of solder void patterns on the thermal performance of clip-bonded packages; and 3) Summary.
Methodology
The following sections discuss the numerical and experimental analyses we used.
Figure 1: Typical structure example of a clip-bonded package.
Numerical analysis. To analyze the effect of solder void patterns on the thermal performance of clip-bonded packages, a numerical simulation for clip-bonded packages was developed in ANSYS. The finite element model shown in Figure 2 contains five parts: 1) A silicon chip, 2) Clip bond interconnection, 3) Drain tab (die paddle), and 4-5) Two solder layers (clip and die attach). Simulations were carried out by using two patterns of void: Either a single large void, or multiple smaller voids (Figure 3).
Figure 2: Model of a clip-bonded MOSFET package used for thermal simulation.
Figure 3: Example of die-attach solder void patterns used for thermal simulation of the clip-bonded package: a) 10% single large void; b) 10% multiple smaller voids.
The solder voids were modeled as 'solid vias' through the die-attach layer. The voids were treated as air-filled cavities. The material properties used in the thermal analysis are listed in Table 1. The thermal resistance Rth (J-C) was defined as the temperature difference (Tj-Tc) from the junction to the case of
Table 1: Material properties used for thermal simulations of a clip-bonded package.
| Material | Thermal Conductivity (W/m.K) |
|---|---|
| Copper Leadframe | 400 |
| Silicon die | 130 |
| Solder paste | 59 |
| Mold compound | 0.85 |
| Solder Voids | 0.026 |
the package divided by the power dissipation P [6]. Rth was estimated using the following equation:
Where Tj is the junction temperature of the die, Tc is the case temperature, and P is the power dissipation.
The voiding percentage from 5 to 20% was chosen as the level of interest for simulation. Values of Rth (J-C) for each voiding pattern were calculated to assess their impact on the thermal response of the package.
Figure 4: Cross-section of clip-bonded devices with different single-void sizes (5%, 20%, 40% and 60%).
Experimental analysis. In addition to the simulation, test specimens were assembled by using different percentages of a single large void pattern to investigate their thermal effect in the clip-bonded package. Because it is very challenging to practically control the exact void percentage, a novel method has been developed whereby a percentage of the single large void was introduced by using a transparent adhesive tape that was attached to the top of the lead frame before solder printing. During the solder reflow process, the tape resulted in the formation of a single large void within the die-attach equivalent to the size of adhesive tape. The void percentage was estimated before the thermal measurement using an X-ray inspection to define the void levels. The void % was defined as the total void area divided by the total solder area. Figure 4 shows examples of cross sections for clipbonded devices numbered A, B, C, and D, respectively. The void percentages of the four samples are 5%, 20%, 40%, and 60%, respectively.
The selected clip-bonded MOSFET devices were then tested by using T3Ster equipment (thermal transient tester). The tested samples were soldered to PCB boards and placed in a thermal chamber to ensure a constant temperature. The power supply was used to heat up and apply the power step to devices. The T3Ster was then used to get the structural function and extract Rth of different samples.
Figure 5: Thermal simulation showing the effect of die-attach solder voids on Rth based on different void patterns.
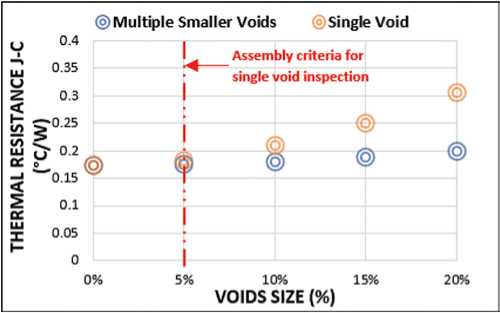
Results and discussion
The thermal simulation data are given in Figure 5. For a void percentage below 5%, it was found that the increase in Rth is very small for both patterns of void (single large void and multiple smaller voids). As the void percentage increases, Rth increases, and a distinct difference in thermal behavior can be seen for multiple smaller and single large void patterns. Above 5% voids, it has been observed that the single large void results in a much higher increase in Rth. When the void percentage exceeds the assembly criteria for a solder void (5%), Rth increases rapidly for the single void pattern. For an equivalent void percentage of 20%, the thermal resistance for multiple smaller voids increases to a maximum of 0.2°C/W, while large single voids result in a much higher increase in Rth of 0.3°C/W. Furthermore, the single void type also exerts a strong influence on the behavior of the chip temperature. As shown in Figure 6, the increase in junction temperature for a 20% void is 9% for a single void and 1.85% for multiple smaller voids. The junction temperature increases significantly with the increase of the single-void percentage. As for thermal resistance, the rise of the junction temperature is much higher for a single void than for multiple smaller voids.
The simulation image shown in Figure 7 is an example of a 10% single large void resulting in the hottest spot at the chip center and cooling towards the edges of the chip. In comparison, 10% of multiple smaller void patterns resulted in a series of hot spots with lower temperatures on the chip surface.
As shown in Figure 8, larger single voids result in a much larger increase in the overall Rth due to the effect of thermal spreading resistance. For chips with voids in the die-attach area, spreading resistance becomes dominant as the heat is forced to flow laterally in the chip around the void region [7]. For the same voiding percentage, the lateral resistance is much higher for large single void patterns because the heat flows laterally for a much longer distance than in multiple smaller void patterns.
Figure 9 shows an example of measured Rth (J-C) and Zth (J-C) for clip-bonded devices using different percentages of a single large void (from 5% to 60% void). The results in Figure 9 show that any increase in the single voids percentage is accompanied by an increase of Rth (J-C) and Zth (J-C) resulting in a decrease in the thermal performance of the package. For a given void percentage of 60%, Rth increases to a maximum of 1.38°C/W, representing a 557% increase. As the void percentage exceeds the 5% void limit (Figure 9b), it has been observed that the thermal resistance of single large void patterns increases exponentially. The same trend obtained in Figure 9b can also be correlated with the simulation results shown in Figure 5 for a single void pattern.
Figure 6: Thermal simulation showing the effect of die-attach solder voids on temperature rise of the silicon die based on different void patterns.
Figure 7: Example of a thermal simulation illustrating the chip surface temperature distributions for a 10% large single void and 10% multiple small voids.
Figure 8: Illustration of heat flow paths. The left side of the figure shows a single large pattern with one unified void (indicating a localized, continuous void region). The right side of the figure represents several small patterns with multiple voids, thereby illustrating distributed clusters of small voids across separate pattern areas.
Figure 9: Thermal measurements were conducted on samples with different single voids sizes: a) Thermal impedance; and b) Thermal resistance.
Summary
Solder voids formed between the semiconductor die and lead frame during the solder reflow process are a major challenge in the die bonding process and detrimental to the thermal and reliability performance of a clip-bonded package. Although the relationship between package thermal performance and voids has been examined extensively, different study approaches may be needed to validate and understand the precise effects of void patterns on the thermal performance of clip-bonded devices. The present study allows numerical and experimental investigations of those effects. The results show that for large and multiple smaller voids, the thermal resistance of clip-bonded packages increases with void volume percentage. However, it has been observed that for an equivalent void percentage, large single voids can greatly increase the thermal resistance of the package compared to multiple smaller voids. The findings from this investigation suggest that the thermal performance of clip-bonded devices is a function of the void pattern. More attention should be given to single large void patterns, which must not exceed the 5% limit during solder joint inspection in manufacturability of clip-bonded products.
Biographies
Ilyas Dchar is a Principal Package Engineer at Nexperia UK, Stockport, U.K. He received his Engineering and PhD degrees from INSA Lyon, France, in 2013 and 2017, respectively. His expertise lies in electronic packaging, with a particular emphasis on silicon power MOSFET discrete devices. He is the inventor of six filed patents in packaging technologies and has authored multiple international technical publications. Email ilyas.dchar@nexperia.com
Ding Yandoc is the R&D Technical Director at Nexperia UK, Stockport, U.K. He has an Electrical Engineering degree from Adamson University and 31 years of semiconductor industry experience. He is the inventor of the LFPAK and CCPAK power packages-widely recognized innovations in power semiconductors. He currently holds 14 granted patents and 36 published patents in package design and processes.
Acknowledgments
The authors would like to thank their colleagues at Nexperia for their valuable support and contributions to the success of this study. Portions of this article were presented at the Electronics Packaging Technology Conference (EPTC) 2024.
References
- I. Dchar, D. Yandoc, 'Effect of die thickness on the reliability of solder joint in clip-bonded packages,' IEEE 24th Electronics Packaging Tech. Conf. (EPTC), Singapore, Singapore, 2022, pp. 776-779, doi: 10.1109/ EPTC56328.2022.10013243.
- V. A. Chiriac, Y. Yu, 'Impacts of solder voids on PQFN packages' thermal and mechanical performances,' 12th IEEE Intersociety Conf. on Thermal and Thermomechanical Phenomena in Electronic Systems, Las Vegas, NV, USA, 2010, pp. 1-7, doi: 10.1109/ ITHERM.2010.5501269.
- A. J. V. Sadural, L. A. D. Clemente, 'Voiding reduction and lead frame interactions in high-lead solder die attach for QFN applications,' International Conf. on Electronics Packaging (ICEP), Yamagata, Japan, 2017, pp. 372-376, doi: 10.23919/ ICEP.2017.7939398.
- A. Fleischer, Li-hsin Chang, B. Johnson, 'The effect of die attach voiding on the thermal resistance of chip level packages,' Microelectronics Reliability, (2006) 46. 794-804. 10.1016/j.microrel.2005.01.019.
- J. You, B. Zhou, R. Li, G. Li, 'Effects of soldering voids on junction to case thermal resistance in applying electrical testing method,' 10th International Conf. on Reliability, Maintainability and Safety (ICRMS), Guangzhou, China, 2014, pp. 772-776, doi: 10.1109/ICRMS.2014.7107303.
- B. Xun, W. Tian, Q. Xun, G. Zhang, Y. Chen, L. Pang, 'Thermal resistance analysis of power MOSFETs using Creo/ANSYS software versus physical measurements,' IEEE 13th International Symp. on Power Electronics for Distributed Generation Systems (PEDG), Kiel, Germany, 2022, pp. 1- 6, doi: 10.1109/ PEDG54999.2022.9923245.
- K. C. Otiaba, R. S. Bhatti, N. N. Ekere, M. Ekpu, J. Adeyemi, 'Comparative study of the effects of coalesced and distributed solder die attach voids on thermal resistance of packaged semiconductor device,' 17th International Workshop on Thermal Investigations of ICs and Systems (THERMINIC), Paris, France, 2011, pp. 1-5.
DEVICE PACKAGING
22ND INTERNATIONAL CONFERENCE & EXHIBITION ON
SHERATON GRAND AT WILD HORSE PASS·PHOENIX, AZ
MARCH 2-5, 2026·WWW.DEVICEPACKAGING.ORG
The Most Comprehensive Technical Program and Exhibition for Microelectronics and Advanced Packaging
- 19 Professional Development Courses
- 4 Tracks and Interactive Poster Session
- Keynotes from NVIDIA, AMD, Infineon and AGC
- Evening Panel: Addressing Barriers to Co-Packaged Optics
- Student Industry & Career Discovery Activities
Innovative Keynotes
Silicon Photonics Advanced Packaging for Data Center Al Workloads
Future of Al Hardware Enabled by Advanced Packaging Raja Swaminathan, AMD
Power Packaging for Al/Data Center from Grid to Core Thorsten Meyer, Infineon
Post Conference Event - Thursday, March 5 Post Conference Event - Thursday, March 5
SOLD-OUT EXHIBIT HALL Nearly 100 Exhibitors! SOLD-OUT EXHIBIT HALL Nearly 100 Exhibitors!
organized by the International Microelectronics Assembly and Packaging Society (IMAPS)
INDUSTRY EVENTS
ECTC
Summary of the ECTC 2025 special session on hybrid bonding
By Mariia Gorchichko [Applied Materials, Inc./IEEE], Dishit P. Parekh [AMD/IEEE], Benson Chan [Binghamton University/IEEE], Srinidhi Ramamoorthy [Applied Materials, Inc./IEEE]
ver the last decades there has been an increased need for hybrid bonding because it is a key enabler for 3D chip integration-it overcomes the physical limits of traditional 2D scaling. This technique allows for finer, more direct connections between chips, resulting in higher performance, increased bandwidth, improved energy efficiency, and smaller chip packages for demanding applications like artificial intelligence (AI) and high-performance computing (HPC). O
The successful implementation of hybrid bonding in wafer-to-wafer (W2W) and die-to-wafer (D2W) integration schemes is contingent upon several critical factors. These include precise alignment and pristine chemicallyactivated dielectric surfaces for spontaneous covalent bonding at contact. Also included are: Cu expansion through the bonded interface, low Cu diffusion through the dielectrics, and uniform pattern fidelity. Each of these factors presents unique challenges that must be addressed to ensure a reliable and defectfree bond interface.
This paper summarizes highlights from key discussions during the Special Session on hybrid bonding held at the IEEE Electronic Components and Technology Conference (ECTC) 2025, which focused on the evolving requirements and challenges associated with hybrid bonding technologies over the next decade. The session brought together industry experts and academic researchers to examine the critical enablers for successful W2W and D2W hybrid bonding.
Panel speaker presentations
The following sections provide short summaries of the presentations made by panelists in the Special Session on hybrid bonding.
Laura Mirkarimi (Adeia Inc.). Laura Mirkarimi, PhD., is the SVP at Adeia Inc., and leads the research and development of semiconductor technology in hybrid bonding, advanced packaging and thermal management for future generation of electronic products. In her presentation, she stressed the need to have reliable metrology that is tuned to performance. Metrology is required for both pre-bonding and post-bonding processes. As the bonding pitch gets reduced, the need to identify surface defects, topology, wafer and die warp, is important before any parts are joined. Defects that are identified need to be corrected to ensure good yield at joining.
For post-bond metrology, the needs include bond energy, bond voids, and electrical connectivity. The stretch goal is the ability to rework hybridbonded devices. Machine learning will be key to achieving the accuracy and speeds needed to support hybrid bonding in the single-micron scale.
Mirkarimi also noted that DBI ® wafer-to-wafer hybrid bonding is ideal for smaller, high-yielding dielike image sensors, antenna switches and, more recently, 3D NAND. In contrast, DBI ® Ultra die-to-wafer hybrid bonding is suitable for larger die, such as dynamic random access memory (DRAM), microprocessors, graphics processors, and systemson-chip (SoCs). DBI ® Ultra allows known good die to be bonded to other known good die, allowing for highyielding, multi-die stacked 2.5D and 3D assemblies.
Future applications of hybrid bonding are anticipated to include hybrid-bonding of a die directly to the package substrate that contains organic layers. Test vehicles are shown in Figure 1.
Chet Lenox (KLA). Chet is a Fellow in the Industry and Customer Collaboration team at KLA. He discussed how KLA was engaging with customers on development of solutions related to metrology for hybrid bonding. The focus of the work for hybrid bonding will be on surface defectivity, post-chemical mechanical polishing (CMP) copper and dielectric surface profile, pre-bonding wafer and die warpage control, clean singulation with plasma dicing and bonding alignment. He also stressed that with hybrid bonding pitches in the single microns, the ability to see defects gets harder and the processing time increases. Figure 2 shows the challenge of hybrid bonding when compared to the more traditional bonding methods such as µBump, Cu pillar and solder joints. The summary of this is the last number on the lower right in Figure 2, which is 0.001µm for metrology accuracy in hybrid bonding-the resolution to identify the copper recess from the silicon dioxide layer.
Anne Jourdain (imec). Anne Jourdain, PhD, Principal Member of Technical Staff at imec, started by highlighting hybrid bonding (HB) as the technology of choice for enabling high-density, 3D-integration essential to future semiconductor packaging, particularly in applications requiring sub-10µm pitch. Her presentation provided a forward-looking view on the technical evolution and industrial readiness of hybrid bonding. She outlined three distinct HB integration scenarios-D2W, W2W, and dieto-die (D2D)-each with unique challenges and maturity levels. While W2W is already in production for memory stacking, D2W is progressing quickly to enable logicmemory and logic-logic stacking, and D2D is emerging for use in chiplet architectures and repair functions. She emphasized that achieving a tight pitch requires not only extreme alignment accuracy (<50nm), but also process stability across large areas, with Cu protrusion and dielectric planarization being key enablers.
Figure 1: 2.5D and 3.5D evolution in hybrid bonding. SOURCE: Laura Mirkarimi/Adeia Inc.
Figure 2: Hybrid bonding drives increased sensitivity and precision (estimated values). SOURCE: Chet Lenox/KLA
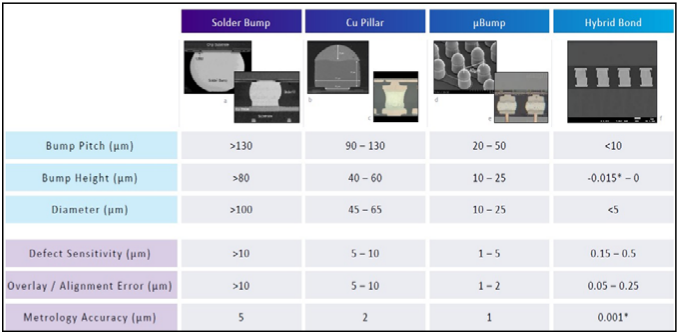
Jourdain's presentation also outlined crucial requirements for the next generation of HB, including scalable wafer-level cleaning, metrology for overlay and protrusion height, and adaptive bonding techniques that reduce warpage and die shift. She highlighted the growing importance of multi-physics simulation and in-line metrology to address HB defects and validate process windows at industrial scale. One key challenge is that D2W surfaces are inherently rougher than W2W due to die thinning and singulation, requiring innovations in singulation and pick-and-place solutions. Concluding her talk, she called for greater collaboration across the supply chain to standardize integration flows and drive HB adoption in logic, memory, and chiplet-based packaging.
Masao Tomikawa (Toray Industries). Masao Tomikawa, PhD, a Senior Fellow at Toray Industries, Inc., presented 'Polymer hybrid bonding: Enabling low-temperature and low-pressure solutions for next-generation packaging.' His presentation addressed the need for alternative bonding materials to conventional inorganic dielectrics in chip-to-wafer (C2W) hybrid bonding applications, particularly for highbandwidth memory (HBM) and 3D integration (Figure 3).
Tomikawa introduced Toray's polymer hybrid bonding (PHB) solution that enables bonding at temperatures below 250°C and under reduced pressure-ideal for minimizing warpage and device damage during processing. He highlighted the drawbacks of conventional SiO2based HB materials, such as particle sensitivity, high thermal stress, and process-induced warpage. In contrast, polymer-based materials, such as polyimides (PI), offer a wide coefficient of thermal expansion (CTE) tunability (5-100ppm/K), superior particle tolerance, and reduced mechanical stress. His presentation included data from bonding trials demonstrating high-yield PI-SiO2 hybrid bonding with alignment accuracy below 2µm and electrical resistance measurements confirming interconnect reliability.
Figure 3: Current issues and solutions from C2W hybrid bonding. SOURCE: Masao Tomikawa/Toray Industries
His presentation also emphasized the critical role of Cu protrusion control and low-temperature Cu diffusion treatment in enabling successful polymer-metal bonding interfaces. The proposed bonding flow is compatible with glass substrates and wet-deposition tools, making it attractive for panel-level packaging. In conclusion, he stated that polymer hybrid bonding is poised to become a key technology in next-generation 3D heterogeneous integration, enabling scalable, low-budget, and thermallyefficient packaging solutions. Toray is actively developing this technology in collaboration with research institutes and industry partners to accelerate its industrial deployment [1].
SuJin Ahn (Samsung). SuJin Ahn, Samsung corporate EVP and the head of Advanced Technology Development Team at Samsung Semiconductor R&D center, noted that hybrid bonding has been successfully expanding in research and commercialization areas for over 15 years (Figure 4). She identified the main challenges for this technology to be related to: 1) Particle monitor and control for yield and reliability, and 2) Warpage control for larger and thinner dies for AI applications.
Ahn also noted that the main sources of particles are wafer dicing, CMP, carrier-based processes, bonding, and Si back grinding. Particles mainly come from chipping, slurry residue, adhesive contamination, and surface debris during the above-mentioned processes. Depending on particle type, it can cause voids of different sizes and introduce issues during assembly processes and reliability implications with latent fails. She pointed out the role of both chip area and chip thickness in controlling warpage-warpage increases with transitioning to large and thin dies, which can be detrimental for chipstacking process. In fact, the die warpage must be contained below 100nm for successful die stacking.
Figure 4: Recent advances of hybrid Cu bonding (HCB) in W2W and D2W. SOURCE: SuJin Ahn/Samsung
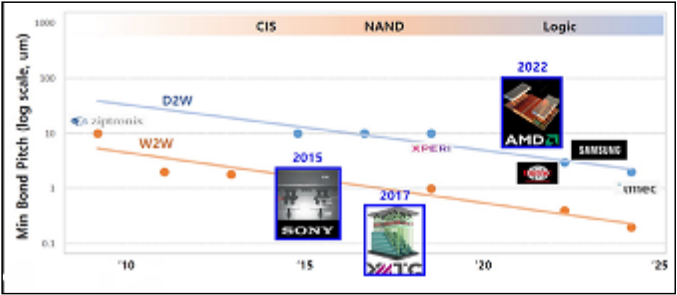
Ahn stressed the role of advanced memory applications in driving commercialization prospects of hybrid bonding for the near future. She referred to Yole's finding that projects an 18% compound annual growth rate (CAGR) for hybrid bonding technology products driven by applications like 16-high HBM, 3D NAND and 3D vertically-stacked DRAM, while overall advanced packaging is projected to have a 13% CAGR by 2029.
Brett Wilkerson (AMD). Brett Wilkerson, AMD fellow, who helped develop packaging innovations such as AMD's 3D V-Cache™ and elevated fan-out bridge (EFB) architectures, emphasized the need for innovation towards simplified processes to reduce
Figure 5: Linear interconnect density vs. connectivity capability as the industry integrates third-party chipsets. SOURCE: Brett Wilkerson/AMD
cost and increase market penetration of hybrid bonding. As 3D stacking inherently generates thermal dissipation challenges, Wilkerson pointed out the need for transient thermal analysis of heterogeneous structures, as opposed to steady-state analysis to help designers create thermallyrobust systems. He also noted the increase in thermal resistance of hybrid and fusion bonding films that are in the critical heat path and the need for
innovation in this direction.
Wilkerson posed a question about transitioning from custom system design. He mentioned that chiplet modules are complex and require powerful design tools. To integrate third-party chiplets-the main premise of chipletization-hybrid bond intellectual property (IP) standards are needed, including lithography enhancement/ exposure latitude LEF (LEF = Library Exchange Format for through-silicon via (TSV) and copper bumps, routing guidelines, IO specifications and validation, design rule checking (DRC) and layout versus schematic (DRC/LVS) coding, EMIR (electromigration and IR [current * resistance]). This is part of the validation process to confirm the design is performing to specifications) tech files, and verification tools spanning multiple SoCs (Figure 5). Additionally, with hybrid bonding, the time-to-market concerns become one of the limiting factors in adoption.
Discussion
The Q&A session was engaging and highlighted several operational challenges in the participants' hybrid bonding processes. It began with a discussion of failure mechanisms-focusing on various root causes and mitigation strategies. Key points addressed included: 1) The need for hybrid bonding to be considered alongside an understanding of back-endof-line (BEOL) processes; 2) The critical damage caused by a single particle; 3) The identification of copper recess as a failure root cause; and 4) The potential necessity of hybrid bonding rework. The discussion further explored particle-induced voiding and delamination, noting that void size is material dependent and can vary by orders of magnitude, with organic contamination cited as a significant contributor.
Other failure modes detailed were: 1) Copper corrosion; 2) The integration challenges of hybrid-bonded chips into packaging solutions (including the special considerations required for full reticle chips with significant warpage during micro bump die attach); 3) Increased sensitivity to latch-up solutions; and 4) Challenges with compressive thermal behavior. Regarding PI-SiO2 bonding, it was noted that some failure mechanisms of conventional SiO2-SiO2 bonding are not applicable, and that achieving 5-15nm copper protrusion control is easier than copper recess control. Moreover, multiple thermal cycles between room-temperature bonding and subsequent annealing (at over 200°C) were identified as a cause of chip delamination, particularly for larger chips, thereby emphasizing the necessity of warpage control starting from the chip design stages.
A significant part of the discussion then focused on particle contamination mitigation and dicing best practices. One participant inquired about using more sophisticated cleaning approaches post dicing. It was suggested that the transition to plasma dicing, which is practically required for the hybrid bonding process flow, will partially mitigate the generation of particles during dicing (singulation defects). New tools are also being developed specifically for the singulation step using film frame carriers. Although wet cleaning processes are employed to remove singulationcaused defects, continuous evolution and improvement are ongoing. Comparative studies have indicated that comparable yields are achievable with mechanical saw, stealth, and plasma dicing. Plasma dicing, however, produces very clean die edges. Even with plasma dicing, cleaning remains necessary, and developing correct post-singulation cleaning protocols is key. Furthermore, the importance of continuous in-line inspection was underscored as a critical need and opportunity because of pitch scaling and die handling challenges. Adeia's recent publications were cited, demonstrating the feasibility of maintaining electrical connections up to approximately 70µm from the die edge on hybrid-bonded dies without issue.
Metrology for hybrid bonding was a central topic, with participants inquiring about the possibility of conducting metrology assessments, such as warpage control and alignment, during the bonding process. A major concern was the current limitation of confocal scanning acoustic microscopy (CSAM), which is used for void detection, but has a resolution limit of approximately 10µm-often insufficient for detecting voids in contemporary hybridbonded devices. Consequently, this point links to the overarching need for post-bonding metrology to detect sub-micron size voiding at the Cu-Cu interface and the requirement for in situ bonding technology with immediate feedback. Having in situ metrology enables real-time monitoring and control during the bonding process, which are essential for achieving high yield and reliability in advanced packaging. With fine pitch (in nanometers) coming into the hybrid bonding game, precise alignment control and process drift detection in-line has become critical. By catching defects and misalignments during the process rather than after, manufacturers can significantly improve yield and reduce scrap.
Summary
Hybrid bonding continues to evolve as the foundational enabler for next-generation 3D integration and heterogeneous system architectures. As panelists from imec, Samsung, Adeia, Toray, KLA, and AMD illustrated, while significant progress has been made-particularly in W2W and D2W hybrid bonding with sub-10µm pitch-the coming decade poses both critical challenges and transformational opportunities.
The panel consensus identified several pressing challenges that must be addressed to scale HB for mainstream adoption:
- Sub-50nm alignment and overlay control: Essential for both W2W and D2W flows, requiring improved bonder placement precision, robust stress modeling, and wafer/ die shape compensation strategies.
- Surface preparation and metrology gaps: Pre-bond surface topography, Cu recess, oxide planarization, and surface defectivity remain primary contributors to bonding failure and yield loss. High-throughput metrology (e.g., optical interferometry, machine learningdriven surface inspection) is urgently needed.
- Particle-induced defects and die warpage: Especially in C2W bonding, die singulation, pick-and-place, and thinning steps contribute to particle contamination and chip bowing-both of which degrade bond line quality. Advanced cleaning techniques and low-pressure bonding materials such as polyimide (PI) show promise in addressing these issues.
-
Thermal budget constraints: Emerging applications in HBM and 3D DRAM require HB at temperatures
-
<250°C. Material innovationssuch as low-temperature Cu diffusion techniques and polymerbased dielectrics-are crucial for enabling thermally-fragile packages.
- Design enablement and standardization: Chipletbased systems demand not only technological readiness, but also the creation of interoperable HB design rules, LEF/DEF support, and EMIR-aware IP packaging standards to unlock widespread ecosystem adoption.
- Thermal dissipation and reliability: As 3D stacks push power density beyond 3W/mm², hybrid bonding must integrate with advanced thermal solutions including microfluidic cooling, cold plate bonding, and thermalaware interconnect materials. The panel collectively agreed that
cross-industry collaborationspanning material suppliers, equipment vendors, foundries, integrated device manufacturers (IDMs), and electronic design automation (EDA)/IP playersis critical to accelerating HB technology maturity. Initiatives such as standard hybrid bonding test vehicles, qualification metrics for hybrid bonding to ensure long-term reliability, precompetitive consortia (e.g., C2W HB Consortium), and open design frameworks, are needed to bridge innovation gaps and reduce timeto-market. Ultimately, the future of hybrid bonding hinges on its ability to simultaneously meet electrical, mechanical, thermal, and economic integration requirements. As the semiconductor industry transitions toward AI/machine learning (ML) workloads, chiplet
The2026 IEEE 76th Electronic Components and Technology Conference
ECTC
JW Marriott & The Ritz-Carlton Grande Lakes Orlando, Florida, USA
For more information, visit: www.ectc.net
HIGHLIGHTS
- 41 technical sessions with a total number of 350+ technical papers including:
- 5 interactive sessions including one student session
- 9 special invited sessions
- 16 CEU-approved Professional Development Courses
- Multiple opportunities for networking
- Technology Corner Exhibits, showcasing industry-leading product and service companies from around the world
- Various sponsorship opportunities for your company's visibility
- ECTC Gala and evening receptions
350+ TECHNICAL PAPERS COVERING: Fan-Out WLP & PLP Chiplet Architectures Additive Manufacturing Photonics Systems Quantum and AI Systems 3D & TSV Processing Heterogeneous Integration Fine Pitch Flip-Chip Advanced Substrates Hybrid Bonding Flexible & Wearable Devices RF Components Harsh Environment Bio/Medical Devices Thermal/Mech Simulation Interconnect Reliability modularity, and panel-level integration, hybrid bonding must evolve from a niche interconnect technology to a mainstream manufacturing backbone.
Reference
- W. Christiaens, E. Bosman, J. Vanfleteren, 'UTCP: A novel polyimide-based ultra-thin chip packaging technology,' IEEE Trans. on Components and Packaging Tech. 33(4), Dec. 2010, pp. 754-760.
INDUSTRY EVENTS
The 6 th SWTest Asia Conference and EXPO was an overwhelming success!
By Jerry Broz [General Chair, SWTest US and SWTest Asia Conferences, and Delphon Industries]
he Semiconductor Wafer Test (SWTest) Asia Conference and EXPO serves as the premier technical event in Asia dedicated to addressing the complex challenges of wafer-level test and probe technologies. Held at the Hilton Sea Hawk in Fukuoka, Japan, this year's conference marked the largest gathering in over 40 years of SWTest and SWTest Asia history, drawing over 850 international participants. Notably, more than 45% of this year's attendees were T
decision makers or individuals responsible for recommendations and specifications, with over 22% occupying executive roles.
SWTest Asia 2025 was held over two days and welcomed attendees from 18 countries, with 75% representing Asia's test communities. The event gathered probe and test professionals to exchange knowledge, learn from one another, and network in an informal, friendly environment. Highlights included two Industry Vision Keynotes, six podium sessions featuring 22 peer-reviewed presentations, two poster sessions with 20 industry and academic posters, five Platinum Sponsor Tech-Showcase sessions, and a sold-out EXPO hosting 54 global suppliers. Additionally, five technology companies from Fukuoka Prefecture were represented among the exhibitors.
At the standing-room-only Thursday morning plenary session, SWTest Asia 2025 kicked off with opening remarks by Jerry Broz, PhD, General Chair, alongside Nobuhiro Kawamata, Japan Program Chair. Clark Liu, Taiwan Program Chair, announced that SWTest Asia 2026 will be held at the Hsinchu Sheraton in Taiwan from November 4-6, 2026. Following the welcome, the Technical Program began with an Industry Vision Keynote presented by Kazuyuki Iwaguro, Vice President of HPC Business Management and Operations Division at RENESAS, who discussed challenges at the 'Leading Edge Test Technology and Strategy for Automotive Products'. In his visionary presentation, Iwaguro-san addressed balancing cost competitiveness with quality in microcontroller unit (MCU) testing and tackling complexity and high performance in system on chip (SoC) testing, along with related challenges and expectations. After the Industry Vision Keynote, the technical program consisted of sessions focused on enabling high-bandwidth memory (HBM) and materials challenges for meeting critical wafer-level test requirements.
Following a full day of focused technical sessions and lively networking at the EXPO, we were joined by the Fukuoka ViceGovernor, Tetsuko Ueda. Vice Governor Ueda formally welcomed all the SWTest Asia attendees. Ueda-san then participated in the prefecture-sponsored Kagami-wari ceremony, during which three sake barrels from the local Ishikura Brewery were ceremonially cracked open by the SWTest Asia Committee and Platinum Sponsors to be shared by conference attendees. SWTest Asia EXPO hosts multinational suppliers who are essential to the wafertest industry and integral to growing semiconductor infrastructure of Kyushu Island (often called the 'Silicon Island'). Vice-Governor Ueda spent additional time in the EXPO area meeting with several international vendors.
SWTest Asia 2025 Conference and EXPO brought together over 850 registered attendees for ample networking among colleagues, suppliers, end users, and other professionals. The 54 exhibit booths featured longtime multinational sponsors and exhibitors, as well as many new international and Japan-based companies participating for the first time. The EXPO also welcomed 5 exhibitors from semiconductor technology companies based in Kyushu Island (a.k.a., the 'Silicon Island').
The Industry Vision Keynotes were standing room only. On Thursday, Kazuyuki Iwaguro (Vice President of HPC Business Management and Operations Division at RENESAS) discussed challenges at the 'Leading Edge Test Technology and Strategy for Automotive Products.' On Friday, Atsuhiko Ohno (Distinguished Engineer from Technology Department #5, Wafer/Package Test of Rapidus Corporation) presented on the 'Rapidus Initiatives and Logic Testing Challenges in Advanced Semiconductor Manufacturing.'
Fukuoka Prefecture Vice Governor, Tetsuko Ueda (center), joined Nobuhiro Kawamata (Japan Program Chair) and Jerry Broz (SWTest General Chair), the SWTest Asia Executive Committee, Industry Vision Keynote Speakers, and representatives from the five Platinum Sponsors during the Kagami-wari Ceremony. The act of breaking the lids of the sake barrels during this traditional Japanese ceremony symbolizes the release of prosperity and good fortune.
Andy Chang (Marvell Technology) received the Best Overall Presentation Award from Nobuhiro Kawamata (Japan Program Chair) and Jerry Broz (SWTest General Chair) for his team's innovative and collaborative work entitled, 'Silicon Photonics Production Wafer Testing by Utilizing Advantest V93000 SOC ATE platform.'
For the Best Data Presentation as recognized by the committee, Nobuhiro Kawamata (Japan Program Chair) and Jerry Broz (SWTest General Chair) awarded Alistair Laing (Micron Technology - USA) for his insightful presentation discussing 'The emergence of Advanced Memories and its Impact on Probe Test Solutions.'
On Friday, our second Industry Vision Keynote was delivered by Atsuhiko Ohno, Distinguished Engineer from Technology Department #5 (Wafer/Package Test) at Rapidus Corporation. In his presentation, Ohno-san discussed the 'Rapidus Initiatives and Logic Testing Challenges in Advanced Semiconductor Manufacturing.' He also provided specific updates on the significant progress and installation of advanced tools at the Rapidus Factory in Hokkaido, Japan, as part of its ongoing initiative to achieve 2nm technology production. After the Industry Vision Keynote, the technical program covered diverse topics ranging from photonics testing to advanced printed circuit board (PCB) design. The second day wrapped up with an engaging networking event for attendees, highlighted by a Yatai (屋台) Street Food Festival and local entertainment. Overall, the twoday technical program provided attendees with a comprehensive schedule of industry-driven, collaborative, and academic presentations delivered both on podium and as posters, combined with ample networking opportunities among attendees and exhibitors.
From all the excellent presentations delivered during the conference, the Technical Program Committee was pleased to award the Best Overall Presentation to collaborative work from Andy Chang, Andrew Yick, Calvin Yang, Supreet Khanapet (Marvell - USA), Christian Karras, Gregor Kupka, Tobias Gnausch (Jenoptik - Germany), Derek Wu, Jeff Jhern, Natan Chejanovsky, Shiyang Deng (Advantest - USA), and Kengo Suzuki (Advantest -Japan) entitled, 'Silicon Photonics Production Wafer Testing by Utilizing Advantest V93000 SOC ATE platform.' From the session focused on enabling HBM Testing, the Best Data Presentation went to Alistair Laing (Micron Technology - USA) on 'The Emergence of Advanced Memories and its impact on Probe Test Solutions.' The Best Poster Presentation was awarded to Cameron Harker (FormFactor - USA) and Yoichi Urakawa (FormFactor - Japan) for their work on 'High pin count, high parallelism vertical probe card characterization strategies for HVM automotive bump wafer testing.'
Each year, SWTest conferences support the attendance of students through the generous support of key industry sponsors as well as the William Mann Student Travel Grant Program. We are also proud to announce that Chip Scale Review, the SWTest Media Partner, will select one of the awarded presentations for publication as a full article in an upcoming issue.
Feedback from this year's SWTest Asia event has been highly positive and supportive. As the General Chair, I am pleased that our conference and EXPO offer such a wide range of valuable technical and professional opportunities in a friendly and relaxed setting. Our unique program format enables attendees to engage
`
with key exhibitors and participate in networking throughout extended breaks, scheduled meals, as well as evening social and hospitality functions.
I would also like to take this opportunity to thank the sponsors, exhibitors, authors, speakers, session chairs, committee members, and the SWTest Asia Team for their dedicated efforts that contributed to a highly successful and record-breaking conference and EXPO this year. In addition, the SWTest Asia organizing team would like to thank Vice-Governor Tetsuko Ueda and the Fukuoka Prefecture Team for their participation and kind support throughout the planning process.
Looking ahead to 2026, the 35th SWTest Conference and EXPO will take place at the Omni La Costa in Carlsbad, California from June 8-10, 2026. The U.S.-based probe technology forum brings together industry professionals to exchange knowledge, discuss recent advancements, and connect with leading suppliers. The Call for Papers is now open at https://www. swtest.org/ and will close on February 27, 2026. Whether you are an end user, supplier, engineer, or a sales and marketing professional, both SWTest San Diego and SWTest Asia offer unique and valuable opportunities for everyone involved in the wafer-level test industry.
WINTER 2026 ADVERTISER INDEX
Amkor Technology www.amkor.com ................................... OBC
ASE www.aseglobal.com .......................................................... 4
Brewer Science www.brewerscience.com ............................... 51
DECA Technology www.thinkdeca.com ................................... 7
DL Technology www.dltechnology.com .................................... 59
ECTC www.ectc.net .................................................................. 61
EV Group www.evgroup.com ................................................. 2
FINECS www.finecs.co.jp .................................................... 36
IMAPS-DPC www.devicepackagingconference.com ..................... 55
Ironwood Electronics www.ironwoodelectronics.com ............. 41
ISC CO., LTD. www.isc21.kr ........................................................... 45
JC CHERRY www.jccherry.com .................................................... 52
| Leeno Industrial www.leeno.com ................................... | Leeno Industrial www.leeno.com ................................... | IFC, IBC |
|---|---|---|
| Micro Control Company www.microcontrol.com .......................... | Micro Control Company www.microcontrol.com .......................... | 23 |
| Nordson Test & Inspection | www.nordson.com/testinspect ..... 10, | 11 |
| PacTech www.pactech.com | ......................................................... 15 | |
| Plasma Etch www.plasmaetch.com | ........................................ 60 | |
| Sonix www.sonix.com ......................................................... | 40 | |
| SWTest www.swtest.org | ......................................................... 64 | |
| Technic www.technic.com | ......................................................... 39 | |
| Test Tooling Solutions Group | www.tts-grp.com ......................... | 31 |
| TestConX www.testconx.net | ..................................................... 49 | |
| TSE Co. Ltd www.tse21.com ................................................. 24, | TSE Co. Ltd www.tse21.com ................................................. 24, | 25 |
| WinWay Technology www.winwayglobal.com ......................... | WinWay Technology www.winwayglobal.com ......................... | 18 |
For advertising in Spring 2026 issue | ads@chipscalereview.com
LEENO
110GHz Actual Measurement Capability Report
RF/Thermal Simulation
Specification
LEENO GLOBAL LEADER
HEAD OFFICE
10 105beon-gil MieumSandan-ro Gangseo-gu, Busan Metropolitan City, Korea
hskang@leeno.co,kr/ +82 10 8737 6551
kimmj@leeno.co.kr/+82 10 5314 6560
Logic & SLT Socket Amkor Technology