PDF 原檔:報告_APC_CPO矽光子測試程序_20261009_original.pdf
圖片清單(已驗證 2026-10-21)
47 張 ≥40KB 逐張 Read。全部為「測試系統配置示意」:中間為探針台/測試機台產品照,左側 Input 方塊、右側 Output 方塊標示儀器,下方為 DUT(晶圓、bar 條或單顆 die/封裝件)。「或(OR)」表示並列兩種機台皆可。圖中未標廠牌名稱,僅手動探針台機身可見「TS300-TZ」字樣。
| 檔名 | size | 分類 | 親眼所見內容 |
|---|---|---|---|
報告_APC_CPO矽光子測試程序_20261009_001.png |
130KB | 真資料圖 | 標題 Manual Probe System;Input:DC Source、RF Generator;Output:DC Meter、RF Analyzer;DUT 為晶圓(Fig.1,2.1 EIC R&D) |
報告_APC_CPO矽光子測試程序_20261009_002.png |
195KB | 真資料圖 | 兩台半自動機台 OR 並列(左為帶雙螢幕探針台、右為綠光視窗封閉式機台+機櫃);Input DC Source/RF Generator,Output DC Meter/RF Analyzer;DUT 晶圓(Fig.2) |
報告_APC_CPO矽光子測試程序_20261009_003.png |
126KB | 真資料圖 | 兩台自動機台 OR 並列(左帶側邊料匣、右為雙燈塔大型機台);同 DC/RF 輸入輸出;DUT 晶圓(Fig.3,EIC LVM) |
報告_APC_CPO矽光子測試程序_20261009_004.png |
136KB | 真資料圖 | 兩台自動機台 OR(左帶晶圓 loader);DC Source/RF Generator → DC Meter/RF Analyzer;DUT 晶圓(Fig.4,EIC HVM) |
報告_APC_CPO矽光子測試程序_20261009_005.png |
121KB | 真資料圖 | Manual Probe System;Input OLS;Output OPM、OSA、OFDR、λ Meter;DUT 晶圓(Fig.5,PIC O-O R&D) |
報告_APC_CPO矽光子測試程序_20261009_006.png |
120KB | 真資料圖 | 半自動兩機台 OR;OLS → OPM/OSA/OFDR/λ Meter;DUT 晶圓(Fig.6) |
報告_APC_CPO矽光子測試程序_20261009_007.png |
111KB | 真資料圖 | 自動兩機台 OR;OLS → OPM/OSA/OFDR(無 λ Meter);DUT 晶圓(Fig.7,PIC LVM) |
報告_APC_CPO矽光子測試程序_20261009_008.png |
105KB | 真資料圖 | 標題 Automatic Probe System;OLS → 僅 OPM;DUT 晶圓(Fig.8,PIC HVM) |
報告_APC_CPO矽光子測試程序_20261009_009.png |
130KB | 真資料圖 | Manual Probe System(機身可見 TS300-TZ);OLS → OPM/OSA/OFDR/λ Meter;DUT 晶圓(Fig.9,E-PIC O-O R&D) |
報告_APC_CPO矽光子測試程序_20261009_010.png |
120KB | 真資料圖 | 半自動兩機台 OR;OLS → OPM/OSA/OFDR/λ Meter;DUT 晶圓(Fig.10) |
報告_APC_CPO矽光子測試程序_20261009_011.png |
139KB | 真資料圖 | Automatic Probe System;OLS → OPM/OSA/OFDR;DUT 晶圓(Fig.11) |
報告_APC_CPO矽光子測試程序_20261009_012.png |
124KB | 真資料圖 | Automatic Probe System(左機台帶 loader);OLS → OPM;DUT 晶圓(Fig.12) |
報告_APC_CPO矽光子測試程序_20261009_013.png |
141KB | 真資料圖 | Manual Probe System(TS300-TZ);Input OLS;Output DC Meter、Ampere Meter、Oscilloscope;DUT 晶圓(Fig.13,E-PIC O-E R&D) |
報告_APC_CPO矽光子測試程序_20261009_014.png |
124KB | 真資料圖 | 半自動兩機台 OR;Input 方塊寫「OSL」(應為 OLS 誤植);Output DC Meter/Ampere Meter/Oscilloscope;DUT 晶圓(Fig.14) |
報告_APC_CPO矽光子測試程序_20261009_015.png |
121KB | 真資料圖 | 自動兩機台 OR;OLS → DC Meter/Ampere Meter;DUT 晶圓(Fig.15) |
報告_APC_CPO矽光子測試程序_20261009_016.png |
131KB | 真資料圖 | 自動兩機台 OR(左帶 loader);OLS → DC Meter/Ampere Meter;DUT 晶圓(Fig.16) |
報告_APC_CPO矽光子測試程序_20261009_017.png |
181KB | 真資料圖 | Manual 探針台(TS300-TZ);Input DC Source/RF Generator;Output OPM/OSA/λ Meter;DUT 晶圓(Fig.17,E-PIC E-O R&D) |
報告_APC_CPO矽光子測試程序_20261009_018.png |
118KB | 真資料圖 | 半自動兩機台 OR;DC Source/RF Generator → OPM/OSA/λ Meter;DUT 晶圓(Fig.18) |
報告_APC_CPO矽光子測試程序_20261009_019.png |
129KB | 真資料圖 | Automatic Probe System;DC Source/RF Generator → OPM/OSA;DUT 晶圓(Fig.19) |
報告_APC_CPO矽光子測試程序_20261009_020.png |
129KB | 真資料圖 | 自動兩機台 OR(左帶 loader);DC Source/RF Generator → OPM;DUT 晶圓(Fig.20) |
報告_APC_CPO矽光子測試程序_20261009_021.png |
111KB | 真資料圖 | Manual Probe System;OLS → OPM/OSA/OFDR/λ Meter;DUT 為彩色條狀 bar(Fig.21,Bar O-O R&D) |
報告_APC_CPO矽光子測試程序_20261009_022.png |
98KB | 真資料圖 | 兩機台 OR(左黑色帶橘條機台、右白色封閉機台);OLS → OPM/OSA/OFDR/λ Meter;DUT 為 bar(Fig.22) |
報告_APC_CPO矽光子測試程序_20261009_023.png |
112KB | 真資料圖 | 標題 Automatic Probe System with MHU and ATE Docking Station;黑色機台 OR 白色機台;OLS → OPM/OSA/OFDR;DUT 為 bar(Fig.23) |
報告_APC_CPO矽光子測試程序_20261009_024.png |
105KB | 真資料圖 | 同上標題;左為帶直立式物料搬運塔(MHU)的探針台、右為白色機台旁接灰色大型測試頭機櫃;OLS → OPM;DUT 為 bar(Fig.24,Bar O-O HVM) |
報告_APC_CPO矽光子測試程序_20261009_025.png |
110KB | 真資料圖 | Manual Probe System(TS300-TZ);OLS → DC Meter/Ampere Meter/Oscilloscope;DUT 為 bar(Fig.25) |
報告_APC_CPO矽光子測試程序_20261009_026.png |
109KB | 真資料圖 | Semi-Automatic Probe System;兩機台 OR;OLS → DC Meter/Ampere Meter/Oscilloscope;DUT 為 bar(Fig.26) |
報告_APC_CPO矽光子測試程序_20261009_027.png |
108KB | 真資料圖 | Automatic Probe System with MHU;OLS → DC Meter/Ampere Meter;DUT 為 bar(Fig.27) |
報告_APC_CPO矽光子測試程序_20261009_028.png |
114KB | 真資料圖 | Automatic Probe System with MHU and ATE Docking Station;MHU 塔+探針台 OR 白色機台+灰色測試頭機櫃;OLS → DC Meter/Ampere Meter;DUT 為 bar(Fig.28) |
報告_APC_CPO矽光子測試程序_20261009_029.png |
105KB | 真資料圖 | Manual Probe System;DC Source/RF Generator → OPM/OSA/λ Meter;DUT 為 bar(Fig.29) |
報告_APC_CPO矽光子測試程序_20261009_030.png |
94KB | 真資料圖 | 兩機台 OR;DC Source/RF Generator → OPM/OSA/λ Meter;DUT 為 bar(Fig.30) |
報告_APC_CPO矽光子測試程序_20261009_031.png |
89KB | 真資料圖 | 兩機台 OR;DC Source/RF Generator → OPM/OSA;DUT 為 bar(Fig.31) |
報告_APC_CPO矽光子測試程序_20261009_032.png |
103KB | 真資料圖 | Automatic Probe System with MHU and ATE Docking Station;DC Source/RF Generator → OPM;DUT 為 bar(Fig.32) |
報告_APC_CPO矽光子測試程序_20261009_033.png |
111KB | 真資料圖 | Manual Probe System(TS300-TZ);OLS → OPM/OSA/OFDR/λ Meter;DUT 為單顆 die(Fig.33,Die O-O R&D) |
報告_APC_CPO矽光子測試程序_20261009_034.png |
96KB | 真資料圖 | 黑色機台 or 白色開門機台(內部可見多組定位模組);OLS → OPM/OSA/OFDR/λ Meter;DUT 為 die(Fig.34) |
報告_APC_CPO矽光子測試程序_20261009_035.png |
81KB | 真資料圖 | 兩機台 or;OLS → OPM/OSA/OFDR;DUT 為 die(Fig.35) |
報告_APC_CPO矽光子測試程序_20261009_036.png |
104KB | 真資料圖 | Automatic Probe System with MHU and ATE Docking Station;OLS → OPM;DUT 為 die(Fig.36) |
報告_APC_CPO矽光子測試程序_20261009_037.png |
107KB | 真資料圖 | Manual Probe System(TS300-TZ);OLS → DC Meter/Ampere Meter/Oscilloscope;DUT 為 die(Fig.37) |
報告_APC_CPO矽光子測試程序_20261009_038.png |
97KB | 真資料圖 | 兩機台 or;OLS → DC Meter/Ampere Meter/Oscilloscope;DUT 為 die(Fig.38) |
報告_APC_CPO矽光子測試程序_20261009_039.png |
85KB | 真資料圖 | Automatic Probe System with MHU;OLS → DC Meter/Ampere Meter;DUT 為 die(Fig.39) |
報告_APC_CPO矽光子測試程序_20261009_040.png |
99KB | 真資料圖 | Automatic Probe System with MHU and ATE Docking Station;OLS → DC Meter/Ampere Meter;DUT 為 die(Fig.40) |
報告_APC_CPO矽光子測試程序_20261009_041.png |
115KB | 真資料圖 | Manual Probe System(TS300-TZ);DC Source/RF Generator → OPM/OSA/λ Meter;DUT 為 die(Fig.41) |
報告_APC_CPO矽光子測試程序_20261009_042.png |
149KB | 真資料圖 | 兩機台 or;DC Source/RF Generator → OPM/OSA/λ Meter;DUT 為 die(Fig.42) |
報告_APC_CPO矽光子測試程序_20261009_043.png |
86KB | 真資料圖 | 兩機台 or;DC Source/RF Generator → OPM/OSA;DUT 為 die(Fig.43) |
報告_APC_CPO矽光子測試程序_20261009_044.png |
109KB | 真資料圖 | Automatic Probe System with MHU and ATE Docking Station;DC Source/RF Generator → OPM;DUT 為 die(Fig.44) |
報告_APC_CPO矽光子測試程序_20261009_045.png |
154KB | 真資料圖 | 標題 Validation System;龍門架式機台(花崗岩平台、多組定位器、燈塔);Input SMU/RF Generator;Output OPM/OSA/BERT;DUT 為封裝件圖示(Fig.45,Packaged Validation) |
報告_APC_CPO矽光子測試程序_20261009_046.png |
92KB | 真資料圖 | Semi-Automatic Probe System(與上圖同型龍門架機台);SMU/RF Generator → OPM/OSA/BERT;DUT 封裝件(Fig.46,Packaged LVM) |
報告_APC_CPO矽光子測試程序_20261009_047.png |
103KB | 真資料圖 | 大型多工位封閉式自動化測試系統(上方多台螢幕、中央多工位);SMU/RF Generator → OPM/OSA/BERT;DUT 封裝件(Fig.47,Packaged HVM) |
原始內容
Silicon Photonics for Co-Packaged Optics Recommended Test Procedures
VERSION 1.0
© 2026 Advanced Photonics Coalition
Copyright
Copyright © 2026 Advanced Photonics Coalition. All Rights Reserved.
Limitations
THIS DOCUMENT IS PROVIDED 'AS IS.' The publisher and contributors expressly disclaim any warranties (express, implied, or otherwise), including but not limited to implied warranties of merchantability, non-infringement, fitness for a particular purpose, or title. The entire risk of using or implementing this document is assumed by the user. IN NO EVENT IS THE PUBLISHER OR ANY CONTRIBUTOR LIABLE TO ANY PARTY FOR DIRECT, INDIRECT, SPECIAL, INCIDENTAL, OR CONSEQUENTIAL DAMAGES OF ANY KIND (INCLUDING LOST PROFITS) BASED ON ANY THEORY OF ACTION (INCLUDING NEGLIGENCE), EVEN IF THE OTHER PARTY HAS BEEN ADVISED OF THE POSSIBILITY OF SUCH DAMAGE. This document may be subject to third party rights.
Contributing Editors
Advanced Photonics Coalition, Melissa Kallos, Working Group Facilitator and Editor
Advantest, Shawn Kann, Editor
Advantest, Vaishnavi Murthy, Editor
Exfo, Dominique Charron, Editor
Ficontec, Rayhane Ghane, Editor
HPE, Jeff Maki, Editor
MPI Corporation, Lawrence van der Vegt, Editor & Test and Measurement Chairperson
Quantifi Photonics, a Teradyne Company, Kees Propstra,
Editor & Test and Measurement Co-Chairperson
Santec, Jonathan Evans, Editor
Santec, Chris Heisler, Editor
Viavi Solutions, Ines Brunn
A special thank you to Raphel Dube Demers, former Test and Measurement Co-Chairperson
Test & Measurements - Contributing Working Group Members
| 2Pi Optics | Hakusan Inc. | Pilot Photonics Ltd. |
|---|---|---|
| Advantest Corporation | Hewlett Packard Enterprise | Qnity Electronics, Inc. |
| Alcyon Photonics | HYC Co., Ltd. | Quantifi Photonics (a Teradyne Company) |
| America Fujikura Ltd. | IBM Corporation | Resolight |
| Amphenol Corporation | Innolume GmbH | Resonac Corporation |
| Ansys Inc. | Intel Corporation | Santec Corporation |
| Ayar Labs | Keysight Technologies, Inc. | SENKO Advanced Components Inc. |
| Belden Inc. | Lightera | Siemens EDA |
| Ciena Corporation | Lightium AG | Shenzhen Adtek Technology Co., Ltd |
| ColorChip Ltd. | Lightmatter Inc. | SiLith Technology PTE Ltd. |
| CommsScope (an Amphenol Company) | LightSpeed Photonics PTE Ltd. | Silitronics Solutions, Inc. |
| Dexerials Corporation | Luceda Photonics | Sivers Semiconductor, Inc. |
| Doosan Corporation | MegaCool Technologies | SUNA Optoelectronics Co. Ltd. |
| EXFO Inc. | Mesh Semiconductor | Synopsys Inc. |
| ficonTEC Service GmbH | Microsoft Corporation | TE Connectivity |
| Flexcompute Inc. | MPI Corporation | Teradyne Incorporated |
| Focuslight Technologies Inc. | NEXUSTEST PTE Ltd. | Tokyo Ohka Kogyo Co., Ltd. (TOK) |
| Fujikura Ltd. | NTT DEVICES AMERICA | VIAVI Solutions |
| Furukawa Electric Co., Ltd. | OpenLight Photonics, Inc. | WaferForge LLC |
| Genuine Optics | Panduit Corporation | WUS Printed Circuit Co., Ltd. |
| Globalfoundries Inc. | PHIX Photonics Assembly | Xscape Photonics, Inc. |
| Go!Foton Corporation |
Table of Contents
| 1. Introduction ................................................................................................................................................1 | 1. Introduction ................................................................................................................................................1 |
|---|---|
| 2. ATE | Insertion #1 testing on Wafer level ....................................................................................................3 |
| 2.1 | Electrical Integrated Circuit (EIC) Electrical-Electrical ..................................................................3 |
| 2.1.1 R&D level | ..................................................................................................................................3 |
| 2.1.2 Validation level | ..........................................................................................................................4 |
| 2.1.3 Low-Volume Manufacturing (LVM) | level .....................................................................................6 |
| 2.1.4 High-Volume Manufacturing (HVM) | level ...................................................................................7 |
| 2.1.5 Summary Comparison | ..............................................................................................................8 |
| 2.2 Photonic Integrated Circuit (PIC) | Optical-Optical ........................................................................9 |
| 2.2.1 R&D level | ..................................................................................................................................9 |
| 2.2.2 Validation level | ........................................................................................................................11 |
| 2.2.3 Low-Volume Manufacturing (LVM) | level ...................................................................................12 |
| 2.2.4 High-Volume Manufacturing (HVM) | level .................................................................................13 |
| 2.2.5 Summary Comparison | ............................................................................................................14 |
| 3. ATE Insertion #2 testing on Wafer level | ..................................................................................................15 |
| 3.1 Electro-Photonic Integrated Circuit | (E-PIC) Optical-Optical ......................................................15 |
| 3.1.1 R&D level | ................................................................................................................................15 |
| 3.1.2 Validation level | ........................................................................................................................17 |
| 3.1.3 Low-Volume Manufacturing (LVM) | level ...................................................................................18 |
| 3.1.4 High-Volume Manufacturing (HVM) | level .................................................................................20 |
| 3.1.5 Summary Comparison | ............................................................................................................21 |
| 3.2 Electro-Photonic Integrated Circuit | (E-PIC) Optical-Electrical ..................................................22 |
| 3.2.1 R&D level 3.2.2 Validation level | ................................................................................................................................22 ........................................................................................................................24 |
| 3.2.3 Low-Volume Manufacturing (LVM) level ...................................................................................26 | |
| 3.2.4 High-Volume Manufacturing (HVM) | level .................................................................................27 |
| 3.1.5 Summary Comparison | ............................................................................................................29 |
| 3.3 Electro-Photonic Integrated Circuit (E-PIC) Electrical-Optical | ..................................................30 |
| 3.3.1 R&D level | ................................................................................................................................30 |
| 3.3.2 Validation level | ........................................................................................................................33 |
| 3.3.3 Low-Volume Manufacturing (LVM) | level ...................................................................................35 |
| 3.3.4 High-Volume Manufacturing (HVM) 3.3.5 Summary Comparison | level .................................................................................36 |
| ............................................................................................................38 |
Table of Contents (con't)
| 4. ATE Insertion #3 testing on Bar level ......................................................................................................39 | |
|---|---|
| 4.1 Electro-Photonic Integrated Circuit (E-PIC) Optical-Optical .......................................................39 | |
| 4.1.1 R&D level | ................................................................................................................................39 |
| 4.1.2 Validation level | ........................................................................................................................42 |
| 4.1.3 Low-Volume Manufacturing (LVM) level | ...................................................................................44 |
| 4.1.4 High-Volume Manufacturing (HVM) level | .................................................................................46 |
| 4.1.5 Summary Comparison ............................................................................................................48 | |
| 4.2 Electro-Photonic Integrated Circuit (E-PIC) Optical-Electrical ...................................................49 | |
| 4.1.1 R&D level | ................................................................................................................................49 |
| 4.1.2 Validation level | ........................................................................................................................52 |
| 4.1.3 Low-Volume Manufacturing (LVM) level ...................................................................................54 | |
| 4.1.4 High-Volume Manufacturing (HVM) level .................................................................................56 | |
| 4.1.5 Summary Comparison | ............................................................................................................58 |
| 4.3 Electro-Photonic Integrated Circuit (E-PIC) Electrical-Optical ...................................................59 | |
| 4.3.1 R&D level | ................................................................................................................................59 |
| 4.3.2 Validation level ........................................................................................................................62 | |
| 4.3.3 Low-Volume Manufacturing (LVM) level ...................................................................................64 | |
| 4.3.4 High-Volume Manufacturing (HVM) level | .................................................................................66 |
| 4.3.5 Summary Comparison ............................................................................................................68 | |
| 5. ATE Insertion #3 testing on Die level .....................................................................................................69 | |
| 5.1 Electro-Photonic Integrated Circuit (E-PIC) Optical-Optical ......................................................69 | |
| 5.1.1 R&D level | ................................................................................................................................69 |
| 5.1.2 Validation level | ........................................................................................................................72 |
| 5.1.3 Low-Volume Manufacturing (LVM) level | ...................................................................................74 |
| 5.1.4 High-Volume Manufacturing (HVM) level .................................................................................76 | |
| 5.1.5 Summary Comparison ............................................................................................................78 | |
| 5.2 Electro-Photonic Integrated Circuit (E-PIC) Optical-Electrical | ..................................................79 |
| 5.2.1 R&D level ................................................................................................................................79 | |
| 5.2.2 Validation level | ........................................................................................................................82 |
| 5.2.3 Low-Volume Manufacturing (LVM) level ...................................................................................84 | |
| 5.2.4 High-Volume Manufacturing (HVM) level .................................................................................86 | |
| 5.2.5 Summary Comparison ............................................................................................................88 | |
| 5.3 Electro-Photonic Integrated Circuit (E-PIC) Electrical-Optical ..................................................89 | |
| 5.3.1 R&D level | ................................................................................................................................89 |
| 5.3.2 Validation level | ........................................................................................................................92 |
| 5.3.3 Low-Volume Manufacturing (LVM) level ...................................................................................94 | |
| 5.3.4 High-Volume Manufacturing (HVM) level | .................................................................................96 |
| 5.3.5 Summary Comparison ............................................................................................................98 | |
| 6. ATE Insertion #4 testing on Packaged Device level .............................................................................99 6.1 Electro-Photonic Integrated Circuit (E-PIC) | ......................................................................................99 |
| 6.1.1 Validation level ........................................................................................................................99 | |
| 6.1.2 Low-Volume Manufacturing (LVM) level .................................................................................101 | |
| 6.1.3 High-Volume Manufacturing (HVM) level | ...............................................................................103 |
| 6.1.4 Summary Comparison | ..........................................................................................................105 |
Table of Contents (con't)
Appendix
7. Test Infrastructure Hardware & Software
| 7.1 Electrical .....................................................................................................................................120 | 7.1 Electrical .....................................................................................................................................120 | 7.1 Electrical .....................................................................................................................................120 |
|---|---|---|
| 7.1.1 Wafer | Probe Systems ..........................................................................................................120 | |
| 7.1.2 ATE Docking | Stations ..........................................................................................................120 | |
| 7.1.3 DC | Probes...........................................................................................................................120 | |
| 7.1.4 RF Probes | ...........................................................................................................................120 | |
| 7.1.5 DC Sources | .........................................................................................................................120 | |
| 7.1.6 DC Meters | ...........................................................................................................................120 | |
| 7.1.7 RF Generators | .....................................................................................................................120 | |
| 7.1.8 RF Analyzers | .......................................................................................................................120 | |
| 7.1.9 Oscilloscopes | ......................................................................................................................120 | |
| 7.2 Optical | 7.2 Optical | 7.2 Optical |
| 7.2.1 Wafer | Probe Systems ..........................................................................................................120 | |
| 7.2.2 Bar Probe | Systems..............................................................................................................120 | |
| 7.2.3 Die Probe | Systems ..............................................................................................................120 | |
| 7.2.4 Optical | Probes (FAU) ...........................................................................................................121 | |
| 7.2.5 Light Sources | (OLS) ............................................................................................................121 | |
| 7.2.6 Optical | Power Meters (OPM) ...............................................................................................121 | |
| 7.2.7 Optical | Spectrum Analyzers (OSA) .......................................................................................121 | |
| 7.2.8 Wavelength | Meters (WLM) ...................................................................................................121 | |
| 7.2.9 Optical | Frequency Domain Reflectometer (OFDR) ...............................................................121 | |
| 7.3 Environmental | 7.3 Environmental | 7.3 Environmental |
| 7.3.1 Wafer | Probe Systems ..........................................................................................................121 | |
| 7.3.2 Bar Probe | Systems .............................................................................................................121 | |
| 7.3.3 Die Probe | Systems .............................................................................................................121 |
1. Introduction
Table 1 - Test Procedures
| ATE Insertion | #1 | #1 | #2 | #3 | #3 | #4 | -- |
|---|---|---|---|---|---|---|---|
| Device Shape | Wafer | Wafer | Wafer | Bar | Die | Packaged | Finished |
| Device Type | EIC | PIC | E-PIC | E-PIC | E-PIC | E-PIC | Product |
| Electrical-Electrical Optical-Optical Electrical-Optical | Physical Electrical Environmental Functional | Physical Optical Environmental Functional | Physical Electrical Optical Environmental Functional | Physical Electrical Optical Environmental Functional | Physical Electrical Optical Environmental Functional | Physical Electrical Optical Environmental Functional Conditional | Physical Electrical Optical Environmental Functional Conditional |
| Testing at Stage | Testing at Stage | Testing at Stage | Testing at Stage | Testing at Stage | Testing at Stage | Testing at Stage | Testing at Stage |
| Optical-Electrical R&D | Granulate | Granulate | Granulate | Granulate | Granulate | -- | -- |
| Validation | Granulate | Granulate | Granulate | Granulate | Granulate | Granulate | -- |
| Low Volume Manufacturing (LVM) | Granulate | Granulate | Granulate | Granulate | Granulate | Granulate | Granulate |
| High Volume Manufacturing (HVM) | Coarse | Coarse | Coarse | Coarse | Coarse | Coarse | Coarse |
This document is a broad ATE test procedure overview developed to cover the full matrix of E-PIC device directions (E-E, O-O, E-O, O-E), ATE insertion points, and physical test levels (wafer, bar, die, packaged), with procedures structured across the R&D, Validation, LVM, and HVM maturity stages. Each ATE insertion point defines the optical, electrical, and environmental test methodology appropriate to its specific combination of device direction, and maturity stage. Future releases will cover a broader classification of test parameter groups to include Physical, Functional and Conditional testing as well as the finished product based on future CPO reference designs being established by the other APC working groups.
Electro-optical probe system configurations and test instrumentation requirements are inherently component-specific, driven by the device architecture (e.g., Mach-Zehnder modulator, ring modulator, EAM, SOA, or switch fabric), optical I/O interface (e.g., grating coupler or edge coupling), channel count and pitch, and electrical interface (DC, RF, mmW, or mixed-signal).
Rather than prescribing a single probe or instrumentation configuration throughout this document, the procedures herein-and in subsequent releases-define the required class of optical probing, electrical probing, and test instrumentation for each stage of the test flow. Detailed, component-specific probe and instrumentation configurations will be defined in future releases as individual device architectures and their corresponding pass/fail criteria are finalized. Protection of intellectual property embodied in the PDK and devices under test is a standing requirement throughout the test flow. Test programs, fixture designs, and data-handling procedures must ensure that proprietary design, process, and performance information is not exposed beyond authorized personnel and systems - whether through test station access controls, restricted distribution of test programs and correlation models, or secure handling of any data leaving a qualified test environment (including data shared with external partners, subcontractors, or test-equipment vendors). Software and data processing - spanning test-program execution, real-time data acquisition, post-processing (curve fitting, delta/correlation calculations, SPC/Cpk analysis), and database storage - is treated as a controlled element of each procedure, with processing rigor scaling from exploratory analysis at R&D to real-time SPC and automated binning at HVM. Finally, traceability of data within the ECO chain is maintained throughout: every test record is linked to the specific test program, fixture, and process ECO revision in effect at the time of test, so that any change in formance, and any observed performance shift can be traced backward to the process and/or test configu-
design, process, probe/fixture, or test program can be traced forward to its impact on measured device perration responsible for it.
2. ATE Insertion #1 Testing on Wafer Level
Electrical Integrated Circuit (EIC) - Electrical-to-Electrical (E-E)
Electrical & Environmental Parameter Coverage Across Program Maturity Stages
Scope: These four procedures define the electrical and environmental test methodology for the Electrical Integrated Circuit (EIC) at ATE Insertion #1, scaled appropriately for R&D, Validation, Low-Volume Manufacturing (LVM), and High-Volume Manufacturing (HVM) stages.
2.1.1 R&D-Level
Objective: Fully characterize device behavior across electrical and environmental space to establish design margins, identify failure mechanisms, and generate the parametric dataset that will define Validation-stage limits.
Sample Size: 5-15 units (engineering samples, multiple wafer lots/process corners if available).
Test Station: Benchtop-style (manual) probe system with DC and RF positioners, a DC source such as an SMU, and an RF generator. The probe system can be configured with a thermal chuck or set up with an external environmental temperature chamber. The exact probe system configuration and test setup are specific to the device-under-test (DUT) architecture.
Figure 1 - Manual Probe System
Electrical Parameters:
- ■ Full I-V sweep on all supply and I/O pins.
- ■ Static (DC) parametric: Vdd operating range, Idd (active/standby/sleep) vs. voltage/ temperature.
- ■ Input/output leakage current (Ileak) across all pins.
- ■ Threshold voltages (VIH/VIL/VOH/VOL) across supply and temperature corners.
- ■ Functional test at reduced/nominal/max clock frequency; timing margin (setup/hold, propagation delay).
- ■ AC characteristics: rise/fall time, output drive strength, slew rate.
- ■ Power supply rejection ratio (PSRR) and supply noise sensitivity.
- ■ ESD sensitivity per JS-001 (HBM) and JS-002 (CDM) - destructive, subset of units.
- ■ Latch-up susceptibility screen per JESD78.
- ■ Characterization of any analog/mixed-signal blocks (bandgap reference, PLL lock range/jitter, ADC/DAC linearity if present).
Environmental Parameters
- ■ Temperature sweep: -40°C to +125°C (or per design target), in 10°C or 5°C steps at critical regions.
- ■ Extended dwell at temperature extremes to characterize drift/settling.
- ■ Thermal cycling (subset): 10-20 cycles, monitor parametric shift pre/post.
Data Handling: All raw traces retained; full statistical distributions built per parameter. No formal pass/fail gate - data feeds spec-limit derivation for Validation.
Duration: Extended (days per unit acceptable); test time is not optimized.
2.1.2 Validation-Level
Objective: Confirm the device meets datasheet/spec limits derived from R&D characterization, establish correlation between ATE and bench measurements, and validate test program coverage prior to LVM release.
Sample Size: 30-90 units (statistically meaningful per parameter; supports Cpk estimation), spanning ≥3 lots/build groups.
Test Station: Semi or fully automatic probe system with DC and RF positioners, a DC source such as an SMU, and an RF generator. The probe system can be configured with a thermal chuck or set up with an external environmental temperature chamber. The exact probe system configuration and test setup are specific to the device-under-test (DUT) architecture.
Test instrumentation and test routines (recipes) are controlled by the software, with measurement data stored to enable device-to-device cross-correlation and performance analysis.
Semi-Automatic Probe System
Figure 2 - Semi-Automatic Probe System
Electrical Parameters:
- ■ Full parametric test list from R&D, reduced to spec-relevant subset with defined limits (LSL/USL).
- ■ DC parametric: Idd (active/standby), Ileak, VIH/VIL/VOH/VOL at supply corners (Vdd min/typ/max).
- ■ AC/functional: timing verification at spec'd frequency, setup/hold margin, output drive/slew compliance.
- ■ Corner testing: Vdd min/typ/max × Temp min/typ/max (3×3 or 3×5 DOE matrix).
- ■ ESD verification (go/no-go, sample-based per JS-001/JS-002 class targets).
- ■ Latch-up verification per JESD78 (sample-based).
- ■ Test-to-test and unit-to-unit correlation.
- ■ Gauge R&R on critical electrical parameters.
Environmental Parameters
- ■ Full temperature range verification at spec limits (e.g., -40°C, +25°C, +125°C) with pass/fail gating.
- ■ Thermal cycling per relevant JEDEC reference (e.g., JESD22-A104, 100-500 cycles on subset), monitor parametric drift.
- ■ Preconditioning per MSL classification (JESD22-A113) if package is moisture-sensitive.
- ■ HTOL (High Temperature Operating Life) precursor run on a sample, if reliability qualification is bundled into this stage.
Pass/Fail Criteria: Formal spec limits applied; failures root-caused and dispositioned (design vs. process vs. test escape).
Duration: Days to weeks per lot; test time optimization begins but is secondary to coverage.
2.1.3 Low Volume Manufacturing
Objective: Execute a production-intent, throughput-aware test flow with statistical process control (SPC) in place, while maintaining tighter sampling on environmental stress relative to HVM.
Sample Size: 100% electrical test on all units; environmental testing on a defined sample plan (e.g., 1 unit per lot or per N units, per AQL/Cpk-driven sampling).
Test Station: Fully automated, software-controlled probe system with DC and RF positioners, a DC source such as an SMU, and an RF generator. The probe system can be configured with a thermal chuck or set up with an external environmental temperature chamber. The exact probe system configuration and test setup are specific to the device-under-test (DUT) architecture.
Test instrumentation and test routines (recipes) are controlled by the software, with measurement data stored to enable device-to-device cross-correlation, performance analysis, and ECO-chain traceability.
A wafer loader enables fully automated wafer loading and unloading as part of the software-controlled test and handling process.
An optional SECS/GEM software interface enables integration with factory-level automation and manufacturing execution systems (MES) for streamlined production workflows and data management.
Automatic Probe System
Figure 3 - Automatic Probe System
Electrical Parameters
- ■ 100% test of critical-to-quality (CTQ) parameters only: Idd (active/standby), Ileak, VIH/VIL/VOH/VOL at nominal condition, functional pass/fail at spec frequency.
- ■ Reduced corner testing - nominal supply/temp only, unless SPC flags drift.
- ■ Guard banded limits (tightened from Validation limits to account for test uncertainty/GR&R).
- ■ In-line SPC charting (Xbar-R or similar) on top 5-10 CTQ parameters.
- ■ Correlation checks against Validation dataset on a periodic basis (e.g., first-article per lot).
- ■ ESD/latch-up not retested per-unit; monitored via periodic sample audit only.
Environmental Parameters
- ■ Sample-based temperature verification (e.g., hot/cold spot-check on subset per lot) rather than full sweep.
- ■ Periodic thermal cycling audit (reduced cycle count, e.g., monthly or per-lot sample) to confirm no process drift.
- ■ No full corner matrix - spot checks only, escalated to full Validation-style test if SPC signals an excursion.
Pass/Fail Criteria: Formal limits from Validation, with guard bands; SPC out-of-control triggers hold-and-investigate.
Duration: Test time actively optimized (target: seconds per unit for electrical; sample units may run longer for environmental).
2.1.4 High Volume Manufacturing (HVM)
Objective: Maximize throughput and yield visibility with minimal necessary test coverage, relying on statistical monitoring rather than exhaustive per-unit environmental testing.
Sample Size: 100% electrical test on all units; environmental testing reduced to periodic qualification-style monitors only (e.g., quarterly or per-process-change), not per-lot.
Test Station: Fully automated, software-controlled probe system with DC and RF positioners, a DC source such as an SMU, and an RF generator. The probe system can be configured with a thermal chuck or set up with an external environmental temperature chamber. The exact probe system configuration and test setup are specific to the device-under-test (DUT) architecture.
Test instrumentation and test routines (recipes) are controlled by the software, with measurement data stored to enable device-to-device cross-correlation, performance analysis, and ECO-chain traceability.
A wafer loader enables fully automated wafer loading and unloading as part of the software-controlled test and handling process.
Automatic Probe System
Figure 4 - High Volume Manufacturing (HVM) Automatic Probe System
Electrical Parameters
- ■ 100% test, minimized parameter set: Idd (active/standby), Ileak, single-point functional pass/fail at spec frequency.
- ■ Single nominal test condition (room temp, nominal Vdd) unless design margin requires a secondary hot or cold test insertion.
- ■ Fast binning logic (pass/fail/marginal) with automatic outlier flagging (e.g., part average testing / PAT)
- ■ Real-time SPC on all CTQ parameters with automatic lot-hold triggers.
- ■ Correlation audit sample pulled periodically (e.g., weekly) and cross-checked against LVM/Validation baseline.
- ■ No per-unit ESD/latch-up test; covered by process/design qualification only.
Environmental Parameters
- ■ No per-unit environmental test in the production flow.
- ■ Periodic qualification monitor (e.g., quarterly reliability sample): thermal cycling, humidity, HTOL, per original Validation-stage protocol, on a small pulled sample.
- ■ Any process, material, or design change triggers a requalification subset before returning to steadystate HVM flow.
- ■ Field-return/failure-analysis feedback loop monitored for environmental-related escapes.
Pass/Fail Criteria: Production spec limits, tight guard bands, automated disposition; any drift beyond SPC control limits halts the line pending investigation.
Duration: Seconds per unit target; environmental sampling scheduled outside the main production cadence to avoid throughput impact.
2.1.5 Summary Comparison
Table 2 - Summary Comparison
| Aspect | R&D | Validation | LVM | HVM |
|---|---|---|---|---|
| Sample size | 5-15 | 30-90 | 100% elec / sample env | 100% elec / periodic env |
| Electrical coverage | Full sweep, all pins | Full spec list, corners | CTQ subset, guard banded | Minimal CTQ, single condition |
| Environmental coverage | Full range, exploratory | Full spec limits, gated | Sample-based, SPC-triggered | Periodic qual only |
| Test time priority | Low (data-rich) | Medium | High | Highest |
| Pass/fail basis | None (data gen.) | Formal limits | Guard banded limits | Tight guard bands, auto-bin |
| Chamber use | Continuous | Frequent | Sample-based | Rare (quarterly) |
Note: Parameter names and limits should be adapted to the specific EIC architecture (digital, analog, or mixed-signal) and package in use. Environmental cycle counts, MSL preconditioning, and reliability references (JESD22, JESD78, JS-001/JS-002) should align with the applicable standards chosen for the program.
Photonic Integrated Circuit (PIC) Optical-to-Optical (O-O)
Optical, Electrical & Environmental Parameter Coverage Across Program Maturity Stages
Scope: These four procedures define the optical and environmental test methodology for the Optical-to-Optical Photonic Integrated Circuit (O-O PIC) at ATE Insertion #1, performed at wafer level (on-wafer probe, pre-dice/pre-package), scaled appropriately for R&D, Validation, Low Volume Manufacturing (LVM), and High Volume Manufacturing (HVM) stages. Insertion #1 is the first automated optical test point in the flow, using trench couplers, grating couplers, or on-wafer fiber array unit (FAU) interfaces for optical I/O access, prior to dicing, packaging, or any electrical/burn-in insertion.
2.2.1 R&D-Level
Objective: Fully characterize optical performance and process variation across the wafer to establish design margins, identify systematic vs. random loss contributors, and generate the parametric dataset that will define Validation-stage limits.
Sample Size: 5-15 die locations per wafer (spanning center, edge, and known process-gradient sites), across 1-2 wafers if available.
Test Station: Benchtop-style (manual) probe system with one or two optical positioners, an optical light source (OLS) like a tunable laser source, and optical power meter (OPM) and optical spectrum analyzer. With optional optical frequency domain reflectometer (OFDR) and optional wavelength meter (λ meter). The probe system can be configured with a thermal chuck or set up with an external environmental temperature chamber. The exact probe system configuration and test setup are specific to the device-under-test (DUT) architecture.
Figure 5 - R&D-Level - Manual Probe System
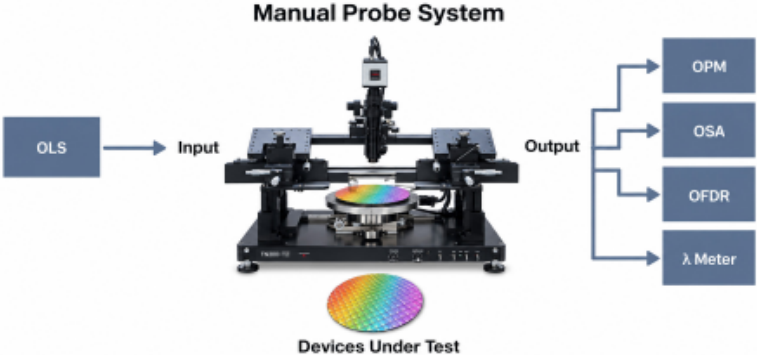
Optical Parameters
- ■ Insertion loss (IL), fiber-to-fiber and per-interface (coupler, waveguide, PIC block) at nominal wavelength
- ■ Wavelength-dependent loss (WDL) sweep across full design band (e.g., 1260-1360 nm O-band or 1530-1565 nm C-band)
- ■ Polarization-dependent loss (PDL)
- ■ Return loss / back-reflection at each optical port
- ■ Coupling loss and alignment tolerance (1-dB alignment window) for edge or grating coupler
- ■ Mode field diameter (MFD) match verification between fiber and PIC waveguide
- ■ Waveguide propagation loss (via cutback structures or ring resonator Q, if test structures present)
- ■ Crosstalk between adjacent optical channels/waveguides
- ■ If active elements present (modulator, SOA, switch): extinction ratio, optical bandwidth, PAM4/eye linearity, switching time
- ■ Wavelength/temperature dependence of any resonant structures (e.g., ring/MZI thermal tuning coefficient, pm/°C)
- ■ Resonant wavelength/channel wavelength verification against target grid, especially post-trim, including trim convergence and residual wavelength error.
- ■ Vπ or VπL for modulators, if modulators are present.
- ■ SOA gain and saturation characteristics, if SOAs are present.
- ■ Absolute optical output power, if active optical sources/amplifiers are present.
- ■ Photodiode responsivity / dark current, if receiver photodiodes are present.
- ■ Thermal tuner power consumption versus wavelength shift, not just pm/°C. This gives actual tuning efficiency.
Environmental Parameters
- ■ Wafer chuck temperature sweep: -40°C to +85°C (or per design target) at probe, in 10-20°C steps
- ■ Optical performance drift vs. temperature at each measured parameter above.
- ■ Humidity exposure - informational only at wafer level (limited applicability pre-package); primarily flagged for post-dice/package stage.
- ■ Repeat measurement (probe re-touchdown) to characterize alignment repeatability as a function of temperature.
Data Handling: All raw spectral/loss traces retained; full statistical distributions built per parameter and mapped spatially across the wafer. No formal pass/fail gate
- data feeds spec-limit and wafer-map derivation for Validation.
Duration: Extended (hours per die acceptable); test time is not optimized, full wavelength sweeps used throughout.
2.2.2 Validation-Level
Objective: Confirm the PIC meets datasheet/spec limits derived from R&D characterization at wafer level, establish correlation between wafer-probe and packaged-device measurements, and validate test program/wafer-map coverage prior to LVM release.
Sample Size: 30-90 die locations (statistically meaningful per parameter; supports Cpk and wafer-map uniformity estimation), spanning ≥3 wafers/lots.
Test Station: Semi- or fully automatic probe system with one or two optical positioners, an optical light source (OLS) like a tunable laser source, and optical power meter (OPM) and optical spectrum analyzer. With optional optical frequency domain reflectometer (OFDR) and optional wavelength meter (λ meter). The probe system can be configured with a thermal chuck or set up with an external environmental temperature chamber. The exact probe system configuration and test setup are specific to the device-under-test (DUT) architecture.
Test instrumentation and test routines (recipes) are controlled by the software, with measurement data stored to enable device-to-device cross-correlation and performance analysis.
Semi-Automatic Probe System
Figure 6 - Validation - Semi-Automatic Probe System
Optical Parameters
- ■ Full parametric list from R&D, reduced to spec-relevant subset with defined limits (LSL/USL).
- ■ Insertion loss at nominal + spec-band edges (3-point or 5-point wavelength test, not full sweep).
- ■ PDL, return loss at spec-defined limits.
- ■ Extinction ratio / modulation performance (if active) at nominal bias and spec wavelength.
- ■ Coupling alignment tolerance verification (auto-align convergence and repeatability).
- ■ Corner testing: Temp min/typ/max × wavelength band edges.
- ■ Wafer-probe-to-packaged-module correlation study (subset of die tracked through packaging).
- ■ Gauge R&R on critical optical parameters (repeat touchdown study).
Environmental Parameters
- ■ Temperature verification at spec limits (e.g., -40°C, +25°C, +85°C) with pass/fail gating on optical parameters.
- ■ Thermal tuning coefficient verification for resonant elements, if applicable.
- ■ Wafer-map uniformity analysis (spatial trending of IL, WDL, PDL across reticle/wafer).
- ■ Preliminary correlation to post-package environmental stress (thermal cycling, humidity) performed on packaged units from this same wafer population, feeding back into wafer-level pass/fail limits.
Pass/Fail Criteria: Formal spec limits applied; failures root-caused and dispositioned (design vs. process vs. test escape vs. alignment/fixture artifact).
Duration: Hours to a day per wafer; test time optimization begins (reduced wavelength points, faster auto-align) but coverage remains primary.
2.2.3 Low Volume Manufacturing (LVM)
Objective: Execute a production-intent, throughput-aware wafer-level optical test flow with statistical process control (SPC) in place, while maintaining tighter environmental/ wavelength sampling than HVM.
Sample Size: 100% die tested for core optical parameters (or reticle-representative subset if full-wafer test time is prohibitive); environmental/full-spectrum testing on a defined sample plan (e.g., 1 wafer per lot, or N die per wafer).
Test Station: Fully automated, software-controlled probe system with one or two optical positioners, an optical light source (OLS) like a tunable laser source, and optical power meter (OPM) and optical spectrum analyzer. With optional optical frequency domain reflectometer (OFDR). The probe system can be configured with a thermal chuck or set up with an external environmental temperature chamber. The exact probe system configuration and test setup are specific to the device-under-test (DUT) architecture.
Test instrumentation and test routines (recipes) are controlled by the software, with measurement data stored to enable device-to-device cross-correlation, performance analysis, and ECO-chain traceability.
A wafer loader enables fully automated wafer loading and unloading as part of the software-controlled test and handling process.
An optional SECS/GEM software interface enables integration with factory-level automation and manufacturing execution systems (MES) for streamlined production workflows and data management.
Automatic Probe System
Figure 7 - Low Volume Manufacturing (LVM) - Automatic Probe System
Optical Parameters
- ■ 100% (or high-coverage) test of critical-to-quality (CTQ) parameters only: insertion loss at nominal wavelength, extinction ratio (if active), return loss go/no-go.
- ■ Reduced wavelength testing - single or dual-point (band-edge) check rather than full sweep, unless SPC flags drift.
- ■ Guard banded limits (tightened from Validation limits to account for alignment/test uncertainty).
- ■ In-line SPC charting (Xbar-R or wafer-map trend) on top CTQ optical parameters.
- ■ Correlation checks against Validation dataset on a periodic basis (e.g., first-wafer per lot).
- ■ PDL and full-band WDL sampled rather than tested per die.
Environmental Parameters
- ■ Sample-based temperature verification (e.g., hot/cold spot-check on subset of die per wafer/lot) rather than full sweep.
- ■ Periodic thermal-tuning-coefficient audit (reduced sample, e.g., per-lot) for resonant structures
- ■ No full corner matrix - spot checks only, escalated to full Validation-style test if SPC signals an excursion.
- ■ Wafer-map uniformity spot-checked against Validation baseline.
| Pass/Fail Criteria: | Formal limits from Validation, with guard bands; SPC out-of-control triggers hold-and-investigate. |
|---|---|
| Duration: | Test time actively optimized (target: seconds-to-low-minutes per die); auto-align speed and reduced wavelength points are the primary throughput levers. |
2.2.4 High Volume Manufacturing (HVM)
Objective: Maximize wafer-probe throughput and yield visibility with minimal necessary optical test coverage, relying on statistical/spatial monitoring rather than exhaustive per-die environmental or full-spectrum testing.
Sample Size: 100% die tested for a minimal CTQ optical parameter set; environmental and full-spectrum testing reduced to periodic qualification-style monitors only (e.g., quarterly or per-process-change), not per-lot. Sampling frequency shall be increased following SPC/yield excursions, significant process or material changes, equipment changes affecting measurement correlation, or abnormal wafer-level spatial signatures.
Qualified reference die or reference structures shall be periodically measured to monitor optical alignment, wavelength accuracy, optical power calibration, probe/contact stability, RF-path performance, and overall ATE drift.
Test Station: Fully automated, software-controlled probe system with one or two optical positioners, an optical light source (OLS), such as a tunable laser source, and an optical power meter (OPM). The system can be configured with an integrated thermal chuck or an external environmental temperature chamber. The exact probe system configuration and test setup are tailored to the device-under-test (DUT) architecture and application.
Test instrumentation, measurement sequences, and test routines (recipes) are software controlled, with measurement data automatically captured and stored to enable device-to-device cross-correlation, performance analysis, process monitoring, and ECO-chain traceability.
A wafer loader enables fully automated wafer loading and unloading as part of the software-controlled test and handling process.
An optional SECS/GEM software interface enables integration with factory-level automation and manufacturing execution systems (MES) for streamlined production workflows and data management.
Figure 8 - High Volume Manufacturing (HVM) - Automatic Probe System
Optical Parameters
- ■ 100% test, minimized parameter set: insertion loss (single wavelength, go/no-go), extinction ratio pass/fail (if active), coarse return-loss check.
- ■ Single nominal test condition (room temp, nominal bias, single wavelength) unless design margin requires a secondary condition.
- ■ Fast binning logic (pass/fail/marginal) with automatic outlier flagging.
- ■ Real-time SPC and wafer-map trending on all CTQ parameters with automatic lot-hold triggers.
- ■ Correlation audit sample pulled periodically (e.g., weekly) and cross-checked against LVM/Validation baseline.
- ■ Full WDL/PDL characterization not performed in-line; covered by periodic sample only.
Environmental Parameters
- ■ No per-die environmental test in the production flow
- ■ Periodic qualification monitor (e.g., quarterly reliability sample): temperature sweep, thermal-tuning coefficient, per original Validation-stage protocol, on a small pulled sample of die/wafers
- ■ Any process, material, or design change triggers a requalification subset before returning to steadystate HVM flow
- ■ Field-return/failure-analysis feedback loop (post-package/post-deployment) monitored for optical or
Pass/Fail Criteria: Production spec limits, tight guard bands, automated disposition; any drift beyond SPC or wafer-map control limits halts the lot pending investigation.
Duration: Seconds per die target; environmental and full-spectrum sampling scheduled outside the main production cadence to avoid throughput impact.
Test sequencing, auto-alignment, wavelength settling, instrument configuration, and automated data processing shall be optimized to minimize non-measurement overhead without compromising CTQ defect-detection capability.
2.2.5 Summary Comparison
Table 3 - Summary Comparison
| Aspect | R&D | Validation | LVM | HVM |
|---|---|---|---|---|
| Sample size | 5-15 die | 30-90 die | 100% CTQ / sample env | 100% CTQ / periodic env |
| Optical coverage | Full spectral sweep, all ports | Full spec list, corners | CTQ subset, guard banded | Minimal CTQ, single wavelength |
| Environmental cov- erage | Full range, explor- atory | Full spec limits, gated | Sample-based, SPC-triggered | Periodic qual only |
| Alignment method | Manual/semi-auto | Auto-align (qualified) | Auto-align (locked) | Auto-align (high-speed) |
| Test time priority | Low (data-rich) | Medium | High | Highest |
| Pass/fail basis | None (data gen.) | Formal limits | Guard banded limits | Tight guard bands, auto-bin |
| Wafer-map use | Full spatial mapping | Uniformity validation | Spot-check vs. baseline | Trend monitoring only |
Note: Optical parameter names and limits should be adapted to the specific O-O PIC architecture (passive routing, active modulation/switching, resonant elements, etc.), wavelength band (O-band, C-band, or other), and optical I/O interface (edge coupler, grating coupler, FAU) in use. Wafer-level testing inherently limits environmental coverage (e.g., humidity, thermal cycling) compared to packaged-device testing - these should be formally re-verified at the post-package insertion in the overall test flow.
3. ATE Insertion #2 Testing on Wafer level
Electro-Photonic Integrated Circuit (E-PIC) Optical-to-Optical (O-O)
Optical, Electrical & Environmental Parameter Coverage Across Program Maturity Stages
Scope: These four procedures define the optical and environmental test methodology for the Optical-toOptical Electro-optic Photonic Integrated Circuit (O-O E-PIC) at ATE Insertion #2, performed at wafer level. Insertion #2 occurs after Insertion #1 and after an intervening backend process step relevant to photonic performance - e.g., wavelength/resonance trim (laser or thermal annealing of ring/MZI elements), passivation or cladding deposition, redistribution layer (RDL)/bump formation, or a burn-in/stress step - and serves as the final wafer-level optical gate prior to dicing/singulation. As such, Insertion #2 places additional emphasis on (a) correlation and delta-tracking against Insertion #1 data for the same die, (b) confirmation that the intervening process step met its intended target (e.g., trim convergence), and (c) final wavelength/performance binning or grading where applicable. Optical access remains via trench or grating coupler with a channel optical probe or multi-channel FAU probe; DC/RF electrical bias is applied via probe to exercise the active E-PIC elements under optical test, consistent with Insertion #1.
| 3.1.1 R&D-Level | |
|---|---|
| Objective: | Fully characterize post-process-step optical/electro-optic performance, quantify the effect of the intervening backend step (trim, passivation, RDL/bump, burn-in) relative to Insertion #1 baseline, and establish Insertion #2-specific spec limits and correlation models for Validation. |
| Sample Size: | 5-15 die locations per wafer, matched to the same die measured at Insertion #1 (paired dataset), across 1-2 wafers if available. |
| Test Station: | Benchtop-style (manual) probe stationsystem with active fiber alignment (6-axis nanopositioner) combined with DC/RF probe cardone or needles,two optical po- sitioners, an optical light source (OLS) like a tunable laser source (O-band/C-band coverage), and optical power meters, polarization controller, high-speed BERT/ PAM4 source-meter (OPM) and optical spectrum analyzer, and . With optional optical frequency domain reflectometer (OFDR) and optional wavelength meter (λ meter). The probe system can be configured with a thermal chuck or set up with an external environmental (thermal chuck) capabilitytemperature chamber. The exact probe system configuration and test setup are specific to the device-un- der-test (DUT) architecture. |
Figure 9 - 3.1.1 R&D-Level - Manual Probe System
Optical Parameters
- ■ Insertion loss (IL), fiber-to-fiber and per-interface, at nominal wavelength and nominal bias - compared die-for-die against Insertion #1 result (delta-IL).
- ■ Wavelength-dependent loss (WDL) sweep across full design band.
- ■ Resonant wavelength / channel wavelength verification against target grid (post-trim), with trim convergence/accuracy analysis.
- ■ Polarization-dependent loss (PDL).
- ■ Return loss / back-reflection at each optical port.
- ■ Coupling loss and alignment tolerance (1-dB alignment window).
- ■ Crosstalk between adjacent optical channels/waveguides.
- ■ Electro-optic response: Vpi, modulator bandwidth (S21/E-O response), extinction ratio vs. bias, chirp (if applicable), SOA gain/saturation curve, switching time - delta-tracked against Insertion #1.
- ■ PAM4/eye linearity and TDECQ at representative data rate.
- ■ RIN across bias range.
- ■ Thermal tuning coefficient (pm/°C) and thermal tuner power consumption vs. wavelength shift - verification that trim/anneal achieved target tuning range and efficiency.
- ■ Die-level pass/fail delta analysis: identify any die that regressed between Insertion #1 and Insertion #2 (process-induced degradation) vs. die that improved (successful trim).
Environmental Parameters
- ■ Wafer chuck temperature sweep: -40°C to +85°C (or per design target) at probe, in 10-20°C steps
- ■ Electro-optic parameter drift vs. temperature (Vpi shift, extinction ratio degradation, wavelength/ thermal tuning drift), compared against Insertion #1 temperature-dependence data to detect any process-induced shift in temperature sensitivity.
- ■ Repeat measurement (probe re-touchdown) to characterize alignment repeatability as a function of temperature, and to distinguish measurement noise from true process-step-induced shift.
Data Handling: All raw traces retained and paired to the corresponding Insertion #1 record per die; delta/drift statistics built per parameter and mapped spatially across the wafer. No formal pass/fail gate - data feeds spec-limit derivation, trim-process tuning, and correlation-model development for Validation.
Duration: Extended (hours per die acceptable); test time is not optimized, full wavelength and bias sweeps used throughout.
3.1.2 Validation-Level
Objective: Confirm the E-PIC meets Insertion #2 (post-process-step) datasheet/spec limits, validate the die-level correlation model between Insertion #1 and Insertion #2, confirm trim/backend process capability, and validate test program/wafer-map coverage prior to LVM release.
Sample Size: 30-90 die locations (statistically meaningful per parameter; supports Cpk and wafer-map uniformity estimation), spanning ≥3 wafers/lots, all paired to their Insertion #1 records.
Test Station: Semi- or fully automatic probe system with one or two optical positioners, an optical light source (OLS) like a tunable laser source, and optical power meter (OPM) and optical spectrum analyzer. With optional optical frequency domain reflectometer (OFDR) and optional wavelength meter (λ meter). The probe system can be configured with a thermal chuck or set up with an external environmental temperature chamber. The exact probe system configuration and test setup are specific to the device-under-test (DUT) architecture.
Test instrumentation and test routines (recipes) are controlled by the software, with measurement data stored to enable device-to-device cross-correlation and performance analysis.
Semi-Automatic Probe System
Figure 10 - 3.1.1 R&D-Level - Manual Probe System
Optical Parameters
- ■ Full parametric list from R&D, reduced to spec-relevant subset with defined limits (LSL/USL) specific to post-process-step targets.
- ■ Insertion loss at nominal + spec-band edges (3-point or 5-point wavelength test, not full sweep) - with delta-IL limit vs. Insertion #1.
- ■ Resonant/channel wavelength verification against target grid; trim capability (Cpk) analysis.
- ■ PDL, return loss at spec-defined limits.
- ■ Extinction ratio, Vpi, and modulation bandwidth at nominal bias and spec wavelength.
- ■ TDECQ / eye mask compliance at spec data rate (single condition).
- ■ Coupling alignment tolerance verification (auto-align convergence and repeatability).
- ■ Corner testing: Temp min/typ/max × Bias min/typ/max × wavelength band edges.
- ■ Insertion #1-to-Insertion #2 correlation study formalized (regression/limit-setting for using Insertion #1 as a predictive screen, if applicable).
- ■ Wafer-probe-to-packaged-module correlation study (subset of die tracked through packaging).
- ■ Gauge R&R on critical optical and electro-optic parameters (repeat touchdown study).
Environmental Parameters
- ■ Temperature verification at spec limits (e.g., -40°C, +25°C, +85°C) with pass/fail gating on optical and electro-optic parameters.
- ■ Thermal tuning coefficient and thermal tuner power verification against post-trim targets.
- ■ Wafer-map uniformity analysis (spatial trending of IL, WDL, PDL, Vpi, extinction ratio, wavelength across reticle/wafer).
- ■ Preliminary correlation to post-package environmental stress (thermal cycling) performed on packaged units from this same wafer population, feeding back into Insertion #2 pass/fail limits.
Pass/Fail Criteria: Formal spec limits applied, including delta-vs-Insertion-#1 limits where relevant; failures root-caused and dispositioned (design vs. process vs. trim/ backend step vs. test escape vs. alignment/fixture artifact).
Duration: Hours to a day per wafer; test time optimization begins (reduced wavelength/ bias points, faster auto-align) but coverage remains primary.
3.1.3 Low Volume Manufacturing (LVM)
Objective: Execute a production-intent, throughput-aware wafer-level optical/electro-optic test flow at Insertion #2 with statistical process control (SPC) in place, while maintaining tighter environmental/wavelength/bias sampling than HVM, and confirming trim/backend process stability lot-to-lot.
Sample Size: 100% die tested for core optical and electro-optic CTQ parameters (or reticle-representative subset if full-wafer test time is prohibitive); environmental/full-spectrum testing on a defined sample plan (e.g., 1 wafer per lot, or N die per wafer).
Test Station: Fully automated, software-controlled probe system with one or two optical positioners, an optical light source (OLS) like a tunable laser source, and optical power meter (OPM) and optical spectrum analyzer. With optional optical frequency domain reflectometer (OFDR). The probe system can be configured with a thermal chuck or set up with an external environmental temperature chamber. The exact probe system configuration and test setup are specific to the device-under-test (DUT) architecture.
Test instrumentation and test routines (recipes) are controlled by the software, with measurement data stored to enable device-to-device cross-correlation, performance analysis, and ECO-chain traceability.
A wafer loader enables fully automated wafer loading and unloading as part of
Figure 11 - Low Volume Manufacturing (LVM) - Automatic Probe System
Optical Parameters
- ■ 100% (or high-coverage) test of critical-to-quality (CTQ) parameters only: insertion loss at nominal wavelength, resonant/channel wavelength go/no-go (post-trim), extinction ratio, Vpi go/no-go, return loss go/no-go.
- ■ Reduced wavelength testing - single or dual-point (band-edge) check rather than full sweep, unless SPC flags drift.
- ■ Guardbanded limits (tightened from Validation limits to account for alignment/test uncertainty).
- ■ In-line SPC charting (Xbar-R or wafer-map trend) on top CTQ optical and electro-optic parameters, including trim-process Cpk tracking.
- ■ Correlation checks against Validation dataset and Insertion #1 correlation model on a periodic basis (e.g., first-wafer per lot).
- ■ PDL, full-band WDL, and modulation bandwidth sampled rather than tested per die.
Environmental Parameters
- ■ Sample-based temperature verification (e.g., hot/cold spot-check on subset of die per wafer/lot) rather than full sweep.
- ■ Periodic thermal-tuning-coefficient audit (reduced sample, e.g., per-lot) for resonant structures.
- ■ No full corner matrix - spot checks only, escalated to full Validation-style test if SPC signals an excursion.
- ■ Wafer-map uniformity spot-checked against Validation baseline.
Pass/Fail Criteria: Formal limits from Validation, with guardbands; SPC out-of-control (including trim-process Cpk drift) triggers hold-and-investigate.
Duration: Test time actively optimized (target: seconds-to-low-minutes per die); auto-align speed, reduced wavelength points, and single-bias-point testing are the primary throughput levers.
3.1.4 High Volume Manufacturing (HVM)
Objective: Maximize wafer-probe throughput and yield visibility at the final wafer-level gate, with minimal necessary optical test coverage, relying on statistical/spatial monitoring rather than exhaustive per-die environmental or full-spectrum testing.
Sample Size: 100% die tested for a minimal CTQ optical/electro-optic parameter set; environmental and full-spectrum testing reduced to periodic qualification-style monitors only (e.g., quarterly or per-process-change), not per-lot.
Test Station: Fully automated, software-controlled probe system with one or two optical positioners, an optical light source (OLS), such as a tunable laser source, and an optical power meter (OPM). The system can be configured with an integrated thermal chuck or an external environmental temperature chamber. The exact probe system configuration and test setup are tailored to the device-under-test (DUT) architecture and application.
Test instrumentation, measurement sequences, and test routines (recipes) are software controlled, with measurement data automatically captured and stored to enable device-to-device cross-correlation, performance analysis, process monitoring, and ECO-chain traceability.
A wafer loader enables fully automated wafer loading and unloading as part of the software-controlled test and handling process.
An optional SECS/GEM software interface enables integration with factorylevel automation and manufacturing execution systems (MES) for streamlined production workflows and data management.
Figure 12 - High Volume Manufacturing (HVM) - Automatic Probe System
Optical Parameters
- ■ 100% test, minimized parameter set: insertion loss (single wavelength, go/no-go), resonant/channel wavelength go/no-go, extinction ratio pass/fail, Vpi pass/fail, coarse return-loss check.
- ■ Single nominal test condition (room temp, nominal bias, single wavelength) unless design margin requires a secondary condition.
- ■ Fast binning logic (pass/fail/marginal) with automatic outlier flagging; wavelength/performance-grade binning applied here if final grading occurs at this insertion.
- ■ Real-time SPC and wafer-map trending on all CTQ parameters with automatic lot-hold triggers.
- ■ Correlation audit sample pulled periodically (e.g., weekly) and cross-checked against LVM/Validation baseline and Insertion #1 model.
- ■ Full WDL/PDL, modulation bandwidth, and TDECQ characterization not performed in-line; covered by periodic sample only.
Environmental Parameters
- ■ No per-die environmental test in the production flow.
- ■ Periodic qualification monitor (e.g., quarterly reliability sample): temperature sweep, thermal-tuning coefficient, per original Validation-stage protocol, on a small pulled sample of die/wafers.
- ■ Any process, material, trim, or design change triggers a requalification subset before returning to steady-state HVM flow.
- ■ Field-return/failure-analysis feedback loop (post-package/post-deployment) monitored for optical or environmental-related escapes traced back to wafer-level or trim-process signatures.
Pass/Fail Criteria: Production spec limits, tight guardbands, automated disposition; any drift beyond SPC or wafer-map control limits halts the lot pending investigation.
Duration: Seconds per die target; environmental and full-spectrum sampling scheduled outside the main production cadence to avoid throughput impact.
3.1.5 Summary Comparison
Table 4 - Summary Comparison
| Aspect | R&D | Validation | LVM | HVM |
|---|---|---|---|---|
| Sample size | 5-15 die | 30-90 die | 100% CTQ / sample env | 100% CTQ / periodic env |
| Optical/E-O coverage | Full spectral + bias sweep, Ins#1 delta | Full spec list, corners, delta limits | CTQ subset, guard banded | Minimal CTQ, single condition |
| Environmental cov- erage | Full range, exploratory | Full spec limits, gated | Sample-based, SPC-triggered | Periodic qual only |
| Correlation focus | Insertion #1 vs #2 delta characterization | Formalized correlation model | Periodic model check | Periodic model check |
| Alignment method | Manual/semi-auto | Auto-align (qualified) | Auto-align (locked) | Auto-align (high-speed) |
| Probe access | Optical, DC, RF Manual/semi-auto | Optical, DC, RF au- to-align (qualified) | Optical, DC, RF auto-align (qualified) | Optical, DC, RF auto-align (high-speed) |
| Test time priority | Low (data-rich) | Medium | High | Highest |
| Pass/fail basis | None (data gen.) | Formal limits + delta limits | Guard banded limits | Tight guard bands, auto-bin |
| Wafer-map use | Full spatial mapping | Uniformity validation | Spot-check vs. baseline | Trend monitoring only |
Note: Optical and electro-optic parameter names and limits should be adapted to the specific O-O E-PIC architecture (Mach-Zehnder modulator, ring modulator, EAM, SOA, switch fabric, etc.), wavelength band (O-band, C-band, or other), modulation format (NRZ, PAM4), and optical I/O interface (edge coupler, grating coupler, FAU) in use. The specific intervening backend step between Insertion #1 and Insertion #2 (trim/ anneal, passivation, RDL/bump, burn-in, etc.) should be explicitly identified in the program's process flow documentation, since it determines which delta parameters matter most and whether Insertion #1 can serve as a predictive pre-screen to reduce Insertion #2 test scope. Die-level traceability (linking each die's Insertion #1 and Insertion #2 records) is required to support delta-tracking and should be established as an infrastructure requirement starting at R&D. As with Insertion #1, wafer-level testing inherently limits environmental coverage (e.g., thermal cycling) compared to packaged-device testing - these should be formally re-verified at the post-package insertion in the overall test flow.
3.2
Electro-Photonic Integrated Circuit (E-PIC) Optical-to-Electrical (O-E)
Optical, Electrical & Environmental Parameter Coverage Across Program Maturity Stages
Scope: These four procedures define the optical, electrical, and environmental test methodology for the Optical-to-Electrical Electro-optic Photonic Integrated Circuit (O-E E-PIC) at ATE Insertion #2, performed at wafer level. The device under test takes an optical input and produces an electrical output (receiver-side PIC: photodiode, or integrated photodiode + transimpedance amplifier (TIA)). Insertion #2 occurs after Insertion #1 and after an intervening backend process step relevant to receiver performance - e.g., passivation or anti-reflection coating deposition, redistribution layer (RDL)/bump formation, TIA trim/ calibration, or a burn-in/stress step - and serves as the final wafer-level gate prior to dicing/singulation. Insertion #2 places additional emphasis on (a) correlation and delta-tracking against Insertion #1 data for the same die, (b) confirmation that the intervening process step met its intended target (e.g., TIA gain trim convergence, coating performance), and (c) final performance binning or grading where applicable. Optical fiber probe access (input side - edge coupler, grating coupler, or FAU) and DC/RF electrical probe access (output side) remain consistent with Insertion #1.
3.1.4 High Volume Manufacturing (HVM)
Objective: Fully characterize post-process-step optical-to-electrical conversion performance, quantify the effect of the intervening backend step (passivation/AR coating, RDL/ bump, TIA trim, burn-in) relative to Insertion #1 baseline, and establish Insertion #2-specific spec limits and correlation models for validation.
Sample Size: 5-15 die locations per wafer, matched to the same die measured at Insertion #1 (paired dataset), across 1-2 wafers if available.
Test Station: Benchtop-style (manual) probe system with an optical, DC and RF positioner, an optical light source (OLS) like a tunable laser source, a DC meter such as a SMU, and an Ampere meter and oscilloscope. The probe system can be configured with a thermal chuck or set up with an external environmental temperature chamber. The exact probe system configuration and test setup are specific to the device-under-test (DUT) architecture.
Figure 13 - R & D Level - Manual Probe System
Optical Parameters (input side)
- ■ Optical input power range (min/max operating power).
- ■ Coupling loss and alignment tolerance (1-dB alignment window) at input port.
- ■ Return loss / back-reflection at optical input port - delta-tracked against Insertion #1 to detect any AR-coating-related change.
- ■ Wavelength-dependent responsivity sweep across full design band.
- ■ Polarization-dependent responsivity (PDR).
- ■ Overload/saturation optical input power threshold.
Electrical Parameters (output side)
- ■ Photodiode dark current (Id) vs. reverse bias voltage and temperature - compared die-for-die against Insertion #1 result (delta-Id).
- ■ Responsivity (A/W) at nominal wavelength and bias - delta-tracked against Insertion #1.
- ■ Photodiode capacitance vs. bias (Cj-V).
- ■ 3-dB electrical/optical bandwidth (S21 or equivalent) vs. bias.
- ■ TIA transimpedance gain, bandwidth, and output swing (if integrated TIA present) - verification that TIA trim/calibration achieved target gain setting.
Electrical Parameters (output side) con't
- ■ Input-referred noise current / noise equivalent power (NEP).
- ■ Common-mode rejection ratio (CMRR) for differential outputs, if applicable.
- ■ Supply current (Idd) vs. voltage/temperature for TIA/bias circuitry.
- ■ Eye diagram / PAM4 linearity and TDECQ at representative data rate and input power.
- ■ Sensitivity (minimum optical input power for target BER) across data rate/modulation format - delta-tracked against Insertion #1.
- ■ Overload sensitivity (maximum optical input power before BER degradation).
Environmental Parameters
- ■ Wafer chuck temperature sweep: -40°C to +85°C (or per design target) at probe, in 10-20°C steps.
- ■ Optical and electrical parameter drift vs. temperature (dark current, responsivity, sensitivity shift, TIA gain drift), compared against Insertion #1 temperature-dependence data to detect any process-induced shift in temperature sensitivity.
- ■ Humidity exposure - informational only at wafer level (limited applicability pre-package); primarily flagged for post-dice/package stage.
- ■ Repeat measurement (probe re-touchdown) to characterize optical and electrical alignment repeatability as a function of temperature, and to distinguish measurement noise from true process-step-induced shift.
Data Handling: All raw responsivity, noise, bandwidth, and eye/BER traces retained and paired to the corresponding Insertion #1 record per die; delta/drift statistics built per parameter and mapped spatially across the wafer. No formal pass/fail gate - data feeds spec-limit derivation, TIA-trim/coating process tuning, and correlation-model development for validation.
Duration: Extended (hours per die acceptable); test time is not optimized, full bias, wavelength, and power sweeps used throughout..
3.2.2 Validation-Level
Objective: Confirm the E-PIC meets Insertion #2 (post-process-step) datasheet/spec limits, validate the die-level correlation model between Insertion #1 and Insertion #2, confirm TIA-trim/coating process capability, and validate test program/wafer-map coverage prior to LVM release.
Sample Size: 30-90 die locations (statistically meaningful per parameter; supports Cpk and wafer-map uniformity estimation), spanning ≥3 wafers/lots, all paired to their Insertion #1 records.
Test Station: Semi- or fully automatic probe system with an optical, DC and RF positioner, an optical light source (OLS) like a tunable laser source, a DC meter such as a SMU, and an Ampere meter and oscilloscope. The probe system can be configured with a thermal chuck or set up with an external environmental temperature chamber. The exact probe system configuration and test setup are specific to the device-under-test (DUT) architecture.
Test instrumentation and test routines (recipes) are controlled by the software, with measurement data stored to enable device-to-device cross-correlation and performance analysis.
Semi-Automatic Probe System
Figure 14 - Validation - Semi-Automatic Probe System
Optical Parameters (input side)
- ■ Coupling alignment tolerance verification (auto-align convergence and repeatability).
- ■ Optical input power range verification against spec limits.
- ■ Return loss at spec-defined limits, with delta limit vs. Insertion #1.
- ■ Responsivity at nominal + spec-band edges (3-point wavelength test, not full sweep).
Electrical Parameters (output side)
- ■ Dark current, responsivity, and TIA gain verification against spec limits at nominal bias, with delta limits vs. Insertion #1.
- ■ TIA gain-trim capability (Cpk) analysis against target setting.
- ■ 3-dB bandwidth verification at spec condition.
- ■ Sensitivity and overload verification at spec data rate/modulation format, with delta limit vs. Insertion #1.
- ■ TDECQ / eye mask compliance at spec data rate (single condition).
- ■ Corner testing: Temp min/typ/max × Bias min/typ/max × optical input power min/typ/max.
- ■ Insertion #1-to-Insertion #2 correlation study formalized (regression/limit-setting for using Insertion #1 as a predictive screen, if applicable).
- ■ Wafer-probe-to-packaged-module correlation study (subset of die tracked through packaging).
- ■ Gauge R&R on critical optical and electrical parameters (repeat touchdown study.
Environmental Parameters
- ■ Temperature verification at spec limits (e.g., -40°C, +25°C, +85°C) with pass/fail gating on optical and electrical parameters.
- ■ Wafer-map uniformity analysis (spatial trending of dark current, responsivity, sensitivity, bandwidth across reticle/wafer).
- ■ Preliminary correlation to post-package environmental stress (thermal cycling) performed on packaged units from this same wafer population, feeding back into Insertion #2 pass/fail limits.
Pass/Fail Criteria: Formal spec limits applied, including delta-vs-Insertion-#1 limits where relevant; failures root-caused and dispositioned (design vs. process vs. TIA-trim/ coating step vs. test escape vs. alignment/fixture artifact).
Duration: Hours to a day per wafer; test time optimization begins (reduced bias/wavelength/power points, faster auto-align) but coverage remains primary.
3.2.3 Low Volume Manufacturing (LVM)
Objective: Execute a production-intent, throughput-aware wafer-level optical/electrical test flow at Insertion #2 with statistical process control (SPC) in place, while maintaining tighter environmental/corner sampling than HVM, and confirming TIA-trim/ coating process stability lot-to-lot.
Sample Size: 100% die tested for core optical and electrical CTQ parameters (or reticlerepresentative subset if full-wafer test time is prohibitive); environmental/full-corner testing on a defined sample plan (e.g., 1 wafer per lot, or N die per wafer).
Test Station: Semi- or fully automatic probe system with an optical, DC and RF positioner, an optical light source (OLS) like a tunable laser source, a DC meter such as a SMU, and an Ampere meter. The probe system can be configured with a thermal chuck or set up with an external environmental temperature chamber. The exact probe system configuration and test setup are specific to the device-under-test (DUT) architecture.
Test instrumentation and test routines (recipes) are controlled by the software, with measurement data stored to enable device-to-device cross-correlation and performance analysis.
A wafer loader enables fully automated wafer loading and unloading as part of the software-controlled test and handling process.
Automatic Probe System
Figure 15 - Low Volume Manufacturing (LVM) - Automatic Probe System
Optical Parameters (input side)
- ■ 100% test of coupling alignment go/no-go at nominal input power.
- ■ Return loss coarse check.
- ■ Full wavelength responsivity sweep and PDR sampled rather than tested per die.
Electrical Parameters (output side)
- ■ 100% (or high-coverage) test of critical-to-quality (CTQ) parameters only: dark current go/no-go, responsivity at nominal condition, TIA gain go/no-go, sensitivity go/no-go at spec data rate.
- ■ Reduced condition testing - single bias/temp/power point rather than full sweep, unless SPC flags drift.
- ■ Guard banded limits (tightened from Validation limits to account for alignment/test uncertainty)
- ■ In-line SPC charting (Xbar-R or wafer-map trend) on top CTQ optical and electrical parameters, including TIA-trim process Cpk tracking.
- ■ Correlation checks against Validation dataset and Insertion #1 correlation model on a periodic basis (e.g., first-wafer per lot).
- ■ Full bandwidth sweep, TDECQ, and overload characterization sampled rather than tested per die.
Environmental Parameters
- ■ Sample-based temperature verification (e.g., hot/cold spot-check on subset of die per wafer/lot) rather than full sweep.
- ■ No full corner matrix - spot checks only, escalated to full Validation-style test if SPC signals an excursion.
- ■ Wafer-map uniformity spot-checked against Validation baseline.
Pass/Fail Criteria: Formal limits from Validation, with guardbands; SPC out-of-control (including TIA-trim process Cpk drift) triggers hold-and-investigate.
Duration: Test time actively optimized (target: seconds-to-low-minutes per die); auto-align speed and single-condition testing are the primary throughput levers.
3.2.4 High Volume Manufacturing (HVM)
Objective: Maximize wafer-probe throughput and yield visibility at the final wafer-level gate, with minimal necessary optical/electrical test coverage, relying on statistical/ spatial monitoring rather than exhaustive per-die environmental or full-condition testing.
Sample Size: 100% die tested for a minimal CTQ optical/electrical parameter set; environmental and full-condition testing reduced to periodic qualification-style monitors only (e.g., quarterly or per-process-change), not per-lot.
Test Station: Semi- or fully automatic probe system with an optical, DC and RF positioner, an optical light source (OLS) like a tunable laser source, a DC meter such as a SMU, and an Ampere meter. The probe system can be configured with a thermal chuck or set up with an external environmental temperature chamber. The exact probe system configuration and test setup are specific to the device-under-test (DUT) architecture.
Test instrumentation and test routines (recipes) are controlled by the software, with measurement data stored to enable device-to-device cross-correlation and performance analysis.
A wafer loader enables fully automated wafer loading and unloading as part of the software-controlled test and handling process.
Automatic Probe System
Figure 16 -High Voulme Manaufacturing (HVM) - Automatic Probe System
Optical Parameters (input side)
- ■ 100% test, minimized set: coupling/alignment pass at nominal power, coarse return-loss check.
- ■ Single nominal test condition (room temp, nominal wavelength, nominal power) unless design margin requires a secondary condition.
Electrical Parameters (output side)
- ■ 100% test, minimized parameter set: dark current go/no-go, responsivity pass/fail, TIA gain go/no-go, sensitivity pass/fail at single data rate.
- ■ Fast binning logic (pass/fail/marginal) with automatic outlier flagging; performance-grade binning applied here if final grading occurs at this insertion.
- ■ Real-time SPC and wafer-map trending on all CTQ parameters with automatic lot-hold triggers.
- ■ Correlation audit sample pulled periodically (e.g., weekly) and cross-checked against LVM/Validation baseline and Insertion #1 model.
- ■ Full bandwidth sweep, TDECQ, overload, and noise characterization not performed in-line; covered by periodic sample only.
Environmental Parameters
- ■ No per-die environmental test in the production flow.
- ■ Periodic qualification monitor (e.g., quarterly reliability sample): temperature sweep, dark current, responsivity, bandwidth, per original Validation-stage protocol, on a small pulled sample of die/wafers.
- ■ Any process, material, trim, or design change triggers a requalification subset before returning to steady-state HVM flow.
- ■ Field-return/failure-analysis feedback loop (post-package/post-deployment) monitored for optical, electrical, or environmental-related escapes traced back to wafer-level or trim-process signatures.
Pass/Fail Criteria: Production spec limits, tight guardbands, automated disposition; any drift beyond SPC or wafer-map control limits halts the lot pending investigation.
Duration: Seconds per die target; environmental and full-condition sampling scheduled outside the main production cadence to avoid throughput impact.
3.2.5 Summary Comparison
Table 5 - Summary Comparison
| Aspect | R&D | Validation | LVM | HVM |
|---|---|---|---|---|
| Sample size | 5-15 die | 30-90 die | 100% CTQ / sample env | 100% CTQ / periodic env |
| Optical/E-O coverage | Full power/wavelength/PDR sweep, Ins#1 delta | Full spec list, cor- ners, delta limits | CTQ subset, guard banded | Minimal CTQ, single condition |
| Electrical coverage | Full bias, bandwidth, noise, BER sweep, Ins#1 delta | Full spec list, cor- ners, delta limits | CTQ subset, guard banded | Minimal CTQ, single condition |
| Environmental coverage | Full range, exploratory | Full spec limits, gated | Sample-based, SPC-triggered | Periodic qual only |
| Correlation focus | Insertion #1 vs #2 delta characterization | Formalized correla- tion model | Periodic model check | Periodic model check |
| Alignment method | Manual/semi-auto | Auto-align (qualified) | Auto-align (locked) | Auto-align (high-speed) |
| Probe access | Optical, DC, RF Manual/ semi-auto | Optical, DC, RF au- to-align (qualified) | Optical, DC, RF au- to-align (qualified) | Optical, DC, RF auto-align (high-speed) |
| Test time priority | Low (data-rich) | Medium | High | Highest |
| Pass/fail basis | None (data gen.) | Formal limits + delta limits | Guard banded limits | Tight guard bands, auto-bin |
| Wafer-map use | Full spatial mapping | Uniformity validation | Spot-check vs. baseline | Trend monitoring only |
Note: Optical and electrical parameter names and limits should be adapted to the specific O-E E-PIC architecture (standalone photodiode vs. integrated PD+TIA receiver, avalanche photodiode (APD) vs. PIN, differential vs. single-ended output), wavelength band (O-band, C-band, or other), modulation format (NRZ, PAM4), and optical I/O interface (edge coupler, grating coupler, FAU) in use. The specific intervening backend step between Insertion #1 and Insertion #2 (passivation/AR coating, RDL/bump, TIA trim/calibration, burn-in, etc.) should be explicitly identified in the program's process flow documentation, since it determines which delta parameters matter most and whether Insertion #1 can serve as a predictive pre-screen to reduce Insertion #2 test scope. Die-level traceability (linking each die's Insertion #1 and Insertion #2 records) is required to support delta-tracking and should be established as an infrastructure requirement starting at R&D. Sensitivity and overload testing require a calibrated, traceable optical power reference at the wafer probe plane - this calibration chain should be maintained consistently between Insertion #1 and Insertion #2 to keep delta measurements meaningful. As with Insertion #1, wafer-level testing inherently limits environmental coverage (e.g., humidity, thermal cycling) compared to packaged-device testing - these should be formally re-verified at the post-package insertion in the overall test flow.
3.3
Electro-Photonic Integrated Circuit (E-PIC) Electrical-to-Optical (E-O)
Optical, Electrical & Environmental Parameter Coverage Across Program Maturity Stages
Scope: These four procedures define the optical, electrical, and environmental test methodology for the Electrical-to-Optical Electro-optic Photonic Integrated Circuit (E-O E-PIC) at ATE Insertion #2, performed at wafer level. The device under test takes an electrical input (data/drive signal plus DC bias) and produces an optical output (transmitter-side PIC: laser + modulator, or directly-modulated laser). Insertion #2 occurs after Insertion #1 and after an intervening backend process step relevant to transmitter performance - e.g., wavelength/resonance trim (thermal tuner or ring/MZI anneal), laser cavity trim, passivation or cladding deposition, redistribution layer (RDL)/bump formation, or a burn-in/stress step - and serves as the final wafer-level gate prior to dicing/singulation. Insertion #2 places additional emphasis on (a) correlation and delta-tracking against Insertion #1 data for the same die, (b) confirmation that the intervening process step met its intended target (e.g., trim convergence, wavelength grid alignment), and (c) final performance/wavelength binning or grading where applicable. Electrical probe access (DC/RF, input side) and optical fiber probe access (output side - edge coupler, grating coupler, or FAU) remain consistent with Insertion #1.
3.3.1 R&D-Level
Objective: Fully characterize post-process-step electrical-to-optical conversion performance, quantify the effect of the intervening backend step (trim, passivation, RDL/bump, burn-in) relative to Insertion #1 baseline, and establish Insertion #2-specific spec limits and correlation models for validation.
Sample Size: 5-15 die locations per wafer, matched to the same die measured at Insertion #1 (paired dataset), across 1-2 wafers if available.
Test Station: Benchtop-style (manual) probe system with an optical, DC and RF positioner, an optical power meter (OPM), optical spectrum analyzer (OSA). With an optional wavelength meter (λ meter). A DC source such as a SMU, and an RF generator. The probe system can be configured with a thermal chuck or set up with an external environmental temperature chamber. The exact probe system configuration and test setup are specific to the device-under-test (DUT) architecture.
Manual Probe System
Figure 17 -R & D Level - Manual Probe System
Electrical Parameters (input side)
- ■ Full I-V sweep on all bias and drive pins (laser bias, modulator driver supply, TEC if on-die) - compared die-for-die against Insertion #1 result (delta-Idd, delta-threshold).
- ■ Supply current vs. voltage/temperature (Idd vs. Vdd, Idd vs. T).
- ■ Input leakage current on all control/bias pins.
- ■ Drive signal input impedance / return loss (S11) at the RF input port.
- ■ Input sensitivity - minimum drive swing to achieve spec'd optical modulation, delta-tracked against Insertion #1.
- ■ Die-level pass/fail delta analysis on electrical parameters: identify die that regressed vs. improved between insertions (process-induced shift vs. successful trim).
Optical Parameters (output side)
- ■ Optical output power vs. bias current (L-I curve) and vs. temperature - delta-IL/delta-power vs. Insertion #1.
- ■ Threshold current and slope efficiency (if on-die laser present).
- ■ Center wavelength verification against target grid (post-trim), with trim convergence/ accuracy analysis.
- ■ Spectral width, side-mode suppression ratio (SMSR).
- ■ Extinction ratio vs. drive voltage/bias.
- ■ Optical modulation amplitude (OMA) and average power at spec'd drive condition.
- ■ RIN across bias range.
- ■ Eye diagram / PAM4 linearity, TDECQ at representative data rate.
- ■ Chirp (if applicable to modulator type).
- ■ Coupling loss and alignment tolerance (1-dB alignment window) at output port.
- ■ Return loss / back-reflection at optical output port.
- ■ Thermal tuning coefficient (pm/°C) and thermal tuner power consumption vs. wavelength shift - verification that trim/anneal achieved target tuning range and efficiency.
Environmental Parameters
- ■ Wafer chuck temperature sweep: -40°C to +85°C (or per design target) at probe, in 10-20°C steps.
- ■ Electrical and optical parameter drift vs. temperature (threshold current shift, wavelength drift, extinction ratio degradation), compared against Insertion #1 temperature-dependence data to detect any process-induced shift in temperature sensitivity.
- ■ Repeat measurement (probe re-touchdown) to characterize electrical and optical alignment repeatability as a function of temperature, and to distinguish measurement noise from true process-stepinduced shift.
Data Handling: All raw I-V, spectral, and eye/modulation traces retained and paired to the corresponding Insertion #1 record per die; delta/drift statistics built per parameter and mapped spatially across the wafer. No formal pass/fail gate - data feeds spec-limit derivation, trim-process tuning, and correlation-model development for validation.
Duration: Extended (hours per die acceptable); test time is not optimized, full bias and wavelength sweeps used throughout.
3.3.2 Validation-Level
Objective: Confirm the E-PIC meets Insertion #2 (post-process-step) datasheet/spec limits, validate the die-level correlation model between Insertion #1 and Insertion #2, confirm trim/backend process capability, and validate test program/ wafer-map coverage prior to LVM release.
Sample Size: 30-90 die locations (statistically meaningful per parameter; supports Cpk and wafer-map uniformity estimation), spanning ≥3 wafers/lots, all paired to their Insertion #1 records.
Test Station: Benchtop-style (manual) probe system with an optical, DC and RF positioner, an optical power meter (OPM), optical spectrum analyzer (OSA). With an optional wavelength meter (λ meter). A DC source such as a SMU, and an RF generator. The probe system can be configured with a thermal chuck or set up with an external environmental temperature chamber. The exact probe system configuration and test setup are specific to the deviceunder-test (DUT) architecture.
Test instrumentation and test routines (recipes) are controlled by the software, with measurement data stored to enable device-to-device cross-correlation and performance analysis.
Semi-Automatic Probe System
Figure 18 -Validation Level - Semi-Automatic Probe System
Electrical Parameters (input side)
- ■ DC parametric: Idd, Ileak, bias voltages at nominal/min/max supply corners - with delta limits vs. Insertion #1.
- ■ RF input return loss (S11) at spec frequency/data rate.
- ■ Input sensitivity verification against spec limit.
Optical Parameters (output side)
- ■ L-I curve verification (threshold, slope efficiency) against spec limits, with delta-vs-Insertion-#1 limit.
- ■ Center wavelength verification against target grid; trim capability (Cpk) analysis.
- ■ SMSR at nominal bias/temperature.
- ■ Extinction ratio, OMA, and average power at spec drive condition.
- ■ TDECQ / eye mask compliance at spec data rate (single condition).
- ■ Coupling alignment tolerance verification (auto-align convergence and repeatability).
- ■ Corner testing: Temp min/typ/max × Bias min/typ/max.
- ■ Insertion #1-to-Insertion #2 correlation study formalized (regression/limit-setting for using Insertion #1 as a predictive screen, if applicable).
- ■ Wafer-probe-to-packaged-module correlation study (subset of die tracked through packaging).
- ■ Gauge R&R on critical electrical and optical parameters (repeat touchdown study).
Environmental Parameters
- ■ Temperature verification at spec limits (e.g., -40°C, +25°C, +85°C) with pass/fail gating on electrical and optical parameters.
- ■ Thermal tuning coefficient and thermal tuner power verification against post-trim targets.
- ■ Wafer-map uniformity analysis (spatial trending of threshold current, wavelength, extinction ratio, output power across reticle/wafer).
- ■ Preliminary correlation to post-package environmental stress (thermal cycling) performed on packaged units from this same wafer population, feeding back into Insertion #2 pass/fail limits.
Pass/Fail Criteria: Formal spec limits applied, including delta-vs-Insertion-#1 limits where relevant; failures root-caused and dispositioned (design vs. process vs. trim/backend step vs. test escape vs. alignment/fixture artifact).
Duration: Hours to a day per wafer; test time optimization begins (reduced bias/wavelength points, faster auto-align) but coverage remains primary.
3.3.3 Low Volume Manufacturing (LVM)
Objective: Execute a production-intent, throughput-aware wafer-level electrical/optical test flow at Insertion #2 with statistical process control (SPC) in place, while maintaining tighter environmental/corner sampling than HVM, and confirming trim/backend process stability lot-to-lot.
Sample Size: 100% die tested for core electrical and optical CTQ parameters (or reticlerepresentative subset if full-wafer test time is prohibitive); environmental/fullcorner testing on a defined sample plan (e.g., 1 wafer per lot, or N die per wafer).
Test Station: Benchtop-style (manual) probe system with an optical, DC and RF positioner, an optical power meter (OPM), optical spectrum analyzer (OSA). A DC source such as a SMU, and an RF generator. The probe system can be configured with a thermal chuck or set up with an external environmental temperature chamber. The exact probe system configuration and test setup are specific to the device-under-test (DUT) architecture.
Test instrumentation and test routines (recipes) are controlled by the software, with measurement data stored to enable device-to-device cross-correlation and performance analysis.
A wafer loader enables fully automated wafer loading and unloading as part of the software-controlled test and handling process.
An optional SECS/GEM software interface enables integration with factory-level automation and manufacturing execution systems (MES) for streamlined production workflows and data management.
Figure 19 - Low Volume Manufacturing (LVM) - Automatic Probe System
Electrical Parameters (input side)
- ■ 100% test of Idd, Ileak at nominal condition.
- ■ RF input return loss go/no-go at spec frequency.
Optical Parameters (output side)
- ■ 100% (or high-coverage) test of critical-to-quality (CTQ) parameters only: output power at nominal bias, center wavelength go/no-go (post-trim), extinction ratio go/no-go.
- ■ Reduced condition testing - single bias/temp point rather than full sweep, unless SPC flags drift.
- ■ Guard banded limits (tightened from Validation limits to account for alignment/test uncertainty).
- ■ In-line SPC charting (Xbar-R or wafer-map trend) on top CTQ electrical and optical parameters, including trim-process Cpk tracking.
- ■ Correlation checks against Validation dataset and Insertion #1 correlation model on a periodic basis (e.g., first-wafer per lot).
- ■ SMSR, TDECQ, and full L-I curve sampled rather than tested per die.
Environmental Parameters
- ■ Sample-based temperature verification (e.g., hot/cold spot-check on subset of die per wafer/lot) rather than full sweep.
- ■ No full corner matrix - spot checks only, escalated to full Validation-style test if SPC signals an excursion.
- ■ Wafer-map uniformity spot-checked against Validation baseline.
Pass/Fail Criteria: Formal limits from Validation, with guardbands; SPC out-of-control (including trim-process Cpk drift) triggers hold-and-investigate.
Duration: Test time actively optimized (target: seconds-to-low-minutes per die); autoalign speed and single-condition testing are the primary throughput levers.
3.3.4 High Volume Manufacturing (HVM)
Objective: Maximize wafer-probe throughput and yield visibility at the final wafer-level gate, with minimal necessary electrical/optical test coverage, relying on statistical/spatial monitoring rather than exhaustive per-die environmental or full-condition testing.
Sample Size: 100% die tested for a minimal CTQ electrical/optical parameter set; environmental and full-condition testing reduced to periodic qualification-style monitors only (e.g., quarterly or per-process-change), not per-lot
Test Station: Benchtop-style (manual) probe system with an optical, DC and RF positioner, an optical power meter (OPM), a DC source such as a SMU, and an RF generator. The probe system can be configured with a thermal chuck or set up with an external environmental temperature chamber. The exact probe system configuration and test setup are specific to the device-under-test (DUT) architecture.
Test instrumentation and test routines (recipes) are controlled by the software, with measurement data stored to enable device-to-device cross-correlation and performance analysis.
A wafer loader enables fully automated wafer loading and unloading as part of the software-controlled test and handling process.
An optional SECS/GEM software interface enables integration with factory-level automation and manufacturing execution systems (MES) for streamlined production workflows and data management.
Automatic Probe System
Figure 20 - High Volume Manufacturing HVM) - Automatic Probe System
Electrical Parameters (input side)
- ■ 100% test, minimized set: Idd go/no-go, RF input return loss coarse check.
- ■ Single nominal test condition (room temp, nominal bias) unless design margin requires a secondary condition.
Optical Parameters (output side)
- ■ 100% test, minimized parameter set: output power (single wavelength/bias, go/no-go), center wavelength go/no-go, extinction ratio pass/fail.
- ■ Fast binning logic (pass/fail/marginal) with automatic outlier flagging; wavelength/performance-grade binning applied here if final grading occurs at this insertion.
- ■ Real-time SPC and wafer-map trending on all CTQ parameters with automatic lot-hold triggers.
- ■ Correlation audit sample pulled periodically (e.g., weekly) and cross-checked against LVM/Validation baseline and Insertion #1 model.
- ■ Full L-I curve, SMSR, and TDECQ characterization not performed in-line; covered by periodic sample only.
Environmental Parameters
- ■ No per-die environmental test in the production flow.
- ■ Periodic qualification monitor (e.g., quarterly reliability sample): temperature sweep, L-I curve, spectral characterization, per original Validation-stage protocol, on a small pulled sample of die/wafers.
- ■ Any process, material, trim, or design change triggers a requalification subset before returning to steady-state HVM flow.
- ■ Field-return/failure-analysis feedback loop (post-package/post-deployment) monitored for electrical, optical, or environmental-related escapes traced back to wafer-level or trim-process signatures.
Pass/Fail Criteria: Production spec limits, tight guard bands, automated disposition; any drift beyond SPC or wafer-map control limits halts the lot pending investigation.
Duration: Seconds per die target; environmental and full-condition sampling scheduled outside the main production cadence to avoid throughput impact.
3.3.5 Summary Comparison
Table 6 - Summary Comparison
| Aspect | R&D | Validation | LVM | HVM |
|---|---|---|---|---|
| Sample size | 5-15 die | 30-90 die | 100% CTQ / sample env | 100% CTQ / periodic env |
| Optical coverage | Full L-I, spectral, eye sweep, Ins#1 delta | Full spec list, corners, delta limits | CTQ subset, guard banded | Minimal CTQ, single condition |
| Electrical coverage | Full I-V, S11 sweep, Ins#1 delta | Full spec list, corners, delta limits | CTQ subset, guard banded | Minimal CTQ, single condition |
| Environmental coverage | Full range, exploratory | Full spec limits, gated | Sample-based, SPC-triggered | Periodic qual only |
| Correlation focus | Insertion #1 vs #2 delta characterization | Formalized correlation model | Periodic model check | Periodic model check |
| Alignment method | Manual/semi-auto | Auto-align (qualified) | Auto-align (locked) | Auto-align (high-speed) |
| Probe access | Optical, DC, RF Manual/semi-auto | Optical, DC, RF auto-align (qualified) | Optical, DC, RF auto-align (qualified) | Optical, DC, RF auto-align (high-speed) |
| Test time priority | Low (data-rich) | Medium | High | Highest |
| Pass/fail basis | None (data gen.) | Formal limits + delta limits | Guard banded limits | Tight guard bands, au- to-bin |
| Wafer-map use | Full spatial mapping | Uniformity validation | Spot-check vs. baseline | Trend monitoring only |
Note: Electrical and optical parameter names and limits should be adapted to the specific E-O E-PIC architecture (directly-modulated laser, EML, integrated laser + external modulator, etc.), wavelength band (O-band, C-band, or other), modulation format (NRZ, PAM4), and optical I/O interface (edge coupler, grating coupler, FAU) in use. The specific intervening backend step between Insertion #1 and Insertion #2 (trim/ anneal, passivation, RDL/bump, burn-in, etc.) should be explicitly identified in the program's process flow documentation, since it determines which delta parameters matter most and whether Insertion #1 can serve as a predictive pre-screen to reduce Insertion #2 test scope. Die-level traceability (linking each die's Insertion #1 and Insertion #2 records) is required to support delta-tracking and should be established as an infrastructure requirement starting at R&D. As with Insertion #1, wafer-level testing inherently limits environmental coverage (e.g., thermal cycling) compared to packaged-device testing - these should be formally re-verified at the post-package insertion in the overall test flow.
4. ATE Insertion #3 Testing on Bar level
Electro-Photonic Integrated Circuit (E-PIC) Optical-to-Optical (O-O)
Optical, Electrical & Environmental Parameter Coverage Across Program Maturity Stages
Scope: These four procedures define the optical and environmental test methodology for the Optical-toOptical Electro-optic Photonic Integrated Circuit (O-O E-PIC) at ATE Insertion #3, performed at bar level, following wafer-level Insertion #1 and Insertion #2. Insertion #3 occurs after wafer dicing into bars and after an intervening bar-level process step relevant to facet-coupled performance - most commonly facet AR/ HR coating deposition (which can only be applied once the facet is exposed by cleaving), and/or a bar-level burn-in/aging step - and serves as the final facet-coupled optical gate prior to final die singulation and packaging. Insertion #3 places additional emphasis on (a) correlation and delta-tracking against wafer-level Insertion #2 data for the same die (now resident on a bar), (b) verification that facet coating met its reflectivity/durability target, and (c) any burn-in-induced drift. Optical access is via edge coupling directly into the cleaved, coated facet (with a pitch-matched fiber array for multi-channel bars); DC/RF electrical bias is applied via probe needles or a bar-level probe card, consistent with bar-level Insertion #1.
| 4.1.1 R&D-Level | |
|---|---|
| Objective: | Fully characterize post-coating/post-burn-in facet-coupled and electro-optic performance, quantify the effect of the intervening bar-level process step (facet coating, burn-in) relative to wafer-level Insertion #2 baseline, and establish Inser- tion #3-specific spec limits and correlation models for validation. |
| Sample Size: | 5-15 bars, matched to the same die measured at wafer-level Insertion #2 where traceable (paired dataset), spanning multiple wafer/cleave positions. |
| Test Station: | Benchtop-style (manual) probe system with one or two optical positioners, an optical light source (OLS) like a tunable laser source, and optical power meter (OPM) and optical spectrum analyzer. With optional optical frequency domain reflectometer (OFDR) and optional wavelength meter (λ meter). The probe system can be configured with a thermal chuck or set up with an external environmental temperature chamber. The exact probe system configuration and test setup are specific to the device-under-test (DUT) architecture. |
Optical Parameters
- ■ Insertion loss (IL), facet-to-facet and per-interface, at nominal wavelength and nominal bias - compared die-for-die against wafer-level Insertion #2 result (delta-IL) to isolate the coating/burn-in contribution.
- ■ Facet coating reflectivity verification (AR/HR) via return loss / back-reflection measurement at each coated facet, against coating target spec.
- ■ Coating uniformity along bar length and bar-to-bar.
- ■ Wavelength-dependent loss (WDL) sweep across full design band, checked for any coating-induced spectral shift.
- ■ Polarization-dependent loss (PDL).
- ■ Coupling loss and alignment tolerance (1-dB alignment window) - re-verified post-coating since coating thickness/index can shift optimal coupling condition.
- ■ Mode field diameter (MFD) match verification between fiber array and coated-facet mode.
- ■ Channel-to-channel uniformity across the bar (die-to-die IL, wavelength, extinction ratio variation along bar length).
- ■ Crosstalk between adjacent channels/waveguides on the bar.
.
Figure 21 - R & D Level - Manual Probe System
Optical Parameters (con't)
- ■ Electro-optic response: Vpi, modulator bandwidth (S21/E-O response), extinction ratio vs. bias, chirp (if applicable), SOA gain/saturation curve, switching time - delta-tracked against wafer-level Insertion #2.
- ■ PAM4/eye linearity and TDECQ at representative data rate.
- ■ RIN across bias range.
- ■ Burn-in/aging-induced drift analysis (if a burn-in step preceded this insertion): pre/post-burn-in delta on IL, extinction ratio, wavelength.
- ■ Die-level pass/fail delta analysis: identify die that regressed vs. improved between wafer-level Insertion #2 and bar-level Insertion #3 (coating/burn-in-induced change vs. expected improvement).
Environmental Parameters
- ■ Bar-stage temperature sweep: -40°C to +85°C (or per design target), in 10-20°C steps.
- ■ Electro-optic and facet-coupled parameter drift vs. temperature (Vpi shift, extinction ratio degradation, IL drift), compared against wafer-level Insertion #2 temperature-dependence data to detect any coating- or burn-in-induced shift in temperature sensitivity.
- ■ Repeat measurement (bar re-load/re-touchdown) to characterize facet-coupling and DC/RF alignment repeatability as a function of temperature and bar handling, and to distinguish measurement noise from true process-step-induced shift.
Data Handling: All raw traces retained and paired to the corresponding wafer-level Insertion #2 record per die where traceable; delta/drift statistics built per parameter, correlated to bar position and originating wafer location. No formal pass/fail gate - data feeds spec-limit derivation, coating/burn-in process tuning, and correlation-model development for validation.
Duration: Extended (tens of minutes to hours per bar acceptable); test time is not optimized, full wavelength and bias sweeps used throughout.
4.1.2 Validation-Level
Objective: Confirm the E-PIC meets Insertion #3 (post-coating/post-burn-in) datasheet/ spec limits at bar level, validate the die-level correlation model between wafer-level Insertion #2 and bar-level Insertion #3, confirm facet-coating and bar-handling process capability, and validate test program coverage prior to LVM release.
Sample Size: 30-90 bars (statistically meaningful per parameter; supports Cpk and barto-bar/lot uniformity estimation), spanning ≥3 lots, paired to their wafer-level Insertion #2 records where traceable.
Test Station: Semi- or fully automatic probe system with one or two optical positioners, an optical light source (OLS) like a tunable laser source, and optical power meter (OPM) and optical spectrum analyzer. With optional optical frequency domain reflectometer (OFDR) and optional wavelength meter (λ meter). The probe system can be configured with a thermal chuck or set up with an external environmental temperature chamber. The exact probe system configuration and test setup are specific to the device-under-test (DUT) architecture.
Test instrumentation and test routines (recipes) are controlled by the software, with measurement data stored to enable device-to-device cross-correlation and performance analysis
Semi-Automatic Probe System
Figure 22 - Validation Level - Semi-Automatic Probe System
Optical Parameters
- ■ Full parametric list from R&D, reduced to spec-relevant subset with defined limits (LSL/USL) specific to post-coating/post-burn-in targets.
- ■ Insertion loss at nominal + spec-band edges (3-point or 5-point wavelength test, not full sweep) - with delta-IL limit vs. wafer-level Insertion #2.
- ■ Facet coating reflectivity verification against spec-defined AR/HR target; coating-process capability (Cpk) analysis.
- ■ PDL at spec-defined limits.
- ■ Extinction ratio, Vpi, and modulation bandwidth at nominal bias and spec wavelength.
- ■ TDECQ / eye mask compliance at spec data rate (single condition).
- ■ Fiber-array coupling alignment tolerance verification (auto-align convergence and repeatability across all channels on the bar).
- ■ Channel-to-channel uniformity verification against spec limits.
- ■ Corner testing: Temp min/typ/max × Bias min/typ/max × wavelength band edges.
- ■ Insertion #2 (wafer)-to-Insertion #3 (bar) correlation study formalized (regression/limit-setting for using earlier insertion data as a predictive screen, if applicable).
- ■ Bar-to-packaged-module correlation study (subset of bars/die tracked through singulation and packaging).
- ■ Gauge R&R on critical optical and electro-optic parameters (repeat bar-load/touchdown study).
Environmental Parameters
- ■ Temperature verification at spec limits (e.g., -40°C, +25°C, +85°C) with pass/fail gating on optical and electro-optic parameters.
- ■ Thermal tuning coefficient verification for resonant elements, if applicable.
- ■ Bar-to-bar and within-bar uniformity analysis (spatial trending of IL, WDL, PDL, Vpi, extinction ratio, coating reflectivity along bar length and across lot).
- ■ Preliminary correlation to post-singulation/post-package environmental stress (thermal cycling, humidity), feeding back into bar-level pass/fail limits.
Pass/Fail Criteria: Formal spec limits applied, including delta-vs-Insertion-#2 limits where relevant; failures root-caused and dispositioned (design vs. process vs. coating vs. burn-in vs. test escape vs. alignment/fixture artifact).
Duration: Tens of minutes to an hour per bar; test time optimization begins (reduced wavelength/bias points, faster fiber-array auto-align) but coverage remains primary.
4.1.3 Low Volume Manufacturing (LVM)
Objective: Execute a production-intent, throughput-aware bar-level optical test flow at Insertion #3 with statistical process control (SPC) in place, while maintaining tighter environmental/wavelength sampling than HVM, and confirming facet-coating process stability lot-to-lot.
Sample Size: 100% die-on-bar tested for core optical CTQ parameters; environmental/fullspectrum testing on a defined sample plan (e.g., 1 bar per lot, or N die per bar).
Test Station: Fully automated, software-controlled probe system with one or two optical positioners, an optical light source (OLS) like a tunable laser source, and optical power meter (OPM) and optical spectrum analyzer. With optional optical frequency domain reflectometer (OFDR). The probe system can be configured with a thermal chuck or set up with an external environmental temperature chamber. The exact probe system configuration and test setup are specific to the device-under-test (DUT) architecture.
Test instrumentation and test routines (recipes) are controlled by the software, with measurement data stored to enable device-to-device cross-correlation, performance analysis, and ECO-chain traceability.
A wafer loader enables fully automated wafer loading and unloading as part of the software-controlled test and handling process.
An optional SECS/GEM software interface enables integration with factory-level automation and manufacturing execution systems (MES) for streamlined production workflows and data management.
Figure 23 - Automatic Probe System with MHU and ATE Docking Station
Optical Parameters
- ■ 100% test of critical-to-quality (CTQ) parameters only: insertion loss at nominal wavelength, extinction ratio go/no-go, facet coating reflectivity go/no-go.
- ■ Reduced wavelength testing - single or dual-point (band-edge) check rather than full sweep, unless SPC flags drift.
- ■ Guardbanded limits (tightened from Validation limits to account for facet/alignment/test uncertainty).
- ■ In-line SPC charting (Xbar-R or bar-map trend) on top CTQ optical parameters, including coating-process Cpk tracking.
- ■ Correlation checks against Validation dataset and Insertion #2 correlation model on a periodic basis (e.g., first-bar per lot).
- ■ PDL, full-band WDL, and modulation bandwidth sampled rather than tested per die.
- ■ Channel-to-channel uniformity spot-checked rather than fully mapped per bar.
Environmental Parameters
- ■ Sample-based temperature verification (e.g., hot/cold spot-check on subset of bars per lot) rather than full sweep.
- ■ Periodic thermal-tuning-coefficient audit (reduced sample, e.g., per-lot) for resonant structures.
- ■ No full corner matrix - spot checks only, escalated to full Validation-style test if SPC signals an excursion.
- ■ Bar-map uniformity spot-checked against Validation baseline.
Pass/Fail Criteria: Formal limits from Validation, with guardbands; SPC out-of-control (including coating-process Cpk drift) triggers hold-and-investigate.
Duration: Test time actively optimized (target: seconds-to-low-minutes per die-on-bar); fiber-array auto-align speed and reduced wavelength points are the primary throughput levers.
4.1.4 High Volume Manufacturing (HVM)
Objective: Maximize bar-test throughput and yield visibility at the final bar-level gate, with minimal necessary optical test coverage, relying on statistical/spatial monitoring rather than exhaustive per-die environmental or full-spectrum testing.
Sample Size: 100% die-on-bar tested for a minimal CTQ optical parameter set; environmental and full-spectrum testing reduced to periodic qualification-style monitors only (e.g., quarterly or per-process-change), not per-lot.
Test Station: Fully automated, software-controlled probe system with one or two optical positioners, an optical light source (OLS), such as a tunable laser source, and an optical power meter (OPM). The system can be configured with an integrated thermal chuck or an external environmental temperature chamber. The exact probe system configuration and test setup are tailored to the device-under-test (DUT) architecture and application.
Test instrumentation, measurement sequences, and test routines (recipes) are software controlled, with measurement data automatically captured and stored to enable device-to-device cross-correlation, performance analysis, process monitoring, and ECO-chain traceability.
A wafer loader enables fully automated wafer loading and unloading as part of the software-controlled test and handling process.
An optional SECS/GEM software interface enables integration with factory-level automation and manufacturing execution systems (MES) for streamlined production workflows and data management.
Figure 24 - Automatic Probe System with MHU and ATE Docking Station
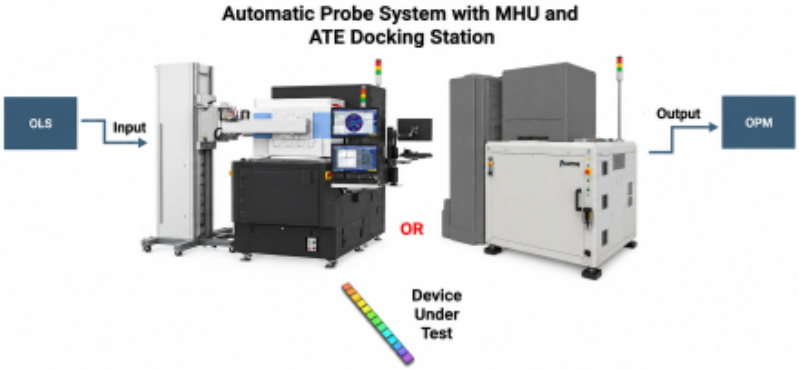
Optical Parameters
- ■ 100% test, minimized parameter set: insertion loss (single wavelength, go/no-go), extinction ratio pass/fail, coating reflectivity go/no-go.
- ■ Single nominal test condition (room temp, nominal bias, single wavelength) unless design margin requires a secondary condition.
- ■ Fast binning logic (pass/fail/marginal) with automatic outlier flagging, tagged to die position for downstream singulation sort.
- ■ Real-time SPC and bar-map trending on all CTQ parameters with automatic lot-hold triggers.
- ■ Correlation audit sample pulled periodically (e.g., weekly) and cross-checked against LVM/Validation baseline and Insertion #2 model.
- ■ Full WDL/PDL, modulation bandwidth, TDECQ, and channel-uniformity mapping not performed in-line; covered by periodic sample only.
Environmental Parameters
- ■ No per-bar environmental test in the production flow.
- ■ Periodic qualification monitor (e.g., quarterly reliability sample): temperature sweep, thermal-tuning coefficient, per original Validation-stage protocol, on a small pulled sample of bars.
- ■ Any process, material, coating, or burn-in recipe change triggers a requalification subset before returning to steady-state HVM flow.
- ■ Field-return/failure-analysis feedback loop (post-singulation/post-package/post-deployment) monitored for optical or environmental-related escapes traced back to bar-level or facet-coating signatures.
Pass/Fail Criteria: Production spec limits, tight guardbands, automated disposition; any drift beyond SPC or bar-map control limits halts the lot pending investigation.
Duration: Seconds per die-on-bar target; environmental and full-spectrum sampling scheduled outside the main production cadence to avoid throughput impact.
4.1.5 Summary Comparison
Table 7 - Summary Comparison
| Aspect | R&D | Validation | LVM | HVM |
|---|---|---|---|---|
| Sample size | 5-15 bars | 30-90 bars | 100% CTQ / sample env | 100% CTQ / periodic env |
| Optical coverage | Full L-I, spectral, eye sweep, Ins#1 delta | Full spec list, corners, delta limits | CTQ subset, guard banded | Minimal CTQ, single condition |
| Electrical coverage | Full I-V, S11 sweep, Ins#1 delta | Full spec list, corners, delta limits | CTQ subset, guard banded | Minimal CTQ, single condition |
| Environmental coverage | Full range, exploratory | Full spec limits, gated | Sample-based, SPC-triggered | Periodic qual only |
| Correlation focus | Insertion #1 vs #2 delta characterization | Formalized correlation model | Periodic model check | Periodic model check |
| Alignment method | Manual/semi-auto | Auto-align (qualified) | Auto-align (locked) | Auto-align (high-speed) |
| Probe access | Optical, DC, RF Manual/ semi-auto | Optical, DC, RF au- to-align (qualified) | Optical, DC, RF auto-align (qualified) | Optical, DC, RF auto-align (high-speed) |
| Test time priority | Low (data-rich) | Medium | High | Highest |
| Pass/fail basis | None (data gen.) | Formal limits + delta limits | Guard banded limits | Tight guard bands, auto-bin |
| Wafer-map use | Full spatial mapping | Uniformity validation | Spot-check vs. base- line | Trend monitoring only |
Note: Optical and electro-optic parameter names and limits should be adapted to the specific O-O E-PIC architecture (Mach-Zehnder modulator, ring modulator, EAM, SOA, switch fabric, etc.), wavelength band (O-band, C-band, or other), modulation format (NRZ, PAM4), and facet coating design (AR, HR, or ascleaved) in use. The specific intervening bar-level process step between wafer-level Insertion #2 and bar-level Insertion #3 (facet coating deposition, burn-in/aging, or both) should be explicitly identified in the program's process flow documentation, since it determines which delta parameters matter most and whether earlier insertion data can serve as a predictive pre-screen to reduce Insertion #3 test scope. Die-level traceability (linking each die's wafer-level and bar-level records across insertions) is required to support delta-tracking and should be established as an infrastructure requirement starting at R&D. As with earlier insertions, bar-level testing inherently limits environmental coverage (e.g., humidity, thermal cycling) compared to packaged-device testing - these should be formally re-verified at the post-singulation/post-package insertion in the overall test flow.
Electro-Photonic Integrated Circuit (E-PIC) Optical-to-Electrical (O-E)
Optical, Electrical & Environmental Parameter Coverage Across Program Maturity Stages
Scope: These four procedures define the optical, electrical, and environmental test methodology for the Optical-to-Electrical Electro-optic Photonic Integrated Circuit (O-E E-PIC) at ATE Insertion #3, performed at bar level - i.e., on individually singulated bar, following wafer-level Insertion #1 and Insertion #2. The device under test takes an optical input and produces an electrical output (receiver-side PIC: photodiode, or integrated photodiode + transimpedance amplifier (TIA)). Bar-level testing (rather than bar-level) is applicable here because optical access does not require an exposed cleaved facet - consistent with a grating-coupler or other vertical/surface-coupled optical interface - so the flow moves directly from wafer dicing to individual bar without an intermediate bar-test step. Insertion #3 occurs after singulation and, where applicable, after bar-attach to a carrier or submount, serving as the final pre-package gate. Insertion #3 places emphasis on (a) correlation and delta-tracking against wafer-level Insertion #2 data for the same bar, (b) verification that singulation (dicing saw/laser) and any bar-attach step did not degrade photodiode/TIA or coupling performance (mechanical stress, thermal path, adhesive/solder-induced strain, or new dark-current leakage paths introduced by dicing), and (c) individual bar handling and optical alignment repeatability now that the bar is no longer wafer-fixtured. Optical fiber-array probe access (input side - grating coupler or bar-level edge-coupling fixture) and DC/RF electrical probe access (output side, via probe needles or carrier bond pads) are used, consistent with wafer-level Insertion #1/#2 conventions.
| 4.2.1 R&D-Level | |
|---|---|
| Objective: | Fully characterize post-singulation (and post-bar-attach, if applicable) opti- cal-to-electrical conversion performance, quantify the effect of singulation/bar-at- tach relative to wafer-level Insertion #2 baseline, and establish Insertion #3-specif- ic spec limits and correlation models for validation.. |
| Sample Size: | 5-15 bar, matched to the same bar measured at wafer-level Insertion #2 (paired dataset), spanning multiple wafer locations. |
| Test Station: | Benchtop-style (manual) probe system with an optical, DC and RF positioner, an optical light source (OLS) like a tunable laser source, a DC meter such as a SMU, and an Ampere meter and oscilloscope. The probe system can be config- ured with a thermal chuck or set up with an external environmental temperature chamber. The exact probe system configuration and test setup are specific to the device-under-test (DUT) architecture. |
Figure 25 - Manual Probe System Diagram
Optical Parameters (input side)
- ■ Optical input power range (min/max operating power).
- ■ Grating coupler (or bar-level coupler) alignment tolerance and coupling loss - re-verified post-singulation since dicing debris, edge chipping, or bar-attach tilt can shift optimal coupling angle/position.
- ■ Wavelength-dependent responsivity sweep across full design band, checked for any singulation- or bar-attach-induced spectral shift.
- ■ Polarization-dependent responsivity (PDR).
- ■ Overload/saturation optical input power threshold.
- ■ Return loss / back-reflection at optical input port.
Electrical Parameters (output side)
- ■ Photodiode dark current (Id) vs. reverse bias voltage and temperature - compared bar-for-bar against wafer-level Insertion #2 result (delta-Id); dicing can introduce new edge-leakage paths, so this is a primary singulation-integrity screen.
- ■ Mechanical-stress-induced dark current or responsivity shift analysis (compare pre-singulation wafer data vs. post-singulation bar data to flag dicing-induced stress or edge-damage effects).
- ■ Responsivity (A/W) at nominal wavelength and bias - delta-tracked against wafer-level Insertion #2.
- ■ Photodiode capacitance vs. bias (Cj-V).
- ■ 3-dB electrical/optical bandwidth (S21 or equivalent) vs. bias.
Electrical Parameters (output side) con't
- ■ TIA transimpedance gain, bandwidth, and output swing (if integrated TIA present).
- ■ Input-referred noise current / noise equivalent power (NEP).
- ■ Common-mode rejection ratio (CMRR) for differential outputs, if applicable.
- ■ Supply current (Idd) vs. voltage/temperature for TIA/bias circuitry.
- ■ Eye diagram / PAM4 linearity and TDECQ at representative data rate and input power.
- ■ Sensitivity (minimum optical input power for target BER) across data rate/modulation format - delta-tracked against wafer-level Insertion #2.
- ■ Overload sensitivity (maximum optical input power before BER degradation).
Environmental Parameters
- ■ Bar/carrier stage temperature sweep: -40°C to +85°C (or per design target), in 10-20°C steps.
- ■ Optical and electrical parameter drift vs. temperature (dark current, responsivity, sensitivity shift, TIA gain drift), compared against wafer-level Insertion #2 temperature-dependence data to detect any singulation- or bar-attach-induced shift in temperature sensitivity (e.g., new CTE mismatch or thermal path change from bar-attach material).
- ■ Repeat measurement (bar re-load/re-pick) to characterize optical and electrical alignment repeatability as a function of temperature and individual bar handling.
Data Handling: All raw responsivity, noise, bandwidth, and eye/BER traces retained and paired to the corresponding wafer-level Insertion #2 record per bar; delta/drift statistics built per parameter, correlated to original wafer location. No formal pass/ fail gate - data feeds spec-limit derivation, singulation/bar-attach process tuning, and correlation-model development for validation.
Duration: Extended (tens of minutes to hours per bar acceptable); test time is not optimized, full bias, wavelength, and power sweeps used throughout.
4.2.2 Validation-Level
Objective: Confirm the E-PIC meets Insertion #3 (post-singulation/post-bar-attach) datasheet/spec limits at bar level, validate the bar-level correlation model between wafer-level Insertion #2 and bar-level Insertion #3, confirm singulation and bar-attach process capability, and validate test program coverage prior to LVM release.
Sample Size: 30-90 bar (statistically meaningful per parameter; supports Cpk estimation), spanning ≥3 lots, paired to their wafer-level Insertion #2 records.
Test Station: Semi- or fully automatic probe system with an optical, DC and RF positioner, an optical light source (OLS) like a tunable laser source, a DC meter such as a SMU, and an Ampere meter and oscilloscope. The probe system can be configured with a thermal chuck or set up with an external environmental temperature chamber. The exact probe system configuration and test setup are specific to the device-under-test (DUT) architecture.
Test instrumentation and test routines (recipes) are controlled by the software, with measurement data stored to enable device-to-device cross-correlation and performance analysis.
Figure 26 - Semi-Automatic Probe System Diagram
Optical Parameters (input side)
- ■ Coupler alignment tolerance verification (auto-align convergence and repeatability), specifically screening for singulation-related coupling degradation.
- ■ Optical input power range verification against spec limits.
- ■ Return loss at spec-defined limits.
- ■ Responsivity at nominal + spec-band edges (3-point wavelength test, not full sweep).
Electrical Parameters (output side)
- ■ Dark current, responsivity, and TIA gain verification against spec limits at nominal bias, with delta limits vs. wafer-level Insertion #2 - specifically screening for singulation-induced edge leakage.
- ■ 3-dB bandwidth verification at spec condition.
- ■ Sensitivity and overload verification at spec data rate/modulation format, with delta limit vs. wafer-level Insertion #2.
- ■ TDECQ / eye mask compliance at spec data rate (single condition).
- ■ Corner testing: Temp min/typ/max × Bias min/typ/max × optical input power min/typ/max.
- ■ Insertion #2 (wafer)-to-Insertion #3 (bar) correlation study formalized (regression/limit-setting for using earlier insertion data as a predictive screen, if applicable).
- ■ Bar-to-packaged-module correlation study (subset of bar tracked through packaging).
- ■ Gauge R&R on critical optical and electrical parameters (repeat bar-load/touchdown study).
Environmental Parameters
- ■ Temperature verification at spec limits (e.g., -40°C, +25°C, +85°C) with pass/fail gating on optical and electrical parameters.
- ■ Bar-to-bar and lot-to-lot uniformity analysis (trending of dark current, responsivity, sensitivity, bandwidth).
- ■ Preliminary correlation to post-package environmental stress (thermal cycling, humidity), feeding back into bar-level pass/fail limits.
Pass/Fail Criteria: Formal spec limits applied, including delta-vs-Insertion-#2 limits where relevant; failures root-caused and dispositioned (design vs. process vs. singulation vs. bar-attach vs. test escape vs. alignment/fixture artifact).
Duration: Tens of minutes to an hour per bar; test time optimization begins (reduced bias/wavelength/power points, faster fiber-array auto-align) but coverage remains primary.
4.2.3 Low Volume Manufacturing (LVM)
Objective: Execute a production-intent, throughput-aware bar-level optical/electrical test flow at Insertion #3 with statistical process control (SPC) in place, while maintaining tighter environmental/corner sampling than HVM, and confirming singulation/bar-attach process stability lot-to-lot.
Sample Size: 100% bar tested for core optical and electrical CTQ parameters; environmental/full-corner testing on a defined sample plan (e.g., N bar per lot).
Test Station: Semi- or fully automatic probe system with an optical, DC and RF positioner, an optical light source (OLS) like a tunable laser source, a DC meter such as a SMU, and an Ampere meter. The probe system can be configured with a thermal chuck or set up with an external environmental temperature chamber. The exact probe system configuration and test setup are specific to the deviceunder-test (DUT) architecture.
Test instrumentation and test routines (recipes) are controlled by the software, with measurement data stored to enable device-to-device cross-correlation and performance analysis.
A wafer loader enables fully automated wafer loading and unloading as part of the software-controlled test and handling process.
An optional SECS/GEM software interface enables integration with factorylevel automation and manufacturing execution systems (MES) for streamlined production workflows and data management.
Figure 27 - Automatic Probe System with MHU Diagram
Optical Parameters (input side)
- ■ 100% test of coupling alignment go/no-go at nominal input power.
- ■ Return loss coarse check.
- ■ Full wavelength responsivity sweep and PDR sampled rather than tested per bar.
Electrical Parameters (output side)
- ■ 100% (or high-coverage) test of critical-to-quality (CTQ) parameters only: dark current go/no-go (singulation integrity screen), responsivity at nominal condition, TIA gain go/no-go, sensitivity go/ no-go at spec data rate.
- ■ Reduced condition testing - single bias/temp/power point rather than full sweep, unless SPC flags drift.
- ■ Guardbanded limits (tightened from Validation limits to account for singulation/alignment/test uncertainty).
- ■ In-line SPC charting (Xbar-R or lot-trend) on top CTQ optical and electrical parameters, including singulation/bar-attach process Cpk tracking.
- ■ Correlation checks against Validation dataset and Insertion #2 correlation model on a periodic basis (e.g., first-lot sample).
- ■ Full bandwidth sweep, TDECQ, and overload characterization sampled rather than tested per bar.
Environmental Parameters
- ■ Sample-based temperature verification (e.g., hot/cold spot-check on subset of bar per lot) rather than full sweep.
- ■ No full corner matrix - spot checks only, escalated to full Validation-style test if SPC signals an excursion.
- ■ Lot uniformity spot-checked against validation baseline.
Pass/Fail Criteria: Formal limits from Validation, with guardbands; SPC out-of-control (including singulation/bar-attach process Cpk drift) triggers hold-and-investigate.
Duration: Test time actively optimized (target: seconds-to-low-minutes per bar); fiber-array auto-align speed and single-condition testing are the primary throughput levers.
4.2.4 High Volume Manufacturing (HVM)
Objective: Maximize bar-test throughput and yield visibility at the final pre-package gate, with minimal necessary optical/electrical test coverage, relying on statistical monitoring rather than exhaustive per-bar environmental or full-condition testing.
Sample Size: 100% bar tested for a minimal CTQ optical/electrical parameter set; environmental and full-condition testing reduced to periodic qualification-style monitors only (e.g., quarterly or per-process-change), not per-lot.
Test Station: Semi- or fully automatic probe system with an optical, DC and RF positioner, an optical light source (OLS) like a tunable laser source, a DC meter such as a SMU, and an Ampere meter. The probe system can be configured with a thermal chuck or set up with an external environmental temperature chamber. The exact probe system configuration and test setup are specific to the device-under-test (DUT) architecture.
Test instrumentation and test routines (recipes) are controlled by the software, with measurement data stored to enable device-to-device cross-correlation and performance analysis.
A wafer loader enables fully automated wafer loading and unloading as part of the software-controlled test and handling process.
An optional SECS/GEM software interface enables integration with factory-level automation and manufacturing execution systems (MES) for streamlined production workflows and data management.
Figure 28 - Automatic Probe System with MHU Diagram
Optical Parameters (input side)
- ■ 100% test, minimized set: coupling/alignment pass at nominal power, coarse return-loss check.
- ■ Single nominal test condition (room temp, nominal wavelength, nominal power) unless design margin requires a secondary condition.
Electrical Parameters (output side)
- ■ 100% test, minimized parameter set: dark current go/no-go (singulation integrity screen), responsivity pass/fail, TIA gain go/no-go, sensitivity pass/fail at single data rate.
- ■ Fast binning logic (pass/fail/marginal) with automatic outlier flagging, tagged to bar for downstream packaging sort.
- ■ Real-time SPC and lot-trend monitoring on all CTQ parameters with automatic lot-hold triggers
- ■ Correlation audit sample pulled periodically (e.g., weekly) and cross-checked against LVM/Validation baseline and Insertion #2 model.
- ■ Full bandwidth sweep, TDECQ, overload, and noise characterization not performed in-line; covered by periodic sample only.
Environmental Parameters
- ■ No per-bar environmental test in the production flow.
- ■ Periodic qualification monitor (e.g., quarterly reliability sample): temperature sweep, dark current, responsivity, bandwidth, per original Validation-stage protocol, on a small pulled sample of bar.
- ■ Any process, material, singulation, or bar-attach change triggers a requalification subset before returning to steady-state HVM flow.
- ■ Field-return/failure-analysis feedback loop (post-package/post-deployment) monitored for optical, electrical, or environmental-related escapes traced back to bar-level or singulation/bar-attach signatures.
Pass/Fail Criteria: Production spec limits, tight guardbands, automated disposition; any drift beyond SPC or lot-trend control limits halts the lot pending investigation.
Duration: Seconds per bar target; environmental and full-condition sampling scheduled outside the main production cadence to avoid throughput impact.
4.2.5 Summary Comparison
Table 8 - Summary Comparison
| Aspect | R&D | Validation | LVM | HVM |
|---|---|---|---|---|
| Sample size | 5-15 bars | 30-90 bars | 100% CTQ / sample env | 100% CTQ / periodic env |
| Optical coverage | Full L-I, spectral, eye sweep, Ins#1 delta | Full spec list, corners, delta limits | CTQ subset, guard banded | Minimal CTQ, single condition |
| Electrical coverage | Full I-V, S11 sweep, Ins#1 delta | Full spec list, corners, delta limits | CTQ subset, guard banded | Minimal CTQ, single condition |
| Environmental cov- erage | Full range, exploratory | Full spec limits, gated | Sample-based, SPC-triggered | Periodic qual only |
| Correlation focus | Insertion #2 (wafer) vs #3 (bar) delta edge-leakage screen | Formalized correlation model | Periodic model check | Periodic model check |
| Alignment method | Manual/semi-auto | Auto-align (qualified) | Auto-align (locked) | Auto-align (high-speed) |
| Probe access | Optical, DC, RF Manual/ semi-auto | Optical, DC, RF auto-align (qualified) | Optical, DC, RF auto-align (qualified) | Optical, DC, RF auto-align (high-speed) |
| Test time priority | Low (data-rich) | Medium | High | Highest |
| Pass/fail basis | None (data gen.) | Formal limits + delta limits | Guard banded limits | Tight guard bands, auto-bin |
| Trend/map use | Full traceability to wafer origin | Uniformity validation | Spot-check vs. baseline | Trend monitoring only |
Note: Electrical and optical parameter names and limits should be adapted to the specific E-O E-PIC architecture (directly-modulated laser, EML, integrated laser + external modulator, etc.), wavelength band (O-band, C-band, or other), modulation format (NRZ, PAM4), and facet coating design (AR, HR, or ascleaved) in use. The specific intervening bar-level process step between wafer-level Insertion #2 and bar-level Insertion #3 (facet coating deposition, burn-in/aging, or both) should be explicitly identified in the program's process flow documentation, since it determines which delta parameters matter most and whether earlier insertion data can serve as a predictive pre-screen to reduce Insertion #3 test scope. Laser threshold current shift is called out specifically as a primary burn-in screening metric - if burn-in is part of this insertion's preceding process step, threshold-shift acceptance criteria should be established early and treated as a key reliability gate, not just a performance parameter. Die-level traceability (linking each die's wafer-level and bar-level records across insertions) is required to support delta-tracking and should be established as an infrastructure requirement starting at R&D. As with earlier insertions, bar-level testing inherently limits environmental coverage (e.g., humidity, thermal cycling) compared to packaged-device testing - these should be formally re-verified at the post-singulation/post-package insertion in the overall test flow.
Electro-Photonic Integrated Circuit (E-PIC) Electrical-to-Optical (E-O)
Optical, Electrical & Environmental Parameter Coverage Across Program Maturity Stages
Scope: These four procedures define the optical, electrical, and environmental test methodology for the Optical-to-Electrical Electro-optic Photonic Integrated Circuit (O-E E-PIC) at ATE Insertion #3, performed at bar level - i.e., on individually singulated bar, following wafer-level Insertion #1 and Insertion #2. The device under test takes an optical input and produces an electrical output (receiver-side PIC: photodiode, or integrated photodiode + transimpedance amplifier (TIA)). Bar-level testing (rather than bar-level) is applicable here because optical access does not require an exposed cleaved facet - consistent with a grating-coupler or other vertical/surface-coupled optical interface - so the flow moves directly from wafer dicing to individual bar without an intermediate bar-test step. Insertion #3 occurs after singulation and, where applicable, after bar-attach to a carrier or submount, serving as the final pre-package gate. Insertion #3 places emphasis on (a) correlation and delta-tracking against wafer-level Insertion #2 data for the same bar, (b) verification that singulation (dicing saw/laser) and any bar-attach step did not degrade photodiode/TIA or coupling performance (mechanical stress, thermal path, adhesive/solder-induced strain, or new dark-current leakage paths introduced by dicing), and (c) individual bar handling and optical alignment repeatability now that the bar is no longer wafer-fixtured. Optical fiber-array probe access (input side - grating coupler or bar-level edge-coupling fixture) and DC/RF electrical probe access (output side, via probe needles or carrier bond pads) are used, consistent with wafer-level Insertion #1/#2 conventions.
| 4.3.1 R&D-Level | |
|---|---|
| Objective: | Fully characterize post-coating/post-burn-in electrical-to-optical conversion and facet-coupled performance, quantify the effect of the intervening bar-level process step (facet coating, burn-in) relative to wafer-level Insertion #2 base- line, and establish Insertion #3-specific spec limits and correlation models for validation. |
| Sample Size: | 5-15 bars, matched to the same die measured at wafer-level Insertion #2 where traceable (paired dataset), spanning multiple wafer/cleave positions. |
| Test Station: | Benchtop-style (manual) probe system with an optical, DC and RF positioer, an optical power meter (OPM), optical spectrum analyzer (OSA). With an optional wavelength meter (λ meter). A DC source such as a SMU, and an RF generator. The probe system can be configured with a thermal chuck or set up with an external environmental temperature chamber. The exact probe system configu- ration and test setup are specific to the device-under-test (DUT) architecture. |
Figure 29 - Manual Probe System
Electrical Parameters (input side)
- ■ Full I-V sweep on all bias and drive pins (laser bias, modulator driver supply, TEC if on-die) - compared die-for-die against wafer-level Insertion #2 result (delta-Idd, delta-threshold).
- ■ Supply current vs. voltage/temperature (Idd vs. Vdd, Idd vs. T).
- ■ Input leakage current on all control/bias pins.
- ■ Drive signal input impedance / return loss (S11) at the RF input port.
- ■ Input sensitivity - minimum drive swing to achieve spec'd optical modulation, delta-tracked against wafer-level Insertion #2.
- ■ Die-level pass/fail delta analysis on electrical parameters: identify die that regressed vs. improved between wafer-level Insertion #2 and bar-level Insertion #3 (burn-in-induced degradation vs. expected stabilization).
Optical Parameters (output side)
- ■ Optical output power vs. bias current (L-I curve) and vs. temperature - delta-power vs. wafer-level Insertion #2 to isolate the coating/burn-in contribution.
- ■ Laser threshold current shift analysis - a primary burn-in screening metric; compare pre/post-burnin threshold to flag early-life degradation risk.
- ■ Slope efficiency (if on-die laser present).
- ■ Facet coating reflectivity verification (AR/HR) via return loss / back-reflection measurement at the output facet, against coating target spec.
- ■ Coating uniformity along bar length and bar-to-bar.
- ■ Center wavelength verification, checked for any coating-induced spectral shift.
- ■ Spectral width, side-mode suppression ratio (SMSR).
Optical Parameters (output side) con't
- ■ Extinction ratio vs. drive voltage/bias - delta-tracked against wafer-level Insertion #2.
- ■ Optical modulation amplitude (OMA) and average power at spec'd drive condition.
- ■ RIN across bias range.
- ■ Eye diagram / PAM4 linearity, TDECQ at representative data rate.
- ■ Chirp (if applicable to modulator type).
- ■ Coupling loss and alignment tolerance (1-dB alignment window) at output port - re-verified post-coating since coating thickness/index can shift optimal coupling condition.
- ■ Channel-to-channel uniformity across the bar.
Environmental Parameters
- ■ Bar-stage temperature sweep: -40°C to +85°C (or per design target), in 10-20°C steps.
- ■ Electrical and optical parameter drift vs. temperature (threshold current shift, wavelength drift, extinction ratio degradation), compared against wafer-level Insertion #2 temperature-dependence data to detect any coating- or burn-in-induced shift in temperature sensitivity.
- ■ Repeat measurement (bar re-load/re-touchdown) to characterize electrical and optical alignment repeatability as a function of temperature and bar handling, and to distinguish measurement noise from true process-step-induced shift.
Data Handling: All raw I-V, spectral, and eye/modulation traces retained and paired to the corresponding wafer-level Insertion #2 record per die where traceable; delta/ drift statistics built per parameter, correlated to bar position and originating wafer location. No formal pass/fail gate - data feeds spec-limit derivation, coating/burn-in process tuning, and correlation-model development for validation.
Duration: Extended (tens of minutes to hours per bar acceptable); test time is not optimized, full bias and wavelength sweeps used throughout.
4.3.2 Validation-Level
Objective: Confirm the E-PIC meets Insertion #3 (post-coating/post-burn-in) datasheet/ spec limits at bar level, validate the die-level correlation model between wafer-level Insertion #2 and bar-level Insertion #3, confirm facet-coating and burn-in process capability, and validate test program coverage prior to LVM release.
Sample Size: 30-90 bars (statistically meaningful per parameter; supports Cpk and barto-bar/lot uniformity estimation), spanning ≥3 lots, paired to their wafer-level Insertion #2 records where traceable.
Test Station: Benchtop-style (manual) probe system with an optical, DC and RF positioner, an optical power meter (OPM), optical spectrum analyzer (OSA). With an optional wavelength meter (λ meter). A DC source such as a SMU, and an RF generator. The probe system can be configured with a thermal chuck or set up with an external environmental temperature chamber. The exact probe system configuration and test setup are specific to the device-under-test (DUT) architecture.
Test instrumentation and test routines (recipes) are controlled by the software, with measurement data stored to enable device-to-device cross-correlation and performance analysis.
Semi-Automatic Probe System
Figure 30 - Semi-Automatic Probe System
Electrical Parameters (input side)
- ■ DC parametric: Idd, Ileak, bias voltages at nominal/min/max supply corners - with delta limits vs. wafer-level Insertion #2.
- ■ RF input return loss (S11) at spec frequency/data rate.
- ■ Input sensitivity verification against spec limit.
Optical Parameters (output side)
- ■ L-I curve verification (threshold, slope efficiency) against spec limits, with delta-vs-Insertion-#2 limit.
- ■ Laser threshold shift verification against burn-in acceptance criteria (screens out early-life failures).
- ■ Facet coating reflectivity verification against spec-defined AR/HR target; coating-process capability (Cpk) analysis.
- ■ Center wavelength verification.
- ■ SMSR at nominal bias/temperature.
- ■ Extinction ratio, OMA, and average power at spec drive condition.
- ■ TDECQ / eye mask compliance at spec data rate (single condition).
- ■ Fiber-array coupling alignment tolerance verification (auto-align convergence and repeatability across all channels on the bar).
- ■ Channel-to-channel uniformity verification against spec limits.
- ■ Corner testing: Temp min/typ/max × Bias min/typ/max.
- ■ Insertion #2 (wafer)-to-Insertion #3 (bar) correlation study formalized (regression/limit-setting for using earlier insertion data as a predictive screen, if applicable).
- ■ Bar-to-packaged-module correlation study (subset of bars/die tracked through singulation and packaging).
- ■ Gauge R&R on critical electrical and optical parameters (repeat bar-load/touchdown study).
Environmental Parameters
- ■ Temperature verification at spec limits (e.g., -40°C, +25°C, +85°C) with pass/fail gating on electrical and optical parameters.
- ■ Bar-to-bar and within-bar uniformity analysis (spatial trending of threshold current, wavelength, extinction ratio, coating reflectivity along bar length and across lot).
- ■ Preliminary correlation to post-singulation/post-package environmental stress (thermal cycling), feeding back into bar-level pass/fail limits.
Pass/Fail Criteria: Formal spec limits applied, including delta-vs-Insertion-#2 limits where relevant; failures root-caused and dispositioned (design vs. process vs. coating vs. burn-in vs. test escape vs. alignment/fixture artifact).
Duration: Tens of minutes to an hour per bar; test time optimization begins (reduced bias/ wavelength points, faster fiber-array auto-align) but coverage remains primary.
4.3.3 Low Volume Manufacturing (LVM)
Objective: Execute a production-intent, throughput-aware bar-level electrical/optical test flow at Insertion #3 with statistical process control (SPC) in place, while maintaining tighter environmental/corner sampling than HVM, and confirming facet-coating and burn-in process stability lot-to-lot.
Sample Size: 100% die-on-bar tested for core electrical and optical CTQ parameters; environmental/full-corner testing on a defined sample plan (e.g., 1 bar per lot, or N die per bar).
Test Station: Benchtop-style (manual) probe system with an optical, DC and RF positioner, an optical power meter (OPM), optical spectrum analyzer (OSA). A DC source such as a SMU, and an RF generator. The probe system can be configured with a thermal chuck or set up with an external environmental temperature chamber. The exact probe system configuration and test setup are specific to the device-under-test (DUT) architecture.
Test instrumentation and test routines (recipes) are controlled by the software, with measurement data stored to enable device-to-device cross-correlation and performance analysis.
A wafer loader enables fully automated wafer loading and unloading as part of the software-controlled test and handling process.
An optional SECS/GEM software interface enables integration with factory-level automation and manufacturing execution systems (MES) for streamlined production workflows and data management.
Automatic Probe System with MHU
Figure 31 - Automatic Probe System with MHU
Electrical Parameters (input side)
- ■ 100% test of Idd, Ileak at nominal condition.
- ■ RF input return loss go/no-go at spec frequency.
Optical Parameters (output side)
- ■ 100% (or high-coverage) test of critical-to-quality (CTQ) parameters only: output power at nominal bias, threshold current go/no-go (burn-in screen), facet coating reflectivity go/no-go, extinction ratio go/no-go.
- ■ Reduced condition testing - single bias/temp point rather than full sweep, unless SPC flags drift.
- ■ Guardbanded limits (tightened from Validation limits to account for alignment/test uncertainty).
- ■ In-line SPC charting (Xbar-R or bar-map trend) on top CTQ electrical and optical parameters, including coating-process and burn-in Cpk tracking.
- ■ Correlation checks against Validation dataset and Insertion #2 correlation model on a periodic basis (e.g., first-bar per lot).
- ■ SMSR, TDECQ, and full L-I curve sampled rather than tested per die.
Environmental Parameters
- ■ Sample-based temperature verification (e.g., hot/cold spot-check on subset of bars per lot) rather than full sweep.
- ■ No full corner matrix - spot checks only, escalated to full Validation-style test if SPC signals an excursion.
- ■ Bar-map uniformity spot-checked against Validation baseline.
Pass/Fail Criteria: Formal limits from Validation, with guardbands; SPC out-of-control (including coating/burn-in process Cpk drift) triggers hold-and-investigate.
Duration: Test time actively optimized (target: seconds-to-low-minutes per die-on-bar); fiber-array auto-align speed and single-condition testing are the primary throughput levers.
4.3.4 High Volume Manufacturing (HVM)
Objective: Maximize bar-test throughput and yield visibility at the final bar-level gate, with minimal necessary electrical/optical test coverage, relying on statistical/spatial monitoring rather than exhaustive per-die environmental or full-condition testing.
Sample Size: 100% die-on-bar tested for a minimal CTQ electrical/optical parameter set; environmental and full-condition testing reduced to periodic qualification-style monitors only (e.g., quarterly or per-process-change), not per-lot.
Test Station: Benchtop-style (manual) probe system with an optical, DC and RF positioner, an optical power meter (OPM), a DC source such as a SMU, and an RF generator. The probe system can be configured with a thermal chuck or set up with an external environmental temperature chamber. The exact probe system configuration and test setup are specific to the device-under-test (DUT) architecture.
Test instrumentation and test routines (recipes) are controlled by the software, with measurement data stored to enable device-to-device cross-correlation and performance analysis.
A wafer loader enables fully automated wafer loading and unloading as part of the software-controlled test and handling process.
An optional SECS/GEM software interface enables integration with factory-level automation and manufacturing execution systems (MES) for streamlined production workflows and data management.
Figure 32 - Automatic Probe System with MHU and ATE Docking Station
Electrical Parameters (input side)
- ■ 100% test, minimized set: Idd go/no-go, RF input return loss coarse check.
- ■ Single nominal test condition (room temp, nominal bias) unless design margin requires a secondary condition.
Optical Parameters (output side)
- ■ 100% test, minimized parameter set: output power (single wavelength/bias, go/no-go), threshold current go/no-go, facet coating reflectivity go/no-go, extinction ratio pass/fail.
- ■ Fast binning logic (pass/fail/marginal) with automatic outlier flagging, tagged to die position for downstream singulation sort.
- ■ Real-time SPC and bar-map trending on all CTQ parameters with automatic lot-hold triggers.
- ■ Correlation audit sample pulled periodically (e.g., weekly) and cross-checked against LVM/Validation baseline and Insertion #2 model.
- ■ Full L-I curve, SMSR, and TDECQ characterization not performed in-line; covered by periodic sample only.
Environmental Parameters
- ■ No per-die environmental test in the production flow.
- ■ Periodic qualification monitor (e.g., quarterly reliability sample): temperature sweep, L-I curve, spectral characterization, per original Validation-stage protocol, on a small pulled sample of bars.
- ■ Any process, material, coating, or burn-in recipe change triggers a requalification subset before returning to steady-state HVM flow.
- ■ Field-return/failure-analysis feedback loop (post-singulation/post-package/post-deployment) monitored for electrical, optical, or environmental-related escapes traced back to bar-level or facet-coating signatures.
Pass/Fail Criteria: Production spec limits, tight guard bands, automated disposition; any drift beyond SPC or bar-map control limits halts the lot pending investigation.
Duration: Seconds per die-on-bar target; environmental and full-condition sampling scheduled outside the main production cadence to avoid throughput impact.
4.3.5 Summary Comparison
Table 9 - Summary Comparison
| Aspect | R&D | Validation | LVM | HVM |
|---|---|---|---|---|
| Sample size | 5-15 bars | 30-90 bars | 100% CTQ / sample env | 100% CTQ / periodic env |
| Optical coverage | Full L-I, spectral, eye sweep, coating/ burn-in delta | Full spec list, corners, delta limits | CTQ subset, guard banded | Minimal CTQ, single condition |
| Electrical coverage | Full I-V, S11 sweep, Ins#1 delta | Full spec list, corners, delta limits | CTQ subset, guard banded | Minimal CTQ, single condition |
| Environmental coverage | Full range, exploratory | Full spec limits, gated | Sample-based, SPC-triggered | Periodic qual only |
| Correlation focus | Insertion #2 (wafer) vs #3 (bar) delta edge- leakage screen | Formalized correlation model | Periodic model check | Periodic model check |
| Alignment method | Manual/semi-auto | Auto-align (qualified) | Auto-align (locked) | Auto-align (high-speed) |
| Probe access | Optical, DC, RF Manual/ semi-auto | Optical, DC, RF auto-align (qualified) | Optical, DC, RF auto-align (qualified) | Optical, DC, RF auto-align (high-speed) |
| Test time priority | Low (data-rich) | Medium | High | Highest |
| Pass/fail basis | None (data gen.) | Formal limits + delta limits | Guard banded limits | Tight guard bands, auto-bin |
| Trend/map use | Full traceability to wafer origin | Uniformity validation | Spot-check vs. baseline | Trend monitoring only |
Note: Electrical and optical parameter names and limits should be adapted to the specific E-O E-PIC architecture (directly-modulated laser, EML, integrated laser + external modulator, etc.), wavelength band (O-band, C-band, or other), modulation format (NRZ, PAM4), and facet coating design (AR, HR, or ascleaved) in use. The specific intervening bar-level process step between wafer-level Insertion #2 and bar-level Insertion #3 (facet coating deposition, burn-in/aging, or both) should be explicitly identified in the program's process flow documentation, since it determines which delta parameters matter most and whether earlier insertion data can serve as a predictive pre-screen to reduce Insertion #3 test scope. Laser threshold current shift is called out specifically as a primary burn-in screening metric - if burn-in is part of this insertion's preceding process step, threshold-shift acceptance criteria should be established early and treated as a key reliability gate, not just a performance parameter. Die-level traceability (linking each die's wafer-level and bar-level records across insertions) is required to support delta-tracking and should be established as an infrastructure requirement starting at R&D. As with earlier insertions, bar-level testing inherently limits environmental coverage (e.g., humidity, thermal cycling) compared to packaged-device testing - these should be formally re-verified at the post-singulation/post-package insertion in the overall test flow.
5. ATE Insertion #3 testing on Die level
Electro-Photonic Integrated Circuit (E-PIC) Optical-to-Optical (O-O)
Optical, Electrical & Environmental Parameter Coverage Across Program Maturity Stages
Scope: These four procedures define the optical and environmental test methodology for the Optical-to-Optical Electro-optic Photonic Integrated Circuit (O-O E-PIC) at ATE Insertion #3, performed at die level - i.e., on individually singulated die, following wafer-level Insertion #1 and Insertion #2. Die-level testing (rather than bar-level) is applicable here because optical access does not require an exposed cleaved facet - consistent with a grating-coupler or other vertical/surface-coupled optical interface - so the flow moves directly from wafer dicing to individual die without an intermediate bar-test step. Insertion #3 occurs after singulation and, where applicable, after die-attach to a carrier or submount, serving as the final pre-package optical gate. Insertion #3 places emphasis on (a) correlation and delta-tracking against wafer-level Insertion #2 data for the same die, (b) verification that singulation (dicing saw/laser) and any die-attach step did not degrade optical performance (mechanical stress, thermal path, adhesive/solder-induced strain), and (c) individual die handling and optical alignment repeatability now that the die is no longer wafer-fixtured. Optical access is via vertical/surface fiber-array probe (grating coupler) or a die-level edge-coupling fixture if the architecture requires it; DC/RF electrical bias is applied via probe or, if die-attached, through carrier bond pads, to exercise the active E-PIC elements under optical test.
5.1.1 R&D-Level
| Objective: | Fully characterize post-singulation (and post-die-attach, if applicable) electro-op- tic and optical-coupling performance, quantify the effect of singulation/die-attach relative to wafer-level Insertion #2 baseline, and establish Insertion #3-specific spec limits and correlation models for validation. |
|---|---|
| Sample Size: | 5-15 die, matched to the same die measured at wafer-level Insertion #2 (paired dataset), spanning multiple wafer locations. |
| Test Station: | Benchtop-style (manual) probe system with one or two optical positioners, an optical light source (OLS) like a tunable laser source, and optical power meter (OPM) and optical spectrum analyzer. With optional optical frequency domain reflectometer (OFDR) and optional wavelength meter (λ meter). The probe system can be configured with a thermal chuck or set up with an external environmental temperature chamber. The exact probe system configuration and test setup are specific to the device-under-test (DUT) architecture. |
Figure 33 - Manual Probe System
Optical Parameters
- ■ Insertion loss (IL), fiber-to-fiber and per-interface (coupler, waveguide, modulator/SOA block) at nominal wavelength and nominal bias - compared die-for-die against wafer-level Insertion #2 result (delta-IL) to isolate the singulation/die-attach contribution.
- ■ Grating or edge coupler alignment tolerance and coupling loss - re-verified post-singulation since dicing debris, edge chipping, or die-attach tilt can shift optimal coupling angle/position.
- ■ Wavelength-dependent loss (WDL) sweep across full design band, checked for any singulation- or die-attach-induced spectral shift.
- ■ Polarization-dependent loss (PDL).
- ■ Return loss / back-reflection at each optical port.
- ■ Mode field diameter (MFD) match verification between fiber array and coupler mode.
- ■ Crosstalk between adjacent optical channels/waveguides.
- ■ Electro-optic response: Vpi, modulator bandwidth (S21/E-O response), extinction ratio vs. bias, chirp (if applicable), SOA gain/saturation curve, switching time - delta-tracked against wafer-level Insertion #2.
- ■ PAM4/eye linearity and TDECQ at representative data rate.
- ■ RIN across bias range.
Optical Parameters (con't)
- ■ Thermal tuning coefficient (pm/°C) and thermal tuner power consumption vs. wavelength shift - re-verified for any change in thermal path if die-attached to a carrier/submount.
- ■ Mechanical-stress-induced performance shift: compare pre-singulation (wafer) vs. post-singulation die-level data to flag dicing-induced stress birefringence or waveguide stress effects.
- ■ Die-level pass/fail delta analysis: identify die that regressed vs. improved between wafer-level Insertion #2 and die-level Insertion #3.
- ■ Visual/optical inspection correlation (edge chipping, dicing debris, die-attach voiding/tilt) against measured optical performance.
Environmental Parameters
- ■ Die/carrier stage temperature sweep: -40°C to +85°C (or per design target), in 10-20°C steps.
- ■ Electro-optic and coupling parameter drift vs. temperature (Vpi shift, extinction ratio degradation, IL drift), compared against wafer-level Insertion #2 temperature-dependence data to detect any singulation or die-attach-induced shift in temperature sensitivity (e.g., new CTE mismatch from die-attach material).
- ■ Repeat measurement (die re-load/re-pick) to characterize optical and electrical alignment repeatability as a function of temperature and individual die handling.
Data Handling: All raw traces retained and paired to the corresponding wafer-level Insertion #2 record per die; delta/drift statistics built per parameter, correlated to original wafer location. No formal pass/fail gate - data feeds spec-limit derivation, singulation/die-attach process tuning, and correlation-model development for validation.
Duration: Extended (tens of minutes to hours per die acceptable); test time is not optimized, full wavelength and bias sweeps used throughout.
5.1.2 Validation-Level
Objective: Confirm the E-PIC meets Insertion #3 (post-singulation/post-die-attach) datasheet/spec limits at die level, validate the die-level correlation model between wafer-level Insertion #2 and die-level Insertion #3, confirm singulation and die-attach process capability, and validate test program coverage prior to LVM release.
Sample Size: 30-90 die (statistically meaningful per parameter; supports Cpk estimation), spanning ≥3 lots, paired to their wafer-level Insertion #2 records.
Test Station: Semi- or fully automatic probe system with one or two optical positioners, an optical light source (OLS) like a tunable laser source, and optical power meter (OPM) and optical spectrum analyzer. With optional optical frequency domain reflectometer (OFDR) and optional wavelength meter (λ meter). The probe system can be configured with a thermal chuck or set up with an external environmental temperature chamber. The exact probe system configuration and test setup are specific to the device-under-test (DUT) architecture.
Test instrumentation and test routines (recipes) are controlled by the software, with measurement data stored to enable device-to-device cross-correlation and performance analysis.
Semi-Automatic Probe System
Figure 34 - Semi-Automatic Probe System
Optical Parameters
- ■ Full parametric list from R&D, reduced to spec-relevant subset with defined limits (LSL/USL) specific to post-singulation/post-die-attach targets.
- ■ Insertion loss at nominal + spec-band edges (3-point or 5-point wavelength test, not full sweep) - with delta-IL limit vs. wafer-level Insertion #2.
- ■ Coupler alignment tolerance verification (auto-align convergence and repeatability), specifically screening for singulation-related coupling degradation.
- ■ PDL, return loss at spec-defined limits.
- ■ Extinction ratio, Vpi, and modulation bandwidth at nominal bias and spec wavelength.
- ■ TDECQ / eye mask compliance at spec data rate (single condition).
- ■ Corner testing: Temp min/typ/max × Bias min/typ/max × wavelength band edges.
- ■ Insertion #2 (wafer)-to-Insertion #3 (die) correlation study formalized (regression/limit-setting for using earlier insertion data as a predictive screen, if applicable).
- ■ Die-to-packaged-module correlation study (subset of die tracked through packaging).
- ■ Gauge R&R on critical optical and electro-optic parameters (repeat die-load/touchdown study).
Environmental Parameters
- ■ Temperature verification at spec limits (e.g., -40°C, +25°C, +85°C) with pass/fail gating on optical and electro-optic parameters.
- ■ Thermal tuning coefficient verification for resonant elements, if applicable, including any shift attributable to die-attach thermal path change.
- ■ Die-to-die and lot-to-lot uniformity analysis (trending of IL, WDL, PDL, Vpi, extinction ratio).
- ■ Preliminary correlation to post-package environmental stress (thermal cycling), feeding back into die-level pass/fail limits.
Pass/Fail Criteria: Formal spec limits applied, including delta-vs-Insertion-#2 limits where relevant; failures root-caused and dispositioned (design vs. process vs. singulation vs. die-attach vs. test escape vs. alignment/fixture artifact).
Duration: Tens of minutes to an hour per die; test time optimization begins (reduced wavelength/bias points, faster fiber-array auto-align) but coverage remains primary.
5.1.3 Low Volume Manufacturing (LVM)
Objective: Execute a production-intent, throughput-aware die-level optical test flow at Insertion #3 with statistical process control (SPC) in place, while maintaining tighter environmental/wavelength sampling than HVM, and confirming singulation/die-attach process stability lot-to-lot.
Sample Size: 100% die tested for core optical CTQ parameters; environmental/fullspectrum testing on a defined sample plan (e.g., N die per lot).
Test Station: Fully automated, software-controlled probe system with one or two optical positioners, an optical light source (OLS) like a tunable laser source, and optical power meter (OPM) and optical spectrum analyzer. With optional optical frequency domain reflectometer (OFDR). The probe system can be configured with a thermal chuck or set up with an external environmental temperature chamber. The exact probe system configuration and test setup are specific to the device-under-test (DUT) architecture.
Test instrumentation and test routines (recipes) are controlled by the software, with measurement data stored to enable device-to-device cross-correlation, performance analysis, and ECO-chain traceability.
A wafer loader enables fully automated wafer loading and unloading as part of the software-controlled test and handling process.
An optional SECS/GEM software interface enables integration with factory-level automation and manufacturing execution systems (MES) for streamlined production workflows and data management.
Automatic Probe System with MHU
Figure 35 - Automatic Probe System with MHU
Optical Parameters
- ■ 100% test of critical-to-quality (CTQ) parameters only: insertion loss at nominal wavelength, extinction ratio go/no-go, return loss go/no-go.
- ■ Reduced wavelength testing - single or dual-point (band-edge) check rather than full sweep, unless SPC flags drift.
- ■ Guard banded limits (tightened from Validation limits to account for singulation/alignment/test uncertainty).
- ■ In-line SPC charting (Xbar-R or lot-trend) on top CTQ optical parameters, including singulation/ die-attach process Cpk tracking.
- ■ Correlation checks against Validation dataset and Insertion #2 correlation model on a periodic basis (e.g., first-lot sample).
- ■ PDL, full-band WDL, and modulation bandwidth sampled rather than tested per die.
Environmental Parameters
- ■ Sample-based temperature verification (e.g., hot/cold spot-check on subset of die per lot) rather than full sweep.
- ■ Periodic thermal-tuning-coefficient audit (reduced sample, e.g., per-lot) for resonant structures.
- ■ No full corner matrix - spot checks only, escalated to full Validation-style test if SPC signals an excursion.
- ■ Lot uniformity spot-checked against validation baseline.
Pass/Fail Criteria: Formal limits from Validation, with guardbands; SPC out-of-control (including singulation/die-attach process Cpk drift) triggers hold-and-investigate.
Duration: Test time actively optimized (target: seconds-to-low-minutes per die); fiber-array auto-align speed and reduced wavelength points are the primary throughput levers.
5.1.4 High Volume Manufacturing (HVM)
Objective: Maximize die-test throughput and yield visibility at the final pre-package gate, with minimal necessary optical test coverage, relying on statistical monitoring rather than exhaustive per-die environmental or full-spectrum testing.
Sample Size: 100% die tested for a minimal CTQ optical parameter set; environmental and full-spectrum testing reduced to periodic qualification-style monitors only (e.g., quarterly or per-process-change), not per-lot.
Test Station: Fully automated, software-controlled probe system with one or two optical positioners, an optical light source (OLS), such as a tunable laser source, and an optical power meter (OPM). The system can be configured with an integrated thermal chuck or an external environmental temperature chamber. The exact probe system configuration and test setup are tailored to the device-under-test (DUT) architecture and application.
Test instrumentation, measurement sequences, and test routines (recipes) are software controlled, with measurement data automatically captured and stored to enable device-to-device cross-correlation, performance analysis, process monitoring, and ECO-chain traceability.
A wafer loader enables fully automated wafer loading and unloading as part of the software-controlled test and handling process.
An optional SECS/GEM software interface enables integration with factory-level automation and manufacturing execution systems (MES) for streamlined production workflows and data management.
Figure 36 - Automatic Probe System with MHU and ATE Docking Station
Optical Parameters
- ■ 100% test, minimized parameter set: insertion loss (single wavelength, go/no-go), extinction ratio pass/fail, coarse return-loss check.
- ■ Single nominal test condition (room temp, nominal bias, single wavelength) unless design margin requires a secondary condition.
- ■ Fast binning logic (pass/fail/marginal) with automatic outlier flagging, tagged to die for downstream packaging sort.
- ■ Real-time SPC and lot-trend monitoring on all CTQ parameters with automatic lot-hold triggers.
- ■ Correlation audit sample pulled periodically (e.g., weekly) and cross-checked against LVM/Validation baseline and Insertion #2 model.
- ■ Full WDL/PDL and modulation bandwidth characterization not performed in-line; covered by periodic sample only.
Environmental Parameters
- ■ No per-die environmental test in the production flow
- ■ Periodic qualification monitor (e.g., quarterly reliability sample): temperature sweep, thermal-tuning coefficient, per original Validation-stage protocol, on a small pulled sample of die.
- ■ Any process, material, singulation, or die-attach change triggers a requalification subset before returning to steady-state HVM flow.
- ■ Field-return/failure-analysis feedback loop (post-package/post-deployment) monitored for optical or environmental-related escapes traced back to die-level or singulation/die-attach signatures.
Pass/Fail Criteria: Production spec limits, tight guard bands, automated disposition; any drift beyond SPC or lot-trend control limits halts the lot pending investigation.
Duration: Seconds per die target; environmental and full-spectrum sampling scheduled outside the main production cadence to avoid throughput impact.
5.1.5 Summary Comparison
Table 10 - Summary Comparison
| Aspect | R&D | Validation | LVM | HVM |
|---|---|---|---|---|
| Sample size | 5-15 dies | 30-90 dies | 100% CTQ / sample env | 100% CTQ / periodic env |
| Optical coverage | Full spectral + bias sweep, singulation/ die-attach delta | Full spec list, corners, delta limits | CTQ subset, guard banded | Minimal CTQ, single condition |
| Environmental coverage | Full range, exploratory | Full spec limits, gated | Sample-based, SPC-triggered | Periodic qual only |
| Correlation focus | Insertion #2 (wafer) vs #3 (die) delta edge-leakage screen | Formalized correlation model | Periodic model check | Periodic model check |
| Alignment method | Manual/semi-auto | Auto-align (qualified) | Auto-align (locked) | Auto-align (high-speed) |
| Probe access | Optical, DC, RF Manual/ semi-auto | Optical, DC, RF auto-align (qualified) | Optical, DC, RF auto-align (qualified) | Optical, DC, RF auto-align (high-speed) |
| Test time priority | Low (data-rich) | Medium | High | Highest |
| Pass/fail basis | None (data gen.) | Formal limits + delta limits | Guard banded limits | Tight guard bands, auto-bin |
| Trend/map use | Full traceability to wafer origin | Uniformity validation | Spot-check vs. baseline | Trend monitoring only |
Note: Optical and electro-optic parameter names and limits should be adapted to the specific O-O E-PIC architecture (Mach-Zehnder modulator, ring modulator, EAM, SOA, switch fabric, etc.), wavelength band (O-band, C-band, or other), modulation format (NRZ, PAM4), and optical I/O interface (grating coupler or die-level edge coupling) in use. This procedure represents a die-singulation flow (no intermediate bar-level facet test), consistent with vertical/surface-coupled optical access; if the actual process instead dices wafers into bars for facet coating before final singulation, the relevant bar-level Insertion #3 procedure applies instead and this die-level Insertion #3 would represent a later insertion number. The specific intervening step between wafer-level Insertion #2 and die-level Insertion #3 (singulation alone, or singulation plus die-attach to a carrier/submount) should be explicitly identified in the program's process flow documentation, since it determines which delta parameters matter most. Die-level traceability (linking each die's wafer-level and die-level records across insertions) is required to support delta-tracking and should be established as an infrastructure requirement starting at R&D. As with earlier insertions, this insertion still precedes full packaging, so humidity and long-duration thermal cycling coverage remains limited compared to a packaged-device insertion - these should be formally re-verified post-package in the overall test flow.
Electro-Photonic Integrated Circuit (E-PIC) Optical-to-Electrical (O-E)
Optical, Electrical & Environmental Parameter Coverage Across Program Maturity Stages
Scope: These four procedures define the optical, electrical, and environmental test methodology for the Optical-to-Electrical Electro-optic Photonic Integrated Circuit (O-E E-PIC) at ATE Insertion #3, performed at die level - i.e., on individually singulated die, following wafer-level Insertion #1 and Insertion #2. The device under test takes an optical input and produces an electrical output (receiver-side PIC: photodiode, or integrated photodiode + transimpedance amplifier (TIA)). Die-level testing (rather than bar-level) is applicable here because optical access does not require an exposed cleaved facet - consistent with a grating-coupler or other vertical/surface-coupled optical interface - so the flow moves directly from wafer dicing to individual die without an intermediate bar-test step. Insertion #3 occurs after singulation and, where applicable, after die-attach to a carrier or submount, serving as the final pre-package gate. Insertion #3 places emphasis on (a) correlation and delta-tracking against wafer-level Insertion #2 data for the same die, (b) verification that singulation (dicing saw/laser) and any die-attach step did not degrade photodiode/TIA or coupling performance (mechanical stress, thermal path, adhesive/solder-induced strain, or new dark-current leakage paths introduced by dicing), and (c) individual die handling and optical alignment repeatability now that the die is no longer wafer-fixtured. Optical fiber-array probe access (input side - grating coupler or die-level edge-coupling fixture) and DC/RF electrical probe access (output side, via probe needles or carrier bond pads) are used, consistent with wafer-level Insertion #1/#2 conventions.
5.2.1 R&D-Level
Objective: Fully characterize post-singulation (and post-die-attach, if applicable) opticalto-electrical conversion performance, quantify the effect of singulation/ die-attach relative to wafer-level Insertion #2 baseline, and establish Insertion #3-specific spec limits and correlation models for validation.
Sample Size: 5-15 die, matched to the same die measured at wafer-level Insertion #2 (paired dataset), spanning multiple wafer locations.
Test Station: Benchtop-style (manual) probe system with an optical, DC and RF positioner, an optical light source (OLS) like a tunable laser source, a DC meter such as a SMU, and an Ampere meter and oscilloscope. The probe system can be configured with a thermal chuck or set up with an external environmental temperature chamber. The exact probe system configuration and test setup are specific to the device-under-test (DUT) architecture.
Figure 37 - Manual Probe System
Optical Parameters (input side)
- ■ Optical input power range (min/max operating power).
- ■ Grating coupler (or die-level coupler) alignment tolerance and coupling loss - re-verified post-singulation since dicing debris, edge chipping, or die-attach tilt can shift optimal coupling angle/position.
- ■ Wavelength-dependent responsivity sweep across full design band, checked for any singulationor die-attach-induced spectral shift.
- ■ Polarization-dependent responsivity (PDR).
- ■ Overload/saturation optical input power threshold.
- ■ Return loss / back-reflection at optical input port.
Electrical Parameters (output side)
- ■ Photodiode dark current (Id) vs. reverse bias voltage and temperature - compared die-for-die against wafer-level Insertion #2 result (delta-Id); dicing can introduce new edge-leakage paths, so this is a primary singulation-integrity screen.
- ■ Mechanical-stress-induced dark current or responsivity shift analysis (compare pre-singulation wafer data vs. post-singulation die data to flag dicing-induced stress or edge-damage effects).
- ■ Responsivity (A/W) at nominal wavelength and bias - delta-tracked against wafer-level Insertion #2.
- ■ Photodiode capacitance vs. bias (Cj-V).
- ■ 3-dB electrical/optical bandwidth (S21 or equivalent) vs. bias.
Electrical Parameters (output side) con't
- ■ TIA transimpedance gain, bandwidth, and output swing (if integrated TIA present).
- ■ Input-referred noise current / noise equivalent power (NEP).
- ■ Common-mode rejection ratio (CMRR) for differential outputs, if applicable.
- ■ Supply current (Idd) vs. voltage/temperature for TIA/bias circuitry.
- ■ Eye diagram / PAM4 linearity and TDECQ at representative data rate and input power.
- ■ Sensitivity (minimum optical input power for target BER) across data rate/modulation format - delta-tracked against wafer-level Insertion #2.
- ■ Overload sensitivity (maximum optical input power before BER degradation).
- ■ Die-level pass/fail delta analysis: identify die that regressed vs. improved between wafer-level Insertion #2 and die-level Insertion #3 (singulation/die-attach-induced degradation vs. no change expected).
- ■ Visual/optical inspection correlation (edge chipping, dicing debris, die-attach voiding/tilt) against measured optical/electrical performance.
Environmental Parameters
- ■ Die/carrier stage temperature sweep: -40°C to +85°C (or per design target), in 10-20°C steps.
- ■ Optical and electrical parameter drift vs. temperature (dark current, responsivity, sensitivity shift, TIA gain drift), compared against wafer-level Insertion #2 temperature-dependence data to detect any singulation- or die-attach-induced shift in temperature sensitivity (e.g., new CTE mismatch or thermal path change from die-attach material).
- ■ Repeat measurement (die re-load/re-pick) to characterize optical and electrical alignment repeatability as a function of temperature and individual die handling.
Data Handling: All raw responsivity, noise, bandwidth, and eye/BER traces retained and paired to the corresponding wafer-level Insertion #2 record per die; delta/drift statistics built per parameter, correlated to original wafer location. No formal pass/fail gate - data feeds spec-limit derivation, singulation/die-attach process tuning, and correlation-model development for validation.
Duration: Extended (tens of minutes to hours per die acceptable); test time is not optimized, full bias, wavelength, and power sweeps used throughout.
5.2.2 Validation-Level
Objective: Confirm the E-PIC meets Insertion #3 (post-singulation/post-die-attach) datasheet/spec limits at die level, validate the die-level correlation model between wafer-level Insertion #2 and die-level Insertion #3, confirm singulation and die-attach process capability, and validate test program coverage prior to LVM release.
Sample Size: 30-90 die (statistically meaningful per parameter; supports Cpk estimation), spanning ≥3 lots, paired to their wafer-level Insertion #2 records.
Test Station: Semi- or fully automatic probe system with an optical, DC and RF positioner, an optical light source (OLS) like a tunable laser source, a DC meter such as a SMU, and an Ampere meter and oscilloscope. The probe system can be configured with a thermal chuck or set up with an external environmental temperature chamber. The exact probe system configuration and test setup are specific to the device-under-test (DUT) architecture.
Test instrumentation and test routines (recipes) are controlled by the software, with measurement data stored to enable device-to-device cross-correlation and performance analysis.
Semi-Automatic Probe System
Figure 38 - Semi-Automatic Probe System
Optical Parameters (input side)
- ■ Coupler alignment tolerance verification (auto-align convergence and repeatability), specifically screening for singulation-related coupling degradation.
- ■ Optical input power range verification against spec limits.
- ■ Return loss at spec-defined limits.
- ■ Responsivity at nominal + spec-band edges (3-point wavelength test, not full sweep).
Electrical Parameters (output side)
- ■ Dark current, responsivity, and TIA gain verification against spec limits at nominal bias, with delta limits vs. wafer-level Insertion #2 - specifically screening for singulation-induced edge leakage.
- ■ 3-dB bandwidth verification at spec condition.
- ■ Sensitivity and overload verification at spec data rate/modulation format, with delta limit vs. wafer-level Insertion #2.
- ■ TDECQ / eye mask compliance at spec data rate (single condition).
- ■ Corner testing: Temp min/typ/max × Bias min/typ/max × optical input power min/typ/max.
- ■ Insertion #2 (wafer)-to-Insertion #3 (die) correlation study formalized (regression/limit-setting for using earlier insertion data as a predictive screen, if applicable).
- ■ Die-to-packaged-module correlation study (subset of die tracked through packaging).
- ■ Gauge R&R on critical optical and electrical parameters (repeat die-load/touchdown study).
Environmental Parameters
- ■ Temperature verification at spec limits (e.g., -40°C, +25°C, +85°C) with pass/fail gating on optical and electrical parameters.
- ■ Die-to-die and lot-to-lot uniformity analysis (trending of dark current, responsivity, sensitivity, bandwidth).
- ■ Preliminary correlation to post-package environmental stress (thermal cycling, humidity), feeding back into die-level pass/fail limits.
Pass/Fail Criteria: Formal spec limits applied, including delta-vs-Insertion-#2 limits where relevant; failures root-caused and dispositioned (design vs. process vs. singulation vs. die-attach vs. test escape vs. alignment/fixture artifact).
Duration: Tens of minutes to an hour per die; test time optimization begins (reduced bias/wavelength/power points, faster fiber-array auto-align) but coverage remains primary.
5.2.3 Low Volume Manufacturing (LVM)
Objective: Execute a production-intent, throughput-aware die-level optical/electrical test flow at Insertion #3 with statistical process control (SPC) in place, while maintaining tighter environmental/corner sampling than HVM, and confirming singulation/die-attach process stability lot-to-lot.
Sample Size: 100% die tested for core optical and electrical CTQ parameters; environmental/full-corner testing on a defined sample plan (e.g., N die per lot).
Test Station: Semi- or fully automatic probe system with an optical, DC and RF positioner, an optical light source (OLS) like a tunable laser source, a DC meter such as a SMU, and an Ampere meter. The probe system can be configured with a thermal chuck or set up with an external environmental temperature chamber. The exact probe system configuration and test setup are specific to the device-under-test (DUT) architecture.
Test instrumentation and test routines (recipes) are controlled by the software, with measurement data stored to enable device-to-device cross-correlation and performance analysis.
A wafer loader enables fully automated wafer loading and unloading as part of the software-controlled test and handling process.
An optional SECS/GEM software interface enables integration with factory-level automation and manufacturing execution systems (MES) for streamlined production workflows and data management
Figure 39 - Automatic Probe System with MHU
.
Optical Parameters (input side)
- ■ 100% test of coupling alignment go/no-go at nominal input power.
- ■ Return loss coarse check.
- ■ Full wavelength responsivity sweep and PDR sampled rather than tested per die.
Electrical Parameters (output side)
- ■ 100% (or high-coverage) test of critical-to-quality (CTQ) parameters only: dark current go/no-go (singulation integrity screen), responsivity at nominal condition, TIA gain go/no-go, sensitivity go/no-go at spec data rate.
- ■ Reduced condition testing - single bias/temp/power point rather than full sweep, unless SPC flags drift.
- ■ Guardbanded limits (tightened from Validation limits to account for singulation/alignment/test uncertainty).
- ■ In-line SPC charting (Xbar-R or lot-trend) on top CTQ optical and electrical parameters, including singulation/die-attach process Cpk tracking.
- ■ Correlation checks against Validation dataset and Insertion #2 correlation model on a periodic basis (e.g., first-lot sample).
- ■ Full bandwidth sweep, TDECQ, and overload characterization sampled rather than tested per die.
Environmental Parameters
- ■ Sample-based temperature verification (e.g., hot/cold spot-check on subset of die per lot) rather than full sweep.
- ■ No full corner matrix - spot checks only, escalated to full Validation-style test if SPC signals an excursion.
- ■ Lot uniformity spot-checked against Validation baseline.
Pass/Fail Criteria: Formal limits from Validation, with guardbands; SPC out-of-control (including singulation/die-attach process Cpk drift) triggers hold-and-investigate.
Duration: Test time actively optimized (target: seconds-to-low-minutes per die); fiber-array auto-align speed and single-condition testing are the primary throughput levers.
5.2.4 High Volume Manufacturing (HVM)
Objective: Maximize die-test throughput and yield visibility at the final pre-package gate, with minimal necessary optical/electrical test coverage, relying on statistical monitoring rather than exhaustive per-die environmental or full-condition testing.
Sample Size: 100% die tested for a minimal CTQ optical/electrical parameter set; environmental and full-condition testing reduced to periodic qualification-style monitors only (e.g., quarterly or per-process-change), not per-lot.
Test Station: Semi- or fully automatic probe system with an optical, DC and RF positioner, an optical light source (OLS) like a tunable laser source, a DC meter such as a SMU, and an Ampere meter. The probe system can be configured with a thermal chuck or set up with an external environmental temperature chamber. The exact probe system configuration and test setup are specific to the device-under-test (DUT) architecture.
Test instrumentation and test routines (recipes) are controlled by the software, with measurement data stored to enable device-to-device cross-correlation and performance analysis.
A wafer loader enables fully automated wafer loading and unloading as part of the software-controlled test and handling process.
An optional SECS/GEM software interface enables integration with factory-level automation and manufacturing execution systems (MES) for streamlined production workflows and data management.
Figure 40 - Automatic Probe System with MHU and ATE Docking System
Optical Parameters (input side)
- ■ 100% test, minimized set: coupling/alignment pass at nominal power, coarse return-loss check.
- ■ Single nominal test condition (room temp, nominal wavelength, nominal power) unless design margin requires a secondary condition.
Electrical Parameters (output side)
- ■ 100% test, minimized parameter set: dark current go/no-go (singulation integrity screen), responsivity pass/fail, TIA gain go/no-go, sensitivity pass/fail at single data rate.
- ■ Fast binning logic (pass/fail/marginal) with automatic outlier flagging, tagged to die for downstream packaging sort.
- ■ Real-time SPC and lot-trend monitoring on all CTQ parameters with automatic lot-hold triggers.
- ■ Correlation audit sample pulled periodically (e.g., weekly) and cross-checked against LVM/Validation baseline and Insertion #2 model.
- ■ Full bandwidth sweep, TDECQ, overload, and noise characterization not performed in-line; covered by periodic sample only.
Environmental Parameters
- ■ No per-die environmental test in the production flow.
- ■ Periodic qualification monitor (e.g., quarterly reliability sample): temperature sweep, dark current, responsivity, bandwidth, per original validation-stage protocol, on a small pulled sample of die.
- ■ Any process, material, singulation, or die-attach change triggers a requalification subset before returning to steady-state HVM flow.
- ■ Field-return/failure-analysis feedback loop (post-package/post-deployment) monitored for optical, electrical, or environmental-related escapes traced back to die-level or singulation/die-attach signatures.
Pass/Fail Criteria: Production spec limits, tight guardbands, automated disposition; any drift beyond SPC or lot-trend control limits halts the lot pending investigation.
Duration: Seconds per die target; environmental and full-condition sampling scheduled outside the main production cadence to avoid throughput impact.
5.2.5 Summary Comparison
Table 11 - Summary Comparison
| Aspect | R&D | Validation | LVM | HVM |
|---|---|---|---|---|
| Sample size | 5-15 dies | 30-90 dies | 100% CTQ / sample env | 100% CTQ / periodic env |
| Optical coverage | Full spectral + bias sweep, singulation/ die-attach delta | Full spec list, corners, delta limits | CTQ subset, guard banded | Minimal CTQ, single condition |
| Electrical coverage | Full I-V, S11 sweep, Ins#2 delta | Full spec list, corners, delta limits | CTQ subset, guard banded | Minimal CTQ, single condition |
| Environmental coverage | Full range, exploratory | Full spec limits, gated | Sample-based, SPC-triggered | Periodic qual only |
| Correlation focus | Insertion #2 (wafer) vs #3 (die) delta edge-leakage screen | Formalized correlation model | Periodic model check | Periodic model check |
| Alignment method | Manual/ semi-auto | Auto-align (qualified) | Auto-align (locked) | Auto-align (high-speed) |
| Probe access | Optical, DC, RF Manual/semi-auto | Optical, DC, RF auto-align (qualified) | Optical, DC, RF auto-align (qualified) | Optical, DC, RF auto-align (high-speed) |
| Test time priority | Low (data-rich) | Medium | High | Highest |
| Pass/fail basis | None (data gen.) | Formal limits + delta limits | Guard banded limits | Tight guard bands, auto-bin |
| Trend/map use | Full traceability to wafer origin | Uniformity validation | Spot-check vs. baseline | Trend monitoring only |
Note: Optical and electrical parameter names and limits should be adapted to the specific O-E E-PIC architecture (standalone photodiode vs. integrated PD+TIA receiver, avalanche photodiode (APD) vs. PIN, differential vs. single-ended output), wavelength band (O-band, C-band, or other), modulation format (NRZ, PAM4), and optical I/O interface (grating coupler or die-level edge coupling) in use. This procedure represents a die-singulation flow (no intermediate bar-level facet test), consistent with vertical/surface-coupled optical access; if the actual process instead dices wafers into bars for facet coating before final singulation, the corresponding bar-level Insertion #3 procedure applies instead and this die-level Insertion #3 would represent a later insertion number in a single unified sequence. Photodiode dark current is specifically called out as a singulation-integrity screen, since dicing can introduce new edge-leakage paths at the photodiode junction even without an intervening trim/coating step - this is a distinct risk from the burn-in-related dark-current drift emphasized at bar-level insertions. Sensitivity and overload testing require a calibrated, traceable optical power reference at the die-test fixture plane - this calibration chain should be maintained consistently with the wafer-level Insertion #2 setup to keep delta measurements meaningful. Die-level traceability (linking each die's wafer-level and die-level records across insertions) is required to support delta-tracking and should be established as an infrastructure requirement starting at R&D. As with earlier insertions, this insertion still precedes full packaging, so humidity and long-duration thermal cycling coverage remains limited compared to a packaged-device insertion - these should be formally re-verified post-package in the overall test flow.
5.3
Electro-Photonic Integrated Circuit (E-PIC) Electrical-to-Optical (E-O)
Optical, Electrical & Environmental Parameter Coverage Across Program Maturity Stages
Scope: These four procedures define the optical, electrical, and environmental test methodology for the Electrical-to-Optical Electro-optic Photonic Integrated Circuit (E-O E-PIC) at ATE Insertion #3, performed at die level - i.e., on individually singulated die, following wafer-level Insertion #1 and Insertion #2. The device under test takes an electrical input (data/drive signal plus DC bias) and produces an optical output (transmitter-side PIC: laser + modulator, or directly-modulated laser). Die-level testing (rather than bar-level) is applicable here because optical access does not require an exposed cleaved facet - consistent with a grating-coupler or other vertical/surface-coupled optical interface - so the flow moves directly from wafer dicing to individual die without an intermediate bar-test step. Insertion #3 occurs after singulation and, where applicable, after die-attach to a carrier or submount, serving as the final pre-package gate. Insertion #3 places emphasis on (a) correlation and delta-tracking against wafer-level Insertion #2 data for the same die, (b) verification that singulation (dicing saw/laser) and any die-attach step did not degrade laser/modulator or coupling performance (mechanical stress, thermal path, adhesive/solder-induced strain), and (c) individual die handling and optical alignment repeatability now that the die is no longer wafer-fixtured. DC/ RF electrical probe access (input side, via probe needles or carrier bond pads) and optical fiber-array probe access (output side - grating coupler or die-level edge-coupling fixture) are used, consistent with wafer-level Insertion #1/#2 conventions.
5.3.1 R&D-Level
Objective: Fully characterize post-singulation (and post-die-attach, if applicable) electrical-to-optical conversion performance, quantify the effect of singulation/ die-attach relative to wafer-level Insertion #2 baseline, and establish Insertion #3-specific spec limits and correlation models for validation.
Sample Size: 5-15 die, matched to the same die measured at wafer-level Insertion #2 (paired dataset), spanning multiple wafer locations.
Test Station: Benchtop-style (manual) probe system with an optical, DC and RF positioner, an optical power meter (OPM), optical spectrum analyzer (OSA). With an optional wavelength meter (λ meter). A DC source such as a SMU, and an RF generator. The probe system can be configured with a thermal chuck or set up with an external environmental temperature chamber. The exact probe system configuration and test setup are specific to the device-under-test (DUT) architecture.
Figure 41 - Manual Probe System
Electrical Parameters (input side)
- ■ Full I-V sweep on all bias and drive pins (laser bias, modulator driver supply, TEC if on-die) - compared die-for-die against wafer-level Insertion #2 result (delta-Idd, delta-threshold).
- ■ Supply current vs. voltage/temperature (Idd vs. Vdd, Idd vs. T).
- ■ Input leakage current on all control/bias pins.
- ■ Drive signal input impedance / return loss (S11) at the RF input port.
- ■ Input sensitivity - minimum drive swing to achieve spec'd optical modulation, delta-tracked against wafer-level Insertion #2.
- ■ Die-level pass/fail delta analysis on electrical parameters: identify die that regressed vs. improved between wafer-level Insertion #2 and die-level Insertion #3 (singulation/die-attach-induced degradation vs. no change expected).
Optical Parameters (output side)
- ■ Optical output power vs. bias current (L-I curve) and vs. temperature - delta-power vs. wafer-level Insertion #2 to isolate the singulation/die-attach contribution.
- ■ Threshold current and slope efficiency (if on-die laser present) - mechanical-stress-induced shift analysis (compare pre-singulation wafer data vs. post-singulation die data to flag dicing-induced stress effects on the laser cavity).
- ■ Grating or edge coupler alignment tolerance and coupling loss - re-verified post-singulation since dicing debris, edge chipping, or die-attach tilt can shift optimal coupling angle/position.
Optical Parameters (output side) con't
- ■ Center wavelength verification, checked for any singulation- or die-attach-induced spectral shift.
- ■ Spectral width, side-mode suppression ratio (SMSR).
- ■ Extinction ratio vs. drive voltage/bias - delta-tracked against wafer-level Insertion #2.
- ■ Optical modulation amplitude (OMA) and average power at spec'd drive condition.
- ■ RIN across bias range.
- ■ Eye diagram / PAM4 linearity, TDECQ at representative data rate.
- ■ Chirp (if applicable to modulator type).
- ■ Return loss / back-reflection at optical output port.
- ■ Visual/optical inspection correlation (edge chipping, dicing debris, die-attach voiding/tilt) against measured optical performance.
Environmental Parameters
- ■ Die/carrier stage temperature sweep: -40°C to +85°C (or per design target), in 10-20°C steps.
- ■ Electrical and optical parameter drift vs. temperature (threshold current shift, wavelength drift, extinction ratio degradation), compared against wafer-level Insertion #2 temperature-dependence data to detect any singulation- or die-attach-induced shift in temperature sensitivity (e.g., new CTE mismatch or thermal path change from die-attach material).
- ■ Repeat measurement (die re-load/re-pick) to characterize electrical and optical alignment repeatability as a function of temperature and individual die handling.
Data Handling: All raw I-V, spectral, and eye/modulation traces retained and paired to the corresponding wafer-level Insertion #2 record per die; delta/drift statistics built per parameter, correlated to original wafer location. No formal pass/ fail gate - data feeds spec-limit derivation, singulation/die-attach process tuning, and correlation-model development for validation.
Duration: Extended (tens of minutes to hours per die acceptable); test time is not optimized, full bias and wavelength sweeps used throughout.
5.3.2 Validation-Level
Objective: Confirm the E-PIC meets Insertion #3 (post-singulation/post-die-attach) datasheet/spec limits at die level, validate the die-level correlation model between wafer-level Insertion #2 and die-level Insertion #3, confirm singulation and die-attach process capability, and validate test program coverage prior to LVM release..
Sample Size: 30-90 die (statistically meaningful per parameter; supports Cpk estimation), spanning ≥3 lots, paired to their wafer-level Insertion #2 records.
Test Station: Benchtop-style (manual) probe system with an optical, DC and RF positioner, an optical power meter (OPM), optical spectrum analyzer (OSA). With an optional wavelength meter (λ meter). A DC source such as a SMU, and an RF generator. The probe system can be configured with a thermal chuck or set up with an external environmental temperature chamber. The exact probe system configuration and test setup are specific to the device-under-test (DUT) architecture.
Test instrumentation and test routines (recipes) are controlled by the software, with measurement data stored to enable device-to-device cross-correlation and performance analysis.
Semi-Automatic Probe System
Figure 42 - Semi-Automatic Probe System
Electrical Parameters (input side)
- ■ DC parametric: Idd, Ileak, bias voltages at nominal/min/max supply corners - with delta limits vs. wafer-level Insertion #2.
- ■ RF input return loss (S11) at spec frequency/data rate.
- ■ Input sensitivity verification against spec limit.
Optical Parameters (output side)
- ■ L-I curve verification (threshold, slope efficiency) against spec limits, with delta-vs-Insertion-#2 limit - specifically screening for singulation-induced laser cavity stress.
- ■ Coupler alignment tolerance verification (auto-align convergence and repeatability), specifically screening for singulation-related coupling degradation.
- ■ Center wavelength verification.
- ■ SMSR at nominal bias/temperature.
- ■ Extinction ratio, OMA, and average power at spec drive condition.
- ■ TDECQ / eye mask compliance at spec data rate (single condition).
- ■ Corner testing: Temp min/typ/max × Bias min/typ/max.
- ■ Insertion #2 (wafer)-to-Insertion #3 (die) correlation study formalized (regression/limit-setting for using earlier insertion data as a predictive screen, if applicable).
- ■ Die-to-packaged-module correlation study (subset of die tracked through packaging).
- ■ Gauge R&R on critical electrical and optical parameters (repeat die-load/touchdown study).
Environmental Parameters
- ■ Temperature verification at spec limits (e.g., -40°C, +25°C, +85°C) with pass/fail gating on electrical and optical parameters.
- ■ Die-to-die and lot-to-lot uniformity analysis (trending of threshold current, wavelength, extinction ratio, output power).
- ■ Preliminary correlation to post-package environmental stress (thermal cycling, humidity), feeding back into die-level pass/fail limits.
Pass/Fail Criteria: Formal spec limits applied, including delta-vs-Insertion-#2 limits where relevant; failures root-caused and dispositioned (design vs. process vs. singulation vs. die-attach vs. test escape vs. alignment/fixture artifact).
Duration: Tens of minutes to an hour per die; test time optimization begins (reduced bias/wavelength points, faster fiber-array auto-align) but coverage remains primary.
5.3.3 Low Volume Manufacturing (LVM)
Objective: Execute a production-intent, throughput-aware die-level electrical/optical test flow at Insertion #3 with statistical process control (SPC) in place, while maintaining tighter environmental/corner sampling than HVM, and confirming singulation/die-attach process stability lot-to-lot.
Sample Size: 100% die tested for core electrical and optical CTQ parameters; environmental/full-corner testing on a defined sample plan (e.g., N die per lot).
Test Station: Benchtop-style (manual) probe system with an optical, DC and RF positioner, an optical power meter (OPM), optical spectrum analyzer (OSA). A DC source such as a SMU, and an RF generator. The probe system can be configured with a thermal chuck or set up with an external environmental temperature chamber. The exact probe system configuration and test setup are specific to the device-under-test (DUT) architecture.
Test instrumentation and test routines (recipes) are controlled by the software, with measurement data stored to enable device-to-device cross-correlation and performance analysis.
A wafer loader enables fully automated wafer loading and unloading as part of the software-controlled test and handling process.
An optional SECS/GEM software interface enables integration with factory-level automation and manufacturing execution systems (MES) for streamlined production workflows and data management.
Automatic Probe System with MHU
Figure 43 - Automatic Probe System with MHU
Electrical Parameters (input side)
- ■ 100% test of Idd, Ileak at nominal condition.
- ■ RF input return loss go/no-go at spec frequency.
Optical Parameters (output side)
- ■ 100% (or high-coverage) test of critical-to-quality (CTQ) parameters only: output power at nominal bias, center wavelength go/no-go, extinction ratio go/no-go.
- ■ Reduced condition testing - single bias/temp point rather than full sweep, unless SPC flags drift.
- ■ Guardbanded limits (tightened from Validation limits to account for singulation/alignment/test uncertainty).
- ■ In-line SPC charting (Xbar-R or lot-trend) on top CTQ electrical and optical parameters, including singulation/die-attach process Cpk tracking.
- ■ Correlation checks against Validation dataset and Insertion #2 correlation model on a periodic basis (e.g., first-lot sample).
- ■ SMSR, TDECQ, and full L-I curve sampled rather than tested per die.
Environmental Parameters
- ■ Sample-based temperature verification (e.g., hot/cold spot-check on subset of die per lot) rather than full sweep.
- ■ No full corner matrix - spot checks only, escalated to full Validation-style test if SPC signals an excursion.
- ■ Lot uniformity spot-checked against validation baseline.
Pass/Fail Criteria: Formal limits from Validation, with guardbands; SPC out-of-control (including singulation/die-attach process Cpk drift) triggers hold-and-investigate.
Duration: Test time actively optimized (target: seconds-to-low-minutes per die); fiber-array auto-align speed and single-condition testing are the primary throughput levers.
5.3.4 High Volume Manufacturing (HVM)
Objective: Maximize die-test throughput and yield visibility at the final pre-package gate, with minimal necessary electrical/optical test coverage, relying on statistical monitoring rather than exhaustive per-die environmental or full-condition testing.
Sample Size: 100% die tested for a minimal CTQ electrical/optical parameter set; environmental and full-condition testing reduced to periodic qualification-style monitors only (e.g., quarterly or per-process-change), not per-lot.
Test Station: Benchtop-style (manual) probe system with an optical, DC and RF positioner, an optical power meter (OPM), a DC source such as a SMU, and an RF generator. The probe system can be configured with a thermal chuck or set up with an external environmental temperature chamber. The exact probe system configuration and test setup are specific to the device-under-test (DUT) architecture.
Test instrumentation and test routines (recipes) are controlled by the software, with measurement data stored to enable device-to-device cross-correlation and performance analysis.
A wafer loader enables fully automated wafer loading and unloading as part of the software-controlled test and handling process.
An optional SECS/GEM software interface enables integration with factorylevel automation and manufacturing execution systems (MES) for streamlined production workflows and data management.
Figure 44 - Automatic Probe System with MHU and ATE Docking Station
Electrical Parameters (input side)
- ■ 100% test, minimized set: Idd go/no-go, RF input return loss coarse check.
- ■ Single nominal test condition (room temp, nominal bias) unless design margin requires a secondary condition.
Optical Parameters (output side)
- ■ 100% test, minimized parameter set: output power (single wavelength/bias, go/no-go), center wavelength go/no-go, extinction ratio pass/fail.
- ■ Fast binning logic (pass/fail/marginal) with automatic outlier flagging, tagged to die for downstream packaging sort.
- ■ Real-time SPC and lot-trend monitoring on all CTQ parameters with automatic lot-hold triggers.
- ■ Correlation audit sample pulled periodically (e.g., weekly) and cross-checked against LVM/Validation baseline and Insertion #2 model.
- ■ Full L-I curve, SMSR, and TDECQ characterization not performed in-line; covered by periodic sample only.
Environmental Parameters
- ■ No per-die environmental test in the production flow.
- ■ Periodic qualification monitor (e.g., quarterly reliability sample): temperature sweep, L-I curve, spectral characterization, per original Validation-stage protocol, on a small pulled sample of die.
- ■ Any process, material, singulation, or die-attach change triggers a requalification subset before returning to steady-state HVM flow.
- ■ Field-return/failure-analysis feedback loop (post-package/post-deployment) monitored for electrical, optical, or environmental-related escapes traced back to die-level or singulation/ die-attach signatures.
Pass/Fail Criteria: Production spec limits, tight guard bands, automated disposition; any drift beyond SPC or lot-trend control limits halts the lot pending investigation.
Duration: Seconds per die target; environmental and full-condition sampling scheduled outside the main production cadence to avoid throughput impact.
5.3.5 Summary Comparison
Table 12 - Summary Comparison
| Aspect | R&D | Validation | LVM | HVM |
|---|---|---|---|---|
| Sample size | 5-15 dies | 30-90 dies | 100% CTQ / sample env | 100% CTQ / periodic env |
| Optical coverage | Full spectral + bias sweep, singulation/ die-attach delta | Full spec list, corners, delta limits | CTQ subset, guard banded | Minimal CTQ, single condition |
| Electrical coverage | Full I-V, S11 sweep, Ins#2 delta | Full spec list, corners, delta limits | CTQ subset, guard banded | Minimal CTQ, single condition |
| Environmental coverage | Full range, exploratory | Full spec limits, gated | Sample-based, SPC-triggered | Periodic qual only |
| Correlation focus | Insertion #2 (wafer) vs #3 (die) delta edge-leakage screen | Formalized correlation model | Periodic model check | Periodic model check |
| Alignment method | Manual/semi-auto | Auto-align (qualified) | Auto-align (locked) | Auto-align (high-speed) |
| Probe access | Optical, DC, RF Manual/semi-auto | Optical, DC, RF auto-align (qualified) | Optical, DC, RF auto-align (qualified) | Optical, DC, RF auto-align (high-speed) |
| Test time priority | Low (data-rich) | Medium | High | Highest |
| Pass/fail basis | None (data gen.) | Formal limits + delta limits | Guard banded limits | Tight guard bands, au- to-bin |
| Trend/map use | Full traceability to wafer origin | Uniformity validation | Spot-check vs. baseline | Trend monitoring only |
Note: Electrical and optical parameter names and limits should be adapted to the specific E-O E-PIC architecture (directly-modulated laser, EML, integrated laser + external modulator, etc.), wavelength band (O-band, C-band, or other), modulation format (NRZ, PAM4), and optical I/O interface (grating coupler or die-level edge coupling) in use. This procedure represents a die-singulation flow (no intermediate bar-level facet test), consistent with vertical/surface-coupled optical access; if the actual process instead dices wafers into bars for facet coating before final singulation, the corresponding bar-level Insertion #3 procedure applies instead and this die-level Insertion #3 would represent a later insertion number in a single unified sequence. Laser threshold current and cavity behavior are specifically called out for mechanical-stress screening post-singulation, since dicing-induced stress can shift laser performance even without an intervening trim/coating step. The specific intervening step between wafer-level Insertion #2 and die-level Insertion #3 (singulation alone, or singulation plus die-attach to a carrier/submount) should be explicitly identified in the program's process flow documentation, since it determines which delta parameters matter most. Die-level traceability (linking each die's wafer-level and die-level records across insertions) is required to support delta-tracking and should be established as an infrastructure requirement starting at R&D. As with earlier insertions, this insertion still precedes full packaging, so humidity and long-duration thermal cycling coverage remains limited compared to a packaged-device insertion - these should be formally re-verified post-package in the overall test flow.
6. ATE Insertion #4 Testing on Packaged Level
Electro-Photonic Integrated Circuit (E-PIC)
Optical, Electrical & Environmental Parameter Coverage Across Program Maturity Stages
Scope: These three procedures define the optical, electrical, and environmental test methodology for the Electro-optic Photonic Integrated Circuit (E-PIC) at ATE Insertion #4, performed at packaged level - i.e., on the fully packaged transmitter module (fiber-pigtailed or connectorized optical output, hermetic or non-hermetic package, electrical leads/pins/connector terminated), following die/bar-level Insertion #3. Insertion #4 is the final test insertion before shipment and is the first insertion at which full environmental stress coverage (extended thermal cycling, mechanical shock/vibration) is both meaningful and practical, since the device is now protected by its package and permanently fiber-attached. Insertion #4 places emphasis on (a) correlation and delta-tracking against die/bar-level Insertion #3 data to isolate any packaging-induced shift (fiber-attach loss, package-induced stress, solder/epoxy outgassing, driver-circuit loading changes from package parasitics), (b) full qualification-representative environmental stress now that the package is present, and (c) final connectorized/pigtailed optical and electrical performance as the customer will actually receive it. Electrical access is via the package's terminated leads, pins, or connector (input side); optical access is via the package's permanent fiber pigtail or optical connector (output side).
Multi-fiber alignment and fixture-loading routines should verify that mechanical loading, strain relief, and optical-interface positioning remain within qualified limits before high-speed electrical, RF, and optical parametric measurements are executed. Where appropriate, verification may include active force monitoring, displacement monitoring, strain-relief position verification, or equivalent methods capable of identifying mechanically induced measurement error.
For multi-channel devices, package-level testing should maintain channel-level traceability and monitor channel-to-channel uniformity and worst-channel performance to prevent degradation of an individual optical channel from being masked by acceptable module-average performance.
6.1.1 Validation-Level
| Objective: | Confirm the packaged module meets datasheet/spec limits, formally qualify environmental/reliability performance per industry standards, validate the cor- relation model between die/bar-level Insertion #3 and packaged Insertion #4, and validate test program coverage prior to LVM release. |
|---|---|
| Validation should evaluate package-level critical-to-quality (CTQ) parameters and establish process capability, measurement-system capability, and correla- tion to upstream insertion and assembly-process data. Use these results to determine which CTQ parameters require 100% production screening in LVM/ HVM and which may transition to statistically justified sampling, real-time SPC, ongoing reliability testing (ORT), or process qualification. The decision should consider process capability, measurement uncertainty, defect-detection risk, failure criticality, and demonstrated correlation to other production controls. | |
| Sample Size: | 30-90 modules (statistically meaningful per parameter; supports Cpk estima- tion), spanning ≥3 build lots, paired to their Insertion #3 records where trace- able; reliability qualification sample sizes per applicable standard (e.g., Telcor- dia GR-468 sample plan) |
| Validation samples should intentionally include representative assembly-pro- cess variation, including different assembly lots, fiber/FAU attach operations, adhesive/solder cure lots, die-attach conditions, and applicable assembly equipment/fixture populations. The purpose is to separate intrinsic device vari- ation from packaging-process variation. | |
| Test Station: | Production-representative packaged-module test set (connectorized/pigtail optical interface, terminated electrical interface, automated), full environmental chamber suite (temperature, vibration/shock), test program under formal revision control. |
| Test instrumentation and test routines (recipes) are controlled by the software, with measurement data stored to enable device-to-device cross-correlation and performance analysis. | |
| Calibration/reference planes shall be clearly defined at the package electrical and optical interfaces. Fixture, connector, cable, fiber, switch, and other test- path contributions shall be characterized or removed where necessary so that package-induced degradation can be separated from test-system variation. | |
| Qualified golden/reference devices or reference artifacts should be included to monitor station drift, optical power calibration, wavelength accuracy, connector repeatability, electrical/RF path stability, and fixture repeatability. |
Electrical Parameters
- ■ DC parametric: Idd, Ileak, bias voltages at nominal/min/max supply corners - with delta limits vs. Insertion #3
- ■ RF input return loss (S11) at spec frequency/data rate, at the package connector/pin - verifying package parasitics are within design margin
- ■ Input sensitivity verification against spec limit
- ■ Functional verification of applicable control, bias, monitoring, and management interfaces.
- ■ Package-induced electrical delta analysis against Insertion #3 where correlation is available.
Optical Parameters
- ■ L-I curve verification (threshold, slope efficiency) against spec limits, with delta-vs-Insertion-#3 limit
- ■ Optical output power at nominal operating condition.
- ■ Fiber-attach loss verification against spec
- ■ Center wavelength and SMSR at nominal bias/temperature
- ■ Extinction ratio, OMA, and average power at spec drive condition
- ■ TDECQ / eye mask compliance at spec data rate (single condition), including package-bandwidth-limited eye closure
- ■ Return loss / connector reflectance at spec-defined limits
- ■ Corner testing: Temp min/typ/max × Bias min/typ/max
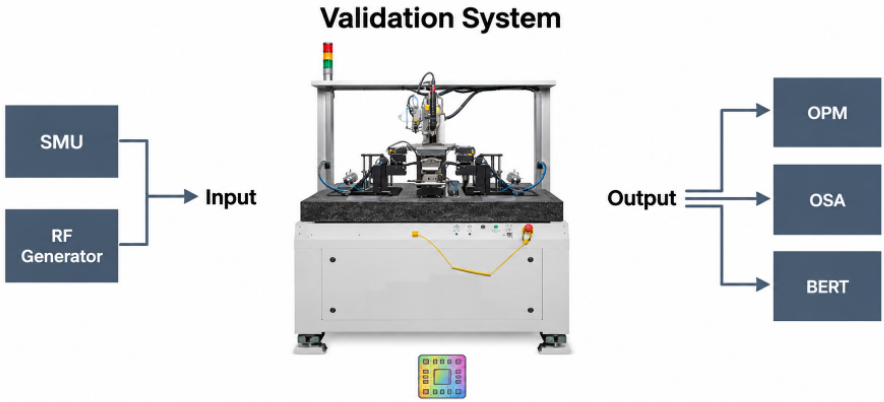
Device Under Test
Figure 45 - Validation System
- ■ Insertion #3-to-Insertion #4 correlation study formalized (regression/limit-setting for using earlier insertion data as a predictive screen)
- ■ Gauge R&R on critical electrical and optical parameters (repeat-measurement study)
- ■ Applicable wavelength-dependent performance at nominal and band-edge conditions.
- ■ Where heaters, resonators, lasers, SOAs, or other thermally sensitive components are integrated, package-level testing should characterize thermal tuning efficiency, wavelength-versus-temperature behavior, self-heating, and thermal crosstalk as applicable. Packaging can materially change these parameters relative to wafer/die-level measurements.
Environmental Parameters
- ■ Full temperature operating range verification at spec limits with pass/fail gating
- ■ Formal reliability qualification test sequence: thermal cycling, damp heat, mechanical shock/vibration, HTOL - per applicable standard (Telcordia GR-468, MIL-STD-883, or program-specific spec), with defined sample sizes and acceptance criteria, tracking laser threshold shift as a key HTOL metric
- ■ Fiber-attach, wire-bond, and connector interface robustness verification post-environmental stress
- ■ Package hermeticity verification (if hermetic), pre- and post-environmental stress
- ■ Module-to-module and lot-to-lot uniformity analysis
- ■ Post-Stress Recovery: Selected devices should be remeasured at the nominal reference condition following environmental exposure to distinguish reversible temperature effects from permanent package-induced shifts.
| Pass/Fail Criteria: | Formal spec limits and reliability qualification acceptance criteria applied; failures root-caused and dispositioned (design vs. process vs. packaging vs. test escape). |
|---|---|
| Duration: | Days to weeks per lot for full reliability qualification sequence (thermal cy- cling and HTOL are inherently long-duration); functional/optical/electrical test time optimization begins in parallel. |
| Data Handling: | All applicable raw and processed electrical, optical, electro-optic, and envi- ronmental data shall be retained and linked to device/module serial number, source wafer/die where available, Insertion #3 record, assembly/build lot, test station, fixture, test-program revision, calibration state, and applicable assembly-process history. |
6.1.2 Low Volume Manufacturing (LVM)
Objective: Execute a production-intent, throughput-aware packaged-module test flow with statistical process control (SPC) in place, while maintaining a defined environmental/reliability sampling plan (rather than full qualification) appropriate for LVM.
LVM shall confirm that package assembly, optical attach, electrical interconnect, and test processes remain stable lot-to-lot while establishing the final production test content and guardbands required for HVM.
Sample Size: 100% modules tested for core electrical and optical CTQ parameters; environmental/reliability testing on a defined ongoing-reliability sample plan (e.g., N units per lot or per month, per applicable standard's ORT requirements)
Sampling should be representative not only of production lots but also of relevant assembly equipment, assembly cells, attach tools, fixtures, material lots, and other process populations where these may influence optical alignment or package performance.
Test Station: Production packaged-module test set (connectorized/pigtail optical interface, terminated electrical interface), locked test program revision, calibrated to production cadence; environmental chamber(s) dedicated to ORT sampling.
Test instrumentation and test routines (recipes) should be software-controlled and revision-managed, with measurement data automatically stored to enable device-to-device comparison, process-performance analysis, traceability, and statistical process control (SPC).
Figure 46 - Semi-Automatic Probe System
Electrical Parameters (input side)
- ■ 100% test of Idd, Ileak at nominal condition
- ■ RF input return loss go/no-go at spec frequency
- ■ Functional interface test.
Optical Parameters (output side)
- ■ 100% (or high-coverage) test of critical-to-quality (CTQ) parameters only: output power at nominal bias, center wavelength go/no-go, extinction ratio go/no-go
- ■ Reduced condition testing - single bias/temp point rather than full sweep, unless SPC flags drift
- ■ Guardbanded limits (tightened from Validation limits to account for fiber-attach/connector/test uncertainty)
- ■ In-line SPC charting (Xbar-R) on top CTQ electrical and optical parameters
- ■ Correlation checks against Validation dataset and Insertion #3 correlation model on a periodic basis
- ■ SMSR, TDECQ, and full L-I curve sampled rather than tested per unit.
- ■ For multi-channel devices, production analysis should monitor worst-channel performance and channel-to-channel spread in addition to module-average performance.
- ■ Reconnection, fixture reload, and retest shall follow predefined limits. First-pass results shall be retained separately from final-pass results so that interface instability or marginal devices are not hidden by repeated test attempts.
Environmental Parameters
- ■ Ongoing reliability test (ORT) sample pulled per lot or per defined interval: thermal cycling, damp heat, per Validation-established qualification protocol, on a reduced sample size relative to full qualification
- ■ Room-temperature functional verification 100%; temperature corner spot-check on a sample basis rather than full sweep
- ■ Fiber-attach/wire-bond/connector robustness spot-checked on ORT sample
- ■ Any ORT excursion triggers hold-and-investigate and may escalate to full Validation-style requalification
- ■ Traceability: Each production test record should retain module serial number, source die/wafer identification where available, package/assembly lot, relevant optical-attach/assembly process identification, test station, fixture/interface identification, test-program revision, calibration status, CTQ results, bin, and retest history.
Pass/Fail Criteria: Formal limits from Validation, with guardbands; SPC out-of-control or ORT failure triggers hold-and-investigate.
Duration: Test time actively optimized for the 100% functional test (target: secondsto-low-minutes per module); ORT sample testing runs on its own extended schedule outside the main production cadence.
6.1.3 High Volume Manufacturing (HVM)
Objective: Maximize module-test throughput and yield visibility at final shipment gate, with minimal necessary electrical/optical test coverage, relying on statistical monitoring and periodic ongoing reliability testing rather than exhaustive per-unit environmental testing.
Sample Size: 100% modules tested for a minimal CTQ electrical/optical parameter set; environmental/reliability testing reduced to a periodic ORT sample per applicable standard (e.g., quarterly or per-lot-family), not per-unit.
Test Station: Fully automated packaged-module test system (connectorized/pigtail optical interface, terminated electrical interface, automated handler), high-speed test sequencing, minimal manual intervention, real-time yield/SPC dashboard integration.
HVM fixture and optical-interface design should support controlled and repeatable module loading without introducing connector/fiber stress that materially affects the measurement. Fixture lifetime and interface mating-cycle effects should be monitored where relevant.
Automatic Probe System
Figure 47 - Automatic Probe System
Electrical Parameters (input side)
- ■ 100% test, minimized set: Idd go/no-go, RF input return loss coarse check
- ■ Single nominal test condition (room temp, nominal bias) unless design margin requires a secondary condition.
- ■ Functional interface verification.
- ■ Automatic pass/fail/marginal binning.
Optical Parameters (output side)
- ■ 100% test, minimized parameter set: output power (single wavelength/bias, go/no-go), center wavelength go/no-go, extinction ratio pass/fail
- ■ Fast binning logic (pass/fail/marginal) with automatic outlier flagging
- ■ Extinction-ratio go/no-go for modulated outputs.
- ■ Real-time SPC and trend monitoring on all CTQ parameters with automatic lot-hold triggers
- ■ Correlation audit sample pulled periodically (e.g., weekly) and cross-checked against LVM/Validation baseline and Insertion #3 model
- ■ Full L-I curve, SMSR, and TDECQ characterization not performed in-line; covered by periodic ORT sample only
Environmental Parameters
- ■ No per-unit environmental test in the production flow (100% units ship on functional/optical test alone)
- ■ Periodic ORT sample (e.g., quarterly, per applicable standard's minimum sample/interval): full thermal cycling, damp heat, mechanical shock/vibration, HTOL, per original Validation-stage qualification protocol.
- ■ Applicable thermal cycling, damp heat, HTOL/burn-in, and mechanical stress audits.
- ■ Any process, material, or design change triggers a requalification subset before returning to steadystate HVM flow
- ■ Field-return/failure-analysis feedback loop monitored for electrical, optical, or environmental-related field escapes, feeding back into ORT plan adequacy review.
- ■ Traceability: Production records shall retain, as applicable; Module serial number, Source wafer/die identification, Insertion #3 reference, Package/assembly lot, Module serial number and etc.
Pass/Fail Criteria: Production spec limits, tight guard bands, automated disposition; any drift beyond SPC control limits or an ORT failure halts the lot/lot-family pending investigation.
Duration: Seconds per module target for 100% functional test; ORT sampling scheduled entirely outside the main production cadence to avoid throughput impact.
6.1.5 Summary Comparison
Table 13 - Summary Comparison
| Aspect | Validation | LVM | HVM |
|---|---|---|---|
| Sample size | 30-90 modules | 100% CTQ / ORT sample | 100% CTQ / periodic ORT |
| Electrical coverage | Full spec list, corners, delta limits | CTQ subset, guard banded | Minimal CTQ, single condition |
| Optical coverage | Full spec list, corners, delta limits | CTQ subset, guard banded | Minimal CTQ, single condition |
| Environmental coverage | Formal qualification (standard-based) | ORT sample plan | Periodic ORT only |
| Environmental scope now possible | Full - formal acceptance criteria | ORT sample vs. full | ORT sample vs. full |
| Interface | Connector/pigtail + pins, automated | Connector/pigtail + pins, automated | Connector/pigtail + pins, high-speed automated |
| Test time priority | Medium | High | Highest |
| Pass/fail basis | Formal limits + qual acceptance criteria | Guard banded limits | Tight guard bands, auto-bin |
Note: Electrical and optical parameter names and limits should be adapted to the specific E-PIC package architecture (directly-modulated laser, EML, integrated laser + external modulator; fiber-pigtailed vs. connectorized; hermetic vs. non-hermetic; single- vs. multi-channel), wavelength band (O-band, C-band, or other), and modulation format (NRZ, PAM4) in use. This is the first insertion where full environmental/ reliability qualification (per Telcordia GR-468, MIL-STD-883, or an equivalent program-specific standard) is both physically meaningful and typically contractually required - the specific standard and sample-size/ acceptance-criteria requirements should be established explicitly at Validation, since they drive LVM/HVM ongoing reliability test (ORT) planning. Package parasitics (bond-wire inductance, lead-frame/connector launch) are a new risk category introduced at packaging that specifically affects RF input return loss and eye/TDECQ performance - this should be tracked as its own delta category relative to Insertion #3, distinct from the fiber-attach/optical risk category. Laser threshold current drift under HTOL remains a primary reliability indicator carried forward from earlier insertions. Module-level traceability (linking each unit's die/ bar-level Insertion #3 and packaged Insertion #4 records) supports delta-tracking and should be established starting at the earliest applicable test insertion.
Appendix
7. Test Infrastructure Hardware & Software
7.1 Electrical
7.2 Optical
| 7.1.1 | Wafer Probe Systems - MPI Corporation ...................................................................www.mpi-corporation.com - ficonTEC ...........................................................................................www.ficontec.com |
|---|---|
| 7.1.2 | ATE Docking Stations - Advantest .......................................................................................www.advantest.com - Teradyne ...........................................................................................www.teradyne.com |
| 7.1.3 | DC Probes - MPI Corporation ...................................................................www.mpi-corporation.com |
| 7.1.4 | RF Probes - MPI Corporation ...................................................................www.mpi-corporation.com |
| 7.1.5 | DC Sources - Keysight Technologies ......................................................................www.keysight.com |
| 7.1.6 | DC Sources - Keysight Technologies ......................................................................www.keysight.com |
| 7.1.7 | DC Meters - Keysight Technologies ......................................................................www.keysight.com |
| 7.1.8 | RF Generators - Keysight Technologies ......................................................................www.keysight.com |
| 7.1.9 | Oscilloscopes |
| - Keysight Technologies ......................................................................www.keysight.com | |
| Optical | Optical |
| 7.2.1 | Wafer Probe Systems - MPI Corporation ...................................................................www.mpi-corporation.com - ficonTEC ............................................................................................www.ficontec.com - EXFO .......................................................................................................www.exfo.com |
| 7.2.2 | Bar Probe Systems - MPI Corporation ...................................................................www.mpi-corporation.com - ficonTEC ............................................................................................www.ficontec.com - EXFO .......................................................................................................www.exfo.com |
| 7.2.3 | Die Probe Systems - MPI Corporation ...................................................................www.mpi-corporation.com - ficonTEC ............................................................................................www.ficontec.com - EXFO .......................................................................................................www.exfo.com |
| 7.2.4 | Optical Probes (FAU) - PHIX ........................................................................................................www.phix.com - Focuslight .......................................................................................www.focuslight.com - SENKO .................................................................................................www.senko.com - TE Connectivity ...........................................................................................www.te.com - Lightmatter .......................................................................................www.lightmatter.co |
|---|---|
| 7.2.4 | Light Sources (OLS) - EXFO .......................................................................................................www.exfo.com - Santec .................................................................................................www.santec.com - VIAVI Solutions .........................................................................www.viavisolutions.com - Quantifi Photonics (Teradyne) ............................................www.quantifiphotonics.com - Keysight Technologies ......................................................................www.keysight.com |
| 7.2.5 | Optical Power Meters (OPM) - EXFO .......................................................................................................www.exfo.com - Santec .................................................................................................www.santec.com - VIAVI Solutions .........................................................................www.viavisolutions.com - Quantifi Photonics (Teradyne) ............................................www.quantifiphotonics.com |
| - Keysight 7.2.6 | Technologies ......................................................................www.keysight.com Optical Spectrum Analyzers (OSA) - EXFO .......................................................................................................www.exfo.com - VIAVI Solutions .........................................................................www.viavisolutions.com - Quantifi Photonics (Teradyne) ............................................www.quantifiphotonics.com |
| 7.2.7 | Wavelength Meters (WLM) - Keysight Technologies ......................................................................www.keysight.com |
| 7.2.8 | Optical Frequency Domain Reflectometer (OFDR) - Santec .................................................................................................www.santec.com |
| 7.3 Environmental 7.3.1 - ficonTEC | Wafer Probe Systems - MPI Corporation ...................................................................www.mpi-corporation.com ............................................................................................www.ficontec.com |
| 7.3.2 | Bar Probe Systems - MPI Corporation ...................................................................www.mpi-corporation.com - ficonTEC ............................................................................................www.ficontec.com |
| Die Probe Systems - MPI Corporation ...................................................................www.mpi-corporation.com - ficonTEC ............................................................................................www.ficontec.com | |
| 7.3.3 |
Thank you
www.advanced-photonics.org