PDF 原檔:報告_廣發香港_記憶體產業_20261105_original.pdf
圖片清單(已驗證 2026-11-09)
| 檔名 | size | 分類 | 親眼所見內容 |
|---|---|---|---|
報告_廣發香港_記憶體產業_20261105_002.png |
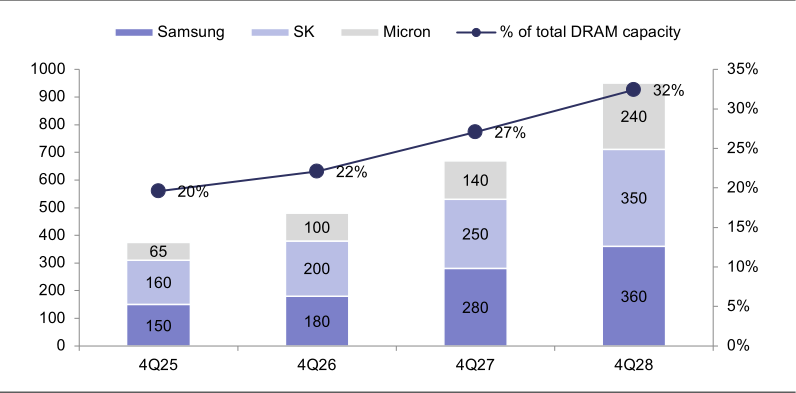
46.1KB | 真資料圖(HBM TSV 產能) | 堆疊長條圖+折線:4Q25/4Q26/4Q27/4Q28 三家 HBM TSV 產能(KWPM),Samsung 150/180/280/360、SK 160/200/250/350、Micron 65/100/140/240;折線為占 DRAM 總產能 20%/22%/27%/32% |
報告_廣發香港_記憶體產業_20261105_007.png |
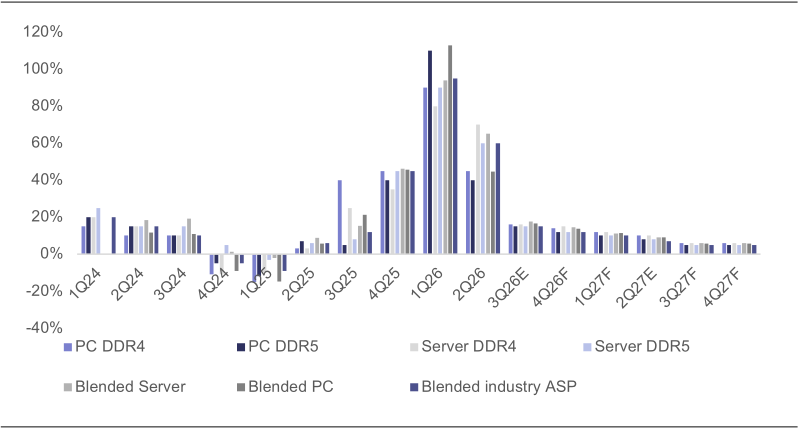
44.6KB | 真資料圖(DRAM 合約價) | 1Q24 至 4Q27F 各季 DRAM 合約價 QoQ 群組長條圖(PC DDR4/DDR5、Server DDR4/DDR5、Blended Server/PC/industry ASP):1Q26 單季漲幅峰值約 80-110%、2Q26 約 40-70%,3Q26E 後降至約 10-15% 並逐季收斂至 4Q27F 約 5% |
報告_廣發香港_記憶體產業_20261105_001、003~006、008~021.png |
16-37KB | 圖表/財報類 | <40KB,未逐張 Read;依上下文為 HBM 合約價、HBM 供需與市占、DRAM/NAND 需求與供需缺口、NAND 合約價,以及 MU/SK hynix/SanDisk 本益比、股價淨值比、ROE 等財務估值圖 |
原始內容
Memory: DRAM Intact, NAND Diverging
| Elaine Fang | Jeff Pu, CFA | Evan Lee |
|---|---|---|
| SFC CE No. BYE374 | SFC CE No. BNO719 | SFC CE No. BVI629 |
| elainefang@gfgroup.com.hk | jeffpu@gfgroup.com.hk | evanlee@gfgroup.com.hk |
What's new
Based on the recent developments and debates among memory industry, we provide an updated view on the memory sector. We are positive about the DRAM cycle duration and more cautious on NAND. We like 1) Micron (MU US) as sole US manufacturer and its better HBM4 price negotiation results. 2) SK Hynix (SKHY US) based on its attractive valuation and positive shareholder returns offset the HBM4 headwinds. We are more cautious on SanDisk (SNDK US) due to the divergence in NAND demand. We transfer coverage on Micron with Buy, SK Hynix with Buy and SanDisk with Hold.
Comments
HBM, de-spec concerns subside, HBM4 price negotiation likely better than expected: HBM de-spec for platforms like Rubin Ultra has stabilized at 8-Hi (e.g., HBM4E 8-Hi 256GB), a trend that has already been fully digested by the market. Given tight capacity and robust GPU demand from China, HBM pricing is likely to exceed expectations. We expect HBM4's final pricing in 2027 to be at around $5.0-5.5/Gb for Samsung, $4.5-5.0/Gb for Micron in 2027, far higher than $2.6/Gb in 2026. While the price for SK Hynix may be around $3.3-3.5/Gb due to product design and the intention to maintain market share. Overall, we see HBM as the tightest category among memory, with HBM sufficiency gap of -15%/-19%/-5% in 2026/27/28.
DRAM - strong server demand and capacity squeeze from HBM to sustain price uptrend: We expect DRAM demand bit growth to reach 30%/29%/23% YoY in 2026/27/28, driven by strong server demand. While the supply sees little increase due to capacity squeeze from HBM. We forecast DRAM bit growth to be 27%/23%/24% in 2026/27/28. Thus, we see the sufficiency gap is -5%/-9%/-8% in 2026/27/28, which is expected to support DRAM price at high levels. We therefore expect blended DRAM pricing at +12%/+10% QoQ in 4Q26/1Q27, implying a 30% price increase in 4Q27 compared to 4Q26.
NAND - weak consumer demand and rising supply challenge cycle durability: Demand for eSSD remains robust, yet softness in the consumer segment may weigh on overall NAND pricing. Hence, we expect the sequential blended ASP increase to be narrowed to single digits QoQ by CY4Q27. With gradual capacity ramp from Chinese suppliers, we expect the NAND sufficiency gap to ease after 2027 (-5%/-6%/-2% in 2026/27/28). We see NAND demand bit growth of 26%/26%/24% in 2026/27/28, with supply bit growth of 21%/24%/30%.
What will drive re-rating? 1) Accelerating AI monetization lifts the overall TAM of capex: With AI related memory spending doubled in 26/27, accounting for 20%/38%/40% of total capex in 2026/27/28, the wallet share improvement more relies on the commercialization process. 2) AI is extending memory cycle, with LTA reduce volatility: The structural shift in demand and constraint supply has extended the cycle much longer than previous. Major suppliers' 2027/28 capacity has been locked and aiming for 50% LTA coverage into 2030. We think the duration is still not fully priced in with main players trade at 1-2x PB FY28. 3) Positive shareholder returns: With abundant FCF, major suppliers have announced their shareholder return plans, the corresponding stock buybacks and dividends can account for 10-20% of the market value, which is meaningful to the stock price.
Risks
1) AI demand slowing down; 2) Geo-political risks; 3) Competition.
Table of Contents
| HBM - tight supply with HBM4 price negotiation likely better than expected .................................................... 4 |
|---|
| DRAM - Up cycle extend into 2028 ......................................................................................................................... 9 |
| NAND - divergence demand challenge cycle durability ..................................................................................... 10 |
| Micron ...................................................................................................................................................................... 16 |
| Earnings Review .................................................................................................................................................... 16 |
| Valuation and Recommendation ............................................................................................................................ 17 |
| Initiate at Buy with TP of $1,331 .......................................................................................................................... 17 |
| SK Hynix .................................................................................................................................................................. 21 |
| Earnings Review .................................................................................................................................................... 21 |
| Valuation and Recommendation ............................................................................................................................ 22 |
| Initiate at Buy with TP of $212 ............................................................................................................................. 22 |
| SanDisk ................................................................................................................................................................... 26 |
| Earnings Review .................................................................................................................................................... 26 |
| Valuation and Recommendation ............................................................................................................................ 27 |
| Initiate at Hold with TP of $1,310 ........................................................................................................................ 27 |
| Figure 1: HBM4 spec for main suppliers .................................................................................................................................................... 4 |
|---|
| Figure 2: HBM Contract Price ($/Gb) ......................................................................................................................................................... 4 |
| Figure 3: HBM demand analysis ................................................................................................................................................................ 5 |
| Figure 4: HBM supply (TSV) ...................................................................................................................................................................... 7 |
| Figure 5: HBM sufficiency .......................................................................................................................................................................... 7 |
| Figure 6: HBM market share ...................................................................................................................................................................... 8 |
| Figure 7: DRAM demand ............................................................................................................................................................................ 9 |
| Figure 8: DRAM Sufficiency ....................................................................................................................................................................... 9 |
| Figure 9: DRAM Contract Price QoQ ....................................................................................................................................................... 10 |
| Figure 10: NAND demand ........................................................................................................................................................................ 11 |
| Figure 11: NAND Sufficiency .................................................................................................................................................................... 11 |
| Figure 12: NAND Contract Price QoQ ...................................................................................................................................................... 12 |
| Figure 13: AI Memory wallet share of total capex .................................................................................................................................... 13 |
| Figure 14: LTA & Shareholder returns of main players ............................................................................................................................ 14 |
| Figure 15: Valuation table for main players .............................................................................................................................................. 14 |
| Figure 16: Micron's P&L ........................................................................................................................................................................... 16 |
| Figure 17: Micron's Forward P/E .............................................................................................................................................................. 17 |
| Figure 18: Micron's Forward P/B .............................................................................................................................................................. 17 |
| Figure 19: Micron's Quarterly ROE .......................................................................................................................................................... 18 |
| Figure 20: SK Hynix's P&L ....................................................................................................................................................................... 21 |
| Figure 21: SK Hynix's Forward P/E .......................................................................................................................................................... 22 |
| Figure 22: SK Hynix's Forward P/B .......................................................................................................................................................... 22 |
| Figure 23: SK Hynix's Quarterly ROE ...................................................................................................................................................... 23 |
| Figure 24: SanDisk's P&L ........................................................................................................................................................................ 26 |
| Figure 25: SanDisk's Forward P/E ........................................................................................................................................................... 27 |
| Figure 26: SanDisk's Forward P/B ........................................................................................................................................................... 27 |
| Figure 27: SanDisk's Quarterly ROE ........................................................................................................................................................ 28 |
HBM - tight supply with HBM4 price negotiation likely better than expected
HBM4 price negotiation varies for main vendors. We expect HBM4's final pricing to settle around $5.0-5.5/Gb for Samsung, $4.5-5.0/Gb for Micron in 2027, far higher than $2.6/Gb in 2026. While the price for SK Hynix may be around $3.3-3.5/Gb, about 30% discount to peers.
We attribute the price gap to the following reasons: 1) Samsung adopted more advanced processes for both core die and base die, achieving the most stable performance at a high speed of 11.7 Gbps. It regained market share with its superior performance and demanded the highest price. 2) SK Hynix's process was more conservative. The 12nm base design is hard to meet the performance at high speed, the re-design and material change has caused yield issues, solved around end-Sept. To maintain its major market share with key customer, the price is relatively weak. 3) Micron adopted a more aggressive price negotiation strategy, and the customer base is more fragmented, so we also expect better pricing.
Figure 1: HBM4 spec for main suppliers
| Samsung | Sk Hynix | Micron |
|---|---|---|
| 1c | 1b | Tech node 1β |
| Samsung Foundry 4nm | TSMC N12 | Base die DRAM 2z nm |
| 8-11.7, most stable at high speed | 8-11.7 | Pin speed (Gbps) 8-11.7 |
| 5-5.5 | 3.3-3.5 | Pricing ($/Gb) 4.5-5 |
Sources: Company Data, GF Securities (Hong Kong) Brokerage.
Figure 2: HBM Contract Price ($/Gb)
Sources: TrendForce, GF Securities (Hong Kong) Brokerage.
The positive price for main vendors is the result of strong demand and tight supply. Total demand for HBM is 4,746/7,944/10,299mn GB in 2026/2027/2028, accounting for 10%/13%/13% of total DRAM demand. We believe the HBM de-spec will stabilize at 8Hi for Rubin ultra, and we still see the possibility of 12hi for the next generation, which will increase the HBM demand further. Aside from US, the demand from China GPUs is also strong, which intensified tightness marginally.
Figure 3: HBM demand analysis
| Shipment (in K units) | Shipment (in K units) | Shipment (in K units) | Shipment (in K units) | HBM type | HBM content | HBM demand (k GB) | HBM demand (k GB) | HBM demand (k GB) |
| 2026E | 2027E | 2028E | (GB) | 2026E | 2027E | 2028E | ||
| Nvidia | ||||||||
| H20 | HBM3 | 96 | ||||||
| H200 | 500 | 400 | HBM3e | 141 | 70,500 | 56,400 | ||
| B200 | 800 | HBM3e | 192 | 153,600 | ||||
| B300 | 5,000 | 900 | HBM3e | 288 | 1,440,000 | 259,200 | ||
| Rubin | 1,600 | 5,600 | 1,600 | HBM4 | 288 | 460,800 | 1,612,800 | 460,800 |
| Rubin Ultra-1 | 1,500 | 3,800 | HBM4 | 192 | 288,000 | 729,600 | ||
| Rubin Ultra-2 | 500 | 3,000 | HBM4e | 256 | 128,000 | 768,000 | ||
| Feynman | 1,700 | HBM5 | 512 | 870,400 | ||||
| Total | 7,900 | 8,900 | 10,100 | 2,124,900 | 2,344,400 | 2,828,800 | ||
| AMD | ||||||||
| MI300 | HBM3 | 192 | ||||||
| MI325 | HBM3e | 256 | ||||||
| MI355 | 425 | HBM3e | 288 | 122,400 | ||||
| MI455 | 380 | 1,010 | 760 | HBM4 | 432 | 164,160 | 436,320 | 328,320 |
| MI550 | 120 | 370 | HBM4e | 576 | 69,120 | 213,120 | ||
| MI650 | 180 | HBM5 | 512 | 92,160 | ||||
| Total | 805 | 1,130 | 1,310 | 286,560 | 505,440 | 633,600 | ||
| v5 (Viperfish) | HBM2e | 96 | ||||||
| v6 (Trillium) | 1,200 | HBM3 | 64 | 76,800 | ||||
| v7 (Ghostfish) | 2,624 | 1,680 | 480 | HBM3e | 192 | 503,808 | 322,560 | 92,160 |
| v8i (Sunfish) | 180 | 3,600 | 3,000 | HBM3e | 288 | 51,840 | 1,036,800 | 864,000 |
| v8t (Zebrafish) | 500 | 3,600 | 1,600 | HBM3e | 216 | 108,000 | 777,600 | 345,600 |
| v8i+ (Whalefish) | 1,200 | HBM4e | 384 | 460,800 |
Please be sure to read the disclosures at the end of this report carefully.
| v9t (Triggerfish) - v9i (Humufish) | 400 - 1,900 | HBM4e | 288 - 384 | 115,200 729,600 | ||||
|---|---|---|---|---|---|---|---|---|
| Total | 4,504 | 8,880 | 8,580 | 740,448 | 2,136,960 | 2,607,360 | ||
| Amazon | ||||||||
| Trainium 2 | HBM3e | 96 | ||||||
| R2 | 320 | HBM3e | 144 | 46,080 | ||||
| Trainium 3 | 2,000 | 2,700 | 800 | HBM3e | 216 | 432,000 | 583,200 | 172,800 |
| Trainium 4 | 1,000 | HBM4 | 288 | 288,000 | ||||
| Total | 2,320 | 2,700 | 1,800 | 478,080 | 583,200 | 460,800 | ||
| Meta | ||||||||
| MTIA 300 (Athena) | 300 | HBM3e | 216 | 64,800 | ||||
| MTIA 400+ (Iris Plus+) | 16 | 400 | HBM3e | 288 | 115,200 | |||
| MTIA 450 (ARKE) | 200 | 300 | HBM4 | 288 | 57,600 | 86,400 | ||
| MTIA 500 (Astrid) | 40 | 320 | HBM4e | 384 | 15,360 | 122,880 | ||
| Total | 316 | 640 | 620 | 64,800 | 188,160 | 209,280 | ||
| MSFT | ||||||||
| M200 | 168 | 56 | HBM3e | 216 | 36,288 | 12,096 | ||
| M300 | 288 | 560 | HBM4 | 288 | 82,944 | 161,280 | ||
| Total | 168 | 344 | 560 | 36,288 | 95,040 | 161,280 | ||
| Others | ||||||||
| Other GPU | 1,500 | 3,000 | 4,000 | 324,000 | 864,000 | 1,344,000 | ||
| Other ASIC | 1,000 | 1,500 | 2,000 | 216,000 | 432,000 | 1,024,000 | ||
| Total | 2,500 | 4,500 | 6,000 | 540,000 | 1,296,000 | 2,368,000 | ||
| Total HBM demand in M GB | Total HBM demand in M GB | Total HBM demand in M GB | Total HBM demand in M GB | 4,271 | 7,149 | 9,269 | ||
| Total adjusted HBM demand in M GB | Total adjusted HBM demand in M GB | Total adjusted HBM demand in M GB | Total adjusted HBM demand in M GB | 4,746 | 7,944 | 10,299 |
Sources: Company Data, GF Securities (Hong Kong) Brokerage.
Supply is hard to catch up with the exponential growth in demand. Total HBM TSV capacity for three main players is 480/670/950 KWPM by Q4 2026/27/28, accounting for 22%/27%/32% of total DRAM capacity. Considering the output ratio and yield rate, the HBM bit shipment is 4,037/6,430/9,773mn GB in 2026/27/28, imply for the sufficiency gap of -15%/-19%/-5%. For CXMT, we project 20/40/60k TSV capacity by Q4 2026/27/28, due to the technological and cost gaps, we believe that CXMT can only meet a very small portion of China demand and has a relatively minor impact on the overall supply and demand.
Figure 4: HBM supply (TSV)
Sources: Company Data, GF Securities (Hong Kong) Brokerage.
Figure 5: HBM sufficiency
Sources: Company Data, GF Securities (Hong Kong) Brokerage.
Figure 6: HBM market share
Sources: Company Data, GF Securities (Hong Kong) Brokerage.
DRAM - Up cycle extend into 2028
DRAM demand bit growth is expected to reach 30%/29%/24% YoY in 2026/27/28, driven by strong server demand. We now forecast server DRAM demand grow 83%/43%/27% YoY in 2026/27/28, accounting for 49%/54%/55% of total DRAM demand. The strong demand comes from both AI servers and general servers. The mainstream DRAM capacity of general servers has reached 2TB (64GB*32), with the rapid development of agents and the sustained growth in CPU demand, we can still see upside potential. As to AI servers, we believe the SOCAMM de-spec by Nvidia is wellrecognized by the market, with the rapid shipment of accelerate cards and attached ratio of CPU, we forecast 97%/118%/45% YoY growth for AI server DRAM in 2026/27/28.
Figure 7: DRAM demand
Sources: Company Data, GF Securities (Hong Kong) Brokerage.
Capacity squeeze from HBM leads to DRAM S/D imbalance extending into 2028, supporting the sequential price increase. Except for HBM, total average conventional DRAM wafer capacity is 1,533/1,594/1,604 KWPM in 2026/27/28, implying 3%/4%/1% wafer growth in 2026/27/28. Therefore, we forecast the supply bit growth is 27%/23%/23% of total DRAM, leading to the sufficiency gap of - 5%/-9%/-8% in 2026/27/28. As to CXMT, the bit shipment share is expected to be 11%/12%/14% due to technology and density gap in 2026/27/28, still lagging its wafer share and hard to affect total supply.
Figure 8: DRAM Sufficiency
Sources: Company Data, GF Securities (Hong Kong) Brokerage.
Please be sure to read the disclosures at the end of this report carefully.
As we see the S/D imbalance is hard to ease into 2028, which is enough to support DRAM price run at high level. We therefore expect blended DRAM pricing at ~12%/10% QoQ in 4Q26/1Q27, implying 30% price increase in 4Q27 compared to 4Q26, mainly driven by server DDR, and seeing consumer DRAM will maintain at high price.
Figure 9: DRAM Contract Price QoQ
Sources: Company Data, GF Securities (Hong Kong) Brokerage.
NAND - divergence demand challenge cycle durability
NAND demand bit growth is expected to reach 26%/26%/24% YoY in 2026/27/28, with strong datacenter SSD demand offset the weak consumer demand. Per our channel check, the LTA volume of eSSD from US CSPs has doubled for the next year compared to 26Q4 driven by both TLC and QLC demand. We believe QLC SSD will be gradually placed next to GPU as a separate layer to support better KV-cache offloading. With AI workloads shifting from training toward inference and agentic-AI, eSSD offers a superior cost-per-bit vs. DRAM and better power efficiency vs. HDD.
Figure 10: NAND demand
Sources: Company Data, GF Securities (Hong Kong) Brokerage.
For the supply side, YMTC is the main concern. Total average capacity for NAND is 1,343/1,404/1,541 KWPM in 2026/27/28, implying -1%/5%/10% YoY wafer growth. The incremental capacity is mainly coming from YMTC (200/280/380 KWPM by 4Q26/27/28), showing strong supply discipline for global players. We forecast NAND bit supply growth to reach 21%/24%/30% YoY in 2026/27/28, which leads the sufficiency gap of -5%/-6%/-2% in 2026/27/28. We forecast YMTC's bit share will increase from current 13% to ~20% by 4Q28, which will greatly impact the S/D of consumer market, while data center SSD market impact is more limited.
Figure 11: NAND Sufficiency
Sources: Company Data, GF Securities (Hong Kong) Brokerage.
Please be sure to read the disclosures at the end of this report carefully.
Sequential ASP increase narrowed down to single digit. Demand for eSSD remains robust, yet softness in the consumer segment has weighed on overall NAND pricing. For pure NAND players, sequential ASP increase in CY4Q27 has narrowed to single digits. We now forecast 4Q26/1Q27 blended NAND price increase of 8%/6%, largely maintain flat afterwards.
Figure 12: NAND Contract Price QoQ
Sources: Company Data, GF Securities (Hong Kong) Brokerage.
What will drive re-rating? 1) Accelerating AI monetization lifts the overall TAM of capex. With AI related memory spending doubled in 26/27, accounting for 20%/38%/40% of total capex in 2026/27/28, the wallet share improvement more relies on the commercialization progress. 2) AI is extending memory cycle, with LTA reduce volatility. The structural shift in demand and constraint supply has extended the cycle much longer than previous. Major suppliers' 2027/28 capacity has been locked and aiming for 50% LTA coverage into 2030. We think the duration is still not fully priced in with main players trade at 1-2x PB FY28. 3) Positive shareholder returns. With abundant FCF, major suppliers have announced their shareholder return plans, the corresponding stock buybacks and dividends can account for 10-20% of the market value, which is meaningful to the stock price.
Figure 13: AI Memory wallet share of total capex
| 2024 | 2025 | 2026E | 2027E | 2028E | |
|---|---|---|---|---|---|
| Top-5 CSP Capex ($bn) | 261 | 446 | 829 | 1,182 | 1,370 |
| Neo-Cloud Capex ($bn) | 36 | 143 | 352 | 373 | |
| China Capex ($bn) | 35 | 60 | 100 | 150 | 200 |
| Total Capex ($bn) | 296 | 542 | 1,072 | 1,684 | 1,943 |
| YoY | 83% | 98% | 57% | 15% | |
| HBM | 14 | 34 | 68 | 248 | 330 |
| AI DRAM | 3 | 7 | 46 | 147 | 181 |
| AI NAND | 5 | 8 | 99 | 243 | 257 |
| AI Memory Total ($bn) | 22 | 49 | 213 | 638 | 768 |
| HBM Share% | 5% | 6% | 6% | 15% | 17% |
| DRAM Share% | 1% | 1% | 4% | 9% | 9% |
| NAND Share% | 2% | 1% | 9% | 14% | 13% |
| Total share | 7% | 9% | 20% | 38% | 40% |
Sources: Company Data, GF Securities (Hong Kong) Brokerage.
Figure 14: LTA & Shareholder returns of main players
| LTA | Micron | Samsung | SK Hynix | SanDisk | Kioxia |
|---|---|---|---|---|---|
| Term length | 5 years | 5 years | 5 years | 4+ years | 3+ years |
| Coverage | ~35% revenue through 2030 | Target 60-70% of capacity | ~50% of 27/28 capacity | FY27 ~1/2 bit FY28 ~2/3 bit | CY28 over 50% bit |
| Price band | Ceiling and floor | Ceiling and floor | Customer-agreed ranges | Ceiling and floor | Floor only, no ceiling |
| Cash deposit | ~ $32bn | Yes | Yes | $16.5bn | - |
| Return | Micron | Samsung | SK Hynix | SanDisk | Kioxia |
| Return policy | 100% of excess cash | 50% of 2024-26 FCF | ~50% of 2025-27 cumulative FCF | 100% of excess cash | 100% of excess cash |
| CY26 payout | Plan disclosed after Dec.9 th 2026 | Total KRW 90-110T Cash dividends ~30T Share buyback ~15T | Total KRW 100T Cash dividends ~30T Share cancel ~60T | Total $20bn, $9.5b executed in Q4FY26-1QFY27 | Q3 Share cancel JPY 800bn |
| CY27 FCF est. | $161 bn | KRW 420T | KRW 391T | $42 bn | $45 bn |
| CY27 Potential payout | $97 bn (60%) | KRW 210T ($168bn, 50%) | KRW 196T ($147 bn, 50%) | $25 bn (60%) | $22.5 bn (50%) |
| % of Current market cap | 10% | 14% | 19% (Korea) 14% (ADR) | 15% | 19% |
Sources: Company Data, GF Securities (Hong Kong) Brokerage.
Figure 15: Valuation table for main players
| PE - CY26 | PE - CY27 | PE - CY28 | PB - CY26 | PB - CY27 | PB - CY28 | |
|---|---|---|---|---|---|---|
| MU US | 7.8 | 3.7 | 2.9 | 5.3 | 2.9 | 1.9 |
| SKHY US | 5.8 | 3.2 | 2.4 | 3.7 | 2.1 | 1.4 |
| 000660 KS (SK Hynix) | 3.9 | 2.2 | 1.7 | 2.5 | 1.5 | 1.0 |
| SNDK US | 6.3 | 3.6 | 3.5 | 15.3 | 4.5 | 3.4 |
As of Closing price of 2026/11/2, SK Hynix ADR premium 30%
Sources: Company Data, GF Securities (Hong Kong) Brokerage.
Risks
1) AI demand deceleration; 2) Geo-political uncertainties; 3) Competition.
Micron (MU US)
Riding the Memory Super cycle Amid 'Made in U.S.'
Initiate with Buy, TP $1,331: We believe that AI server demand has led to a structural memory upcycle, with global supply materially lagging demand. As the sole US memory player, we believe Micron is the key beneficiary of the memory super cycle. The company reported FY4Q26 revenue of $54.2b, +30.8% QoQ, +379.3% YoY; with Non-GAAP GPM at 87.0%, +2.1ppt QoQ. We continue to see DRAM supply remaining structurally tight into 2028. Factoring strong pricing environment for both conventional and HBM, we now forecast MU's revenue to be $306/389bn, and EPS to be 201/278 in FY27E/28E. We transfer coverage with a Buy rating and a TP of $1,331, based on 4x FY27E/28E BVPS, also corresponds to 6.0x/4.6x CY27/CY28E PE.
Strong HBM pricing to catch up the margin gap with conventional: We expect MU's HBM4 final price to be at around $4.7/Gb for 2027, +81% YoY, lifting HBM blended ASP from $1.7/Gb to $3.6/Gb in FY27E (4.2/Gb in CY27), +112% YoY, narrowing the pricing gap with that of conventional DRAM. For conventional DRAM, we continue to see strong pricing environment backed by our forecast of tight supply. We now forecast 1Q/2QFY27E ASP increase of 10%/8% QoQ for DRAM and 15%/8% QoQ for NAND. Thus, we expect MU conventional DRAM ASP of $2.0/Gb, +80% YoY, NAND ASP $0.41/GB, +100% YoY in FY27E, leading the Non-GAAP GPM to 87.9%, +6.8ppt YoY.
SCA coverage and shareholder return the catalyst for re-rating: MU announced that they have signed 26 SCAs which will be over 35% of their revenue through 2030, and aiming for 50% in the long-term. Financial commitments from SCA customers have increased to $32bn. These binding long-term agreements lock in predictable cash flows, reduce revenue volatility amid cyclical memory chip market swings, and strengthen visibility on future earnings. Amid meaningful balance sheet improvement, MU commits to returning 100% of excess FCF. We project MU's FCF at $161/214bn in FY27E/28E, equal to 16/21% of current market cap. With a 60% excess cash return assumption, shareholder return stands at 10/13%, which is meaningful to the stock price.
Risks: 1) AI demand deceleration; 2) Geo-political uncertainties; 3) Competition.
Profit forecast
| FY24 | FY25 | FY26 | FY27E | FY28E | |
|---|---|---|---|---|---|
| Revenue | 25,111 | 37,378 | 133,188 | 305,558 | 388,791 |
| Revenue YoY (%) | 61.6 | 48.9 | 256.3 | 129.4 | 27.2 |
| Net profit | 1,538 | 9,365 | 84,018 | 212,809 | 269,205 |
| Net profit YoY (%) | -130.3 | 508.9 | 797.1 | 153.3 | 26.5 |
| EPS ($) | 1.3 | 8.3 | 75.5 | 200.6 | 277.8 |
| P/E | 675.7 | 103.1 | 11.3 | 4.3 | 3.1 |
| ROE (%) | 3.4 | 17.3 | 60.7 | 75.1 | 63.6 |
Source: Company data, GF Securities (Hong Kong) Brokerage.
数据来源:公司财务报表,⼴发证券发展研究中⼼
Elaine Fang
SFC CE No. BYE374 elainefang@gfgroup.com.hk
Jeff Pu, CFA
SFC CE No. BNO719 jeffpu@gfgroup.com.hk
Evan Lee
SFC CE No. BVI629 evanlee@gfgroup.com.hk
Figure 16: Micron's P&L
| (USD m) | FY26 | 1Q27E | 2Q27E | 3Q27E | 4Q27E | FY27E | 1Q28E | 2Q28E | 3Q28E | 4Q28E | FY28E |
|---|---|---|---|---|---|---|---|---|---|---|---|
| Sales | 133,188 | 62,609 | 73,360 | 81,177 | 88,412 | 305,558 | 93,884 | 93,976 | 98,752 | 102,180 | 388,791 |
| COGS | -25,156 | -8,436 | -8,772 | -9,602 | -10,226 | -37,036 | -11,207 | -11,221 | -12,393 | -13,241 | -48,062 |
| Gross profit | 108,032 | 54,173 | 64,588 | 71,576 | 78,186 | 268,523 | 82,677 | 82,755 | 86,359 | 88,939 | 340,729 |
| Opex | -6,841 | -2,182 | -2,557 | -2,829 | -3,082 | -10,650 | -3,272 | -3,276 | -3,640 | -3,970 | -14,158 |
| Operating profit | 101,191 | 51,991 | 62,031 | 68,746 | 75,105 | 257,872 | 79,405 | 79,479 | 82,719 | 84,968 | 326,572 |
| Non-op profit | 882 | 543 | 1,013 | 1,237 | 1,508 | 4,301 | 1,808 | 2,117 | 2,442 | 2,778 | 9,145 |
| Pre-tax profit | 102,073 | 52,534 | 63,044 | 69,983 | 76,612 | 262,173 | 81,213 | 81,596 | 85,161 | 87,746 | 335,717 |
| Income tax | -15,315 | -7,885 | -9,462 | -10,504 | -11,499 | -39,350 | -12,189 | -12,247 | -12,782 | -13,170 | -50,388 |
| Non-GAAP Net Income | 86,758 | 44,649 | 53,581 | 59,479 | 65,113 | 222,823 | 69,024 | 69,349 | 72,379 | 74,576 | 285,328 |
| Diluted EPS (US$) | 75.5 | 38.9 | 47.6 | 53.9 | 60.2 | 200.6 | 65.1 | 66.8 | 71.1 | 74.8 | 277.8 |
| Diluted shares | 1149 | 1149 | 1126 | 1103 | 1081 | 1081 | 1060 | 1039 | 1018 | 997 | 997 |
| Margin analysis | |||||||||||
| Gross margin | 81% | 87% | 88% | 88% | 88% | 88% | 88% | 88% | 87% | 87% | 88% |
| Operating margin | 76% | 83% | 85% | 85% | 85% | 84% | 85% | 85% | 84% | 83% | 84% |
| Pre-tax margin | 77% | 84% | 86% | 86% | 87% | 86% | 87% | 87% | 86% | 86% | 86% |
| Effective tax rate | 15% | 15% | 15% | 15% | 15% | 15% | 15% | 15% | 15% | 15% | 15% |
| Growth (YoY%) | |||||||||||
| Sales | 256% | 359% | 207% | 96% | 63% | 129% | 50% | 28% | 22% | 16% | 27% |
| Operating profit | 833% | 710% | 277% | 104% | 68% | 155% | 53% | 28% | 20% | 13% | 27% |
| Net income | 816% | 714% | 282% | 106% | 70% | 157% | 55% | 29% | 22% | 15% | 28% |
| EPS | 811% | 714% | 290% | 115% | 80% | 166% | 68% | 40% | 32% | 24% | 39% |
Sources: Company data, GF Securities (Hong Kong) Brokerage Kong) Brokerage
Earnings Review
FY4Q26 results review
Micron FY4Q26 revenue came in at $54.2bn, +30.8% QoQ and +379.3% YoY. By segment, DRAM revenue reached $39.8bn, +27% QoQ and +343% YoY. NAND revenue totaled $14.1bn, +42% QoQ and +526% YoY. Non-GAAP gross margin increased to 87%, up 2.1ppt QoQ, while Non-GAAP diluted EPS was $33.4, +33% QoQ and +1003% YoY.
We forecast revenue of $306/389bn in FY27E/28E
Micron's revenue for FY2027 and 2028 is projected to reach $306bn and $389bn, reflecting YoY growth of +129% and +27%, respectively. By end market, we forecast MU's DRAM revenue to contribute 75%/77% of total revenue in FY2027/2028; NAND revenue to contribute 25%/23% of total revenue in FY2027/2028.
Valuation and Recommendation
Initiate at Buy with TP of $1,331
We transfer coverage with a Buy rating and a TP of $1,331, based on 4x FY27/28 BVPS, also corresponds to 6.0x/4.6x CY27/CY28E PE, imply the stock upside potential of 60%.
We use the PB-ROE framework to analyze memory stocks, during the last few upside cycles, MU's PB can reach to 3-5x, and PE can reach to 5-10x, with ROE range from 40-60%. For this cycle, we continue to see the DRAM S/D imbalance extend into 2028, with MU's ROE reach to 63%/79%/67% in FY26/27/28. So, we apply for 4x FY27/28 BVPS to reflect the up-cycle valuation, also the premium for made in US.
Figure 17: Micron's Forward P/E
Sources: Bloomberg, GF Securities (Hong Kong) Brokerage
Figure 18: Micron's Forward P/B
Sources: Bloomberg, GF Securities (Hong Kong) Brokerage
Figure 19: Micron's Quarterly ROE
Sources: Bloomberg, GF Securities (Hong Kong) Brokerage
Risks
- 1) AI demand deceleration; 2) Geo-political uncertainties; 3) Competition.
| Balance | [Table_FinanceDetail] Sheet | [Table_FinanceDetail] Sheet | [Table_FinanceDetail] Sheet | [Table_FinanceDetail] Sheet | USD mn |
| FY24 | FY25 | FY26 | FY27E | FY28E | |
| Current assets | 24,372 | 28,841 | 91,070 | 203,037 | 304,746 |
| Cash and cash equivalents | 8,106 | 10,307 | 43,434 | 127,858 | 215,926 |
| Inventory | 8,875 | 8,355 | 10,372 | 15,098 | 19,550 |
| Accounts Receivable | 6,615 | 9,265 | 36,197 | 59,014 | 68,203 |
| Other current assets | 776 | 914 | 1,067 | 1,067 | 1,067 |
| Non-current assets | 45,044 | 53,957 | 104,818 | 146,674 | 193,665 |
| Long-term equity investment | - | - | - | - | - |
| Fixed assets | 39,749 | 46,590 | 63,310 | 105,166 | 152,157 |
| Other long-term assets | 5,295 | 7,367 | 41,508 | 41,508 | 41,508 |
| Total assets | 69,416 | 82,798 | 195,888 | 349,711 | 498,411 |
| Current liabilities | 9,248 | 11,454 | 27,482 | 37,820 | 47,534 |
| Accounts Payable | 7,299 | 9,649 | 22,605 | 32,905 | 42,607 |
| Short-term borrowings | 431 | 560 | 491 | 530 | 541 |
| Other current liabilities | 1,518 | 1,245 | 4,386 | 4,386 | 4,386 |
| Non-current liabilities | 15,037 | 17,179 | 30,028 | 28,584 | 27,585 |
| Long-term Debt | 12,966 | 14,017 | 4,688 | 3,244 | 2,245 |
| Other non-current liabilities | 2,071 | 3,162 | 25,340 | 25,340 | 25,340 |
| Total liabilities | 24,285 | 28,633 | 57,510 | 66,405 | 75,119 |
| Total Equity | 45,131 | 54,165 | 138,378 | 283,306 | 423,292 |
| Paid-in capital | 12,240 | 13,466 | 15,102 | 15,102 | 15,102 |
| Treasury stock | -134 | -32 | - | - | - |
| Retained earnings | 40,877 | 48,583 | 131,851 | 275,569 | 431,566 |
| Minority interests | - | - | - | - | - |
| Total Liabilities & Equity | 69,416 | 82,798 | 195,888 | 349,711 | 498,411 |
| Cash Flow Statement | FY24 | FY25 | FY26 | USD mn - FY27E | USD mn - FY28E |
|---|---|---|---|---|---|
| Operating cash flow | 8,507 | 17,525 | 89,675 | 216,287 | 284,381 |
| Profit for the year (GAAP) | 778 | 8,539 | 84,969 | 222,823 | 285,328 |
| Depreciation & amortization | 7,780 | 8,352 | 9,503 | 14,707 | 22,991 |
| Change in working capital | -1,165 | -338 | -6,130 | -17,243 | -3,939 |
| Others | 1,114 | 972 | 1,333 | -4,000 | -20,000 |
| Investing cash flow | -8,419 | -14,133 | -28,758 | -55,314 | -69,982 |
| Capex | -8,386 | -15,857 | -30,376 | -55,314 | -69,982 |
| Change in investment | - | - | - | - | - |
| Others | -33 | 1,724 | 1,618 | - | - |
| Free cash flow | 121 | 1,668 | 59,299 | 160,974 | 214,398 |
| Financing cash flow | -1,842 | -850 | 630 | -76,549 | -126,330 |
| Change in Capital | -300 | -207 | -1,777 | -78,414 | -128,639 |
| Net Change in Debt | -898 | -4,619 | -10,043 | -1,444 | -999 |
| Others | -644 | 3,976 | 12,450 | 3,308 | 3,308 |
| Exchange influence | - | - | - | - | - |
| Net increase in cash | -1,754 | 2,542 | 61,547 | 84,424 | 88,068 |
USD mn Cash Flow Statement
24,372 28,841 91,070 203,037 304,746 Operating cash flow
1,067 Others
7,367 41,508 41,508 41,508 Others
4,386 Others
69,416 82,798 195,888 349,711 498,411 Key Financial Ratios
1,327 15,315 39,350 50,388 Gross debt/equity
9,365 84,018 212,809 269,205 Quick Ratio
| Income Statement | USD mn | ||||
| FY24 | FY25 | FY26 | FY27E | FY28E | |
| Revenue | 25,111 | 37,378 | 133,188 | 305,558 | 388,791 |
| Cost of sales | -19,168 | -22,092 | -25,156 | -37,036 | -48,062 |
| Gross profit | 5,943 | 15,286 | 108,032 | 268,523 | 340,729 |
| Operating Expense | -4,008 | -4,440 | -6,841 | -10,650 | -14,158 |
| Operating profit | 1,935 | 10,846 | 101,191 | 257,872 | 326,572 |
| Interest Income | -529 | -496 | -1,084 | -4,429 | -5,694 |
| Interest Expense | -562 | -477 | -106 | - | - |
| Net other Non-op. Income/(Loss) | -51 | -135 | -880 | -1,284 | -1,284 |
| Pre-tax profit | 1,917 | 10,692 | 99,333 | 252,159 | 319,593 |
| Income tax | 379 | 1,327 | 15,315 | 39,350 | 50,388 |
| Profit for the year | 1,538 | 9,365 | 84,018 | 212,809 | 269,205 |
| Minority interest | - | - | - | - | - |
| Net profit to ord. equity | 1,538 | 9,365 | 84,018 | 212,809 | 269,205 |
| EPS (US$) | 1.3 | 8.4 | 75.5 | 200.6 | 277.8 |
| Key Financial Ratios | |||||
|---|---|---|---|---|---|
| Growth (%) | FY24 | FY25 | FY26 | FY27E | FY28E |
| Revenue growth | 61.6 | 48.9 | 256.3 | 129.4 | 27.2 |
| Operating profit growth | -140.2 | 460.5 | 833.0 | 154.8 | 26.6 |
| Net profit growth | -130.3 | 508.9 | 797.1 | 153.3 | 26.5 |
| Profitability (%) | |||||
| Gross profit margin | 23.7 | 40.9 | 81.1 | 87.9 | 87.6 |
| Operating Profit Margin | 7.7 | 29.0 | 76.0 | 84.4 | 84.0 |
| Net profit margin | 6.1 | 25.1 | 63.1 | 69.6 | 69.2 |
| Key Ratio | |||||
| ROA | 2.3 | 12.3 | 60.3 | 78.0 | 63.5 |
| ROE | 3.4 | 17.3 | 60.7 | 75.1 | 63.6 |
| Stability | |||||
| Gross debt/equity | 53.8 | 52.9 | 41.6 | 23.4 | 17.7 |
| Interest Coverage | -2.4 | -21.4 | -936.1 | - | - |
| Current Ratio | 2.6 | 2.5 | 3.3 | 5.4 | 6.4 |
| Quick Ratio | 1.7 | 1.8 | 2.9 | 5.0 | 6.0 |
| Net debt/equity | 11.7 | 7.9 | Net Cash | Net Cash | Net Cash |
SK Hynix (SKHY US)
Undemanding Valuation and Positive Shareholder Return
Initiate with Buy, TP $212: We expect SK Hynix to benefit from this super-cycle driven by AI. SK Hynix, and the U.S. listed stock has gain tractions by supporting valuations. The company reported FY3Q26 revenue of KRW105 trn, +31.9% QoQ, +327.9% YoY; with Non-GAAP GPM at 85.7%, +2.5ppt QoQ. We continue to see the favorable pricing environment for both convention and HBM, we now forecast Hynix's revenue to be KRW661/807 trn ($486/593 bn), and EPS to be KRW640k/828k ($47/61) in FY27E/28E. We transfer coverage with a Buy rating and a TP of $212, based on 3x FY27 BVPS, also corresponds to 4.5x/3.5x FY27/FY28E PE.
HBM4 pricing offset by strong industry momentum: We now forecast HBM4 final price to be at around $3.5/Gb for SK Hynix's HBM4 in 2027, leading to the blended HBM ASP reaching $3.95/Gb, YoY +93% in 2027. As to market share, Hynix and Samsung are still the leaders with ~40% each. Due to the robust demand, Hynix's DRAM and HBM capacity has been sold out into 2029. So, we believe the HBM4 pricing headwinds for Hynix will be offset by strong industry momentum. And for conventional, the price upward trend is still solid. Thus, we forecast conventional DRAM ASP of $2.1/Gb, +36% YoY, NAND ASP $0.42/GB, +48% YoY in FY27E, leading the Non-GAAP GPM to 87.5%, +3.1ppt YoY.
Undemanding valuation and positive shareholder return: SKHY now trades at 2.1x/1.4x PB (with Korea stock trades at 1.5x/1.0x PB) in FY27/28, suggesting that market are expecting cycle to peak in mid-27 with meaningful price decline afterwards, which we see huge divergence from our view. Besides, Hynix also announced positive shareholder return plans in mid-26, aiming to return >50% of 2025-2027 cumulative FCF to shareholders. Total 100trn Won shareholder return has been announced in Oct-2026, including cash dividends of ~30trn won and share buyback ~60trn won, accounting for 10% of Korea stock's market cap. We project Hynix's FCF at KRW392/471 trn ($288/346 bn) in FY27E/28E, or 28/35% of current ADR market cap. With a 50% cash return assumption, shareholder return stands at 14/18%, making the stock look compelling.
Risks: 1) AI demand slowing down; 2) Geo-political risks; 3) Intensifying competition.
Profit forecast
| (KRW bn) | FY24 | FY25 | FY26E | FY27E | FY28E |
|---|---|---|---|---|---|
| Revenue (bn) | 66,193 | 97,147 | 372,735 | 660,606 | 806,986 |
| Revenue YoY (%) | 102.0 | 46.8 | 283.7 | 77.2 | 22.2 |
| Net profit (bn) | 19,135 | 42,549 | 259,828 | 425,932 | 514,943 |
| Net profit YoY (%) | -316.6 | 116.9 | 504.6 | 64.0 | 20.9 |
| EPS (KRW) | 28,301 | 60,431 | 364,206 | 639,832 | 828,141 |
| P/E | 49.3 | 23.1 | 3.8 | 2.2 | 1.7 |
| ROE (%) | 25.9 | 35.3 | 63.9 | 66.7 | 57.2 |
Source: Company data, GF Securities (Hong Kong) Brokerage.
数据来源:公司财务报表,⼴发证券发展研究中⼼
Initiation Buy
Target price $212
Elaine Fang
SFC CE No. BYE374 elainefang@gfgroup.com.hk
Jeff Pu, CFA
SFC CE No. BNO719 jeffpu@gfgroup.com.hk
Evan Lee
SFC CE No. BVI629 evanlee@gfgroup.com.hk
Figure 20: SK Hynix's P&L
| (KRW bn) | FY25 | F1Q26 | F2Q26 | F3Q26 | F4Q26E | FY26E | F1Q27E | F2Q27E | F3Q27E | F4Q27E | FY27E |
|---|---|---|---|---|---|---|---|---|---|---|---|
| Sales | 97,147 | 52,576 | 79,319 | 104,615 | 136,225 | 372,735 | 143,530 | 158,315 | 174,795 | 183,966 | 660,606 |
| COGS | -38,456 | -10,897 | -13,328 | -14,963 | -19,124 | -58,311 | -17,815 | -19,451 | -21,517 | -23,674 | -82,458 |
| Gross profit | 58,691 | 41,679 | 65,991 | 89,652 | 117,101 | 314,424 | 125,715 | 138,864 | 153,277 | 160,292 | 578,148 |
| Opex | -11,484 | -4,069 | -5,449 | -6,319 | -7,956 | -23,793 | -8,095 | -8,613 | -9,160 | -9,272 | -35,140 |
| Operating profit | 47,207 | 37,610 | 60,543 | 83,333 | 109,145 | 290,631 | 117,620 | 130,251 | 144,118 | 151,019 | 543,008 |
| Non-op profit | 3,260 | 14,007 | 62,166 | -32,625 | 0 | 43,547 | 0 | 0 | 0 | 0 | 0 |
| Pre-tax profit | 50,465 | 51,617 | 122,708 | 50,708 | 109,145 | 334,178 | 117,620 | 130,251 | 144,118 | 151,019 | 543,008 |
| Income tax | -7,518 | -11,271 | -28,786 | -10,933 | -23,532 | -74,522 | -25,360 | -28,083 | -31,073 | -32,561 | -117,076 |
| Non-GAAP Net Income | 42,948 | 40,346 | 93,923 | 39,775 | 85,613 | 259,656 | 92,260 | 102,168 | 113,045 | 118,458 | 425,932 |
| Diluted EPS (KRW) | 60,432 | 56,137 | 132,090 | 54,454 | 122,304 | 364,206 | 134,490 | 151,972 | 171,583 | 183,469 | 639,832 |
| Diluted shares | 711 | 719 | 711 | 722 | 700 | 713 | 686 | 672 | 659 | 646 | 666 |
| Margin analysis | |||||||||||
| Gross margin | 60% | 79% | 83% | 86% | 86% | 84% | 88% | 88% | 88% | 87% | 88% |
| Operating margin | 49% | 72% | 76% | 80% | 80% | 78% | 82% | 82% | 82% | 82% | 82% |
| Pre-tax margin | 52% | 98% | 155% | 48% | 80% | 90% | 82% | 82% | 82% | 82% | 82% |
| Effective tax rate | 15% | 22% | 23% | 22% | 22% | 22% | 22% | 22% | 22% | 22% | 22% |
| Growth (YoY%) | |||||||||||
| Sales | 47% | 198% | 257% | 328% | 315% | 284% | 48% | 201% | 120% | 76% | 77% |
| Operating profit | 101% | 405% | 557% | 632% | 469% | 516% | 149% | 246% | 138% | 81% | 87% |
| Net income | 117% | 398% | 1242% | 216% | 462% | 505% | 115% | 153% | 20% | 198% | 64% |
| EPS | 114% | 392% | 1242% | 207% | 470% | 503% | 123% | 171% | 30% | 237% | 76% |
Sources: Company data, GF Securities (Hong Kong) Brokerage, GF Securities (Hong Kong) Brokerage
Earnings Review F3Q26
F3Q26 results review
SK Hynix FY3Q26 revenue came in at KRW 105 trn, +31.9% QoQ and +327.9% YoY. By segment, DRAM revenue reached KRW 78 trn, +39% QoQ and +310% YoY. NAND revenue totaled KRW 25 trn, +24% QoQ and +421% YoY. Gross margin increased to 85.7%, up 2.5ppt QoQ, while Operating Profit reached KRW 83 trn, with OPM of 79.7%, up 3.4ppt QoQ.
We forecast revenue of KRW 661/807 trn in FY27E/28E
SK Hynix's revenue for FY27E and FY28E is projected to reach KRW 661 trn and KRW 807 trn, reflecting YoY growth of +77% and +22%, respectively. By segment, we forecast DRAM revenue to contribute 77%/80% of total revenue in FY27E/28E; NAND revenue to contribute 22%/19% of total revenue in FY27E/28E.
Valuation and Recommendation
Initiate at Buy with TP of $212
We initiate coverage with a Buy rating and a TP of $212, based on 3x FY27 BVPS, also corresponds to 4.5x/3.5x FY27/FY28E PE, imply the stock upside potential of 43%.
We use the PB-ROE framework to analyze memory stocks, during the last few upside cycles, SK Hynix's peak PB can reach to 2-4x, and PE can reach to 4-8x, with ROE range from 30-40%. For this cycle, we continue to see the DRAM S/D imbalance extend into 2028, with SK Hynix's ROE reach to 64%/67%/57% in FY26/27/28. So, we apply for 3x FY27 BVPS to reflect the up-cycle valuation, discount to Micron but in-line with the Korea trading range.
Figure 21: SK Hynix's Forward P/E
Sources: Bloomberg, GF Securities (Hong Kong) Brokerage
Figure 22: SK Hynix's Forward P/B
Sources: Bloomberg, GF Securities (Hong Kong) Brokerage
Figure 23: SK Hynix's Quarterly ROE
Sources: Bloomberg, GF Securities (Hong Kong) Brokerage
Risks
- 1) AI demand slowing down; 2) Geo-political risks; 3) Intensifying competition.
| Balance Sheet | [Table_FinanceDetail] | [Table_FinanceDetail] | [Table_FinanceDetail] | [Table_FinanceDetail] | KRW bn |
| FY24 | FY25 | FY26E | FY27E | FY28E | |
| Current assets | 42,279 | 69,458 | 263,273 | 415,390 | 581,162 |
| Cash and cash equivalents | 14,156 | 34,942 | 137,515 | 250,297 | 381,310 |
| Inventory | 13,314 | 14,289 | 32,730 | 40,517 | 56,112 |
| Accounts Receivable | 13,019 | 18,585 | 90,018 | 121,565 | 140,730 |
| Other current assets | 1,790 | 1,641 | 3,010 | 3,010 | 3,010 |
| Non-current assets | 77,576 | 106,650 | 231,546 | 310,819 | 407,657 |
| Long-term equity investment | - | - | - | - | - |
| Fixed assets | 60,157 | 77,503 | 132,899 | 212,172 | 309,010 |
| Other long-term assets | 17,419 | 29,147 | 98,647 | 98,647 | 98,647 |
| Total assets | 119,855 | 176,108 | 494,819 | 726,209 | 988,819 |
| Current liabilities | 24,961 | 37,379 | 63,460 | 64,303 | 66,249 |
| Accounts Payable | 2,277 | 2,848 | 4,757 | 5,889 | 8,156 |
| Short-term borrowings | 5,252 | 8,162 | 7,347 | 7,059 | 6,738 |
| Other current liabilities | 17,432 | 26,369 | 51,355 | 51,355 | 51,355 |
| Non-current liabilities | 20,974 | 18,062 | 24,548 | 23,004 | 21,542 |
| Long-term Debt | 17,431 | 14,086 | 11,724 | 10,180 | 8,718 |
| Other non-current liabilities | 3,543 | 3,976 | 12,824 | 12,824 | 12,824 |
| Total liabilities | 45,935 | 55,441 | 88,008 | 87,307 | 87,791 |
| Total Equity | 73,920 | 120,667 | 406,811 | 638,902 | 901,028 |
| Share Capital | 4,487 | 8,954 | 8,510 | 11,876 | 8,954 |
| Reserves | 357 | 1,478 | 41,476 | -136,009 | -345,543 |
| Capital adjustment | 65,418 | 106,577 | 353,167 | 759,376 | 1,233,96 |
| Minorities | 3,658 | 3,658 | 3,658 | 3,658 | 0 3,658 |
| Total Liabilities & Equity | 119,855 | 176,108 | 494,819 | 726,209 | 988,819 |
| Cash Flow Statement | KRW bn | ||||
| FY24 | FY25 | FY26E | FY27E | FY28E | |
| Operating cash flow | 29,796 | 53,373 | 259,060 | 471,005 | 567,859 |
| Profit for the year (GAAP) | 19,789 | 42,948 | 259,657 | 425,932 | 514,943 |
| Depreciation & amortization | 12,582 | 13,930 | 17,043 | 26,871 | 40,424 |
| Change in working capital | -4,931 | -4,096 | -2,600 | 38,203 | 32,492 |
| Others | 2,357 | 591 | -15,040 | -20,000 | -20,000 |
| Investing cash flow | -32,333 | -59,419 | -149,723 | -222,066 | -258,152 |
| Capex | -15,946 | -28,432 | -47,690 | -79,273 | -96,838 |
| Change in investments | -15,946 | -28,432 | -47,690 | -79,273 | -96,838 |
| Others | -441 | -2,555 | -54,343 | -63,521 | -64,475 |
| Free cash flow | 13,850 | 24,941 | 211,370 | 391,732 | 471,021 |
| Financing cash flow | -8,704 | -1,445 | -60,241 | -221,132 | -281,332 |
| Change in Capital | - | - | -68,019 | -195,866 | -235,510 |
| Net Change in Debt | -7,977 | 768 | -4,456 | -1,544 | -1,462 |
| Others | -726 | -2,213 | 12,234 | -23,722 | -44,360 |
| Total cash generated | -11,241 | -7,491 | 49,095 | 27,806 | 28,375 |
KRW bn Cash Flow Statement
42,279 69,458 263,273 415,390 581,162 Operating cash flow
3,010 Others
17,419 29,147 98,647 98,647 98,647 Others
17,432 26,369 51,355 51,355 51,355 Others
119,855 176,108 494,819 726,209 988,819 Key Financial Ratios
7,518 74,522 117,076 141,543 Gross debt/equity
19,135 42,549 259,828 425,932 514,943 Quick Ratio
| Income Statement | KRW bn | ||||
| FY24 | FY25 | FY26E | FY27E | FY28E | |
| Revenue | 66,193 | 97,147 | 372,735 | 660,606 | 806,986 |
| Cost of sales | -34,364 | -38,456 | -58,311 | -82,458 | -113,950 |
| Gross profit | 31,829 | 58,691 | 314,424 | 578,148 | 693,036 |
| Operating Expense | -8,361 | -11,484 | -23,793 | -35,140 | -36,550 |
| Operating profit | 23,468 | 47,207 | 290,631 | 543,008 | 656,486 |
| Interest Income | -995 | -430 | 172 | - | - |
| Interest Expense | - | - | - | - | - |
| Net other Non-op. Income/(Loss) | 1,414 | 3,689 | 43,375 | - | - |
| Pre-tax profit | 23,224 | 50,066 | 334,350 | 543,008 | 656,486 |
| Income tax | 4,089 | 7,518 | 74,522 | 117,076 | 141,543 |
| Profit for the year | 19,135 | 42,549 | 259,828 | 425,932 | 514,943 |
| Minority interest | - | - | - | - | - |
| Net profit to ord. equity | 19,135 | 42,549 | 259,828 | 425,932 | 514,943 |
| EPS (KRW) | 28,301 | 60,431 | 364,206 | 639,832 | 828,141 |
| Key Financial Ratios | |||||
|---|---|---|---|---|---|
| Growth | FY24 | FY25 | FY26E | FY27E | FY28E |
| Revenue growth | 102.0 | 46.8 | 283.7 | 77.2 | 22.2 |
| Operating profit growth | -403.6 | 101.2 | 515.7 | 86.8 | 20.9 |
| Net profit growth | -316.6 | 116.9 | 504.6 | 64.0 | 20.9 |
| Profitability | |||||
| Gross profit margin | 48.1 | 60.4 | 84.4 | 87.5 | 85.9 |
| Operating Profit Margin | 35.5 | 48.6 | 78.0 | 82.2 | 81.4 |
| Net profit margin | 28.9 | 43.8 | 69.7 | 64.5 | 63.8 |
| Key Ratio | |||||
| ROA | 17.4 | 28.8 | 77.5 | 69.8 | 60.1 |
| ROE | 25.9 | 35.3 | 63.9 | 66.7 | 57.2 |
| Stability | |||||
| Gross debt/equity | 62.1 | 45.9 | 21.6 | 13.7 | 9.7 |
| Interest Coverage | - | - | - | - | - |
| Current Ratio | 1.7 | 1.9 | 4.1 | 6.5 | 8.8 |
| Quick Ratio | 1.2 | 1.5 | 3.6 | 5.8 | 7.9 |
| Net debt/equity | 11.54 | Net Cash | Net Cash | Net Cash | Net Cash |
SanDisk (SNDK US)
NAND Demand Divergence
Initiate with Hold, TP $1,310: We believe that AI has reshaped the NAND demand, leading to a longer up-cycle than previous ones. However, the persistently weak consumer demand has led to a gradual slowdown in the price increase momentum of NAND. Therefore, we are cautious on pure NAND players. For SNDK, the company reported F1Q27 revenue of $11.0bn, +23% QoQ/+378% YoY; with Non-GAAP GPM at 85.1%, +0.5ppt QoQ. We still see NAND S/D imbalance continue into 2027 and to gradually be eased with supply increase. We now forecast SNDK's revenue to be $51/64bn, and EPS to be $242/324 in FY27E/28E ($295/309 in CY2027/2028). We transfer coverage with a Hold rating and a TP of $1,310, based on 4x CY27 BVPS of 327, also corresponds to 4.4x/4.2x CY27/CY28E PE.
Datacenter as a major pillar of growth, pressure from edge and consumer: AI has reshaped the memory hierarchy, leading NAND to gain content in datacenter storage. We now forecast datacenter's share of the total NAND bit to expand from 32% in CY25 to 50% in CY26, and reach 59%/64% in CY27/28. As for SNDK, the bit shipment to datacenter has grown from 12% of total bit shipment in F4Q25 to ~45% in F1Q27, which will be the main growth driver. However, the edge and consumer segment are facing pressure due to weak demand. We now forecast SNDK's blended ASP to reach $0.38/GB in CY27, +29% YoY, leading the Non-GAAP GPM to 86.7%, +2.5ppt YoY, followed by -15% YoY in ASP and Non-GAAP GPM of 82.7% in CY28.
More clear earnings and shareholder return based on NBMs: SNDK signed 8 NBMs with datacenter and edge customers by FY1Q27. This NBMs set the longer-term customer demand visibility (average 4+ years) and pricing stability with floors and ceilings, which guaranteed by $16.5bn cash deposits. The company also committed ~1/2 FY27E bit shipment and ~2/3 FY28 bit shipment under NBMs, leading to the sable OP margin guidance of ~75% until FY30, laying the foundation to return 100% excess cash to shareholders. During F4Q26-F1Q27, company has completed $9.5b share repurchases, accounting for ~4% of total outstanding shares. We now forecast $42/44bn FCF in CY27/28, equal to 25%/26% of current market cap. With a 60% cash return assumption, shareholder return stands at 15%/16%.
Risks: 1) AI demand slowing down; 2) Geo-political risks; 3) Intensifying competition.
| Profit forecast | FY24 | FY25 | FY26 | FY27E | FY28E |
|---|---|---|---|---|---|
| Revenue (m) | 6,663 | 7,355 | 20,248 | 51,179 | 63,952 |
| Revenue YoY (%) | 9.5 | 10.4 | 175.3 | 152.8 | 25.0 |
| Net profit (m) | -502 | 440 | 10,985 | 36,090 | 44,767 |
| Net profit YoY (%) | N/A | N/A | 2396.6 | 228.5 | 24.0 |
| EPS ($) | -4.6 | 3.04 | 70.1 | 242.2 | 323.5 |
| P/E | N/A | 378.3 | 16.1 | 4.6 | 3.5 |
| ROE (%) | -4.5 | 4.8 | 69.8 | 109.8 | 85.0 |
Source: Company data, GF Securities (Hong Kong) Brokerage.
数据来源:公司财务报表,⼴发证券发展研究中⼼
Elaine Fang
SFC CE No. BYE374 elainefang@gfgroup.com.hk
Jeff Pu, CFA
SFC CE No. BNO719 jeffpu@gfgroup.com.hk
Evan Lee
SFC CE No. BVI629 evanlee@gfgroup.com.hk
Figure 24: SanDisk's P&L
| (USD m) | FY26 | F1Q27 | F2Q27E | F3Q27E | F4Q27E | FY27E | F1Q28E | F2Q28E | F3Q28E | F4Q28E | FY28E |
|---|---|---|---|---|---|---|---|---|---|---|---|
| Sales | 20,248 | 11,031 | 12,867 | 12,784 | 14,497 | 51,179 | 15,947 | 16,744 | 15,430 | 15,831 | 63,952 |
| COGS | -5,757 | -1,647 | -1,832 | -1,719 | -1,875 | -7,074 | -2,084 | -2,297 | -2,295 | -2,503 | -9,179 |
| Gross profit | 14,491 | 9,384 | 11,034 | 11,065 | 12,622 | 44,105 | 13,863 | 14,447 | 13,135 | 13,328 | 54,773 |
| Opex | -1,791 | -513 | -558 | -603 | -697 | -2,371 | -777 | -821 | -749 | -771 | -3,117 |
| Operating profit | 12,700 | 8,871 | 10,477 | 10,462 | 11,925 | 41,734 | 13,086 | 13,626 | 12,386 | 12,557 | 51,656 |
| Non-op profit | -71 | 29 | 0 | 0 | 0 | 29 | 0 | 0 | 0 | 0 | 0 |
| Pre-tax profit | 12,629 | 8,900 | 10,477 | 10,462 | 11,925 | 41,763 | 13,086 | 13,626 | 12,386 | 12,557 | 51,656 |
| Income tax | -1,644 | -1,276 | -1,399 | -1,404 | -1,594 | -5,673 | -1,745 | -1,815 | -1,654 | -1,676 | -6,889 |
| Non-GAAP Net Income | 10,985 | 7,624 | 9,077 | 9,058 | 10,331 | 36,090 | 11,341 | 11,811 | 10,733 | 10,881 | 44,767 |
| Diluted EPS (US$) | 70.1 | 49.5 | 60.1 | 61.2 | 71.3 | 242.2 | 79.8 | 84.8 | 78.3 | 80.6 | 323.5 |
| Diluted shares | 157 | 154 | 151 | 148 | 145 | 145 | 142 | 139 | 137 | 135 | 135 |
| Margin analysis | |||||||||||
| Gross margin | 71.6% | 85.1% | 85.8% | 86.6% | 87.1% | 86.2% | 86.9% | 86.3% | 85.1% | 84.2% | 85.6% |
| Operating margin | 62.7% | 80.4% | 81.4% | 81.8% | 82.3% | 81.5% | 82.1% | 81.4% | 80.3% | 79.3% | 80.8% |
| Pre-tax margin | 62.4% | 80.7% | 81.4% | 81.8% | 82.3% | 81.6% | 82.1% | 81.4% | 80.3% | 79.3% | 80.8% |
| Effective tax rate | 13.0% | 14.3% | 13.4% | 13.4% | 13.4% | 13.6% | 13.3% | 13.3% | 13.4% | 13.3% | 13.3% |
| Growth (YoY%) | |||||||||||
| Sales | 175.3% | 377.9% | 325.3% | 114.9% | 61.7% | 152.8% | 44.6% | 30.1% | 20.7% | 9.2% | 25.0% |
| Operating profit | 1743.3% | 4888.6% | 863.6% | 150.5% | 67.0% | 228.6% | 47.0% | 31.0% | 18.6% | 5.3% | 23.8% |
| Net income | 2396.6% | 7133.0% | 1011.0% | 147.6% | 48.0% | 228.5% | 38.5% | 31.0% | 18.6% | 5.3% | 24.0% |
| EPS | 2203.1% | 3975.4% | 870.3% | 161.6% | 81.6% | 245.6% | 61.3% | 41.1% | 27.8% | 13.0% | 33.6% |
Sources: Company data, GF Securities (Hong Kong) Brokerage) Brokerage
Earnings Review
F1Q27 results review
SanDisk F1Q27 revenue came in at $11.0bn, +23% QoQ and +378% YoY. By end market, datacenter revenue reached $4.8bn, +61% QoQ. Edge revenue totaled $5.8bn, +7% QoQ, while consumer revenue was $0.4bn, -29% QoQ. Non-GAAP gross margin increased to 85.1%, up 0.5ppt QoQ, while Non-GAAP diluted EPS was $49.5, +26% QoQ and +3975% YoY.
We forecast revenue of $52/64bn in FY27E/FY28E
SanDisk's revenue for FY2027 and 2028 is projected to reach $52bn and $64bn, reflecting YoY growth of +153% and +25%, respectively. By end market, we forecast datacenter revenue to contribute 51%/65% of total revenue in FY27E/28E; Edge revenue to contribute 46%/33% of total revenue in FY27E/28E.
Valuation and Recommendation
Initiate at Hold with TP of $1,310
We transfer coverage with a Hold rating and a TP of $1,310, based on 4x CY27 BVPS of 327, also corresponds to 4.4x/4.2x CY27/CY28E PE, imply 21% stock upside potential.
Given that NAND companies have been publicly listed for a relatively short period-resulting in a scarcity of long-term valuation data-we are using valuations from the current NAND cycle as well as those of DRAM companies as points of reference. We apply for the same multiple for SanDisk as Micron, but using CY27 BVPS due to the less certainty of NAND cycle.
Figure 25: SanDisk's Forward P/E
Sources: Bloomberg, GF Securities (Hong Kong) Brokerage
Figure 26: SanDisk's Forward P/B
Sources: Bloomberg, GF Securities (Hong Kong) Brokerage
Sources: Bloomberg, GF Securities (Hong Kong) Brokerage
Risks
- 1) AI demand slowing down; 2) Geo-political risks; 3) Intensifying competition.
| Balance Sheet | [Table_FinanceDetail] | [Table_FinanceDetail] | [Table_FinanceDetail] | [Table_FinanceDetail] | USD mn |
| FY24 | FY25 | FY26 | FY27E | FY28E | |
| Current assets | 3,548 | 5,086 | 12,780 | 29,707 | 48,202 |
| Cash and cash equivalents | 328 | 1,481 | 4,762 | 17,682 | 34,239 |
| Inventory | 1,955 | 2,079 | 2,698 | 3,800 | 5,038 |
| Accounts Receivable | 935 | 1,068 | 4,708 | 7,613 | 8,314 |
| Other current assets | 330 | 458 | 612 | 612 | 612 |
| Non-current assets | 9,958 | 7,899 | 9,727 | 9,889 | 11,165 |
| Long-term equity investment | - | - | - | - | - |
| Fixed assets | 791 | 619 | 674 | 836 | 2,112 |
| Other long-term assets | 9,167 | 7,280 | 9,053 | 9,053 | 9,053 |
| Total assets | 13,506 | 12,985 | 22,507 | 39,596 | 59,368 |
| Current liabilities | 2,123 | 1,427 | 5,581 | 5,523 | 5,514 |
| Accounts Payable | 357 | 366 | 976 | 918 | 909 |
| Short-term borrowings | - | - | - | - | - |
| Other current liabilities | 1,766 | 1,061 | 4,605 | 4,605 | 4,605 |
| Non-current liabilities | 301 | 2,342 | 1,190 | 1,190 | 1,190 |
| Long-term Debt | - | 1,829 | - | - | - |
| Other non-current liabilities | 301 | 513 | 1,190 | 1,190 | 1,190 |
| Total liabilities | 2,424 | 3,769 | 6,771 | 6,713 | 6,704 |
| Total Equity | 11,082 | 9,216 | 15,736 | 32,883 | 52,663 |
| Common stock | 11,534 | 11,248 | 11,402 | 11,865 | 12,347 |
| Capital Reserves | -452 | -2,032 | 4,334 | 21,018 | 40,317 |
| Retained earnings | - | - | - | - | - |
| Other equities | - | - | - | - | - |
| Total Liabilities & Equity | 13,506 | 12,985 | 22,507 | 39,596 | 59,368 |
| Cash Flow Statement | USD mn | ||||
| FY24 | FY25 | FY26 | FY27E | FY28E | |
| Operating cash flow | -309 | 84 | 11,671 | 36,754 | 47,111 |
| Profit for the year (GAAP) | -672 | -1,641 | 11,433 | 36,190 | 44,279 |
| Depreciation & amortization | - | 109 | 149 | 173 | 323 |
| Change in working capital | - | -240 | -2,606 | -3,609 | -1,491 |
| Others | 363 | 1,856 | 2,695 | 4,000 | 4,000 |
| Investing cash flow | 210 | 556 | -1,386 | -175 | -1,439 |
| Capex | -29 | -204 | -177 | -335 | -1,599 |
| Changes in investment | - | - | 25 | - | - |
| Others | 239 | 760 | -1,234 | 160 | 160 |
| Free cash flow | -338 | -120 | 11,494 | 36,419 | 45,512 |
| Financing cash flow | 136 | 518 | -7,001 | -23,660 | -29,115 |
| Change in Capital | - | 5 | -4,500 | -21,852 | -27,307 |
| Net Change in Debt | - | 1,838 | -1,900 | - | - |
| Others | 136 | -1,325 | -601 | -1,808 | -1,808 |
| Total cash generated | 37 | 1,158 | 3,284 | 12,920 | 16,557 |
USD mn Cash Flow Statement
5,086 12,780 29,707 48,202 Operating cash flow
612 Others
9,053 Others
4,605 Others
13,506 12,985 22,507 39,596 59,368 Key Financial Ratios
6,889 Gross debt/equity
440 10,985 36,090 44,767 Quick Ratio
| Income Statement | USD mn | ||||
| FY24 | FY25 | FY26 | FY27E | FY28E | |
| Revenue | 6,663 | 7,355 | 20,248 | 51,179 | 63,952 |
| Cost of sales | -5,607 | -5,127 | -5,757 | -7,074 | -9,179 |
| Gross profit | 1,056 | 2,228 | 14,491 | 44,105 | 54,773 |
| Operating Expense | -1,365 | -1,539 | -1,791 | -2,371 | -3,117 |
| Operating profit | -309 | 689 | 12,700 | 41,734 | 51,656 |
| Interest Income | -12 | -22 | -70 | -51 | - |
| Interest Expense | 40 | 63 | 73 | 2 | - |
| Net other Non-op. Income/(Loss) | 7 | 61 | -631 | -490 | - |
| Pre-tax profit | -346 | 580 | 12,629 | 41,763 | 51,656 |
| Income tax | 156 | 140 | 1,644 | 5,673 | 6,889 |
| Profit for the year | -502 | 440 | 10,985 | 36,090 | 44,767 |
| Minority interest | - | - | - | - | - |
| Net profit to ord. equity | -502 | 440 | 10,985 | 36,090 | 44,767 |
| EPS (US$) | -4.63 | 3.0 | 70.1 | 242.2 | 323.5 |
| Key Financial Ratios | |||||
|---|---|---|---|---|---|
| Growth | FY24 | FY25 | FY26 | FY27E | FY28E |
| Revenue growth | 9.5 | 10.4 | 175.3 | 152.8 | 25.0 |
| Operating profit growth | - | - | 1743.3 | 228.6 | 23.8 |
| Net profit growth | - | - | 2396.6 | 228.5 | 24.0 |
| Profitability | |||||
| Gross profit margin | 15.8 | 30.3 | 71.6 | 86.2 | 85.6 |
| Operating Profit Margin | -4.6 | 9.4 | 62.7 | 81.5 | 80.8 |
| Net profit margin | -7.5 | 6.0 | 54.3 | 70.5 | 70.0 |
| Key Ratio | |||||
| ROA | -3.7 | 3.3 | 61.9 | 116.2 | 90.5 |
| ROE | -4.5 | 4.8 | 69.8 | 109.8 | 85.0 |
| Stability | |||||
| Gross debt/equity | 21.9 | 40.9 | 43.0 | 20.4 | 12.7 |
| Interest Coverage | -7.7 | 10.2 | 174.0 | - | - |
| Current Ratio | 1.7 | 3.6 | 2.3 | 5.4 | 8.7 |
| Quick Ratio | 0.8 | 2.1 | 1.8 | 4.7 | 7.8 |
| Net debt/equity | Net Cash | 3.8 | Net Cash | Net Cash | Net Cash |
Rating definitions Benchmark: Hang Seng Index (Hong Kong)
Company ratings Buy
Hold Stock expected to outperform benchmark by more than 10%
Expected stock relative performance ranges between -10% and 10%
Underperform Stock expected to underperform benchmark by more than 10%
Sector ratings Positive
Neutral Sector expected to outperform benchmark by more than 10%
Expected sector relative performance ranges between -10% and 10%
Cautious Sector expected to underperform benchmark by more than 10%
Hong Kong Company
Address GF Securities (Hong Kong) Brokerage Limited
27/F, GF Tower, 81 Lockhart Road, Wan Chai, Hong Kong
Telephone
(852) 37191111
Email elainefang@gfgroup.com.hk
Disclaimer
This report has been prepared by GF Securities (Hong Kong) Brokerage Limited ('GF Securities (Hong Kong) Brokerage'). According to the laws, regulations and regulatory requirements in different countries and regions, this report is distributed by GF Securities (Hong Kong) Brokerage with relevant legal and compliant operation qualifications in these countries and regions.
GF Securities (Hong Kong) Brokerage is licensed by the Securities and Futures Commission of Hong Kong ('SFC') to conduct Type 4 Regulated Activity 'Advising on Securities'. It is regulated by the SFC, and is responsible for the distribution of this report in Hong Kong. Information about the qualifications of the research analyst(s) who is(are) the author(s) of this report as licensed by the SFC are disclosed in the section where research analyst names are shown.
The research analyst(s) primarily responsible for the content of this report, in whole or in part, certifies that with respect to the company or relevant securities that the analyst(s) covered in this report: 1) all of the views expressed accurately reflect his or her personal views on the company or relevant securities mentioned herein; and 2) no part of his or her remuneration was, is, or will be, directly or indirectly, in connection with his or her specific recommendations or views expressed in this report.
This report is published solely for information purpose and does not constitute an offer to buy or sell any securities or a solicitation of an offer to buy, or recommendation for investment in, any securities.
The securities mentioned in this report may not be allowed to be sold in certain jurisdictions. No action has been taken to permit the distribution of the research report to any person in any jurisdiction that the circulation or distribution of such research report is unlawful. This report is distributed solely to clients or designated institutions authorized by GF Securities (Hong Kong) Brokerage, and is not distributed publicly. It is distributed to certain clients based on the conclusion that they are able to assess investment risks independently, execute investment decisions independently and assume corresponding risks independently.
This report has been issued and based on information obtained from sources generally available to the public and believed by the research analyst(s) to be reliable but which has not been independently verified. No representation or warranty, either express or implied, is made by GF Securities (Hong Kong) Brokerage as to their accuracy and completeness of the information contained in this report. GF Securities (Hong Kong) Brokerage accepts no liability for all loss arising from the use of the materials presented in this report, unless is excluded by applicable laws or regulations. Please be aware of the fact that investments involve risks and the price of securities may be fluctuated and therefore return may be varied, past results do not guarantee future performance. Any recommendation contained in this report does not have regard to the specific investment objectives, financial situation and the particular needs of any individuals. This report is not to be taken in substitution for the exercise of judgment by respective recipients of this report, where necessary, recipients should obtain professional advice before making investment decisions.
GF Securities (Hong Kong) Brokerage may have issued, and may in the future issue, other communications that are inconsistent with, and reach different conclusions from, the information presented in the research report. The points of view, opinions and analytical methods adopted in the research report are solely expressed by the analysts but not that of GF Securities (Hong Kong) Brokerage or its affiliates. The information, opinions and forecasts presented in the research report are the current opinions of the analysts as of the date appearing on this material only which may subject to change at any time without notice. The salesperson, dealer or other professionals of GF Securities (Hong Kong) Brokerage may deliver opposite points of view to their clients and the proprietary trading division with respect to market commentary or dealing strategy either in writing or verbally. The proprietary trading division of GF Securities (Hong Kong) Brokerage may have different investment decision which may be contrary to the opinions expressed in the research report. GF Securities (Hong Kong) Brokerage or its affiliates or respective directors, officers, analysts and employees related to research report business may have rights and interests in securities mentioned in the research report. Recipients should be aware of relevant disclosure of interest (if any) when reading this report.
GF Securities (Hong Kong) Brokerage and its affiliates may be seeking or building business relationships with company(ies) mentioned in this report. Therefore, investors should consider the impact on the independence of this report by GF Securities (Hong Kong) Brokerage and its affiliates due to potential conflicts of interests. Investors should not make any investment decisions based solely on the contents of this report. Investors should make their own investment decisions and bear their own risk. No written or verbal commitment of sharing gains or losses from securities investments in any form shall be effective.
This report may contain and/or describe/present factual historical information on prices of Futures contracts (the 'information'). Please note that this information is solely for the purpose of forming part of the argument/grounds/evidence in our research methodology/analysis to support our conclusion on our view of the relevant industry/company mentioned. It does not, by any means (express or implied) to be associated with or constituted as SFC Type 5 Regulated Activity (Advising on futures contracts).
Important Notices
GF Securities Co. Ltd and its affiliates may be seeking or building business relationships with companies mentioned in this report. Therefore, investors should consider the impact on the independence of this report by GF Securities Co. Ltd and its affiliates due to potential conflicts of interests. Investors should not make any investment decisions based solely on the contents of this report.
The research analyst(s) primarily responsible for the content of this research report, in whole or in part, certifies that with respect to the company or relevant securities that the analyst(s) covered in this report: (1) all of the views expressed accurately reflect his or her personal views on the company or relevant securities mentioned herein; and (2) no part of his or her remuneration was, is, or will be, directly or indirectly, in connection with his or her specific recommendations or views expressed in this research report.
The remuneration for the production of this report by research staff is determined based on various factors including the quality of research, client review and workload, and it is also affected by factors including GF Securities' overall revenue, part of which is generated from GF Securities' investment banking business.
This report is distributed solely to clients or designated institutions authorized by GF Securities, and is not distributed publicly. It can only be used by the targeted recipients who have the obligation to maintain confidentiality. GF Securities does not view any persons who have received or read this report through other means as its clients.
This report is distributed to a certain client based on the conclusion that this client is deemed to be able to assess investment risks independently, execute investment decisions independently and assume corresponding risks independently.
The contents of this report is for reference only. Information contained or opinions expressed in this report does not constitute an offer or inquiry. Customers should not substitute their independent judgment with this report or make decisions based on this report.
This report is published solely for information purpose and does not constitute an offer to buy or sell any securities or a solicitation of an offer to buy, or recommendation for investment in, any securities. The research report is intended solely for use of the clients of GF Securities. The securities mentioned in the research report may not be allowed to be sold in certain jurisdictions. No action has been taken to permit the distribution of the research reports to any person in any jurisdiction that the circulation or distribution of such research report is unlawful. No representation or warranty, either express or implied, is made by GF Securities as to their accuracy and completeness of the information contained in the research report. GF Securities accepts no liability for all loss arising from the use of the materials presented in the research report, unless is excluded by applicable laws or regulations. Please be aware of the fact that investments involve risks and the price of securities may be fluctuated and therefore return may be varied, past results do not guarantee future performance. Any recommendation contained in the research report does not have regard to the specific investment objectives, financial situation and the particular needs of any individuals. The report is not to be taken in substitution for the exercise of judgment by respective recipients of the report, where necessary, recipients should obtain professional advice before making investment decisions.
GF Securities may have issued, and may in the future issue, other communications that are inconsistent with, and reach different conclusions from, the information presented in the research report. The points of view, opinions and analytical methods adopted in the research report are solely expressed by the analysts but not that of GF Securities or its affiliates. The information, opinions and forecasts presented in the research report are the current opinions of the analysts as of the date appearing on this material only which may subject to change at any time without notice. The salesperson, dealer or other professionals of GF Securities may deliver opposite points of view to their clients and the proprietary trading division with respect to market commentary or dealing strategy either in writing or verbally. The proprietary trading division of GF Securities may have different investment decision which may be contrary to the opinions expressed in the research report. GF Securities or its affiliates or respective directors, officers, analysts and employees related to research report business may have rights and interests in securities mentioned in the research report. Recipients should be aware of relevant disclosure of interest (if any) when reading the report.
[Table_InterestDisclosure]
Disclosure of Interests
1) The research analyst(s) and his/her associate has not served as an officer of the company(ies) mentioned in this report, and does not have any financial interests in the company(ies) mentioned in this report.
2) GF Securities (Hong Kong) Brokerage and/or its affiliates does not have any financial interests and has not invested in interests aggregate to an amount equal to or more than (i) 1% of the market capitalization; or (ii) 1% of the issued share capital, or issued units, in the company(ies) mentioned in this report.
3) GF Securities (Hong Kong) Brokerage and/or its affiliates does not have any market making activities, and has not employed any individual(s) serving as officer(s) of the company(ies) mentioned in this report.
4) GF Securities (Hong Kong) Brokerage and/or its affiliates does not have any investment banking relationship in Hong Kong with the company(ies) mentioned in this report in the past 12 months.
[Table_Copyright]
Copyright © GF Securities (Hong Kong) Brokerage
Without the prior written consent obtained from GF Securities (Hong Kong) Brokerage, any part of the materials contained herein should not (i) in any forms be copied or reproduced or (ii) be re-disseminated.