PDF 原檔:報告_JPM_富世達6805_20260929_original.pdf
圖片清單(已驗證 2026-09-30)
ingest 時建立的「眼見為憑」圖片索引,是 lib/ 嵌圖的唯一真相來源;嵌入時只從這裡挑分類為「真資料圖」的,不照 trimmed 引用順序猜。
| 檔名 | size | 分類 | 親眼所見內容 |
|---|---|---|---|
報告_JPM_富世達6805_20260929_006.png |
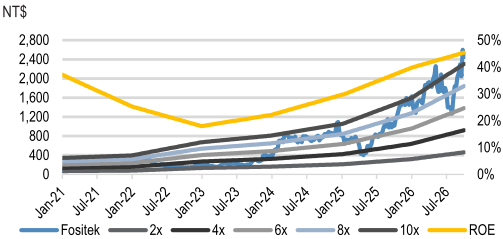
40KB | 真資料圖 | 折線圖:Fositek 股價(藍線)與 2x/4x/6x/8x/10x P/E 估值帶(灰階線)疊加 ROE(黃線,右軸 %),2021-01 至 2026-07 |
報告_JPM_富世達6805_20260929_011.png |
147KB | 真資料圖 | Fositek (6805.TW) Price Chart:股價走勢圖搭配歷次 OW 評等與目標價標註(NT$1,030→2,600)及右側完整日期/評等/股價/目標價表格(2024-12-10 至 2026-05-05) |
<40KB(001~005/007~010)未逐張 Read,預設 logo/裝飾圖,未列入清單。
原始內容
Fositek
Meaningful QD spec upgrades with more customer wins & TAM e pansion; 3Q26 preview with GM upside; Assume coverage at OW with PT of NT$4,000
Fositek's earnings upgrade cycle looks set to accelerate as Nvidia's next-gen Rubin ltra raises both QD content and spec, with margin upside arriving earlier than the market is pricing. We assume coverage of Fositek with an Overweight rating, and a Dec-27 PT of NT$4,000, based on 22x 2028E P/E (implying ~60% potential upside from the current share price). Our 2027/2028 EPS is 12%/40% above BBGe consensus, reflecting three drivers: 1) near-term gross margin upside on mix with stronger server QD revenue contribution; 2) D TAM expansion into higher-spec rack manifold Ds with continued share gains/new customer wins from VR200 in 2H26; and 3) VR Ultra (VRU) spec upgrade where ZQD adoption at ~2x ASP lifts QD content per VR NVL72 rack ~100%. We believe market conviction should increase on structural QD spec upgrades, share gains, and another GM beat. With this note, we transfer coverage of Fositek to Megan Hsueh.
- Nvidia VR Ultra partially upgrading to Z D with ~100% content growth; Fositek the major winner with new customer wins & TAM expansion to higher-spec Ds. AI rack liquid-cooling content is moving from a volume story to a spec and content growth story, and Fositek sits at the center of that shift. Nvidia's next-gen VR platform likely upgrades portions of the system from MQD/ QD to higher-spec ZQD, targeting better flow rate and lower leakage, which raises both content and ASP. Our work implies total QD content per VR NVL72 rack rises ~100% vs VR200/GB300, as ZQD is adopted across compute tray modules, tray entry points, and rack manifold sockets. The key 'why now' comes from the 2H26 transition, where Fositek finally enters into the higher-spec rack manifold QDs ( QD08 now) TAM beyond in-rack QDs from VR200. In addition, the company is gaining share by winning new cold plate customers (besides AVC) from VR200 as well, and continues to sample to more, which could be future upside, in our view.
- 3 26 preview: likely another quarter of solid GM beat, with better product mix on significant D shipment growth. Our 3Q26 GM estimate is ~37% (vs BBGe consensus at ~35%), implying further rapid growth from 34% in 2Q26, driven by the better-than-expected product mix enhancement from: 1) the rapid growth in server revenue contribution (exceeding 80% in July + Aug vs 55% in 2Q26) and 2) increasing shipments of higher-spec QDs (e.g., starting to ship QD08 for rack manifolds from 2H26). Reported July and August revenues each grew 13% MoM and 12% MoM, respectively, and we believe the decent order momentum will continue into September with another >10% MoM growth (based on JPMe) thanks to VR200 QD and initial new smartphone hinge shipments, which should add up to ~NT$4.6bn (+23% QoQ; +29% YoY), largely in line with current consensus.
- Understanding valuation as a D spec upgrade winner. Fositek is now trading at 22x 12-month fwd P/E, in the middle of its historical valuation range (15-30x). We apply a 22x 2028E P/E valuation to reflect a multi-quarter earnings upgrade path tied to VR200 share gains and VR -driven content expansion. The shares have moved up ~55% in the past 3 months vs Taiex ~6%;
Sour es for: Style Exposure - J.P. Morgan Global Markets Strategy; all other tables are ompany data and J.P. Morgan estimates.
See page 12 for ana yst certification and important disc osures, inc uding non-US ana yst disc osures.
Overweight
68 5.TW, 68 5 TT Price (29 Sep 26):NT$2,515.00
▲Price Target (Dec-27):NT$4, . Prior (Jun-27):NT$2,600.00
Technology
Megan Hsueh AC
(886-2) 2725-9249
J.P. Morgan Securities (Taiwan) Limited
Gokul Hariharan
(852) 2800-8564 gokul.hariharan@jpmorgan.com J.P. Morgan Securities (Asia Pacific) Limited/ J.P. Morgan Broking (Hong Kong) Limited
Albert Hung
(886-2) 2725-9875 albert.hung@jpmchase.com
J.P. Morgan Securities (Taiwan) Limited/ J.P. Morgan Securities (Asia Pacific) Limited/ J.P. Morgan Broking (Hong Kong) Limited
| Key Changes (FYE Dec) | Key Changes (FYE Dec) - Prev | Key Changes (FYE Dec) - Cur | Key Changes (FYE Dec) - Δ |
|---|---|---|---|
| Adj. EPS - 26E (NT$) | 61.17 | 63.44 | 3.7% |
| Adj. EPS - 27E (NT$) | 104.23 | 119.95 | 15.1% |
| Quarterly Forecasts (FYE Dec) | Quarterly Forecasts (FYE Dec) | Quarterly Forecasts (FYE Dec) | Quarterly Forecasts (FYE Dec) |
| Adj. | 2025A | 2026E | 2027E |
| Q1 | 5.20 | 13.38A | 23.31 |
| Q2 | 4.82 | 12.39A | 29.06 |
| Q3 | 10.02 | 16.57 | 31.85 |
| Q4 | 10.96 | 21.10 | 35.73 |
| FY | 31.00 | 63.44 | 119.95 |
Style Exposure
| Quant - Factors | Current - %Rank | Hist %Rank (1=Top) - 6M | Hist %Rank (1=Top) - 1Y | Hist %Rank (1=Top) - 3Y | Hist %Rank (1=Top) - 5Y |
|---|---|---|---|---|---|
| Value | 72 | 08 | 75 | 78 | 78 |
| Growth | 17 | 7 | 7 | 1 | 1 |
| Momentum | 58 | 24 | 15 | 30 | 9 |
| Quality | 18 | 21 | 40 | 32 | 6 |
| Low Vol | 86 | 95 | 97 | 95 | 96 |
Price Performance
— 6805.TW Price (NT$)
— TSE (rebased)
| YTD | 1m | 3m | 12m | |
|---|---|---|---|---|
| Abs | 54.8% | 7.2% | 54.8% | 160.1% |
| Rel | -9.7% | 4.4% | 48.9% | 75.6% |
Company Data
| Shares O/S (mn) | 69 |
|---|---|
| 52-week range (NT$) | 2,750.00-978.90 |
| Market ap ($ mn) | 5,425 |
| Ex hange rate | 31.78 |
| Free float (%) | 63.7% |
| 3M ADV (mn) | 1.57 |
| 3M ADV ($ mn) | 92.2 |
| Volatility (90 Day) | 80 |
| Index | TAIEX |
| BBG ANR (Buy | Hold | Sell) | 11|0|0 |
Key Metrics (FYE Dec)
| NT$ in mi ions | FY25A | FY26E | FY27E | FY28E |
|---|---|---|---|---|
| Financia Estimates | ||||
| Revenue | 12,414 | 18,222 | 30,103 | 41,106 |
| Adj. EBIT | 2,524 | 5,421 | 10,373 | 15,397 |
| Adj. EBITDA | 2,823 | 5,800 | 10,846 | 15,963 |
| Adj. net in ome | 2,125 | 4,349 | 8,223 | 12,214 |
| Adj. EPS | 31.00 | 63.44 | 119.95 | 178.17 |
| BBG EPS | 31.30 | 62.75 | 106.65 | 127.12 |
| Cashflow from operations | 3,014 | 2,674 | 8,763 | 12,495 |
| FCFF | 2,667 | 2,234 | 8,360 | 12,092 |
| Margins and Growth | ||||
| Revenue Growth Y/Y (%) | 51.6% | 46.8% | 65.2% | 36.6% |
| EBIT margin | 20.3% | 29.7% | 34.5% | 37.5% |
| EBIT Growth Y/Y (%) | 110.8% | 114.7% | 91.3% | 48.4% |
| EBITDA margin | 22.7% | 31.8% | 36.0% | 38.8% |
| EBITDA Growth Y/Y (%) | 102.5% | 105.5% | 87.0% | 47.2% |
| Net margin | 17.1% | 23.9% | 27.3% | 29.7% |
| Adj. EPS growth | 73.2% | 104.6% | 89.1% | 48.5% |
| Ratios | ||||
| Adj. tax rate | 16.5% | 21.1% | 21.0% | 21.0% |
| Interest over | NM | NM | NM | NM |
| Net debt/Equity | NM | NM | NM | NM |
| Net debt/EBITDA | NM | NM | NM | NM |
| ROE | 33.4% | 48.0% | 58.0% | 55.9% |
| Va uation | ||||
| FCFF yield | 1.5% | 1.3% | 4.8% | 7.0% |
| Dividend yield | 0.3% | 0.5% | 1.0% | 1.9% |
| EV/Revenue | 13.3 | 9.0 | 5.2 | 3.6 |
| EV/EBITDA | 58.6 | 28.2 | 14.5 | 9.3 |
| Adj. P/E | 81.1 | 39.6 | 21.0 | 14.1 |
Summary Investment Thesis and Valuation
Investment Thesis
We are OW on Fositek for its strong earnings growth potential over the next few years, driven by rising server project wins with an increasing customer base and structural margin expansion with a favourable mix.
Valuation
Our Dec-27 PT of NT$4,000 is based on a 22x 2028E P/E, in the middle of its historical valuation range of 15-30x since its OTC listing in 2020, which we believe is warranted by its strong earnings potential.
| Factors | 6M Corr | 1Y Corr |
|---|---|---|
| Market: MSCI Asia Pac ex JP | 0.20 | 0.27 |
| Region: Taiwan | 0.32 | 0.22 |
| Macro: | ||
| Citi Economic Surprise - EM | 0.52 | 0.43 |
| Markit EM Composite PMI SA | 0.33 | 0.22 |
| HSI Volatility Index | 0.06 | -0.20 |
| Quant Styles: | ||
| Size | 0.23 | 0.24 |
| Quality | 0.13 | 0.20 |
| Momentum | 0.13 | 0.17 |
Sour e: J.P. Morgan Global Markets Strategy for Performan e Drivers; ompany data, Bloomberg Finan e L.P. and J.P. Morgan estimates for all other tables. Note: Pri e history may not be omplete or exa t.
we believe the share price will continue to outperform in the next 6-12 months, as we see Fositek as a primary winner in the QD spec upgrade trend, with its VR200 QD share reaching 50+% (built from 30-40% AVC plus 10-20% incremental share from a new customer), and further upside from more new cold plate customer wins in Taiwan and Japan (now sampling). Key risks include slower VR spec adoption, weaker-thanexpected share capture, pricing pressure, and any reversal in GM trajectory.
Tab e 1: Meaningfu QD spec upgrades in VRU with ~100% content increase per NVL72 rack
| GB300 NVL72 | Vera Rubin NVL72 | Vera Rubin Ultra (VRU) NVL72 | |
|---|---|---|---|
| Compute tray | 18 trays | 18 trays | 18 trays |
| - inside-tray QD | 8*UQD | 20*MQD | 12MQD+8ZQD06+8*miniQD |
| - out-of-tray QD | 2*UQD (plug) | 2*UQD (plug) | 2*ZQD14 (plug) |
| Switch tray | 9 trays | 9 trays | 9 trays (1.5U; incl. 2 layers of board) |
| - inside-tray QD | 18*MQD | 4*MQD | 8*MQD (given 2 layers/boards) |
| - out-of-tray QD | 2*UQD (plug) | 2*UQD (plug) | 2*ZQD14 (plug) |
| Rack manifold (44U) | 88*UQD08 (socket) | 88*UQD08 (socket) | 88*ZQD014 (socket) |
| Total QD content per NVL72 rack | ~US$9,400 | ~US$11,000 | ~US$20,500 |
Sour e: J.P. Morgan estimates, Company data.
Earnings estimates
JPM's above-consensus forecasts
Our 2026E/27E/28E EPS forecasts are 1%/12%/40% above Bloomberg consensus, reflecting: 1) near-term GM upside from better product mix with stronger-than-expected server QD growth, 2) QD new customer wins and TAM expansion to the higher-spec rack manifold QDs from VR200 in 2H26, and 3) meaningful Quick Disconnect (QD) spec upgrade potential in Nvidia's next-gen VR ltra (VR ) system (upgrading to ZQD with 2x ASP) from 2Q/2H27.
Tab e 2: J.P. Morgan estimates vs B oomberg consensus
NT$mn, %
| (NT$M) | JPMe - 3Q26E | JPMe - 4Q26E | JPMe - 2026E | JPMe - 2027E | JPMe - 2028E | Bloomberg - 3Q26E | Bloomberg - 4Q26E | Bloomberg - 2026E | Bloomberg - 2027E | Bloomberg - 2028E | Diff - 3Q26E | Diff - 4Q26E | Diff - 2026E | Diff - 2027E | Diff - 2028E |
|---|---|---|---|---|---|---|---|---|---|---|---|---|---|---|---|
| Sales | 4,614 | 5,684 | 18,222 | 30,103 | 41,106 | 4,582 | 5,577 | 17,888 | 27,801 | 33,091 | 1% | 2% | 2% | 8% | 24% |
| Gross profit | 1,690 | 2,115 | 6,430 | 11,871 | 17,369 | 1,644 | 2,022 | 6,216 | 10,437 | 12,834 | 3% | 5% | 3% | 14% | 35% |
| GM | 36.6% | 37.2% | 35.3% | 39.4% | 42.3% | 35.9% | 36.3% | 34.7% | 37.5% | 38.8% | 75 bps | 95 bps | 54 bps | 189 bps | 347 bps |
| Operating profit | 1,432 | 1,826 | 5,421 | 10,373 | 15,397 | 1,401 | 1,690 | 5,239 | 8,996 | 10,402 | 2% | 8% | 3% | 15% | 48% |
| OPM | 31.0% | 32.1% | 29.7% | 34.5% | 37.5% | 30.6% | 30.3% | 29.3% | 32.4% | 31.4% | 45 bps | 180 bps | 46 bps | 210 bps | 602 bps |
| Net Income | 1,136 | 1,447 | 4,349 | 8,223 | 12,214 | 1,139 | 1,373 | 4,291 | 7,273 | 8,378 | 0% | 5% | 1% | 13% | 46% |
| EPS (NT$) | 16.6 | 21.1 | 63.4 | 120.0 | 178.2 | 16.7 | 20.2 | 62.7 | 106.6 | 127.1 | -1% | 4% | 1% | 12% | 40% |
Sour e: Bloomberg Finan e L.P., J.P. Morgan estimates.
Key risks to our estimates
- Slower qualification in AI server rail kit customers/projects: Fositek has started shipping its rail kit for some general server projects since last year and some aircooled AI servers rail kits since 3Q26. Also, it will start shipping some VR200 lowcount rail kits in 2H26 for one CSP customer, and is qualifying a few more now. If qualification takes longer than expected given the stronger-than-expected competition from existing suppliers, it would be a risk to Fositek's server rail kit business outlook.
- Continued weakening foldable phone market demand: If foldable phone penetration slows down amid the weakening smartphone market, this would still be a downside for Fositek, as one of the leading hinge suppliers with still ~30% revenue coming from it.
Valuation
We derive our Dec-27 price target of NT$4,000 based on 22x 2028E P/E. This is in the middle of its historical valuation range of 15-30x P/E, as we expect an earnings revisions cycle (based on our above-consensus estimates in 2027-28) should support this valuation.
Tab e 3: Fositek's historica trading mu tip es (November 2020 OTC isting to date)
| x | 12M trailing P/E | 12M fwd P/E | 12M trailing P/B | 12M fwd P/B |
|---|---|---|---|---|
| Standard Deviation | 13.1 | 6.9 | 3.7 | 2.5 |
| Max | 71.7 | 41.4 | 18.3 | 11.8 |
| Minimum | 14.5 | 9.4 | 3.1 | 2.1 |
| Median | 35.4 | 21.0 | 8.1 | 6.1 |
| Average | 34.7 | 22.0 | 8.2 | 5.9 |
Sour e: Bloomberg Finan e L.P., J.P. Morgan estimates.
Figure 1: Fositek's 1yr fwd P/E vs mean
Sour e: Bloomberg Finan e L.P., J.P. Morgan estimates.
Figure 3: Fositek's 1yr fwd P/B vs mean
Sour e: Bloomberg Finan e L.P., J.P. Morgan estimates.
Figure 2: Fositek's 1yr fwd P/E
Sour e: Bloomberg Finan e L.P., J.P. Morgan estimates.
Figure 4: Fositek's 1yr fwd P/B
Sour e: Bloomberg Finan e L.P., J.P. Morgan estimates.
Financial Analysis
We forecast Fositek's revenue to increase 47%/65%/37% YoY in 2026E/27E/28E, supported by the company's QD TAM expansion into higher-spec rack manifold QDs with continued share gains/new customer wins from VR200 in 2H26, along with VR ltra spec upgrades (partially from MQD/ QD to ZQD with ~2x ASP growth).
Fositek's 2Q26 gross margin expanded to 34% thanks to continued QD yield enhancement. We believe the company's margin will continue to surprise to the upside in 2H26-2028, driven by the near-term favourable product mix from stronger server QD growth and longer-term higher-spec product shipments, which should support our gross margin forecasts of 35%/39%/42% in 2026E/27E/28E, respectively. The stronger GM growth also serves as the key driver to our bottom-line EPS growth of 105%/89%/49% in 2026E/27E/28E, respectively.
Figure 5: Fositek's revenue and revenue YoY growth
NT$bn, %
Sour e: Company data, J.P. Morgan estimates.
Figure 7: Fositek's OP and OPM
NT$bn, %
Sour e: Company data, J.P. Morgan estimates.
Figure 6: Fositek's GP and GPM
NT$bn, %
Sour e: Company data, J.P. Morgan estimates.
Figure 8: Fositek's EPS and EPS YoY growth
NT$bn, %
Sour e: Company data, J.P. Morgan estimates.
Figure 9: Income statement
| (NT$ in Mn, year-end December) | 2024 - 1Q | 2024 - 2Q | 2024 - 3Q | 2024 - 4Q | 2025 - 1Q | 2025 - 2Q | 2025 - 3Q | 2026E - 4Q | 2026E - 1Q | 2026E - 2Q | 2026E - 3QE | 4QE | 1QE | 2QE | 3QE 4QE | 2027E - 1QE | 2027E - 3QE | 2027E - 2QE 4QE 2028E | 2027E - 2024 | 2025 | 2026E | 2027E | 2028E | 2028E | 2028E | 2028E | 2028E | 2028E | 2028E | ||
|---|---|---|---|---|---|---|---|---|---|---|---|---|---|---|---|---|---|---|---|---|---|---|---|---|---|---|---|---|---|---|---|
| Revenue | 1,711 | 1,719 | 1,988 | 2,770 | 2,252 | 2,620 | 3,566 | 3,976 | 4,184 | 3,740 | 4,614 | 5,684 | 6,099 | 7,339 | 7,854 8,811 | 8,708 | 9,987 | 10,900 | 11,511 | 8,188 | 12,414 18,222 | 30,103 | 41,106 | 41,106 | 41,106 | 41,106 | 41,106 | 41,106 | 41,106 | ||
| D&A | 39 | 43 | 63 | 51 | 73 | 74 | 76 | 76 | 88 | 92 | 97 | 102 | 110 | 115 | 121 127 | 133 | 138 | 144 | 150 | 196 | 379 | 473 | 566 | 298 | |||||||
| COGS | 1,297 | 1,321 | 1,505 | 2,238 | 1,753 | 1,990 | 2,579 | 2,821 | 2,832 | 2,467 | 2,924 | 3,569 | 3,772 4,459 | 4,707 5,294 | 5,128 | 5,772 | 6,220 | 6,616 | 9,144 11,791 | 18,232 | 23,737 | 23,737 | 23,737 | 23,737 | 23,737 | 23,737 | 23,737 | 23,737 | |||
| Gross profit | 414 | 398 | 484 | 532 | 498 | 631 | 986 | 1,155 | 1,352 | 1,273 | 1,690 | 2,115 | 2,327 | 2,880 | 3,147 | 3,517 | 3,580 | 4,215 | 4,679 | 4,895 | 1,827 | 3,270 6,430 | 11,871 | 17,369 | 17,369 | 17,369 | 17,369 | 17,369 | 17,369 | 17,369 | |
| Operating expense | 144 | 145 | 152 | 188 | 133 | 134 | 194 | 286 | 232 | 230 | 258 | 290 | 311 | 367 | 393 | 427 | 435 | 489 | 518 | 530 | 630 | 1,010 1,498 | 1,972 | 1,972 | 1,972 | 1,972 | 1,972 | 1,972 | 1,972 | ||
| Operating income | 270 | 253 | 332 | 343 | 366 | 497 | 793 | 869 | 1,120 | 1,043 | 1,432 | 1,826 2,016 | 2,513 | 2,754 | 3,145 | 3,089 3,725 | 4,161 | 4,366 | 1,197 | 2,524 5,421 | 10,373 | 15,397 | 15,397 | 15,397 | 15,397 | 15,397 | 15,397 | 15,397 | |||
| Net Interest Income | 8 | 12 | 18 | 14 | 14 | 14 | 7 | 6 | 4 | 6 | 7 | 6 | 7 | 9 | 9 | 11 | 14 | 16 | 16 | 19 | 52 | 22 | 36 | 64 | 64 | 64 | 64 | 64 | 64 | 64 | |
| Net Other Income | 46 | 52 | 29 | 118 | 41 | -116 | 31 | 24 | 41 | 26 | 0 | 0 | 0 | 0 | 0 | 0 | 0 | 0 | 0 | 245 | -21 | 67 | 0 | 0 | 0 | 0 | 0 | 0 | 0 | 0 | |
| Pre-tax profit | 324 | 317 | 379 | 476 | 420 | 395 | 830 | 899 | 1,165 | 1,075 | 1,438 | 1,831 | 2,023 | 2,522 | 2,764 3,100 | 3,158 | 3,741 | 4,385 | 1,495 | 2,545 5,510 | 10,409 | 15,461 | 15,461 | 15,461 | 15,461 | 15,461 | 15,461 | 15,461 | |||
| Tax expense (credit) | 100 | 60 | 44 | 63 | 64 | 64 | 143 | 148 | 248 | 226 | 302 | 385 425 | 530 | 580 | 651 | 663 | 786 | 877 | 921 | 419 | 1,161 | 2,186 | 3,247 | 3,247 | 3,247 | 3,247 | 3,247 | 3,247 | 3,247 | ||
| Net profit reported | 224 | 256 | 334 | 413 | 357 | 330 | 687 | 752 | 917 | 849 | 1,136 | 1,447 1,598 | 1,992 | 2,183 | 2,449 | 2,495 | 2,956 | 3,300 | 3,464 1,227 | 2,125 4,349 | 8,223 | 12,214 | 12,214 | 12,214 | 12,214 | 12,214 | 12,214 | 12,214 | |||
| EPS (NT$) | 3.3 | 3.7 | 4.9 | 6.0 | 5.2 | 4.8 | 10.0 | 11.0 | 13.4 | 12.4 | 16.6 | 21.1 23.3 | 29.1 | 31.8 | 35.7 | 36.4 | 43.1 | 48.1 | 50.5 | 63.4 | 120.0 | 178.2 | 178.2 | 178.2 | 178.2 | 178.2 | 178.2 | 178.2 | |||
| Margins (%) | |||||||||||||||||||||||||||||||
| Gross Margin | 24.2 | 23.1 | 24.3 | 19.2 | 22.1 | 24.1 | 27.7 | 29.0 | 32.3 | 34.0 | 36.6 | 37.2 38.2 | 39.2 | 40.1 | 39.9 | 41.1 | 42.2 | 42.9 | 42.5 | 22.3 | 26.3 | 35.3 | 39.4 42.3 | 39.4 42.3 | 39.4 42.3 | 39.4 42.3 | 39.4 42.3 | 39.4 42.3 | 39.4 42.3 | ||
| - OPEX ratio | 8.4 | 8.5 | 7.7 | 6.8 | 5.9 | 5.1 | 5.4 | 7.2 | 5.5 | 6.1 | 5.6 | 5.1 5.1 | 5.0 | 5.0 | 4.9 | 5.0 | 4.9 | 4.8 | 4.6 | 6.0 | 5.5 | 5.0 | 4.8 | 4.8 | 4.8 | 4.8 | 4.8 | 4.8 | 4.8 | ||
| Operating Margin | 15.8 | 14.7 | 16.7 | 12.4 | 16.2 | 19.0 | 22.2 | 21.9 | 26.8 | 27.9 | 31.0 | 32.1 33.1 | 34.2 | 35.1 | 35.1 | 36.1 | 37.3 | 38.2 | 37.9 | 20.3 | 29.7 | 34.5 | 37.5 | 37.5 | 37.5 | 37.5 | 37.5 | 37.5 | 37.5 | ||
| EBITDA Margin | 18.0 | 17.2 | 19.9 | 14.2 | 19.5 | 21.8 | 24.4 | 23.8 | 28.9 | 30.4 | 33.1 | 33.9 | 34.9 | 35.8 | 36.6 36.5 | 37.6 | 38.7 | 39.5 | 39.2 | 17.0 | 31.8 | 36.0 | 38.8 | 38.8 | 38.8 | 38.8 | 38.8 | 38.8 | 38.8 | ||
| Net Margin | 13.1 | 14.9 | 16.8 | 14.9 | 15.8 | 12.6 | 19.3 | 18.9 | 21.9 | 22.7 | 24.6 | 25.5 | 26.2 | 27.1 | 27.8 | 27.8 | 28.7 | 29.6 | 30.3 | 30.1 | 15.0 | 17.1 23.9 | 27.3 | 29.7 | 29.7 | 29.7 | 29.7 | 29.7 | 29.7 | 29.7 | |
| Sequential Growth (%) | |||||||||||||||||||||||||||||||
| Revenue | -4 | 0 | 16 | 39 | -19 | 16 | 36 | 12 | 5 | -11 | 23 | 23 7 | 20 | 7 | 12 -1 | 15 | 9 | 6 | |||||||||||||
| Gross Profit | -5 | -4 | 22 | 10 | -6 | 27 | 56 | 17 | 17 | -6 | 33 | 25 10 | 24 | 9 | 12 | 2 | 18 | 11 | 5 | ||||||||||||
| EBIT | -13 | -6 | 31 | 4 | 7 | 36 | 60 | 10 | 29 | -7 | 37 | 28 10 | 25 | 10 | 12 | 2 | 18 | 12 | 5 | ||||||||||||
| EPS | 15 | 14 | 30 | 24 | -14 | -7 | 108 | 9 | 22 | -7 | 34 | 27 10 | 25 | 10 | 12 | 2 | 18 | 12 | 5 | ||||||||||||
| YoY Growth (%) | |||||||||||||||||||||||||||||||
| Revenue | 93 | 21 | 27 | 56 | 32 | 52 | 79 | 44 | 86 | 43 | 29 | 43 | 46 | 96 | 70 | 55 | 43 | 36 | 39 | 31 | 45 | 52 | 47 | 65 | 37 | 37 | 37 | 37 | 37 | 37 | |
| Gross Profit | 101 | 27 | 34 | 22 | 21 | 58 | 104 | 117 | 171 | 102 | 71 | 83 | 72 | 126 | 86 | 66 | 54 | 46 | 49 | 39 | 39 | 79 | 97 85 | 46 | 46 | 46 | 46 | 46 | 46 | 46 | |
| EBIT | 132 | 25 | 32 | 10 | 36 | 97 | 139 | 153 | 206 | 110 | 81 | 110 80 | 141 | 92 69 | 56 | 48 | 51 | 41 | 111 115 | 91 | 48 | 48 | 48 | 48 | 48 | 48 | 48 | ||||
| EPS | 159 | 27 | 49 | 111 | 59 | 29 | 106 | 82 | 157 | 157 | 65 | 92 | 74 | 135 | 92 69 | 56 | 48 | 51 | 41 | 73 | 105 | 89 | 49 | 49 | 49 | 49 | 49 | 49 | 49 | ||
| Sales mix (%) | |||||||||||||||||||||||||||||||
| Phone hinge | 86 | 84 | 83 | 79 | 74 | 69 | 41 | 52 | 38 | 38 | 33 | 34 | 21 | 17 | 18 | 15 | 20 11 | 13 | 15 | 56 | 35 | 19 13 | 19 13 | 19 13 | 19 13 | 19 13 | 19 13 | 19 13 | |||
| Notebook hinge | 12 | 13 | 11 | 9 | 9 | 9 | 5 | 5 | 5 | 6 | 5 | 4 | 3 | 3 | 3 3 | 2 | 2 | 2 | 2 | 11 | 3 | 6 | 5 | 2 | |||||||
| Server businesses | 0 | 2 | 4 | 12 | 16 | 22 | 54 | 42 | 56 55 | 62 | 62 | 76 80 | 78 | 77 | 83 | 87 84 | 83 | 5 | 36 | 59 | 78 84 | ||||||||||
| Others | 1 | 1 | 2 | 1 | 1 | 1 | 1 | 1 | 1 | 1 | 0 | 0 | 0 | 0 | 1 | 0 | 0 | 0 | 0 | 0 | 0 | 1 | 1 1 | 0 | 0 | ||||||
| GP mix (%) Phone hinge Notebook hinge Server businesses Others | 92 7 0 0 | 90 7 2 2 | 88 5 5 5 | 77 4 18 6 | 71 5 24 8 | 63 4 33 8 | 27 2 71 6 | 37 2 60 4 | 22 2 76 7 | 21 2 77 7 | 16 1 83 6 | 16 1 82 6 | 9 1 90 6 | 7 1 92 6 | 8 1 91 6 | 9 6 1 1 90 94 6 6 | 4 1 95 5 | 18 1 80 6 | 8 1 91 6 | 5 1 94 5 | 6 0 93 5 | 86 6 7 4 | 44 3 53 6 | 5 1 94 5 |
Sour e: Company data, J.P. Morgan estimates.
Figure 10: Ba ance sheet
| (NT$ in million, year-end December) | 2024 - 1Q | 2024 - 2Q | 2024 - 3Q | 2024 - 4Q | 2025 - 1Q | 2025 - 2Q | 2025 - 3Q | 2025 - 4Q | 2026E - 1Q | 2026E - 2Q | 2026E - 3QE | 2026E - 4QE | 2027E - 1QE | 2027E - 2QE | 2027E - 3QE | 2027E - 4QE | 2028E - 1QE 2QE | 2028E - 3QE | 2028E - 4QE | 2028E | 2024 2025 2026E | 2024 2025 2026E | 2024 2025 2026E | 2027E 2028E | 2027E 2028E | |
|---|---|---|---|---|---|---|---|---|---|---|---|---|---|---|---|---|---|---|---|---|---|---|---|---|---|---|
| Cash and Cash Equivalents | 6,207 | 6,910 | 6,035 | 6,336 | 7,623 | 6,262 | 5,839 | 8,455 | 8,706 | 9,584 | 8,705 | 10,049 | 12,274 | 12,347 | 14,096 | 16,644 | 19,261 | 18,719 | 21,879 | 25,419 6,336 | 8,455 | 10,049 | 16,644 | 25,419 | 25,419 | |
| Account Receivables | 1,554 | 487 | 1,195 | 2,163 | 707 | 807 | 2,927 | 2,298 | 3,486 | 2,800 | 4,105 | 5,155 | 5,152 6,220 | 6,850 | 7,646 | 7,472 | 8,603 | 9,427 | 9,935 2,163 | 2,298 | 5,155 | 7,646 | 9,935 | 9,935 | ||
| Inventory | 1,196 | 1,376 | 1,479 | 2,902 | 2,992 | 2,367 | 2,365 | 2,596 | 2,629 | 2,144 | 3,204 | 3,911 | 4,134 | 4,887 | 5,158 | 5,802 | 5,620 | 6,326 | 6,817 | 7,251 | 2,902 | 2,596 3,911 | 5,802 | 7,251 | 7,251 | |
| Total Other Current Assets | 118 | 135 | 138 | 263 | 230 | 127 | 83 | 144 | 104 | 89 | 121 | 154 | 155 188 | 205 | 229 | 224 | 258 | 282 | 298 | 263 | 144 | 154 | 229 | 298 | 298 | |
| Total Current Assets | 9,075 | 8,909 | 8,848 | 11,664 | 11,551 | 9,563 | 11,214 | 13,494 | 14,925 | 14,618 | 16,135 | 19,268 | 21,715 23,641 | 26,309 | 30,321 | 32,576 | 33,905 | 38,405 | 42,902 | 11,664 | 13,494 | 19,268 | 30,321 | 42,902 | 42,902 | |
| Gross Fixed Assets | 731 | 765 | 1,116 | 1,169 | 1,298 | 1,233 | 1,347 | 1,467 | 1,628 | 1,647 | 1,767 | 1,887 | 1,987 2,087 | 2,187 2,287 | 2,387 | 2,487 | 2,587 | 2,687 | 1,169 | 1,467 | 1,887 | 2,287 | 2,687 | 2,687 | ||
| Accumulated Depreciation | 355 | 390 | 447 | 414 | 482 | 485 | 564 | 657 | 748 | 819 | 912 | 1,011 | 1,117 1,228 | 1,345 1,468 | 1,596 | 1,730 | 1,869 | 2,014 | 414 657 | 1,011 | 1,468 | 2,014 | 2,014 | |||
| Construction in Progress | 0 | 15 | 4 | 3 | 7 | 9 | 7 | 7 | 9 | 14 | 14 | 15 | 16 | 17 | 18 | 19 | 19 | 20 | 21 | 22 | 3 | 7 15 | 19 | 22 | 22 | |
| Acquisition/(Divestures) | 0 | 0 | 0 | 0 | 0 | 0 | 0 | 0 | 0 | 0 | 0 | 0 | 0 | 0 | 0 | 0 0 | 0 | 0 | 0 | 0 | 0 | 0 | 0 | 0 | 0 | |
| Net Fixed Assets | 376 | 389 | 673 | 758 | 823 | 757 | 789 | 817 | 889 | 842 | 869 | 891 | 886 | 876 | 859 | 838 | 810 | 777 | 739 | 695 758 | 817 | 891 | 838 | 695 | 695 | |
| Other Long Term Assets | 234 | 370 | 280 | 264 | 318 | 268 | 277 | 296 | 324 | 444 | 335 | 350 | 363 | 373 | 355 | 360 | 363 | 363 | 360 | 362 | 264 296 | 350 | 360 | 362 | 362 | |
| Long Term Investments and Associates | 0 | 0 | 60 | 71 | 71 | 72 | 71 | 71 | 71 | 81 | 81 | 81 | 81 | 81 | 81 | 81 | 81 | 81 | 81 | 81 | 71 | 71 | 81 | 81 | 81 | 81 |
| Total Long Term Assets | 609 | 759 | 1,013 | 1,094 | 1,213 | 1,097 | 1,137 | 1,184 | 1,284 | 1,367 | 1,285 | 1,322 | 1,330 | 1,330 | 1,296 1,279 | 1,254 | 1,221 | 1,180 1,137 | 1,094 | 1,184 1,322 | 1,279 | 1,137 | 1,137 | |||
| Total Assets | 9,684 | 9,668 | 9,861 | 12,758 | 12,764 | 10,660 | 12,351 | 14,678 | 16,209 | 15,984 | 17,420 | 20,590 | 23,045 | 24,970 | 27,604 | 31,600 | 33,831 | 35,127 | 39,586 | 44,040 12,758 | 14,678 | 20,590 | 31,600 | 44,040 | 44,040 | |
| ST Debt and Current Portion of LT Debt | 450 | 420 | 410 | 430 | 431 | 410 | 432 | 420 | 410 | 410 | 410 | 410 | 410 | 410 | 410 | 410 | 410 | 410 | 410 | 410 | 430 420 | 410 | 410 410 | 410 410 | ||
| Accounts Payable | 3,042 | 2,684 | 2,748 | 5,093 | 4,582 | 2,821 | 3,920 | 5,077 | 5,257 | 4,032 | 4,807 | 5,866 | 6,201 7,330 | 7,737 | 8,702 | 8,429 | 9,489 | 10,225 10,876 | 5,093 5,077 | 5,866 | 8,702 | 10,876 | 10,876 | |||
| Other Current Liabilities | 1,112 | 1,185 | 872 | 1,009 | 1,597 | 1,525 | 1,213 | 1,336 | 2,447 | 2,498 | 2,023 | 2,687 | 3,209 | 3,767 | 3,810 4,391 | 4,400 | 4,996 | 5,419 | 5,759 | 1,009 1,336 | 2,687 | 4,391 | 5,759 | 5,759 | ||
| Total Current Liabilities | 4,605 | 4,289 | 4,030 | 6,533 | 6,611 | 4,756 | 5,565 | 6,833 | 8,114 | 6,940 | 7,240 | 8,963 | 9,820 11,506 | 11,957 | 13,503 | 13,239 | 14,895 | 16,054 | 17,044 | 6,533 6,833 | 8,963 | 13,503 | 17,044 | 17,044 | ||
| Long Term Debt | 0 | 0 | 0 | 0 | 0 | 0 | 0 | 0 | 0 | 0 | 0 | 0 | 0 0 | 0 | 0 0 | 0 | 0 0 | 0 | 0 | 0 | 0 | 0 | 0 | |||
| Other Long Term Liabilities | 581 | 601 | 679 | 679 | 718 | 567 | 597 | 652 | 671 | 690 | 690 | 690 | 690 690 | 690 | 690 | 690 | 690 | 690 | 690 | 679 652 | 690 | 690 | 690 | 690 | ||
| Total Long Term Liabilities | 581 | 601 | 679 | 679 | 718 | 567 | 597 | 652 | 671 | 690 | 690 | 690 | 690 690 | 690 | 690 | 690 | 690 | 690 690 | 679 652 | 690 | 690 | 690 | 690 | |||
| Total Liabilities | 5,186 | 4,889 | 4,708 | 7,212 | 7,329 | 5,323 | 6,162 | 7,485 | 8,786 | 7,631 | 7,930 | 9,654 | 10,510 12,197 | 12,648 | 14,194 | 13,930 | 15,585 | 16,744 | 17,735 | 7,212 | 7,485 | 9,654 14,194 | 17,735 | 17,735 | ||
| Share Capital | 686 | 686 | 686 | 686 | 686 | 686 | 686 | 686 | 686 | 686 | 686 | 686 | 686 | 686 | 686 | 686 | 686 | 686 | 686 | 686 | 686 | |||||
| 686 | 686 | 686 | 686 | 686 | ||||||||||||||||||||||
| Share Premium | 0 | 0 | 0 | 0 | 0 | 0 | 0 | 0 | 0 | 0 | 0 | 0 | 0 | 0 | 0 | 0 | 0 | 0 | 0 | 0 | 0 0 | 0 | 0 | 0 | 0 | |
| Other Reserves | 2,637 | 2,764 | 2,804 1,663 | 2,785 2,076 | 2,866 1,884 | 2,512 2,139 | 2,677 2,826 | 2,930 3,578 | 2,962 3,775 | 3,257 4,412 | 3,257 5,548 | 6,994 | 3,257 3,257 8,592 | 3,257 8,831 | 3,257 11,015 | 3,257 13,464 | 3,257 | 3,257 15,599 | 3,257 18,899 | 3,257 22,363 | 2,785 2,076 | 2,930 | 3,257 | 3,257 | 13,464 22,363 | 13,464 22,363 |
| Preferred Stock | 0 | 0 | 0 | 0 | 0 | 0 | 0 | 0 | 0 | 3,578 | 6,994 0 | 0 | 26,305 | 26,305 | ||||||||||||
| Retained Earnings | 1,176 | 1,328 | 0 | 0 | 0 | 0 | 0 | 0 | 0 | 0 | 15,959 0 | 0 | 0 | 0 | 0 | 0 | 0 | |||||||||
| Total Equity | 4,498 | 4,778 | 5,152 | 5,546 | 5,435 | 5,337 | 6,189 | 7,193 | 7,423 | 8,354 | 9,490 | 10,936 | 12,535 | 12,774 | 14,957 | 17,406 | 19,901 | 19,541 | 22,841 | 26,305 5,546 | 7,193 | 10,936 17,406 | ||||
| BVPS | 66 | 70 | 75 | 81 | 79 | 78 | 90 | 105 | 108 | 122 | 138 | 160 | 183 186 | 218 | 254 | 290 285 | 333 | 384 | 81 | 105 | 160 | 254 | 384 |
Sour e: Company data, J.P. Morgan estimates.
Figure 11: Cash f ow statement
| Cash flow statement - NT$ in billions, year-end Dec | Cash flow statement - FY17A | Cash flow statement - FY18A | Cash flow statement - FY19A | Cash flow statement - FY20A | Cash flow statement - FY21A | Cash flow statement - FY22A | Cash flow statement - FY23A | Cash flow statement - FY24A | Cash flow statement - FY25A | Cash flow statement - FY26E | Cash flow statement - FY27E | Cash flow statement - FY28E |
|---|---|---|---|---|---|---|---|---|---|---|---|---|
| Net Income | 0.1 | 0.0 | 0.0 | 0.2 | 0.5 | 0.6 | 0.6 | 1.2 | 2.1 | 4.3 | 8.2 | 12.2 |
| Depr. & Amortisation | 0.0 | 0.0 | 0.0 | 0.1 | 0.1 | 0.1 | 0.1 | 0.2 | 0.3 | 0.4 | 0.5 | 0.5 |
| Change in working capital | 0.0 | -0.1 | 0.0 | -0.6 | -0.3 | 1.5 | 0.2 | 0.0 | 0.6 | -2.0 | 0.1 | -0.3 |
| Other | 0.0 | 0.0 | 0.0 | 0.0 | 0.0 | 0.0 | 0.0 | 0.0 | 0.0 | 0.0 | 0.0 | 0.0 |
| Cash flow from operations | 0.1 | 0.0 | 0.1 | -0.3 | 0.3 | 2.2 | 1.0 | 1.4 | 3.0 | 2.7 | 8.8 | 12.5 |
| Capex | -0.1 | 0.0 | -0.1 | -0.2 | -0.2 | -0.1 | -0.2 | -0.6 | -0.3 | -0.4 | -0.4 | -0.4 |
| Disposal/ (purchase) | 0.0 | 0.0 | 0.0 | -0.1 | 0.1 | 0.0 | 0.0 | -0.2 | 0.0 | -0.1 | 0.0 | 0.0 |
| Cash flow from investing | -0.1 | 0.0 | -0.1 | -0.3 | -0.1 | -0.1 | -0.2 | -0.8 | -0.4 | -0.5 | -0.4 | -0.4 |
| Free cash flow | 0.1 | -0.1 | 0.0 | -0.5 | 0.2 | 2.1 | 0.8 | 0.8 | 2.7 | 2.2 | 8.4 | 12.1 |
| Equity raised/ (repaid) | 0.0 | 0.0 | 0.0 | 0.0 | 0.0 | 0.0 | 0.0 | 0.0 | 0.0 | 0.0 | 0.0 | 0.0 |
| Debt raised/ (repaid) | 0.0 | 0.0 | 0.0 | 0.2 | 0.6 | 0.1 | -0.5 | 0.0 | 0.0 | 0.0 | 0.0 | 0.0 |
| Other | 0.3 | 0.0 | 0.2 | 0.3 | 0.8 | 0.1 | 2.0 | 0.2 | 0.0 | 0.3 | 0.0 | 0.0 |
| Dividends paid | 0.0 | 0.0 | 0.0 | 0.0 | 0.0 | -0.3 | -0.2 | -0.3 | -0.5 | -0.9 | -1.8 | -3.3 |
| Cash flow from financing | 0.3 | 0.0 | 0.2 | 0.5 | 1.4 | -0.1 | 1.2 | -0.1 | -0.5 | -0.6 | -1.8 | -3.3 |
| Net change in cash | 0.3 | -0.1 | 0.1 | -0.1 | 1.6 | 2.0 | 2.0 | 0.4 | 2.1 | 1.6 | 6.6 | 8.8 |
| Beginning cash | 0.0 | 0.3 | 0.3 | 0.4 | 0.2 | 1.9 | 3.9 | 5.9 | 6.3 | 8.5 | 10.0 | 16.6 |
| Ending cash | 0.3 | 0.3 | 0.4 | 0.2 | 1.9 | 3.9 | 5.9 | 6.3 | 8.5 | 10.0 | 16.6 | 25.4 |
Sour e: Company data, J.P. Morgan estimates.
Investment Thesis, Valuation and Risks
Fositek(Overweight; Price Target: NT$4,000.00)
Investment Thesis
We are OW on Fositek for its strong earnings growth potential over the next few years, driven by rising server project wins with an increasing customer base and structural margin expansion with a favourable mix.
Valuation
Our Dec-27 PT of NT$4,000 is based on a 22x 2028E P/E, in the middle of its historical valuation range of 15-30x since its OTC listing in 2020, which we believe is warranted by its strong earnings potential.
Risks to Rating and Price Target
Key downside risks to our rating and price target include: 1) QD ASP/margin pressure or market-share loss from competition, 2) slower qualification in AI server rail kit customers/ projects, and 3) continued weakening smartphone market demand.
Fositek: Summary of Financia s
| Income Statement | FY24A | FY25A | FY26E | FY27E | FY28E |
|---|---|---|---|---|---|
| Revenue | 8,188 | 12,414 | 18,222 | 30,103 | 41,106 |
| COGS | (6,361) | (9,144) | (11,791) | (18,232) | (23,737) |
| Gross profit | 1,827 | 3,270 | 6,430 | 11,871 | 17,369 |
| SG&A | (185) | (174) | (254) | (387) | (517) |
| Adj. EBITDA | 1,394 | 2,823 | 5,800 | 10,846 | 15,963 |
| D&A | (196) | (298) | (379) | (473) | (566) |
| Adj. EBIT | 1,197 | 2,524 | 5,421 | 10,373 | 15,397 |
| Net Interest | 52 | 41 | 22 | 36 | 64 |
| Adj. PBT | 1,495 | 2,545 | 5,510 | 10,409 | 15,461 |
| Tax | (267) | (419) | (1,161) | (2,186) | (3,247) |
| Minority Interest | 0 | 0 | 0 | 0 | 0 |
| Adj. Net Income | 1,227 | 2,125 | 4,349 | 8,223 | 12,214 |
| Reported EPS | 17.90 | 31.00 | 63.44 | 119.95 | 178.17 |
| Adj. EPS | 17.90 | 31.00 | 63.44 | 119.95 | 178.17 |
| DPS | 4.89 | 8.01 | 12.50 | 25.58 | 48.37 |
| Payout ratio | 27.3% | 25.9% | 19.7% | 21.3% | 27.1% |
| Shares outstanding | 69 | 69 | 69 | 69 | 69 |
| Ba ance Sheet | FY24A | FY25A | FY26E | FY27E | FY28E |
| Cash and ash equivalents | 6,336 | 8,455 | 10,049 | 16,644 | 25,419 |
| A ounts re eivable | 2,163 | 2,298 | 5,155 | 7,646 | 9,935 |
| Inventories | 2,902 | 2,596 | 3,911 | 5,802 | 7,251 |
| Other urrent assets | 263 | 144 | 154 | 229 | 298 |
| Current assets | 11,664 | 13,494 | 19,268 | 30,321 | 42,902 |
| PP&E | 758 | 817 | 891 | 838 | 695 |
| LT investments | - | - | - | - | - |
| Other non urrent assets | 336 | 367 | 431 | 441 | 443 |
| Tota assets | 12,758 | 14,678 | 20,590 | 31,600 | 44,040 |
| Short term borrowings | 430 | 420 | 410 | 410 | 410 |
| Payables | 5,093 | 5,077 | 5,866 | 8,702 | 10,876 |
| Other short term liabilities | 1,009 | 1,336 | 2,687 | 4,391 | 5,759 |
| Current iabi ities | 6,533 | 6,833 | 8,963 | 13,503 | 17,044 |
| Long-term debt | 0 | 0 | 0 | 0 | 0 |
| Other long term liabilities | 679 | 652 | 690 | 690 | 690 |
| Tota iabi ities | 7,212 | 7,485 | 9,654 | 14,194 | 17,735 |
| Shareholders' equity | 5,546 | 7,193 | 10,936 | 17,406 | 26,305 |
| Minority interests | - | - | - | - | - |
| Tota iabi ities & equity | 12,758 | 14,678 | 20,590 | 31,600 | 44,040 |
| BVPS | 80.91 | 104.92 | 159.53 | 253.90 | 383.71 |
| y/y Growth | 7.0% | 29.7% | 52.1% | 59.2% | 51.1% |
| Net debt/( ash) | (5,906) | (8,035) | (9,639) | (16,234) | (25,009) |
| Cash F ow Statement | FY24A | FY25A | FY26E | FY27E | FY28E |
|---|---|---|---|---|---|
| Cash f ow from operating activities | 1,366 | 3,014 | 2,674 | 8,763 | 12,495 |
| o/w Depre iation & amortization | 196 | 298 | 379 | 473 | 566 |
| o/w Changes in working apital | (50) | 600 | (2,041) | 83 | (265) |
| Cash f ow from investing activities | (816) | (378) | (504) | (414) | (405) |
| o/w Capital expenditure | (588) | (347) | (440) | (404) | (403) |
| as % of sales | 7.2% | 2.8% | 2.4% | 1.3% | 1.0% |
| Cash f ow from financing activities | (111) | (517) | (576) | (1,754) | (3,316) |
| o/w Dividends paid | (335) | (549) | (857) | (1,754) | (3,316) |
| o/w Shares issued/(repur hased) | 0 | 0 | 0 | 0 | 0 |
| o/w Net debt issued/(repaid) | (10) | (10) | (10) | 0 | 0 |
| Net change in cash | 438 | 2,119 | 1,594 | 6,596 | 8,775 |
| Adj. Free cash f ow to firm | 778 | 2,667 | 2,234 | 8,360 | 12,092 |
| y/y Growth | 0.0% | 242.8% | (16.2%) | 274.2% | 44.6% |
| Ratio Ana ysis | FY24A | FY25A | FY26E | FY27E | FY28E |
| Gross margin | 22.3% | 26.3% | 35.3% | 39.4% | 42.3% |
| EBITDA margin | 17.0% | 22.7% | 31.8% | 36.0% | 38.8% |
| EBIT margin | 14.6% | 20.3% | 29.7% | 34.5% | 37.5% |
| Net profit margin | 15.0% | 17.1% | 23.9% | 27.3% | 29.7% |
| ROE | 24.2% | 33.4% | 48.0% | 58.0% | 55.9% |
| ROA | 11.3% | 15.5% | 24.7% | 31.5% | 32.3% |
| ROCE | 17.9% | 31.0% | 45.1% | 56.2% | 54.6% |
| SG&A/Sales | 2.3% | 1.4% | 1.4% | 1.3% | 1.3% |
| Net debt/Equity | NM | NM | NM | NM | NM |
| Net debt/EBITDA | NM | NM | NM | NM | NM |
| Sales/Assets (x) | 0.8 | 0.9 | 1.0 | 1.2 | 1.1 |
| Assets/Equity (x) | 2.1 | 2.2 | 1.9 | 1.8 | 1.7 |
| Interest over (x) | NM | NM | NM | NM | NM |
| Operating leverage | 79.8% | 214.7% | 245.2% | 140.1% | 132.5% |
| Tax rate | 17.9% | 16.5% | 21.1% | 21.0% | 21.0% |
| Revenue y/y Growth | 45.1% | 51.6% | 46.8% | 65.2% | 36.6% |
| EBITDA y/y Growth | 37.6% | 102.5% | 105.5% | 87.0% | 47.2% |
| EPS y/y Growth | 73.2% | 73.2% | 104.6% | 89.1% | 48.5% |
| Va uation | FY24A | FY25A | FY26E | FY27E | FY28E |
| P/E (x) | 140.5 | 81.1 | 39.6 | 21.0 | 14.1 |
| P/BV (x) | 31.1 | 24.0 | 15.8 | 9.9 | 6.6 |
| EV/EBITDA (x) | 120.2 | 58.6 | 28.2 | 14.5 | 9.3 |
| Dividend Yield | 0.2% | 0.3% | 0.5% | 1.0% | 1.9% |
Sour e: Company reports and J.P. Morgan estimates.
Note: NT$ in millions (ex ept per-share data).Fis al year ends De . o/w - out of whi h
Analyst Certification: The Research Analyst(s) denoted by an 'AC' on the cover of this report certifies (or, where multiple Research Analysts are primarily responsible for this report, the Research Analyst denoted by an 'AC' on the cover or within the document individually certifies, with respect to each security or issuer that the Research Analyst covers in this research) that: (1) all of the views expressed in this report accurately reflect the Research Analyst's personal views about any and all of the subject securities or issuers; and (2) no part of any of the Research Analyst's compensation was, is, or will be directly or indirectly related to the specific recommendations or views expressed by the Research Analyst(s) in this report. For all Korea-based Research Analysts listed on the front cover, if applicable, they also certify, as per KOFIA requirements, that the Research Analyst's analysis was made in good faith and that the views reflect the Research Analyst's own opinion, without undue influence or intervention.
All authors named within this report are Research Analysts who produce independent research unless otherwise specified. In Europe, Sector Specialists (Sales and Trading) may be shown on this report as contacts but are not authors of the report or part of the Research Department.