PDF 原檔:報告_JPM_半導體測試介面_Initiation_20261026_original.pdf
圖片清單(已驗證 2026-10-27)
全 73 張抽圖中 ≥40KB 者 12 張,另加讀 030、067、069 共 14 張逐張 Read 驗證(067 為 46KB 已計入;030、069 <40KB 為補讀);其餘 <40KB 皆為財務/TAM/產能/市占統計圖表(未逐張驗,不嵌 lib)。
| 檔名 | size | 分類 | 親眼所見內容 |
|---|---|---|---|
報告_JPM_半導體測試介面_Initiation_20261026_001.png |
40.0KB | 文字卡 | 兩組由上而下的方框匯流圖(Source: J.P.Morgan):探針卡 TAM 由 Chip shipment (unit)、Testing time、Pin count (content)、MEMS migration 四項匯入;測試座 TAM 由 Chip shipment (unit)、Testing time、Pin count (content)、SLT 四項匯入 |
報告_JPM_半導體測試介面_Initiation_20261026_002.png |
74.9KB | 文字卡 | 同上圖的較大版(Figure 2):探針卡 TAM 與測試座 TAM 各四項驅動因子方框 |
報告_JPM_半導體測試介面_Initiation_20261026_013.png |
155.0KB | 真資料圖 | 台灣測試介面類股股價相對表現折線圖(2023/1/1=100,縱軸 0–10,000,橫軸 1/2023–9/2026):旺矽(橘)自 2H25 起大幅攀升至約 6,500 後回落至約 4,300;穎崴(藍)高點約 2,500 後回落約 1,100;精測(綠)高點約 900;TWSE 指數(淺藍)近平;圖上以文字標註 1Q23、2H24、3M25、2H25-1H26、Mid'26 各階段事件 |
報告_JPM_半導體測試介面_Initiation_20261026_024.png |
97.2KB | 真資料圖 | 兩張並排的常態分布曲線示意圖:左為一般速度,紅虛線界線內外兩端淺紅尾部很小;右標示「Increase testing time」,曲線較寬、兩側藍箭頭向外擴張界線,左側尾部標「Testing error」;圖下說明為 Normal speed interconnect / High speed interconnect |
報告_JPM_半導體測試介面_Initiation_20261026_028.png |
117.5KB | 真資料圖 | 柱狀(左軸 US$bn,$0–1,200)加折線(右軸 %):2015–2027E 年度資料,柱高自 2015 約 $10 逐年增至 2027E 約 $1,000;折線標示 YoY 成長率(2015 8%、2017 58%、2024 76%、2025 79%、2026E 85%、2027E 70%);報告圖名為前四大美系 CSP 資料中心 capex |
報告_JPM_半導體測試介面_Initiation_20261026_030.png |
37.0KB | 真資料圖 | 穎崴股價(藍線,NT$)相對 TSE 重基準指數(灰線)折線圖,橫軸 Jan 26–Oct 26,縱軸 0–15k;藍線 4 月前後攀至約 10-11k 後回落至約 5k |
報告_JPM_半導體測試介面_Initiation_20261026_047.png |
252.2KB | 真資料圖 | 穎崴(WinWay)簡報頁「Module Test Challenge — Pick & Place, Plug & Play」:四格流程由左至右——Pick & Place(機械手臂把 CPO IC 放入 socket,標示 handler places CPO IC into socket)→ Place FAUs(以鑷子選擇性放置個別光纖陣列)→ Plug All FAUs(交換器 ASIC 四周全部 FAU 連接完成)→ Plug & Play(上方壓蓋下壓,完整接觸後開始測試序列);各格示意圖為黑色 socket 框、中央 SWITCH ASIC 封裝、周圍金色 FAU 排針 |
報告_JPM_半導體測試介面_Initiation_20261026_052.png |
40.0KB | 真資料圖 | 旺矽股價(藍線,NT$)相對指數(灰線)折線圖,橫軸 Jan 26–Oct 26,縱軸 0–10k;藍線 7 月前後攀至約 7.4k 後回落約 5k |
報告_JPM_半導體測試介面_Initiation_20261026_063.png |
115.6KB | 真資料圖 | Technoprobe 全球據點地圖(三塊區域:美洲、歐洲、亞洲),圖例為 Technoprobe(深藍)、Harbor Electronics(綠)、MW Plasma(藍)、DIS Tech(灰);標示 TP America、TP Germany、TP France、TP Italy、TP Japan、TP Korea、TP China、TP Taiwan、YeeWei、TP Philippines、TP Singapore,DIS Tech 與 Harbor Electronics 分布於美、日、韓、中、台、菲、新等處 |
報告_JPM_半導體測試介面_Initiation_20261026_067.png |
46.3KB | 真資料圖 | 精測股價(藍線,NT$)相對指數(灰線),橫軸 Jan 26–Oct 26,縱軸 1k–5k;藍線 4 月前後約 4k 高點、10 月約 3k |
報告_JPM_半導體測試介面_Initiation_20261026_069.png |
29.3KB | 真資料圖 | 探針卡結構側視示意(Source: J.P. Morgan),由上而下依序標示:Mechanics (e.g. stiffener,灰色寬條)、PCB(綠色條)、Interposer(橘色短條)、Stiffener(黑色條),下方一排向下的細藍線為 Pins (Cantilever/cobra/MEMS);Stiffener 與 Pins 以括號歸為 Probe head |
報告_JPM_半導體測試介面_Initiation_20261026_071.png |
55.7KB | 真資料圖 | 穎崴長期股價折線圖(NT$,縱軸 0–12k,橫軸 Jan 24–Sep 26):2025 年中前約 1k,2026 年 5 月前後衝至約 11k 後回落至約 5k |
報告_JPM_半導體測試介面_Initiation_20261026_072.png |
52.4KB | 真資料圖 | 旺矽長期股價折線圖(NT$,縱軸 0–10k,橫軸 Jan 24–Sep 26):2026 年 6-7 月前後高點約 7.4k 後回落至約 5k;圖頂有「OW NT$90.00」標籤框 |
報告_JPM_半導體測試介面_Initiation_20261026_073.png |
65.4KB | 真資料圖 | 精測長期股價折線圖(NT$,縱軸 0–6k,橫軸 Jan 24–Sep 26),標註評等與目標價事件:UW NT$484(Jan 24 前後)、N NT$777(2025 初)、OW NT$4,800(2026 年 5 月)、OW NT$4,200、OW NT$4,900(2026 年 8-9 月);股價 2026 年高點約 4k |
原始內容
J PMORGAN
Taiwan Semiconductor Test Interface
Beneficiaries of rising AI testing intensity and supply chain localization: Initiate on WinWay (OW) and PI (N)
We initiate on WinWay (6515 TT) at OW and MPI (6223 TT) at N, adding to our existing coverage of CHPT (6510 TT, OW). We are constructive on the sector's multi year outlook as AI drives longer test times, higher pin counts, and broader SLT coverage, with Taiwan interface suppliers key beneficiaries of localization. We favor WinWay on its stronger earnings outlook (JPM FY26 28E socket EPS CAGR 108% vs 73% for MPI) plus more favorable competition landscape vs probe card (MPI).
- Testing intensity increases the m lti-year trend.We expect chiplet design to lift aggregate CP time by 10-15% per generation and FT/SLT to see a similar trend as chip complexity rises. We estimate HPC probe card TAM at US $1.6/5.9bn (2026/28E) (90%+ CAGR), and HPC socket (FT/SLT) TAM at US$0.9/3.7bn (100%+ CAGR), with SLT a major socket TAM driver.
- Favor socket over probe card - o r non-consens s view. Probe cards carry higher technical barriers/margins, and MPI is well positioned for increasing localization. However, 1) competition remains robust (m/s lacks continuity), 2) PCB is becoming a binding constraint for MPI, especially where competitors have built in house capability. High end sockets have a narrower qualified supplier pool and better m/s visibility. We are on par/-9% vs Street on WinWay/MPI 2028E EPS. Earnings upgrades are the key share price driver (still room for WinWay).
- WinWay: global socket leader; LT beneficiary of rising SLT adoption. WinWay has 70%+ m/s in Nvidia's FT socket (45 50% m/s in HPC FT socket). WinWay entered Nvidia's SLT socket in 2026 (7 8x content vs FT on longer test time). WinWay brings excellent onsite support and strong supply chain relationships, positioning it as a LT SLT beneficiary (Smiths [not listed] is a competitor in SLT). We estimate Nvidia SLT socket rev CAGR of ~200% to 23%/35%/44% of WinWay's 2026/27/28E rev. Our 2028E EPS are on par with the street, assuming 7% higher rev but lower GM on expansion cost (scale benefit to arise in the LT).
- MPI: Taiwan probe card leader entering MEMS. MPI is Taiwan's probe card leader expanding into MEMS technology (>4x capacity in 2027E vs 2025); we expect MEMs to reach 20%/35%/48% of 2026/27/28E total rev. While we are positive on MEMS demand and MPI's positioning, peers such as Technoprobe and FormFactor are also aggressively expanding, lowering m/s visibility vs expectations (sellside all OWs with TP 35 40x 2028E). Our below street EPS growth reflects competition and a modest CPO rev outlook.
- OW WinWay, N MPI. WinWay/MPI shares have fallen 50%/30% from April/July peaks vs TWSE +16% from April on de risking plus company specific factors (GM and m/s concern for WinWay, CPO testing uncertainty for MPI). As growth outlook remains robust and valuation is now more reasonable (30's vs +50x 2027E P/E at peaks), we see better risk/reward in WinWay. Our WinWay Dec 27 PT is based on 26x 2028E socket EPS. Our N for MPI view reflects probe card competition; PT is based on 28x2028E EPS (global peers trading at mid 20's; Taiwan hist. premium vs RoW 15 20%). Key risks are AI capex deceleration, test time cut, and escalating competition.
Technology
erry Tsai AC
(886-2) 2725-9867 jerry.tsai@jpmorgan.com J.P. organ Securities (Taiwan) Limited
osie Yu
(886-2) 2725-9877
J.P. organ Securities (Taiwan) Limited
Gokul Hariharan
(852) 2800-8564
J.P. organ Securities (Asia Pacific) Limited/ J.P. organ Broking (Hong Kong) Limited
Glossary:
HPC: High-Performance Computing
CP: Chip Probing
CPC: Cantilever Probe Card
MEMS: Micro-Electro-Mechanical System
FT: Final Test
S T: System-level Test
CPO: Co-packaged Optics
DUT: Device Under Test
DFT: Design For Test
Figure 1: Key drivers for test interface market
See page 67 for analyst certification and important disclosures, including non-US analyst disclosures
Equity Ratings and Price Targets
| Company | Ticker | Mkt Cap - ($ mn) | Price - CCY | Price | Rating - Cur | Rating - Prev | Price Target - CurEnd Date | Price Target - CurEnd Date | Price Target - PrevEnd Date |
|---|---|---|---|---|---|---|---|---|---|
| WinWay Technology | 6515 TT | 5,360 | TWD | 4,795.00 | OW | - | 7,500.00Dec-27 | - - | |
| MPI | 6223 TT | 14,697 | TWD | 4,890.00 | N | - | 5,350.00Dec-27 | - - | |
| Chunghwa Precision Test Tech | 6510 TT | 3,083 | TWD | 3,065.00 | OW | n/c | 4,900.00 | Dec-27 | n/c n/c |
Source: Company data, Bloomberg Finance .P., J.P. Morgan estimates. n/c = no change.All prices as of 22 Oct 26.
Investment Thesis
Figure 2: Key drivers for test interface market
Source: J.P. Morgan.
We are constructive on the test interface demand outlook through 2028 and potentially beyond, driven by: 1) rising testing intensity as AI chips require longer test time, higher pin counts and broader system level test (SLT) coverage; and 2) Taiwan suppliers remaining the enablers and key beneficiaries of the increasing number and complexity of projects, which leads to greater localization. These trends support strong growth in both high performance computing (HPC) final test (FT) and SLT sockets (100+% CAGR 2026-28E) and probe cards (90%+ CAGR). Considering the relative clarity of the demand growth outlook given sockets' better competitive dynamics compared with probe cards, we favor WinWay and highlight the key points to watch for MPI. We initiate coverage of WinWay at Overweight with a Dec-27 price target of NT$7,500 (26x 2028E EPS ex-probe card) and MPI at Ne tral with Dec-27 price target of NT $5,350 (28x 2028E EPS), while forecasting FY2026-28E EPS CAGRs of 108% (socket-related) and 73%, respectively.
O r stock preference reflects the better clarity of ind stry demand translating into company earnings. Our non consensus call is to prefer high end sockets over probe cards in the current AI cycle. Probe cards retain higher technical barriers, ASPs and margins, but high end sockets currently offer narrower qualified competition, better allocation visibility after qualification, and a slower qualified capacity response. We also believe the likelihood of new entrants disrupting the current socket dynamics is limited, given the close collaboration required between vendors and customers. In our view, these factors provide a clearer path from AI demand to allocation, utilization and incremental EPS gains for Winway. While we acknowledge that MPI stands to benefit from localization, we note that the dynamic shifts in probe card industry market share could persist as global players continue to expand their presence in Taiwan. Our 2028E EPS forecast for WinWay/MPI is in-line / -12% vs consensus, which reflects our view on the m/s allocation in socket and probe card industry.
WinWay (OW): Unlocking SLT TAM
We expect rising SLT exposure, higher pin content and next generation socket adoption to increase revenue per AI platform. We project WinWay's SLT socket revenue mix to rise from approximately 56% in 2026E to 70% in 2028E. Demand backed capacity expansion and stronger utilization should also support operating leverage. One key concern is whether WinWay can retain allocation across successive Nvidia and other AI platforms - we think this is likely. Platform share appears sustainable so long as the socket vendors like WinWay sustain service levels and product quality. Other concerns for WinWay are more related to probe cards: 1) share competition with MPI over the Nvidia Vera probe card; and 2) margin drag from MEMS probe card (WinWay sources the key component, MEMS pin, from Technoprobe and margin for WinWay is capped at 30 35%. This is 5 15ppt lower vs company average). However, we find these concerns overdone, believing they are largely in the price, and because socket margins exceed probe card margins for WinWay given its higher production internalization in sockets. While our valuation for WinWay excludes the contribution from probe cards, it still offers decent potential upside in support of our Overweight rating.
MPI (N): Entering the competitive MEMS market
Broadcom has been MPI's largest customer and is a key anchor of its TPU (Tensor Processing Unit) exposure, but final allocation remains sensitive to customer sourcing decisions and to the VPC to MEMS transition, where competition could be even more fierce vs the current Cobra probe card technology. MPI is dominant in cobra pin probe card - a more mature technology - whereas the MEMS field is crowded. MPI is expanding MEMS pin capacity by more than 4x from 2025 to 2027E, which could raise utilization and margin risk if production awards lag. In recent quarters, the company's CPO Insertion 2 prober has been a key driver of share price volatility amid talk of reduction or removal of the process. We believe investors remain divided on the outcome, implying potential upside for MPI's revenue if the process survives. This could contribute ~6% of 2028E reven e (assuming meaningful pull in starting in 2027E). We currently apply a 50% discount to the rev contribution to factor in the possibility of insertion 2 to be cancelled and therefore insertion 2 equipment rev contribution is 3% in 2028E in our model.
CHPT (OW): Beneficiary of testing PCB supply bottlenecks
The PCB, which houses the pins and sockets, is also a critical component of the test interface. The lead time for probe card PCB is rising rapidly, driven by: 1) a growing number of chip designs, which translates directly into more customized probe PCB designs; and (2) value add from advanced packaging proliferation. This leads to our positive view on CHPT, which we believe to be the leading testing PCB producer globally and is leveraging this position to capture more total solution probe card opportunities, which offer 3 5x higher content value vs its typical PCB only sales. We assign a 30x 2028E target P/E to CHPT, the highest in our coverage, reflecting our view that CHPT has the best prospects for upward earnings revisions, as complex PCBs are becoming the key binding constraint for probe card supplies.
Valuation gap between socket and probe card could narrow
We assign a higher multiple to probe card vendor MPI than to socket supplier WinWay, reflecting the belief that higher technical requirements warrant a premium. Nevertheless, we expect the valuation gap to narrow over the coming years. The challenging competitive environment should not be overlooked, and we believe incumbent socket vendors such as WinWay can defend their leadership positions well. Our target multiples, based on 2028E EPS, are 28x for MPI vs 26x for WinWay - a narrower gap than the Bloomberg consensus premium of 6 8x between probe card and socket vendor valuation.
Coverage company comparison - in charts
Table 1: Comparing WinWay, MPI and CHPT
| WinWay Technology | MPI | CHPT | |
|---|---|---|---|
| Ticker | 6515 TT | 6223 TT | 6510 TT |
| Market cap (US$bn) | 5 | 15 | 3 |
| Revenue (NT$bn; 2026E) | 14 | 21 | 7 |
| GM (%; 2026E) | 41% | 59% | 56% |
| OPM (%; 2026E) | 25% | 35% | 34% |
| 2027E rev growth (%) | 85% | 76% | 64% |
| 2028E rev growth (%) | 76% | 47% | 37% |
| 2027E EPS growth (%) | 116% | 90% | 76% |
| 2028E EPS growth (%) | 92% | 57% | 42% |
| Rev mix by segment (%) | Test socket 50-60%; contact element 5-10%; probe card 20-30% | Probe card 60-70%, equipment 20-25% | Probe card 60-65%; load bard (FT/SLT/Burn-in) 25-30% |
| Key competitors | Smiths (not listed); ISC (095340 KS); Leeno (058470 KS); Yokowo (6800 JP); Enplas (6961 JP); Yamaichi (6941 JP) | Technoprobe (TPRO IM); FormFactor (FORM US); CHPT (6510 TT); MJC (6871 JP); JEM (6855 JP) | R&D Altanova (under Advantest); Keystone (6683 TT); Technoprobe (TPRO IM) |
| Key clients | Nvidia (50-60% total rev); AMD (10-15%) | Nvidia (20-25%); Broadcom (20-25%); AWS (5-10%) | Nvidia (30-40%); MediaTek/Google (20-30%) |
Note: Market cap data is as of 22 Oct 2026. Forward financials are all based on J.P. Morgan estimates. Source: Bloomberg Finance .P., J.P. Morgan estimates.
Figure 3: WinWay - revenue and growth
2019
Source: Company data and J.P. Morgan estimates.
Figure 5: MPI - revenue and growth
Source: Company data and J.P. Morgan estimates.
Figure 7: WinWay - revenue mix by client, 2026E
Source: J.P. Morgan estimates.
Figure 4: WinWay - socket-related EPS and growth
Source: Company data and J.P. Morgan estimates.
Figure 6: MPI - EPS and growth
Source: Company data and J.P. Morgan estimates.
Figure 8: MPI - revenue mix by client, 2026E
70%
Source: J.P. Morgan estimates.
80%
Figure 9: WinWay - revenue by segment
Source: Company data and J.P. Morgan estimates.
Figure 11: MPI - revenue by segment
Source: Company data and J.P. Morgan estimates.
Figure 10: WinWay - revenue by segment
Source: Company data and J.P. Morgan estimates.
Figure 12: MPI - revenue mix by segment
Source: Company data and J.P. Morgan estimates.
Sector performance and valuation
Share prices in Taiwan's test interface sector, particularly for WinWay and MPI, have fluctuated in response to changes in AI accelerator demand, platform qualification and expectations around testing intensity. The sector began to re rate in early 2023 as investors shifted from a traditional semiconductor cycle framework toward accelerated earnings growth spurred on by the AI megatrend. WinWay's performance has increasingly reflected expectations for higher FT/SLT socket content, while MPI has traded more closely with probe card allocation, capacity expansion and CPO (Co packaged Optics) expectations.
The sector rally strengthened through 2024 25 as Blackwell related demand improved visibility on AI testing requirements and TPU qualification supported probe card sentiment. A further re rating occurred during 2H25 to 1H26 as record earnings, aggressive capacity plans and CPO expectations reinforced the view that test interface is one of the key beneficiaries of the AI megatrend. The sector corrected sharply from mid 2026 due to concerns about an AI bubble. Meanwhile, investor concern around the Insertion 2 testing outlook also became a negative headwind for MPI.
Figure 13: Taiwan test interface industry - share price performance
| 10,000 Price (2023/1/1 as | 100) Mid'26-to-date: high P/E stocks got de-rated on market concern over negative CSP FCF; WinWay stock suffered from margin miss due to MEMS probe card; MPI stock suffered from looming CPO insertion-2 cancellation concern |
|---|---|
| 6,000 8,000 | 2H24: re-rating started 2H25-1H26: re-rated due to fast- rising testing intensity and potential CPO engagement, evident by record-high monthly sales and continued expansion |
| 4,000 | 1Q23: AI investment theme replaced semiconductor from rising awareness of AI testing intensity; companies delivered record high profit; WinWay/MPI announced 3M25: WinWay/MPI stock down due to concern on 2H stronger-than- expected rev ramp down/seasonality announcement |
| 2,000 | downcycle concerns capacity expansion |
| 0 | WinWay (6515 TT) MPI (6223 TT) CHPT (6510 TT) TWSE index |
Source: Bloomberg Finance .P. Note: Share price relative performance vs 1 January 2023 level of each stock and the index. Prices are as of 22 Oct 2026 close.
Figure 14: WinWay - 1-year forward P/E band
Source: Bloomberg Finance .P., J.P. Morgan estimates.
Figure 15: MPI - 1-year forward P/E band
Source: Bloomberg Finance .P., J.P. Morgan estimates.
We expect the 15-20% local valuation premium to hold ...
We believe local test interface companies' valuations are justified by their increasingly important role in AI chip testing. Taiwan test interface suppliers have generally traded at P/E valuation premiums of 15-20% over global peers given their access to customers that are increasingly critical in AI chip testing, which is growing more strongly than the overall test interface industry. The rising number of projects - driven by chiplet proliferation and an expanding universe of chip designs beyond main accelerators - also favors local suppliers, given the intensifying need for engineering communication between vendor and customer. Taiwanese vendors offer a competitive advantage with stronger after sales support in terms of both timeliness and language - notably sharing the same language with the testing engineers - since most advanced chips are tested in Taiwan. This advantage is even more important in the socket industry due to the larger deployment scale (note that FT/SLT testing time is a lot longer than chip probing). Thus, we apply a premi m (vs global peers) to WinWay and MPI of aro nd 15-20%.
… but also see a narrowing of the valuation gap between probe card and socket players
We believe probe card suppliers should retain a premium due to higher technical barriers and margins, but we expect the historical discount applied to high end socket suppliers to narrow as qualification requirements tighten and earnings visibility improves.
Probe card peers trade at approximately 35x/25x 2027/28E P/E, vs 26x/21x for socket peers and 21x/17x for OSATs on Bloomberg consensus estimates and JPMe (for J.P.Morgan covered names, see notes for table 2 for full list). We believe WinWay deserves a premium to traditional socket peers given its higher AI exposure, stronger earnings growth and clearer allocation visibility, but should remain at a discount to probe card peers. We therefore value WinWay at 26x 2028E EPS, and MPI at 28x.
Re rating opportunities and/or stock trading momentum could arise from: 1) stronger than expected growth in AI test time, SLT mix and pin count; 2) tighter qualified socket supply as demand outgrows capacity; and 3) faster adoption of higher content solutions such as HyperSockets and MEMS probe cards.
Table 2: Valuation comparison - Global socket peers, global probe card peers, OSAT
| Industry | Company | Ticker | Price (LCY$) | JPM rating | Target Price (LCY$) | Mkt cap - (US$mn) | PE (x) - 2026E | PE (x) - 2027E | PE (x) - 2028E | PB (x) - 2026E | PB (x) - 2027E | PB (x) - 2028E | PB (x) - 2025 | NI yoy (%) - 2026E | NI yoy (%) - 2027E | NI yoy (%) - 2028E | NI yoy (%) | ROE (%) - 2025 | ROE (%) - 2026E | ROE (%) - 2027E | ROE (%) - 2028E |
|---|---|---|---|---|---|---|---|---|---|---|---|---|---|---|---|---|---|---|---|---|---|
| Probe card | |||||||||||||||||||||
| Chunghwa Prec | 6510 TT | 3,065 | OW | 4,900 | 3,098 | 47 | 26 | 19 | 9 | 7 | 5 | 96% | 116% | 76% | 42% 13% | 22% | 30% | 36% | |||
| Mpi | 6223 TT | 4,890 | N | 5,350 | 14,706 | 75 | 40 | 25 | 28 | 20 | 14 | 36% | 104% | 90% | 57% | 31% | 47% | 65% | 76% | ||
| Formfactor Inc | FORM US | 99 | NC | 7,696 | 32 | 25 | 18 | 6 | 5 | 4 | 31% | 169% | 31% | 41% | 6% | 18% | 22% | 28% | |||
| Technoprobe Spa | TPRO IM | 24 | OW | 45 | 17,343 | 44 | 25 | 20 | 10 | 7 | 5 | 1462% | -65% | 77% | 24% | 13% | 25% | 33% | 30% | ||
| Maxone Semicon-A | 688809 CH | 257 | NC | 6,987 | 75 | 49 | 32 | 10 | 9 | 7 | N.A. | N.A. | 53% | 52% | N.A. | 14% | 18% | 22% | |||
| Suzhou Uigreen-A | 688661 CH | 83 | NC | 1,897 | 82 | 33 | 26 | 10 | 8 9 | 7 | N.A. | 150% | 153% | 29% | 5% | 12% | 25% | 27% | |||
| Mean >> | 59 | 33 | 23 | 12 | 7 | 406% | 95% | 80% | 41% | 13% | 23% | 32% | 36% | ||||||||
| Socket | |||||||||||||||||||||
| Winway Technolog | 6515 TT | 4,795 | OW | 7,500 | 5,364 | 57 | 27 | 14 | 21 | 12 | 7 | 38% | 87% 113% | 92% | 29% | 45% | 67% | 79% | |||
| Leeno Industrial | 058470 KS | 59,000 | N | 80,000 | 3,399 | 25 | 22 | N.A. | 5 | 5 | 4 | 34% | 19% | 15% | N.A. | 22% | 23% | 23% | 24% | ||
| Isc Co Ltd | 095340 KS | 140,600 | OW | 215,000 | 2,253 | 31 | 22 | 19 | 5 | 4 | 3 | 3% | 68% | 43% | 30% | 11% | 16% | 20% | 22% | ||
| Cohu Inc | COHU US | 48 | NC | 2,270 | 54 | 27 | 19 | 3 | 3 | 3 | N.A. | N.A. | 105% | 40% | -4% | 7% | 16% | N.A. | |||
| Mean >> | 37 | 23 | 19 | 4 | 4 | 3 | 18% | 44% | 54% | 35% | 10% | 15% | 19% | 23% | |||||||
| OSAT/Testing house | |||||||||||||||||||||
| Ase Technology H | 3711 TT | 654 | OW | 700 | 89,738 | 33 | 21 | 17 | 7 | 6 | 5 | -27% | 269% | 58% | 28% | 20% | 24% | 31% | 31% | ||
| Amkor Tech Inc | AMKR US | 39 | OW | 85 | 9,764 | 14 | 11 | 10 | 2 | 2 | 1 | 6% | 83% | 27% | 15% | 7% | 14% | 15% | 14% | ||
| Jcet Group Co-A | 600584 CH | 55 | NC | 14,784 | 42 | 31 | 25 | 3 | 3 | 3 | -3% | 48% | 36% | 25% | 5% | 8% | 9% | 11% | |||
| King Yuan Elec | 2449 TT | 263 | NC | 10,344 | 30 | 18 | 13 | 5 | 4 | 3 | 43% | -2% | 68% | 40% | 24% | 19% | 26% | 28% | |||
| Mean >> | 30 | 20 | 16 | 4 | 4 | 3 | 5% | 99% | 47% | 27% | 14% | 16% | 20% | 21% |
Source: Bloomberg Finance .P., J.P. Morgan estimates. Consensus estimates used for stocks Not Covered (NC).
Note: For J.P.Morgan covered names - MPI (Jerry Tsai), CHPT (Jerry Tsai), Technoprobe (Craig A McDowell), WinWay Tech (Jerry Tsai), eeno (Sangsik ee), ISC (Sangsik ee), ASE (Gokul Hariharan), and Amkor (Mayur Ramdhani) - forward financials are based on J.P. Morgan estimates. All other data is from Bloomberg, including consensus estimates for Not Covered companies. CHPT, MPI, WinWay, ASE, and King Yuan Elec are priced as of 22 Oct 2026. FormFactor, Technoprobe, Cohu and Amkor are priced as of 23 Oct 2026. Maxone Semicon, Suzhou Uigreen, and Jcet are priced as of Oct 26, 2026.
CPO premium? Likely too early to tell
The potential to participate in CPO testing moves share prices, but we do not apply a CPO premium to our target multiples for WinWay and MPI given still limited visibility on the adoption timeline. For MPI, the risk is that Insertion 2 (MPI makes the wafer level prober) is canceled to contain the total test time. For WinWay, wafer level socket volume remains constrained by the absence of automated equipment on the market - PIC EIC wafer level optical fibre array alignment is still performed manually, limiting throughput - so volume and revenue contribution from CPO testing remain immaterial.
Test interface sector outlook
Introduction to probe cards and sockets
Probe cards are the main test interface for chip probing, which is performed on wafers to ensure no defective chips enter the packaging process. Sockets are used after semiconductor backend testing (after the chips are packaged), and the process consists of multiple steps such as final test (FT) (performed for all ICs), system level test (SLT) (performed selectively) and burn in. While the socket is mounted on PCBs in all cases, the names of the boards differ according to the process; ie, load board for FT, SLT motherboard for SLT, and burn in board.
Figure 16: Semiconductor manufacturing process overview - probe card and socket structure
Source: J.P. Morgan Probe cards and load boards both comprise mechanical components - pins and sockets - together with PCBs and substrates. These components rely on very different manufacturing technologies, so the supply chain can be complex: vendors frequently source components externally and assemble them into finished probe cards or load boards. Sourcing authority is therefore a key determinant of market dynamics, and probe card integrators can be foundries, OSATs or probe card vendors themselves.
Market outlook
We estimate that global HPC probe card TAM will grow from US$1.6bn to US$5.9bn from 2026E to 2028E, exhibiting a ~94% CAGR. The CAGR can be broken down into three key factors: 1) growth of the Device Under Test (DUT; die in this case); 2) per chip probing time increase; 3) per probe card pin count increase; and 4) migration to MEMS probe card.
We estimate that HPC FT/SLT socket TAM will grow from US$0.9bn to US$3.7bn from 2026E to 2028E, exhibiting a ~104% CAGR. The CAGR can be broken down into three key factors: 1) growth of the Device Under Test (DUT; chip in this case); 2) per chip FT/SLT testing time increase; and 3) per socket pin count increase (correlated to package size increase).
Figure 17: HPC probe card TAM and YoY growth
Source: All data is based on J.P. Morgan estimates.
Figure 18: HPC FT/SLT socket TAM and YoY growth
Source: All data is based on J.P. Morgan estimates.
Figure 19: FT vs SLT HPC socket TAM comparison 4,000
Source: All data is based on J.P. Morgan estimates.
Figure 21: Probe card TAM by segment
Source: All data is based on J.P. Morgan estimates.
2027e
Figure 20: FT vs SLT testing time - using Nvidia GPU as illustration
| (min) | Hopper | Blackwell | Rubin |
|---|---|---|---|
| FT | 3-5 | 6-8 | 8-10+ |
| SLT | 60-80 | 80-120 | 120-150+ |
Source: All data is based on J.P. Morgan estimates.
From a testing time perspective, we estimate that burn in socket TAM size is smaller or close to SLT socket TAM in 2025, as suggested by the test time, though the growth could be capped at a similar CAGR going forward, as suggested by the testing time increase.
Test interface TAM growth and sensitivity analysis
Figure 22: Sensitivity of HPC probe card TAM growth
| 75% | From 10% MEMS migrating to xx% MEMS - 20% | From 10% MEMS migrating to xx% MEMS - 30% | From 10% MEMS migrating to xx% MEMS - 40% | |
|---|---|---|---|---|
| Chip probing | -5% | 44% | 51% | 59% |
| time increase | +10% | 66% | 75% | 84% |
| +25% | 89% | 99% | 109% |
Source: All data is based on J.P. Morgan estimates.
Figure 23: FT socket TAM by segment
Source: All data is based on J.P. Morgan estimates.
Figure 25: SLT socket TAM by segment
Source: All data is based on J.P. Morgan estimates.
Figure 27: AI chip probing time trend
Source: All data is based on J.P. Morgan estimates.
Figure 24: Sensitivity of HPC FT socket TAM growth
| Per socket pin count increase | Per socket pin count increase | Per socket pin count increase | ||
|---|---|---|---|---|
| 86% | +15% | +30% | +45% | |
| FT testing time | -5% | 42% | 61% | 79% |
| increase | +10% | 64% | 86% | 107% |
| increase | +25% | 87% | 111% | 136% |
Source: All data is based on J.P. Morgan estimates.
Figure 26: Sensitivity of HPC SLT socket TAM growth
| Per socket pin count increase | Per socket pin count increase | Per socket pin count increase | ||
|---|---|---|---|---|
| 103% | +15% | +30% | +45% | |
| SLT testing time | 5% | 57% | 77% | 98% |
| increase | +20% | 79% | 103% | 126% |
| +35% | 102% | 128% | 154% |
Source: All data is based on J.P. Morgan estimates.
Longer testing times
Figure 28: AI chip FT testing time trend
Source: All data is based on J.P. Morgan estimates.
Chip probing (probe cards)
Heterogeneous integration/chiplet enables more functions per package by combining multiple dies. While each die can become simpler, which leads to probing time per die shortening, the aggregate probing time per chip - the sum across all constituent dies - still rises by 10-15% per chip generation. Wafer level test is the only opportunity to cost effectively sort out bad dies prior to backend testing, and it involves physical contact between every probe on the card (ranging from a few to 200k pins) and the DUT. For large AI class devices, aggregate probe loads can reach tens of kilograms and in extreme cases approach 200-300kg of total applied force, which must be applied uniformly to a thin, rarely perfectly flat silicon structure. Advanced packaging introduces significant topography variation through microbumps, TSVs, copper pillars, redistribution layers and chiplet attachment, so small deviations in coplanarity redistribute load unevenly and create localized stress concentrations that are difficult to predict or control.
Chip probing (CP) is also delicate, and the economic context makes the challenge more acute. A bump that loses height or develops microcracks during wafer probing may survive assembly but fail later under thermal cycling or mechanical stress. AI class devices and large chiplet modules represent enormous silicon value, and a single damaged die can force an entire module to be scrapped. Wafer probe is therefore no longer a low risk screening step but a potential yield limiter whose consequences may not surface until much later.
Final test (sockets/load boards)
We expect Final Test (FT) testing time to continue rising modestly, by generation (assume 10 20% per AI chip generation). High performance devices distribute power across thousands of pins, and degradation in a small fraction of the contacts can be masked by the parallel network, allowing devices to pass test even as local hotspots develop. Rising interface speeds compound the problem: test equipment historically carried ample speed margin, but with high speed interconnects moving from 10Gb/s a decade ago to 100Gb/s today - req iring 110Gb/s capability - margin has effectively disappeared. Testing error rates have risen from approximately 0.1% to 2-3%, and the standard remedy is to increase measurement time to suppress Gaussian random error. Longer FT time is therefore a necessary consequence of higher device speed, not a discretionary choice
J PMORGAN
J PMORGAN
Figure 29: Increase testing time (expands the vertical bounds) to reduce testing error (colored area)
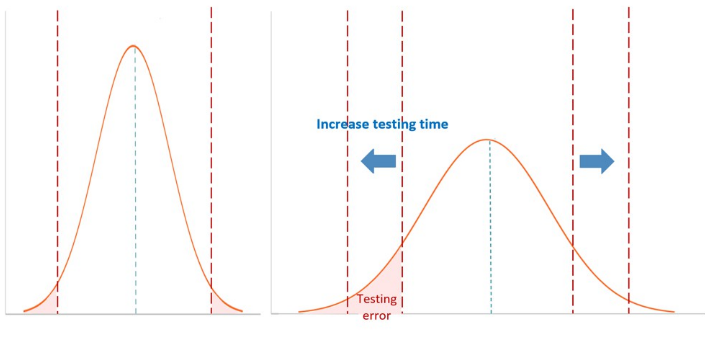
Normal speed interconnect High speed interconnect
Source: J.P.Morgan
System-level test (sockets/SLT boards)
Compared to FT, System level Test (SLT) is a relatively new backend testing process that is developed to resolve the potential defects that could emerge from multi chip packaging (rather than monolithic design). SLT time rises significantly by generation, and heterogeneous integration is the principal cause. As chipmakers pack digital logic, analogue front ends, high bandwidth memory interfaces, and specialized accelerators into a single package, the number of potential cross domain failures multiplies well beyond what conventional ATE (Automated Test Equipment) can address. ATE remains highly effective at verifying individual IP blocks against faults, but was not architected to replicate the interplay among heterogeneous components under real life conditions. SLT fills this void by running the fully integrated system with realistic workloads, power management ICs, memory subsystems and high speed serial links, identifying coherency violations and thermally induced timing drift.
We see heterogeneous integration/chiplet as a structural tailwind for SLT testing time for two reasons. 1) Assembled multi chiplet packages are simply too expensive to fail, and extended SLT provides the necessary assurance - scrap costs for 2.5D/3D designs accumulate geometrically from fabrication to assembly, versus broadly linear accumulation for monolithic devices. 2) Multi vendor supply chains introduce an error tracking challenge that only a comprehensive end to end functional test can resolve: when each chiplet supplier delivers its own test program built on a proprietary methodology, the final integrator must still guarantee system level correctness and isolate root causes across the data path. This applies not only to high profile HPC chips but extends into the smartphone AP domain, where chiplets and heterogeneous integration are increasingly prevalent and mixed protocol internal interfaces create interaction level errors that only comprehensive SLT can detect.
Addressing the key debate - test time red ction
Investors frequently argue that AI and machine learning will shorten testing time. We see the impact as limited for HPC chips, particularly AI chips, where chip lifetimes are only one to two years and process maturity never arrives. Adaptive testing relies on applying only the necessary test content based on tester data, on die sensors and upstream inspection data - a technique that works for mat re processes with high, stable yield, where tests can be eliminated, sampling substituted for full testing, or two pass flows adopted. Leading edge AI silicon does not meet these preconditions.
Critically, the impact on test consumables is negligible, even where testing time reduction is achieved, because sockets and probe cards are ordered to fulfill the initial test time. Testing time reduction is therefore more relevant to OSAT throughput economics and chip launch timing than to interface consumable demand.
We expect chip probing time across major HPC chips (GPU, ASICs) to grow at a CAGR of 10-15% from 2025 to 2028e, while we expect FT/SLT testing time to grow at 15-20% CAGR.
Longer dwell time reduces throughput per socket position and increases the number of sockets required for each production ramp, while also raising contact wear and replacement demand, providing a recurring revenue stream beyond initial socket deployment.
Table 3: Key chip heterogeneous integration trend
| Heterogeneous integration (HI) | 2019-22E | 2023-24E | 2025-27E |
|---|---|---|---|
| Nvidia AI GPU | v | v | |
| Google TPU | v | v | |
| AWS Graviton CPU | v | v | |
| Intel regular server CPU | v | ||
| Intel PC CPU | v | v | |
| Mobileye ADAS chip | v | ||
| Qualcomm Snapdragon Ride ADAS chip | v | v | |
| Qualcomm smartphone AP | v | v | |
| Mediatek smartphone AP | v | v |
Source: All data is based on J.P.Morgan estimates.
More chip and die designs to offload AI workload, plus localization
Advanced packaging reshapes probing. Reticle limits constrain monolithic die size, pushing designers toward chiplets, interposers and large chip on wafer structures. A chiplet is a small, unpackaged circuit optimized for a single function at its most suitable process node; the concept emerged as integrating too many components onto a single SoC compressed yield rates. By enabling modularization and design flexibility, chiplets can be integrated across different chip types on a substrate through advanced packaging.
J PMORGAN
Chiplet architecture materially expands testing demand, as each package contains multiple dies that must be screened as known good dies prior to assembly. The heterogeneous nature of these designs, spanning compute, I/O and auxiliary dies, further necessitates separate probe card designs and qualification cycles per die type. More dies and chip designs mean more probe card and socket designs are required, each needing to be customized.
Localization benefit: indeed, b t thesis even more valid in socket
Meanwhile, we believe localization could also be a driving force for both WinWay and MPI. The rising project count demands intensive, iterative communication between vendor and customer, structurally favoring Taiwan suppliers co located with the foundry and OSAT base. However, we note that there are different industry dynamics when it comes to localization for probe cards and sockets. For sockets, the global industry consists of multiple suppliers with similar production scale. Over the years, each vendor was able to build 'territories' in a given market. Hence, the competition is less fierce. In the socket space, WinWay is benefitting from localization in some areas such as SLT, which was previously mostly taken by its US/UK peer (Smiths Interconnect, now part of Molex; not listed), as it is starting to gain share in this fast growing market.
For probe cards, while the localization needs are rising to meet the increasing project numbers and rapid product cycles, the international players are still very much forces that need to be reckoned with. The industry is currently led by Technoprobe (TPRO IM, covered by Craig A McDowell) and Formfactor (FORM US, Not Covered), and these leading players have been expanding their supply chain collaborations and local support in Taiwan.
Increasing technical barriers from higher pin count and larger package size
The ASP/content per probe card and socket are both direct functions of pin count. Driven by more complex I/O layout and larger package sizes, the pin count per probe card and FT/SLT socket is expected to increase structurally, driving content growth. We estimate the major AI chips (GPU, ASICs, etc.) probe card/socket pin count to grow at a ~10-20% CAGR from 2026E to 2028E. Larger packages require more complex contact architecture, signal integrity control, thermal management, and mechanical support. We therefore expect revenue per test position to rise even under our conservative ASP assumptions (assume flat to 0 5% increase YoY), supporting a richer product mix and a more durable growth profile.
Entry barriers rise for both probe cards and sockets under higher pin counts. Chiplet adoption drives I/O count, and more I/O means higher pin count. On the probe side, probe area size has physical limits, though vendors are developing solutions to manage aggregate force and coplanarity at scale.
Figure 30: Nvidia GPU probe card pin count growth
Source: All data is based on J.P.Morgan estimates.
Figure 31: Nvidia GPU probe card ASP
Source: All data is based on J.P.Morgan estimates.
Figure 32: MEMS pin ASP trend
Source: All data is based on J.P.Morgan estimates.
Addressing the parallelism co nter-arg ment
Meanwhile, we believe some investors are concerned that parallel testing - which refers to testing multiple numbers of dies or IC packages simultaneously on the same test interface - could diminish the value add of testing. In our view, while higher chip probing (CP) parallelism can reduce total test time per chip generation, it does not reduce overall pin consumption, which is the main driver for pin producers such as MPI. Parallel testing also introduces noise, and capability depends on die size and the number of test instruments required. Test engineering teams must balance DUT power draw, pin count, and circuitry performance against ATE instrumentation; reconcile DUT properties with thermal control, probe/test interface boards, probe tips or sockets, and handler capabilities; manage thermal, mechanical, and electrical characteristics across multiple sites; and absorb increased PCB routing complexity from higher die per unit counts and board multiplexers.
Industry risks
Testing time red ction or slower-than-expected increase
The sector's growth outlook depends on longer testing times, higher pin count, and rising SLT requirements. If tester throughput improves faster than expected, test time growth can be compressed, reducing the number of socket positions required per AI platform. We believe the rising SLT mix and higher pin count provide structural offsets, but faster test time reduction would still limit FT/SLT socket TAM growth and weaken the sector's earnings visibility.
Key project (AI chip) delays
Interface demand is concentrated in a small number of large AI platforms. Delays to major GPU, ASIC or CPU roadmaps would push out qualification and volume ramps, deferring revenue recognition for suppliers that have already added capacity and incurred depreciation and staffing costs.
AI capex concerns
The sector's growth is closely tied to robust demand for AI chips and the continued expansion of AI accelerator platforms. If global AI demand weakens, CSP (Cloud Service Providers) capex converts to revenue more slowly, or major platform roadmaps slip, customers may slow capacity reservations and reduce test interface orders. This could result in excess socket or probe card capacity, longer qualification cycles, weaker utilization and downward pressure on revenue growth.
Figure 33: Top 4 US CSPs - annual datacenter capex US$bn ( HS); % (RHS)
Source: 650 Group and J.P. Morgan estimates.
Increasing competition - probe cards
Probe card competition is broader and more technology segmented, and we view it as the more acute risk. Multiple vendors participate in parallel during design in and qualification, but volume production typically narrows to a single or dual source structure. This winner takes most dynamic means that relatively small differences in technical performance, qualification timing or production readiness can drive materially different allocation outcomes. Simultaneous capacity additions across several well capitalized incumbents could reduce lead time scarcity, moderate pricing power and make supplier specific share gains more dependent on actual qualification outcomes. High technical entry barriers therefore do not necessarily imply low competitive intensity once vendors enter the qualified supplier pool.
Increasing competition - sockets
High end socket competition tends to be account and platform specific. Smiths, Leeno and ISC may possess comparable technical capability and can also add capacity. However, replicating qualification history and production learning on an active customer platform typically takes longer than adding generic equipment or outsourced pin supply. We therefore view the near term competitive risk as moderate, with the principal risk being share loss on a specific platform transition rather than broad based erosion.
Figure 34: Probe card vs socket margin
Note: Use Technoprobe and ISC as proxy for probe card and socket sectors, respectively. Source: Company data.
J PMORGAN
Competitive landscape
Sockets - concentrated and stable market share on delivery and local support
For high-end test sockets, we view WinWay and Smiths Interconnect as the most direct competitors in AI/HPC applications. ISC is emerging for chips tested in Korea and favors local supply chain (ISC has the strong local support as competitive advantage). Leeno is strong in pogo pin sockets and rapid customization, while Yokowo, Enplas and Yamaichi are more exposed to memory, automotive and rubber socket applications. The effective qualified supplier pool for leading AI platforms therefore remains concentrated on a few qualified players instead of the overall socket peer set. Entry requires not only product capability, but also on time delivery and local debugging support.
High end socket competition tends to be account and platform specific. Early co development, local engineering support, customer specific qualification and production history can establish relatively defined supplier territories and make allocation more persistent across product generations. While the absolute technical entry barrier remains below that of advanced probe cards, the effective competitive set within an individual high volume AI program may still be limited, supporting a comparatively greater share predictability.
Table 4: Socket competitive landscape overview
| WinWay | Smiths | Leeno | Cohu | Yokowo | ISC | Enplas | Yamaichi | |
|---|---|---|---|---|---|---|---|---|
| Ticker | 6515 TT | Private | 058470 KS | COHU US | 6800 JP | 095340 KS | 6961 JP | 6941 JP |
| Market cap (US$bn) | 5.4 | N/A | 3.4 | 2.3 | 0.5 | 2.3 | 0.5 | 1.0 |
| FY25 Revenue (US$mn) | 253 | 559 | 373 | 453 | 90 | 220 | 282 | 350 |
| FY26-28e EPS CAGR (%) | 104% | N/A | N/A | 68% | 15% | 28% | 14% | 6% |
| FY25 GM (%) | 46% | N/A | 56% | 43% | 19% | 44% | 46% | 41% |
| Segment breakdown | Socket related ~65% Probe card ~25% | N/A | Socket: ~90% Medical Equipment: ~10% | Equipment: ~40% Test interface and others: ~60% | Testing: ~20% VCCS:~60% FCMD:~10% | N/A | Semiconductor: ~55% Energy Saving: ~35% Other: ~10% | Test solution: 50% Connector: ~45% Optical ~5% |
| Description | HPC test socket supplier, deep partnerships with leading GPU makers like NVIDIA. | Top-tier coaxial sockets, focus high-end AI and networking chips. | Focus in smartphone pogo pin market, offering highly customized test solutions with extremely short lead times. | Testing equipment (prober, tester, handler etc) and test interface provider while focusing on logic market | High-frequency and automotive testing sockets. | Global silicon rubber socket leader, dominating memory testing while expanding into AI. | High-frequency and automotive burn-in sockets | Burn-in and test sockets customized for harsh automotive and industrial environments. |
| Key customers/ end- markets | Nvidia, AMD (more FT exposure) | Nvidia, AMD (more SLT exposure) | R&D, smartphone segment | Logic market, both FT and SLT exposure | Auto chip segment | Broadcom, Nvidia, memory segment | Burn-in socket | Burn-in socket |
Note: WinWay's market cap data is as of 22 Oct 2026 ; Cohu is priced as of 23 Oct 2026; eeno, Yokowo, ISC, enplas, and Yamaichi are priced as of 26 Oct 2026.For J.P. Morgan covered names - WinWay Tech (Jerry Tsai), eeno (Sangsik ee), and ISC (Sangsik ee) - forward financials are based on J.P. Morgan estimates. All other data is from Bloomberg. Source: Bloomberg Finance .P., J.P. Morgan estimates.
Probe cards - technology-oriented; winner-takes-most
For probe cards, competition is broader and more technology-segmented. FormFactor and Technoprobe are the global leaders in advanced MEMS probe cards, while Micronics Japan and JEM have established positions in memory and vertical probe cards. MPI is a leading Taiwanese supplier expanding from VPC into MEMS, while Suzhou UIGreen benefits from semiconductor localization in China. The transition from cobra pin to MEMS pin raises technical barriers, but may also reopen qualification and reset supplier allocation, making market share outcomes more program dependent.
J PMORGAN
Advanced probe card competition is highly technology driven. Multiple vendors may participate in parallel during the design in and qualification stage, but the supplier pool typically narrows to a single or dual source structure for volume production. This creates a winner takes most outcome, where relatively small differences in technical performance, qualification timing or production readiness can result in materially different allocation and revenue outcomes. As a result, despite higher technical barriers and stronger margin characteristics, supplier specific earnings visibility can remain limited until the final qualification and share split are confirmed.
Table 5: Probe card pin competitive landscape overview
| MPI | Formfactor | Technoprobe | Micronics Japan | JEM | Suzhou Uigreen | Maxone Semiconductor | |
|---|---|---|---|---|---|---|---|
| Ticker | 6223 TT | FORM US | TPRO IM | 6871 JP | 6855 JP | 688661 CH | 688809 CH |
| Market cap (US$bn) | 15 | 8 | 17 | 3 | 1 | 2 | 7 |
| FY25 Revenue (US$mn) | 419 | 780 | 724 | 469 | 147 | 126 | 141 |
| FY26-28e EPS CAGR (%) | 73% | 32% | 48% | 15% | 3% | 79% | 52% |
| FY25 GM (%) | 56% | 40% | 56% | 50% | 43% | 22% | 65% |
| Segment breakdown | Probe card: ~70% Equipment.: ~20% | Probe card: ~80% System markets: ~20% | Probe card: 100% | Probe card: ~95% Others: ~5% | Probe card: ~95% Others: 0-5% | Precision copmonent: ~40% Probe card: ~35% | Probe card: 100% |
| Description | Leading Taiwanese probe card pin supplier | Global leader in advanced MEMS probe cards(Memory and logic) | Focus on non-memory MEMS probe cards, deep-rooted tier- 1 foundry partnerships | Japan's foremost memory probe card supplier | Japan player with vertical and MEMS probe cards | Primary beneficiary of China semiconductor supply chain localization | Primary beneficiary of China semiconductor supply chain localization |
| Key customers/ end- markets | Logic play, Nvidia, Broadcom | Memory play, expanding into logic | Logic play, TSMC's major partner | Memory play | Memory play | China domestic market | China domestic market |
Note: MPI's market cap data is as of 22 Oct 2026; FormFactor and Technoprobe are priced as of 23 Oct 2026; Micronics Japan, JEM, Suzhou Uigreen, and Maxone Semiconductor are priced as of 26 Oct 2026. For J.P. Morgan covered names - MPI (Jerry Tsai), Technoprobe (Craig A McDowell) - forward financials are based on J.P. Morgan estimates. All other data is from Bloomberg. Source: Bloomberg Finance .P., J.P. Morgan estimates.
Initiation
Overweight
6515.TW, 6515 TT Price (22 Oct 26):NT$4,795.00 Price Target (Dec-27):NT$7,500.00
Technology
erry Tsai AC (886-2) 2725-9867 jerry.tsai@jpmorgan.com J.P. organ Securities (Taiwan) Limited
| Quarterly Forecasts (FYE Dec) - Adj EPS (NT$) | Quarterly Forecasts (FYE Dec) - 2025A | Quarterly Forecasts (FYE Dec) - 2026E | Quarterly Forecasts (FYE Dec) - 2027E |
|---|---|---|---|
| Q1 | 17.09 | 19.38A | 32.09 |
| Q2 | 5.72 | 18.44A | 50.12 |
| Q3 | 10.31 | 29.03 | 62.28 |
| Q4 | 13.41 | 15.88 | 34.21 |
| FY | 46.54 | 82.75 | 178.70 |
Style Exposure
| uant - Factors | Current - %Rank | Hist %Rank (1=Top) - 6M | Hist %Rank (1=Top) - 1Y | Hist %Rank (1=Top) - 3Y | Hist %Rank (1=Top) - 5Y |
|---|---|---|---|---|---|
| Value | 59 | 83 | 75 | 48 | 58 |
| Growth | 5 | 10 | 21 | 3 | 14 |
| Momentum | 74 | 3 | 8 | 77 | 93 |
| Quality | 16 | 47 | 43 | 1 | 3 |
| Low Vol | 95 | 66 | 97 | 89 | 70 |
WinWay Technology
Unlocking SLT socket TAM, initiate at OW
We initiate coverage of WinWay Technology at OW, with a Dec 27 PT of NT$7,500 (26x 2028E EPS excl probe card). WinWay's test sockets, contact elements and probe card busi nesses all benefit from rising AI test intensity and supply chain localization, and we expect socket demand to outgrow visible qualified capacity through 2028E. Notably, we hold a differentiated view that the high end socket franchise - not the probe card business the market has fixated on - is where WinWay's value add is most defensible, and we therefore anchor our PT on socket related earnings.
- Expanding dominance in FT socket into SLT socket. WinWay is the global leading supplier of high end Final Test (FT) sockets, while its main competitor Smiths (not list ed) currently has the leading market share in System level Test (SLT) socket space according to our estimate. (WinWay's shares were modest before 2025). We project the FT/SLT socket market for AI/HPC will expand from US$0.9bn in 2026E to US$3.7bn in 2028E, with SLT socket the bigger incremental driver from US$0.7bn (72% of total AI/HPC) in 2026E to US$3.1bn (84%) in 2028E. WinWay is starting to expand into the SLT socket segment with Nvidia (we estimate 20%/25%/30% m/s in 2026/27/28E). We estimate that Nvidia SLT socket revenue will account for 23%/35%/44% of Win Way's total rev in 2026/27/28E, while WinWay's SLT mix will rise from 56% in 2026E to 70% of socket revenue by 2028E. Our 2028E EPS for WinWay is on par with consen sus.
- Capacity a binding constraint ind stry-wide; WinWay adding the most. We esti mate identifiable HPC socket pin capacity across players such as WinWay, Leeno (058470 KS, covered by Sangsik Lee), ISC (095340 KS, covered by Sangsik Lee), Yokowo (6800 JP, NC), and Smiths (not listed) will rise from ~950mn pins in 2026E to 2.1bn pins in 2028E, vs modeled demand rising from ~650mn to 2bn pins. Win Way's own HPC socket pin capacity grows 4x to 200-250mn pins by 2028E on our estimates - the largest absolute addition in our framework. We forecast its HPC FT/ SLT m/s rising from 28% in 2026E to 30%+ in 2028E. We see earnings upside from potential share gains in multiple major US chip makers (including networking and CPU customers) and ASIC opportunities.
- Differentiated view on what drives allocation. Contrary to the perception that socket share turns on product specifications, we think early design for test engagement, local engineering support and qualification history are the durable moats which are some times overlooked by investors. WinWay is Taiwan's biggest socket player and has mean ingfully higher client service resources locally vs any of its international peers. We do not assume any player (including WinWay) possesses irreplaceable technology; we assume product readiness and earlier qualification increases its probability of receiving and retaining allocation. The critical evidence will be repeat production orders and cross generation adoption.
- Initiate at OW. Our Dec 27 PT of NT$7,500 is based on 26x 2028E socket-related EPS, a premium to socket peers at a blended ~21x and a discount to probe card peers. In the case of WinWay, we believe such a premium is well deserved on company's strong ties to major key customers plus a decent track record for quality and delivery. We project FY26-28E EPS (socket) CAGR of 108% vs 40-50% for socket peers. Downside risks include faster than expected test time reduction, Final Test (FT) test intensity shifting left to chip probing (CP), and AI capex deceleration.
Price Performance
— 6515.TW Price (NT$)
— TSE (rebased)
| YTD | 1m | 3m | 12m | |
|---|---|---|---|---|
| Abs | 68.8% | -16.8% | -26.2% | 94.5% |
| Rel | 9.8% | -13.1% | -28.9% | 28.0% |
Company Data
| Shares O/S (mn) | 36 |
|---|---|
| 52-week range (NT$) | 11,447.67-2,097.25 |
| Market cap ($ mn) | 5,360 |
| Exchange rate | 32.60 |
| Free float (%) | 75.6% |
| 3M ADV (mn) | 0.56 |
| 3M ADV ($ mn) | 106.3 |
| Volatility (90 Day) | 80 |
| Index | TAIEX |
| BBG ANR (Buy | Hold | Sell) | 15|0|0 |
Key Metrics (FYE Dec)
| NT$ in millions | FY25A | FY26E | FY27E | FY28E |
|---|---|---|---|---|
| Financial Estimates | ||||
| Revenue | 7,857 | 14,205 | 26,335 | 46,370 |
| Adj. EBIT | 2,070 | 3,614 | 8,060 | 15,518 |
| Adj. EBITDA | 2,328 | 3,928 | 8,540 | 16,178 |
| Adj. net income | 1,673 | 3,007 | 6,513 | 12,510 |
| Adj. EPS | 46.54 | 82.75 | 178.70 | 343.27 |
| BBG EPS | 45.81 | 95.52 | 192.95 | 342.82 |
| Cashflow from operations | 3,312 | 2,618 | 8,486 | 17,366 |
| FCFF | 3,032 | 1,266 | 5,986 | 14,766 |
| Margins and Growth | ||||
| Revenue Growth Y/Y (%) | 35.5% | 80.8% | 85.4% | 76.1% |
| EBIT margin | 26.3% | 25.4% | 30.6% | 33.5% |
| EBIT Growth Y/Y (%) | 51.3% | 74.6% | 123.0% | 92.5% |
| EBITDA margin | 29.6% | 27.7% | 32.4% | 34.9% |
| EBITDA Growth Y/Y (%) | 45.0% | 68.8% | 117.4% | 89.5% |
| Net margin | 21.3% | 21.2% | 24.7% | 27.0% |
| Adj. EPS growth | 37.7% | 77.8% | 115.9% | 92.1% |
| Ratios | ||||
| Adj. tax rate | 18.8% | 20.2% | 20.0% | 20.0% |
| Interest cover | NM | NM | NM | NM |
| Net debt/Equity | NM | NM | NM | NM |
| Net debt/EBITDA | NM | NM | NM | NM |
| ROE | 27.9% | 41.0% | 58.0% | 64.2% |
| Valuation | ||||
| FCFF yield | 1.8% | 0.7% | 3.4% | 8.4% |
| Dividend yield | 0.5% | 1.0% | 0.2% | 1.0% |
| EV/Revenue | 21.9 | 12.1 | 6.4 | 3.5 |
| EV/EBITDA | 74.0 | 43.9 | 19.8 | 9.9 |
| Adj. P/E | 103.0 | 57.9 | 26.8 | 14.0 |
Summary Investment Thesis and Valuation
Investment Thesis
We are OW on WinWay, as we believe it is the main beneficiary of the rising SLT socket TAM. While testing socket emphasizes early co development, on time local support, and delivery, we expect WinWay's strong capacity expansion and superior local support in the testing space will continue to help WinWay capture more market share on top of the TAM growth.
Val ation
Our Dec 27 TP is based on 26x 2028E socket related EPS. 26x is on par with Winway's average P/E since 2023 and is at a 15 20% premium to industry peers. We believe the multiple is justified given WinWay's accelerated revenue growth from entering the SLT socket market and further share gains in 2027/28E.
WinWay Earnings Estimates
Table 6: Income statement highlights: Annually JPMe vs Consensus
NT$ mn except for EPS
| JPMe - 2026E | JPMe - 2027E | JPMe - 2028E | Consensus - 2026E | Consensus - 2027E | Consensus - 2028E | Difference - 2026E | Difference - 2027E | Difference - 2028E | |
|---|---|---|---|---|---|---|---|---|---|
| Revenues | 14,205 | 26,335 | 46,370 | 15,299 | 26,342 | 43,140 | -7% | 0% | 7% |
| Gross profit | 5,776 | 10,958 | 19,863 | 6,443 | 11,893 | 19,898 | -10% | -8% | 0% |
| GM (%) | 40.7% | 41.6% | 42.8% | 42.1% | 45.2% | 46.1% | -145bps | -354bps | -329bps |
| Operating profit | 3,614.0 | 8,059.6 | 15,518.4 | 4,061 | 8,547 | 15,597 | -11% | -6% | -1% |
| OPM (%) | 25.4% | 30.6% | 33.5% | 26.5% | 32.4% | 36.2% | -110bps | -184bps | -269bps |
| Pre-Tax profit | 3,768 | 8,141 | 15,638 | 4,260 | 8,678 | 15,492 | -12% | -6% | 1% |
| Net profit | 3,007 | 6,513 | 12,510 | 3,442 | 6,957 | 12,420 | -13% | -6% | 1% |
| Net Margin | 21.2% | 24.7% | 27.0% | 22.5% | 26.4% | 28.8% | -133bps | -168bps | -181bps |
| EPS (NT$) | 82.75 | 178.70 | 343.27 | 95.52 | 192.95 | 342.82 | -13% | -7% | 0% |
Consensus data is as of 22 Oct 2026.
Source: J.P. Morgan estimates, Bloomberg Finance .P.
Figure 35: WinWay rev & YoY growth
Source: J.P. Morgan estimates, Company data.
Figure 37: WinWay rev by segment
Source: J.P. Morgan estimates, Company data.
Figure 36: WinWay socket-related EPS & YoY growth
Source: J.P. Morgan estimates, Company data.
Figure 38: WinWay rev mix by segment
Source: J.P. Morgan estimates, Company data.
WinWay Investment Thesis
We are constructive on WinWay over the next three years. AI and HPC are the key growth areas, supported by Nvidia and AMD exposure, dominant local OSAT support, customer design in stickiness and specification design know how. Our core forecast is that AI related socket demand will grow materially faster than qualified capacity growth through 2028E.
Our stock preference within the test interface space reflects this. Probe cards retain higher technical barriers, ASPs and margins, but high end sockets currently offer fewer qualified competition, better allocation visibility after qualification and a slower qualified capacity response. We believe these factors provide a clearer path from AI demand to allocation, utilization and EPS for WinWay than for probe card suppliers, where volume production typically narrows to a single or dual source.
Unlocking SLT socket TAM
HPC SLT socket TAM expands sharply with 110% CAGR
We estimate the HPC System level Test (SLT) socket TAM will rise from US$0.7bn in 2026E to US$3.1bn in 2028E (~110% CAGR), with HPC applications - AI chips (incl. AI CPUs), regular server CPUs, and gaming chips - accounting for ~95% of demand by 2028E. SLT is increasingly important for AI chips because it tests packaged devices under system level operating conditions closer to real world workloads than conventional final test (FT). As AI accelerators become larger, more power dense and more complex, SLT surfaces thermal, power delivery, high speed interface and intermittent reliability issues that shorter electrical tests do not.
The mechanics of why this matters for a socket supplier are straightforward. Longer dwell times and sustained high power workloads make SLT more socket intensive than conventional FT on two counts: 1) longer test duration reduces throughput per socket position, requiring customers to add parallel positions to sustain production output, while 2) higher pin count raises socket content and ASP per position. Longer testing also increases contact wear and replacement frequency, providing recurring revenue beyond initial deployment. We project WinWay's SLT mix rises from ~56% in 2026E to 70% of socket reven e by 2028E.
Heterogeneo s integration is the str ct ral SLT driver
We see heterogeneous integration as a structural tailwind rather than a cyclical one. When multiple ICs and passive elements are packaged together, design for test capability at the assembly level becomes critical, and the challenge resembles a printed circuit board more than a piece of silicon: the objective shifts toward finding assembly errors, which become more prevalent than silicon problems. Conventional ATE isn't effective in replicating the interplay among heterogeneous components under real life conditions. SLT fills that gap by running the fully integrated system with realistic workloads, power management, memory sub systems and high speed serial links, identifying coherency violations and thermally induced timing drift. Multi vendor chiplet supply chains compound the requirements: when each supplier delivers its own test program using a proprietary methodology, the final integrator must still guarantee system level correctness and isolate root causes across the data path.
J PMORGAN
Figure 39: SLT testing time increase - Nvidia GPU
Source: All data is based on J.P.Morgan estimates.
Figure 41: FT/SLT mix of WinWay socket revenue
Leeno Yokowo Others
Source: All data is based on J.P.Morgan estimates.
Figure 40: HPC SLT socket TAM & YoY growth
Source: All data is based on J.P.Morgan estimates.
Figure 42: WinWay socket revenue & growth
Source: All data is based on J.P.Morgan estimates.
5x pin co nt per socket, 5x ASP plift
Socket content per test position should rise materially as AI packages become larger and more pin intensive. We estimate Nvidia GPU pin count will increase from approximately 0.8k in 2026E to 13.5k in 2028E, while AWS accelerator pin count will rise from ~5.8k to 9.9k and Google TPU from ~4.4k to 8.9k over the same period. Larger packages require more complex contact architecture, signal integrity control, thermal management, and mechanical support, and we therefore expect revenue per test position to rise even under conservative ASP assumptions - supporting a richer product mix and a more durable growth profile than unit driven models would imply.
Figure 43: Nvidia GPU test socket pin count
Source: All data is based on J.P. Morgan estimates.
Figure 44: Nvidia GPU test socket ASP
Source: All data is based on J.P. Morgan estimates.
Figure 45: Socket pin ASP assumption
Source: All data is based on J.P. Morgan estimates.
Market share gains from capacity expansion & strong execution
Figure 46: FT/SLT test socket m/s overview
Source: All data is based on J.P. Morgan estimates.
Figure 48: FT/SLT socket pin global supply and demand
Source: All data is based on J.P. Morgan estimates
Figure 47: Capacity expansion for WinWay and peer average
Source: All data is based on J.P. Morgan estimates.
Figure 49: FT/SLT socket pin global supply breakdown
Source: All data is based on J.P. Morgan estimates
We forecast WinWay's FT/SLT socket market share to increase from 20-25% in 2026E to ~30% in 2028E. The principal drivers are greater access to high end AI programs, new SLT exposure - mainly from Nvidia - and sufficient capacity to support customer volume ramps. Historically, high end SLT sockets were dominated by Smiths (not listed), which combined strong socket capability with Nvidia's preference for balancing supply chain orders. We expect the situation to start to change in 2026, as Nvidia chip shipments continue to grow, and our checks suggest one of WinWay's main competitors could be facing under staffing issues locally in Taiwan, while not ramping capacity as quickly as WinWay. We assume WinWay enters Nvidia's SLT market and captures ~20% share in 2026e, reaching 25%/30% in 2027/28E as our base case. Meanwhile, we see no meaningful new socket vendors emerging.
Figure 50: WinWay m/s forecast for FT/SLT sockets
Source: All data is based on J.P. Morgan estimates.
Early co-development and superior local support
The test socket industry is characterized by rapid customer ramps, frequent engineering changes and tight delivery schedules. In this environment, we believe the more durable source of differentiation is not new technologies (say HyperSocket..etc), but WinWay's ability to engage customers and handler partners early in the design for test process.
S pplier selection: on-time delivery and after-sales s pport
Advanced AI sockets are customized around package dimensions, contact mechanics, thermal requirements, system integration and customer specific reliability criteria. Supplier selection therefore depends on engineering responsiveness and qualification execution. Early participation can generate a flywheel: customer co development, faster design iteration, successful qualification, volume production data, and potential carryover into the next product generation. Competitors such as Smiths, Leeno and ISC may possess comparable technical capabilities and can also add capacity, but replicating qualification history and production learning on an active customer platform may require more time than adding generic equipment or outsourced pin supply.
Our share gain thesis does not assume WinWay is technologically irreplaceable - it assumes earlier qualification raises the probability of receiving and retaining allocation. The critical evidence will be repeat production orders and cross generation adoption. On the key debate of whether WinWay can retain allocation across successive Nvidia and other AI platforms, we think it is likely: market shares appear sustainable as long as socket vendors sustain service level and product quality.
Design For Test (DFT) emphasizes early co-development
Design For Test (DFT) methodologies must be adapted to accommodate the specific requirements of 3D package testing, ensuring thorough fault coverage and minimizing test escapes. As DFT moves earlier and becomes more package specific, the supplier involved at the DFT stage gains an information advantage that is difficult for a later entrant to replicate - which is precisely why we weight early engagement more heavily than specification parity in assessing competitive risk.
The market debates whether next generation AI workloads genuinely require a purpose built socket; our view is that HyperSockets will gain share within high end AI programs without displacing coaxial.
HyperSocket: designed for next-gen extra-large package size
Existing coaxial sockets remain viable for most AI chips through 2028E, while HyperSockets address the high end tier where elevated power, pin count and signal speed demand superior durability and signal integrity. Some adoption, which likely started from 2025, will remain selective, as higher unit cost confines deployment to the most demanding applications. Critically, total cost of ownership favors HyperSockets at scale, since extended socket life and reduced replacement frequency offset the higher upfront price.
In our view, the structural FT/SLT demand drivers do not benefit all socket suppliers equally - as packages move beyond the 100mm class, qualification depends on managing warpage, contact force, current delivery, signal integrity and thermal stability simultaneously. This is the point at which conventional architectures begin to face physical trade offs, and where we think content and share opportunity concentrate.
This is where HyperSocket comes in. The proprietary technology is positioned as a hybrid architecture for these applications, with ~30% better contact resistance, current capability and Joule heat performance, at ~30% ASP premium and lower total cost of ownership. Importantly, the higher ASP coexists with a lower total cost of ownership for the customer: longer socket life, supported by the company's elastomer patent position, reduces replacement frequency, while higher test quality and shorter replacement time improve effective throughput.
We do not assume that HyperSockets will become the only viable solution or broadly replace coaxial sockets - conventional architectures remain suitable for a meaningful portion of the market. Rather, we view HyperSockets as expanding WinWay's addressable opportunity in ultra large, high pin count and high power FT/SLT applications where traditional architectures become less optimal.
Table 7: HyperSocket vs other socket types
| Item | Elastomer | Spring probe | HyperSocket |
|---|---|---|---|
| Travel (mm) | 0.2 ~ 0.3 | 0.6 ~ 1.0 | 0.6 ~ 1.0 |
| Contact resistance (mΩ) @ recom. travel | < 50 | < 60 | 25% lower |
| Contact resistance (mΩ) @ 0.15mm | < 50 | < 70 | 50% lower |
| Force (g) @ recom. travel | 40 ~ 85 | 10 ~ 35 | 10 ~ 35 |
| Current capacity (A) | 2.4 | 3 ~ 3.5 | 5 ~ 6 |
Source: J.P. Morgan estimates, Company data.
Investment Risks
Downside risk: FT & SLT test time red ction across chip generations
Our socket TAM and share forecasts rest on test time extending across chip generations; faster than expected test time reduction is the single most consequential downside variable.
The sector's growth outlook depends on longer test time, higher pin count and rising SLT mix. If tester throughput improves faster than we expect, test time growth could compress, reducing the number of socket positions required per AI platform. We analyze the sensitivity of WinWay's earnings to FT test time and market share jointly, since the two variables interact: a shorter test time requires a higher share to sustain the same revenue. We believe the rising SLT mix and higher pin content provide structural offsets, but faster test time reduction would still limit FT/SLT socket TAM growth and weaken earnings visibility across the space.
Downside risk: FT test intensity shifts to chip probing
If test coverage migrates left into chip probing, FT and SLT socket intensity could grow more slowly than we model - a risk that is partly naturally hedged by WinWay's own probe card exposure. A structural risk to our socket led thesis is that test coverage migrates left into wafer level probing rather than right into SLT. The industry rationale for shifting left is real: packaging bad silicon alongside good silicon in advanced 2.5D/3D architectures is financially punitive, and known good die screening at chip probing (CP) is the only cost effective opportunity to sort out bad die before assembly. If customers conclude that incremental coverage is cheaper at CP than at FT or SLT, socket position requirements per platform could grow more slowly than we forecast.
Downside risk: Chip probing shares co ld be volatile
We assume WinWay captures 30% of the addressable Vera/Rosa chip probing opportunity, and estimate related probe card revenue accounts for ~15%/14%/13% of gro p reven e across o r 2026/27/28E forecasts. This is a meaningful share of the group and a meaningful share of the risk: probe card allocation is decided program by program, competition is broader than in sockets, and vendor choice across successive project generations often lacks continuity. Our deliberate decision to anchor the valuation on socket related earnings reflects this - we would rather underwrite the franchise we believe is defensible than capitalize an allocation outcome we cannot yet verify.
Table 8: Nvidia Vera/Rosa CPU probe card rev contribution to WinWay
| Metric | 2026E | 2027E | 2028E |
|---|---|---|---|
| CPU shipment (mn) | 3.9 | 5.2 | 7.0 |
| WinWay m/s (%) | 30% | 30% | 30% |
| WinWay Vera/Rosa probe card revenue (NT$mn) | 2,172 | 3,645 | 6,174 |
| WinWay total rev (NT$mn) | 14,205 | 26,335 | 46,370 |
| Nvidia CPU probe card revenue mix (%) | 15% | 14% | 13% |
Source: All data is based on J.P. Morgan estimates.
Unable to sec re s fficient MEMS pins from Technoprobe: WinWay accesses MEMS probe card technology through a partnership and licensing arrangement with Technoprobe (TPRO IM, covered by Craig A McDowell), under which WinWay performs probe card assembly and design in work with customers while sourcing MEMS pins - the critical, highest value component - from its partner. The arrangement gives WinWay credible MEMS capabilities without the capital intensity and development timeline of building an MEMS pin franchise from scratch, but it also means the company's MEMS volume is bounded by its pin allocation. If Technoprobe prioritizes its own direct business or other partners during a period of tight MEMS supply, WinWay could lose share on programs it has already won. This dependency is, in our view, a further argument for valuing WinWay on its socket franchise, where production internalization is higher and the value chain is more fully controlled.
Margin - probe card is the swing factor: Probe card, not socket, is the swing factor for WinWay's consolidated margin. Socket gross margin was comparatively stable and structurally higher, reflecting greater production internalization; probe card margin has been the drag and is now the swing factor. The Technoprobe phase 2 agreement, effective from 1Q26, materially improves the gross profit of WinWay's MEMS probe card business. Under the earlier arrangement, MEMS probe card profitability was reportedly close to breakeven, limiting earnings contribution despite revenue growth. We now model a margin range at 30-35%, vs the 40%+ for sockets and contact elements.
Table 9: WinWay/Technoprobe MEMS probe card agreement
| Metric | Before phase 2 | Phase 2 / JPMe |
|---|---|---|
| Agreement timing | Before 1Q26 Effective 1Q26 | |
| MEMS probe card GM (JPMe) | 30%+ | Around breakeven |
Source: WinWay, J.P. Morgan estimates..
Downside risk: elastomer patent and later entry vs ISC
HyperSocket's total cost of ownership advantage depends materially on socket life, which in turn rests on WinWay's elastomer patent position. Two risks follow. 1) The patent scope and durability are not settled, and an adverse outcome or successful design around would erode the replacement frequency advantage that justifies the ASP premium. 2) ISC entered the elastomer based solutions market earlier, and in a market where qualification history matters more than specifications - the argument we make in WinWay's favor on sockets generally - incumbency can cut against WinWay in this specific sub segment. We do not treat this as thesis breaking, since HyperSockets is incremental to rather than the basis of our base case, but it is the clearest instance where our own framework works against the company.
Upside risk: CPO extending testing time f rther
In our view, CPO is a longer term optionality rather than a core earnings driver, and we exclude the full opportunity from the base case. CPO represents a longer dated test interface opportunity rather than a core earnings driver. WinWay can supply sockets and related interfaces for later optical engine test insertions, where long test times, precise alignment and higher pin count increase the value of reliable contact solutions. Under an upside scenario, we estimate CPO could add roughly high single digit percent to 2028E revenue. We have not incorporated the content increase in our base case given the uncertainty around architecture, supplier selection and commercialization timing.
J PMORGAN
WinWay began its CPO efforts as early as 2019, when market discussion of related applications was limited and much of the technology and supply chain had yet to mature. Management has indicated that the company's strategy remains focused on its core testing business and does not span all CPO segments, concentrating primarily on electrical testing. We note that the industry level constraint on CPO: Insertion 2 volumes at wafer level remains limited by the absence of automated equipment for PIC EIC optical side fiber array alignment, which is still largely performed manually. Until that bottleneck clears, volume and revenue contribution will stay small regardless of supplier positioning.
Figure 51: WinWay CPO insertion-2 socket offering
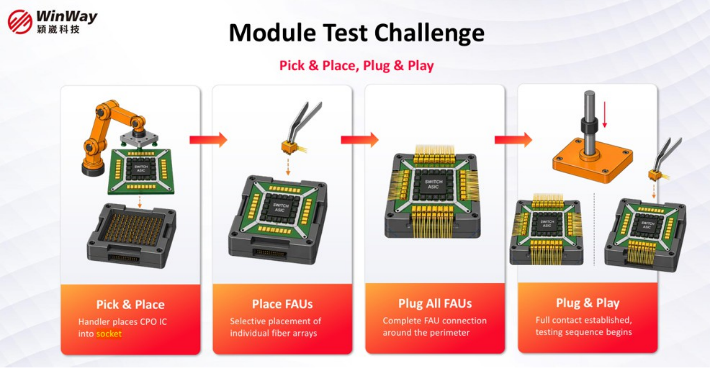
Source: WinWay
Valuation: 26x on 2028E socket-related EPS
We value WinWay at 26x 2028E socket related EPS - a premium to socket peers, and a discount to probe card peers, assuming the valuation gap narrows but does not disappear. WinWay currently trades at a ~27x/14x 2027/28E P/E, vers s 35x/25x for probe card peers and 26x/21x for socket peers excl ding Smiths (not listed). We believe WinWay deserves a premium to traditional socket suppliers because high end AI sockets are increasingly technology , qualification and platform driven rather than commoditized mechanical components. However, we retain a discount to probe card peers given their higher technical barriers and margin profile.
Our target P/E for WinWay is 15-20% above industry peers. We note that WinWay's FY26-28E socket EPS CAGR of 108% - vers s 30-35% for peers - supports the premium. Our 26x therefore assumes the historical socket to probe card valuation gap narrows, but does not close: we assign 28x to MPI on the same 2028E basis, a 2x spread that is considerably narrower than the typical street premium of 6 8x. We think this narrowing is the correct direction of travel. The probe card technical barrier argument is sound, but the competitive environment for probe cards should not be overlooked, while we expect incumbent socket vendors to hold their leadership positions comparatively well.
We do not view probe card as the main value proposition as WinWay has has relatively lower value add in this business (recall that WinWay sources probe card pins from Technoprobe) (Technoprobe: TPRO IM, covered by Craig A McDowell). We therefore exclude probe card EPS contribution and use only socket related EPS in our valuation model.
Figure 52: WinWay socket EPS & growth
Source: J.P. Morgan estimates, Company data.
Figure 53: WinWay 1-year forward P/E band
Source: J.P. Morgan estimates, Bloomberg Finance .P.
Figure 54: WinWay rev mix by product
Source: J.P. Morgan estimates, Company data.
Company Background
Leading socket suppliers in Taiwan; strong footprint in AI/HPC
WinWay Technology is a Taiwan based semiconductor test interface solutions provider, with core manufacturing in Taiwan - Kaohsiung for sockets and in house pins, and Hsinchu for probe cards - alongside capacity in Suzhou, China, and regional offices supporting customers across geographies. The company positions itself as a provider of end to end semiconductor test interface solutions spanning front end chip probing (CP) probe cards through to back end FT/SLT sockets, and has described its market position as test socket global No.1 and No.5 in probe cards.
WinWay focuses on high end test interface hardware and related thermal and mechanical solutions. Demand is driven by a consistent set of structural trends: higher pin count, higher speed and frequency, larger package sizes, higher power and longer test times. Each of these raises the engineering content of a socket and, critically, raises the cost of getting it wrong - a dynamic that we think favors incumbent suppliers with qualification history on active platforms.
Three major lines of products; socket the most important by far
WinWay's revenue is split across three lines: test sockets (FT/SLT/burn in), including coaxial sockets and the next generation HyperSocket architecture designed for high speed, high power and large packages; probe card and probe head solutions for chip probing, where the company is expanding into MEMS via partnership and licensing arrangements; and lastly contact elements and pins, which are the replacement parts, are produced through a mix of in house and outsourced manufacturing with ongoing capacity expansion. Sockets and contact elements together account for ~70% of reven e and probe cards ~25%.
Figure 55: WinWay 2026E rev mix by client
Source: J.P.Morgan estimates.
Table 10: WinWay income statement
| NT$mn, year-end December | 1Q | 2Q FY25 | 3Q | 4Q | FY26E - 1Q | FY26E - 2Q | FY26E - 3QE | FY26E - 4QE | 1QE | 2QE | 3QE | FY27E - 4QE | FY27E - 1QE | FY27E - 2QE | FY27E - 3QE | FY28E - 4QE | FY28E | FY28E - FY22 | FY23 | FY24 | FY25 FY26E | FY27E | FY28E | |
|---|---|---|---|---|---|---|---|---|---|---|---|---|---|---|---|---|---|---|---|---|---|---|---|---|
| Sales | 2,297 | 1,522 | 1,804 | 2,234 | 2,980 | 3,523 | 4,556 | 3,145 | 5,310 | 7,195 | 8,775 | 5,055 | 9,995 | 13,445 | 15,215 | 7,715 | 5,122 | 3,682 | 5,798 | 7,857 | 14,205 | 26,335 | 46,370 | |
| COGS | 1,177 | 777 | 1,045 | 1,302 | 1,699 | 2,173 | 2,696 | 1,862 | 3,143 | 4,209 | 5,132 | 2,892 | 5,789 | 7,692 | 8,683 | 4,342 | 2,800 | 2,317 | 3,265 | 4,301 | 8,429 | 15,377 | 26,507 | |
| Gross profit | 1,120 | 746 | 759 | 931 | 1,282 | 1,350 | 1,860 | 1,283 | 2,167 | 2,986 | 3,643 | 2,163 | 4,206 | 5,753 | 6,532 | 3,373 | 2,322 | 1,365 | 2,534 | 3,556 | 5,776 | 10,958 | 19,863 | |
| Operating expense | 393 | 286 | 352 | 457 | 505 | 525 | 556 | 576 | 727 | 720 | 825 | 627 | 1,029 | 1,210 | 1,141 | 964 | 980 | 808 | 1,165 | 1,487 | 2,162 | 2,899 | 4,345 | |
| R&D | 120 | 79 | 102 | 115 | 148 | 156 | 169 | 173 | 260 | 259 | 281 | 207 | 350 | 417 411 | 355 | 254 | 232 | 347 | 416 | 646 | 1,007 | 1,532 | ||
| Operating (EBIT) | 728 | 460 | 407 | 475 | 777 | 825 | 1,304 | 708 | 1,439 | 2,266 | 2,818 | 1,536 | 3,176 | 4,543 | 5,391 | 2,408 | 1,342 | 557 | 1,368 | 2,070 | 3,614 | 8,060 | 15,518 | |
| Pre-tax profit | 766 | 265 | 459 | 572 | 874 | 848 | 1,323 | 723 | 1,462 | 2,283 | 2,837 | 1,558 | 3,207 | 4,568 | 5,421 | 2,442 | 1,378 | 561 | 1,435 | 2,061 | 3,768 | 8,141 | 15,638 | |
| Net profit | 613 | 205 | 372 | 483 | 699 | 672 | 1,058 | 579 | 1,169 | 1,827 | 2,270 | 1,247 | 2,566 | 3,655 | 4,337 | 1,953 | 1,100 | 464 | 1,186 | 1,673 | 3,007 | 6,513 | 12,510 | |
| Adjusted O/S (mn) | 36 | 36 | 36 | 36 | 36 | 36 | 36 | 36 | 36 | 36 | 36 | 36 | 36 | 36 | 36 | 36 | 34 | 35 | 35 | 36 | 36 | 36 | 36 | |
| EPS (NT$) | 17.09 | 5.72 | 10.31 | 13.41 | 19.38 | 18.44 | 29.03 | 15.88 | 32.09 | 50.12 | 62.28 | 34.21 | 70.40 | 100.28 | 119.00 | 53.60 | 32.07 | 13.39 | 33.79 | 46.54 | 82.75 | 178.70 | 343.27 | |
| Revenue Breakdown | ||||||||||||||||||||||||
| Test Socket | 52% | 49% | 55% | 66% | 64% | 64% | 69% | 89% | 68% | 69% | 68% | 89% | 78% | 77% 72% | 91% | 63% | 73% | 71% | 56% | 71% | 73% | 78% | ||
| Contact Elements | 8% | 13% | 11% | 11% | 7% | 6% | 5% | 7% | 6% | 6% | 5% | 7% | 5% | 5% | 5% | 6% | 12% | 14% | 11% | 10% | 6% | 6% | 5% | |
| Probe Card | 35% | 36% | 29% | 19% | 25% | 28% | 24% | 2% | 24% | 24% | 25% | 3% | 16% | 18% | 22% | 2% | 19% | 7% | 11% | 29% | 20% | 20% | 16% | |
| Others | 4% | 3% | 5% | 4% | 3% | 3% | 2% | 3% | 2% | 1% | 1% | 2% | 1% | 1% | 1% | 1% | 6% | 6% | 7% | 4% | 2% | 1% | 1% | |
| Margins (%) | ||||||||||||||||||||||||
| Gross | 48.8 | 49.0 | 42.1 | 41.7 | 43.0 | 38.3 | 40.8 | 40.8 | 40.8 | 41.5 | 41.5 | 42.8 | 42.1 | 42.8 | 42.9 | 43.7 | 45.3 | 37.1 | 43.7 | 45.3 | 40.7 | 41.6 | 42.8 | |
| Operating | 31.7 | 30.2 | 22.6 | 21.3 | 26.1 | 23.4 | 28.6 | 22.5 | 27.1 | 31.5 | 32.1 | 30.4 | 31.8 | 33.8 | 35.4 | 31.2 | 26.2 | 15.1 | 23.6 | 26.3 | 25.4 | 30.6 | 33.5 | |
| EBITDA | 34.5 | 34.4 | 26.1 | 24.2 | 28.3 | 25.6 | 30.4 | 25.4 | 29.0 | 33.0 | 33.6 | 33.2 | 33.3 | 35.0 36.6 | 33.6 | 28.6 | 18.6 | 27.7 | 29.6 | 27.7 | 32.4 | 34.9 | ||
| Net | 26.7 | 13.5 | 20.6 | 21.6 | 23.4 | 19.1 | 23.2 | 18.4 | 22.0 | 25.4 | 25.9 | 24.7 | 25.7 | 27.2 | 28.5 | 25.3 | 21.5 | 12.6 | 20.5 | 21.3 21.2 | 24.7 | 27.0 | ||
| Growth (%, Q/Q) | ||||||||||||||||||||||||
| Sales | 49.3 | -33.7 | 18.5 | 23.8 | 33.4 | 18.2 | 29.3 | -31.0 | 68.8 | 35.5 | 22.0 | -42.4 | 97.7 | 34.5 | 13.2 | -49.3 | ||||||||
| Gross profit | 52.5 | -33.5 | 1.8 | 22.7 | 37.6 | 5.4 | 37.7 | -31.0 | 68.8 | 37.8 | 22.0 | -40.6 | 94.4 36.8 | 13.6 | -48.4 | |||||||||
| EBIT | 83.7 | -36.8 | -11.4 | 16.5 | 63.6 | 6.2 | 58.1 | -45.7 | 103.3 | 57.5 | 24.4 | -45.5 | 106.8 | 43.0 18.7 | -55.3 | |||||||||
| Net profit | 71.3 | -66.6 | 81.4 | 30.0 | 44.5 | 102.1 | 56.2 | 24.2 | -45.1 | 105.8 | 42.4 | -55.0 | ||||||||||||
| EPS | 71.1 | -66.6 | 80.4 | 30.0 | 44.5 | -3.8 -4.8 | 57.4 57.4 | -45.3 -45.3 | 102.1 | 56.2 | 24.2 | -45.1 | 105.8 42.4 | 18.7 18.7 | -55.0 | |||||||||
| Growth (%, Y/Y) | ||||||||||||||||||||||||
| Sales | 114.1 | 21.2 | -6.5 | 45.1 | 29.7 | 131.4 | 152.6 | 40.8 | 78.2 | 104.2 | 92.6 | 60.7 | 88.2 | 86.9 73.4 | 52.6 | -28.1 57.5 | 77.4 | 77.4 | 77.4 | 35.5 | 80.8 | 85.4 | 76.1 | |
| Gross profit | 8.5 | -8.0 | 61.9 | 44.3 | 179.7 | 158.0 | 43.0 | 85.1 | 93.7 | 90.4 | 55.3 | 84.2 | 50.1 | 92.0 | -41.2 | 85.7 | 40.4 | 62.4 89.7 | 81.3 | |||||
| 93.6 | 4.3 | 43.2 | 55.6 | 82.7 | 69.2 | 51.3 | 123.0 | 92.5 | ||||||||||||||||
| EBIT | 17.5 140.9 | 9.6 38.2 | 5.7 -4.4 | 5.4 | 20.2 | 24.3 | 37.1 | 47.8 | 62.5 | 68.5 | 50.0 | 45.5 | 30.8 | 28.6 55.9 | -58.5 | 126.8 126.1 -57.8 | 145.7 155.5 | 74.6 41.1 79.8 | 116.5 | 92.1 | ||||
| Net profit | 3.2 | 14.6 | 26.7 | 14.4 | 81.1 | 145.1 | 37.8 | 69.0 | 121.1 37.0 | 95.8 | 94.1 | 92.7 | 79.3 | 53.9 | 123.1 | 123.1 | 123.1 | 123.1 | 123.1 | 123.1 | 123.1 | |||
| EPS | 61.7 | 34.8 | 28.6 | 84.0 | 58.1 | 26.0 | 44.0 | 48.4 | 8.9 | 41.5 | 68.2 | 38.3 | -58.2 | 152.4 | 37.7 | 77.8 | 115.9 92.1 | 115.9 92.1 |
Source: J.P. Morgan estimates, Company data.
WinWay income statement
Investment Thesis, Valuation and Risks
WinWay Technology(Overweight; Price Target: NT$7,500.00)
Investment Thesis
We are OW on WinWay, as we believe it is the main beneficiary of the rising SLT socket TAM. While testing socket emphasizes early co development, on time local support, and delivery, we expect WinWay's strong capacity expansion and superior local support in the testing space will continue to help WinWay capture more market share on top od the TAM growth.
Val ation
Our Dec 27 TP is based on 26x 2028E socket related EPS. 26x is on par with Winway's average P/E since 2023 and is at a 15 20% premium to industry peers. We believe the multiple is justified given WinWay's accelerated revenue growth from entering the SLT socket market and further share gains in 2027/28E.
Risks to Rating and Price Target
1) FT/SLT testing time reduction, 2) slower than expected socket pin count growth, 3) market share loss in key AI chip projects, and 4) deceleration of CSP's AI capex
WinWay Technology: Summary of Financials
Cash Flow Statement FY24A FY25A FY26E FY27E FY28E
Cash flow from operating activities
193 3,312 2,618 8,486 17,366
o/w Depreciation & amortization
237
258
314
480
660
o/w Changes in working capital
(1,853)
426 (2,199) (3,449) (4,472)
Cash flow from investing activities
(187)
(409) (1,644) (2,500) (2,600)
o/w Capital expenditure
(299)
(280) (1,352) (2,500) (2,600)
as % of sales
5.2% 3.6% 9.5% 9.5% 5.6%
Cash flow from financing activities
1,118 (310) 2,978 1,742
808
o/w Dividends paid
(378)
(890) (1,787)
(395) (1,713)
o/w Shares issued/(repurchased)
1,173
359 1,719
0
0
o/w Net debt issued/(repaid)
311
228 3,029 2,117 2,496
Net change in cash
1,120 2,591 3,938 7,728 15,574
Adj Free cash flow to firm
(106) 3,032 1,266 5,986 14,766
y/y Growth
(109.4%)(2961.8%) (58.2%) 372.8% 146.7%
Ratio Analysis FY24A FY25A FY26E FY27E FY28E
Gross margin
-
-
-
-
-
EBITDA margin
27.7% 29.6% 27.7% 32.4% 34.9%
EBIT margin
23.6% 26.3% 25.4% 30.6% 33.5%
Net profit margin
20.5% 21.3% 21.2% 24.7% 27.0%
ROE
26.3% 27.9% 41.0% 58.0% 64.2%
ROA
19.0% 20.1% 25.9% 35.1% 41.7%
ROCE
23.6% 27.6% 35.3% 49.7% 58.2%
SG&A/Sales
14.1% 13.6% 10.7% 7.2% 6.1%
Net debt/Equity NM NM NM NM NM
Net debt/EBITDA
NM NM NM NM NM
Sales/Assets (x)
0.9
0.9
1.2
1.4
1.5
Assets/Equity (x)
1.4
1.4
1.6
1.7
1.5
Interest cover (x)
NM NM NM NM NM
Operating leverage
253.6% 144.4% 92.4% 144.0% 121.6%
Tax rate
17.3% 18.8% 20.2% 20.0% 20.0%
Revenue y/y Growth
57.5% 35.5% 80.8% 85.4% 76.1%
EBITDA y/y Growth
134.6% 45.0% 68.8% 117.4% 89.5%
EPS y/y Growth
152.4% 37.7% 77.8% 115.9% 92.1%
Valuation FY24A FY25A FY26E FY27E FY28E
P/E (x)
141.9 103.0
57.9
26.8
14.0
P/BV (x)
30.4
26.7
21.2
12.3
7.1
EV/EBITDA (x)
108.3
74.0
43.9
19.8
9.9
Dividend Yield
0.2% 0.5% 1.0% 0.2% 1.0%
| Income Statement | FY24A | FY25A | FY26E | FY27E | FY28E |
|---|---|---|---|---|---|
| Revenue | 5,798 | 7,857 | 14,205 | 26,335 | 46,370 |
| COGS | (3,028) | (4,043) | (8,115) | (14,897) | (25,847) |
| Gross profit | - | - | - | - | - |
| SG&A | (818) | (1,071) | (1,516) | (1,891) | (2,813) |
| Adj EBITDA | 1,605 | 2,328 | 3,928 | 8,540 | 16,178 |
| D&A | (237) | (258) | (314) | (480) | (660) |
| Adj EBIT | 1,368 | 2,070 | 3,614 | 8,060 | 15,518 |
| Net Interest | 9 | 44 | 25 | 21 | 60 |
| Adj PBT | 1,435 | 2,061 | 3,768 | 8,141 | 15,638 |
| Tax | (249) | (388) | (760) | (1,628) | (3,128) |
| Minority Interest | 0 | 0 | 0 | 0 | 0 |
| Adj Net Income | 1,186 | 1,673 | 3,007 | 6,513 | 12,510 |
| Reported EPS | 33.79 | 46.54 | 82.75 | 178.70 | 343.27 |
| Adj EPS | 33 79 | 46 54 | 82 75 | 178 70 | 343 27 |
| DPS | 10 79 | 24 69 | 49 05 | 10 85 | 46 99 |
| Payout ratio | 31.9% | 53.1% | 59.3% | 6.1% | 13.7% |
| Shares outstanding | 35 | 36 | 36 | 36 | 36 |
| Balance Sheet | FY24A | FY25A | FY26E | FY27E | FY28E |
| Cash and cash equivalents | 1,124 | 2,594 | 3,952 | 7,728 | 15,574 |
| Accounts receivable | 1,837 | 2,152 | 2,975 | 4,744 | 7,229 |
| Inventories | 757 | 842 | 1,118 | 1,716 | 2,573 |
| Other current assets | 1,327 | 838 | 2,223 | 4,014 | 6,180 |
| Current assets | 5,045 | 6,426 | 10,269 | 18,202 | 31,555 |
| PP&E | 2,256 | 2,206 | 3,056 | 3,957 | 4,679 |
| T investments | 0 | 0 | 0 | 0 | 0 |
| Other non current assets | 278 | 412 | 837 | 837 | 837 |
| Total assets | 7,580 | 9,044 | 14,162 | 22,996 | 37,070 |
| Short term borrowings | 31 | 0 | 48 | 54 | 54 |
| Payables | 762 | 1,099 | 1,384 | 2,092 | 3,127 |
| Other short term liabilities | 1,020 | 1,425 | 2,807 | 4,718 | 7,214 |
| Current liabilities | 1,812 | 2,524 | 4,239 | 6,864 | 10,395 |
| ong-term debt | 147 | 0 | 1,600 | 1,800 | 1,800 |
| Other long term liabilities | 81 | 75 | 91 | 111 | 136 |
| Total liabilities | 2,040 | 2,599 | 5,930 | 8,775 | 12,331 |
| Shareholders' equity | 5,540 | 6,445 | 8,232 | 14,220 | 24,740 |
| Minority interests | - | - | - | - | - |
| Total liabilities & equity | 7,580 | 9,044 | 14,162 | 22,996 | 37,070 |
| BVPS | 157 86 | 179 31 | 226 50 | 390 19 | 678 82 |
| y/y Growth | 56.8% | 13.6% | 26.3% | 72.3% | 74.0% |
| Net debt/(cash) | (946) | (2,594) | (2,304) | (5,874) | (13,720) |
Source: Company reports and J.P. Morgan estimates.
Note: NT$ in millions (except per-share data).Fiscal year ends Dec. o/w - out of which
Initiation
Neutral
6223.TW, 6223 TT Price (22 Oct 26):NT$4,890.00
Price Target (Dec-27):NT$5,350.00
Technology
erry Tsai AC (886-2) 2725-9867 jerry.tsai@jpmorgan.com J.P. organ Securities (Taiwan) Limited
| Quarterly Forecasts (FYE Dec) | Quarterly Forecasts (FYE Dec) | Quarterly Forecasts (FYE Dec) | Quarterly Forecasts (FYE Dec) |
| Adj EPS (NT$) | 2025A | 2026E | 2027E |
| Q1 | 7.68 | 12.53A | 23.42 |
| Q2 | 6.67 | 15.55A | 29.32 |
| Q3 | 9.23 | 18.06 | 34.64 |
| Q4 | 9.67 | 19.01 | 36.32 |
| FY | 33.32 | 65.15 | 123.70 |
Style Exposure
| uant - Factors | Current - %Rank | Hist %Rank (1=Top) - 6M | Hist %Rank (1=Top) - 1Y | Hist %Rank (1=Top) - 3Y | Hist %Rank (1=Top) - 5Y |
|---|---|---|---|---|---|
| Value | 85 | 85 | 88 | 35 | 41 |
| Growth | 10 | 9 | 17 | 14 | 11 |
| Momentum | 50 | 13 | 3 | 16 | 67 |
| Quality | 36 | 33 | 38 | 8 | 59 |
| Low Vol | 86 | 91 | 96 | 72 | 93 |
PI
Competition Risk Looms, initiate at Neutral
We initiate coverage of MPI at Neutral, with a Dec 27 PT of NT$5,350 (28x 2028E P/E), given the balanced risk reward. Our N rating is non consensus: all other brokers covering the stock rate the company as OW. We are genuinely positive on the structural growth of advanced probe card demand and we forecast an FY2026-28E EPS CAGR of 73%. Our caution is about price and and the competitive landscape, not about the momentum of growth of the probe card industry.
- Probe card ind stry: aggressive capacity expansion across vendors leads to competition risk. We project the HPC probe card TAM rising from approximately US$1.6bn in 2026E to US$5.9bn in 2028E. MPI is the most aggressive expander in our industry forecast model, with MEMS probe card capacity expanding by more than 4x vs 2025 levels in 2027E (100% CAGR), while probe card peers are also expanding capacity by 35 40% CAGR. We acknowledge that selected chip probing workloads moving from TSMC turnkey towards OSATs opens an accessible opportunity for MPI, but we see competition risk as global leading probe card players are also actively invest ing, even locally in Taiwan, to grasp this opportunity.
- Not yet a leader in MEMS technology.Probe card m/s allocation is very technology driven and the industry dynamic is winner takes most. While the market is optimistic about MPI's capability to grasp MEMS probe card m/s in key HPC projects, we are reserved on this front given already well established players such as Technoprobe (TPRO IM, covered by Craig A McDowell) and FormFactor (FORM US, NC) are also aggressively expanding. We acknowledge that MPI also benefits from the solid probe card TAM growth but we think it should be viewed as one of the beneficiaries instead of of the only one. Our base case includes the confirmed new projects for MPI: we assume MPI takes 20%/25%m/s of AMD's probe card demand in 2027/28E. Howev er, we are more cautious in our assumptions about MPI expanding meaningfully into other HPC projects apart from existing customers (Broadcom switch/TPU, AWS Trai mium/Graviton, Nvidia CPU/LPU /gaming GPU etc). At the company level, we expect MEMS probe cards to account for 20%/35%/48% of MPI's total rev in 2026/27/28E.
- CPO an optionality rather than a major rev pillar. MPI's development spans Inser tion 2 wafer level testing and Insertion 3 die level testing. Our base case already assumes MPI captures 50% of the addressable Ins 2 opportunity (vs street 70%+ m/s), while we also discount the rev by 50% to factor in the possibility for ins 2 to be canceled due to testing time optimization. The result implies ~3%/3% rev mix from ins-2 eq ipment in 2027/28E. We also assume MPI ships 56/80 units of CPO ins 3 die level prober in 2027/28e and estimate this business to account for 6%/6% of MPI 2027/28E rev. While MPI's share has been volatile on CPO equipment chatters (m/s allocation and whether ins 2 will be cancelled), we believe it should be viewed as a good to have optionality instead of a major rev driver (note that CPO equipment margin is only similar to slightly higher vs corporate average so the OP contribution is similar to the rev contri bution). Our 2028E EPS forecast for MPI is 12% lower than consensus.
- Initiate at N. O r Dec-27 PT of NT$5,350 is based on 28x 2028E P/E, a 2x premium to WinWay's 26x, narrower than the typical street premium of 6 8x. We see limited scope for further multiple expansion absent clearer evidence of sustained MEMS share and CPO equipment order finalization. Key upside risks include higher Insertion 2 share, peer delivery delays and stronger than expected localization benefit.
Sources for: Style Exposure - J.P. Morgan Global Markets Strategy; all other tables are company data and J.P. Morgan estimates.
— 6223.TW Price (NT$)
— TSE (rebased)
| YTD | 1m | 3m | 12m | |
|---|---|---|---|---|
| Abs | 117.3% | -8.5% | -18.5% | 168.7% |
| Rel | 58.3% | -4.8% | -21.2% | 102.2% |
Company Data
| Shares O/S (mn) | 98 |
|---|---|
| 52-week range (NT$) | 7,700.00-1,705.00 |
| Market cap ($ mn) | 14,697 |
| Exchange rate | 32.60 |
| Free float (%) | 73.7% |
| 3M ADV (mn) | 1.02 |
| 3M ADV ($ mn) | 172.1 |
| Volatility (90 Day) | 82 |
| Index | TAIEX |
| BBG ANR (Buy | Hold | Sell) | 16|0|0 |
Key Metrics (FYE Dec)
| NT$ in millions | FY25A | FY26E | FY27E | FY28E |
|---|---|---|---|---|
| Financial Estimates | ||||
| Revenue | 13,371 | 21,267 | 37,340 | 54,900 |
| Adj. EBIT | 3,775 | 7,549 | 15,001 | 23,638 |
| Adj. EBITDA | 4,566 | 8,574 | 16,041 | 24,798 |
| Adj. net income | 3,177 | 6,384 | 12,120 | 19,085 |
| Adj. EPS | 33.32 | 65.15 | 123.70 | 194.78 |
| BBG EPS | 32.62 | 65.93 | 133.50 | 220.52 |
| Cashflow from operations | 1,530 | (1,874) | 4,205 | 11,283 |
| FCFF | (2,351) | (5,228) | 2,605 | 9,683 |
| Margins and Growth | ||||
| Revenue Growth Y/Y (%) | 31.5% | 59.1% | 75.6% | 47.0% |
| EBIT margin | 28.2% | 35.5% | 40.2% | 43.1% |
| EBIT Growth Y/Y (%) | 52.0% | 100.0% | 98.7% | 57.6% |
| EBITDA margin | 34.1% | 40.3% | 43.0% | 45.2% |
| EBITDA Growth Y/Y (%) | 50.3% | 87.8% | 87.1% | 54.6% |
| Net margin | 23.8% | 30.0% | 32.5% | 34.8% |
| Adj. EPS growth | 36.4% | 95.5% | 89.9% | 57.5% |
| Ratios | ||||
| Adj. tax rate | 17.3% | 19.9% | 20.0% | 20.0% |
| Interest cover | NM | NM | NM | NM |
| Net debt/Equity | NM | 0.1 | NM | NM |
| Net debt/EBITDA | NM | 0.1 | NM | NM |
| ROE | 26.6% | 40.5% | 58.7% | 64.9% |
| Valuation | ||||
| FCFF yield | (0.5%) | (1.1%) | 0.5% | 2.0% |
| Dividend yield | 0.3% | 0.4% | 0.9% | 1.7% |
| EV/Revenue | 35.6 | 22.5 | 12.7 | 8.5 |
| EV/EBITDA | 104.2 | 55.9 | 29.6 | 18.8 |
| Adj. P/E | 146.8 | 75.1 | 39.5 | 25.1 |
Summary Investment Thesis and Valuation
Investment Thesis
We are Neutral on MPI. Despite expected strong probe card TAM growth in the coming years and MPI's strong capacity expansion, competition across MEMS probe cards remains a big concern as the market is already dominated by other established players such as Technoprobe and FormFactor (both also expanding aggressively). We are genuinely positive on the structural growth of advanced probe card demand and we forecast an FY2026-28E EPS CAGR of 73%. Our caution is about valuation multiple and and the competitive landscape, not about the momentum of growth of the probe card industry.
Val ation
Our Dec 27 TP is based on 28x 2028e EPS. 28x is on par with its P/E average since 2023 (excl extremes). We believe this multiple is justified given the probe card industry is witnessing a structural upcycle driven by stong AI demand.
PI Earnings Estimates
Table 11: J/S Highlights: Annual JPMe vs Consensus
NT$ mn except for EPS
| JPMe - 2026E | JPMe - 2027E | JPMe - 2028E | Consensus - 2026E | Consensus - 2027E | Consensus - 2028E | Difference - 2026E | Difference - 2027E | Difference - 2028E | |
|---|---|---|---|---|---|---|---|---|---|
| Revenues | 21,267 | 37,340 | 54,900 | 21,515 | 39,953 | 59,192 | -1% | -7% | -7% |
| Gross profit | 12,583 | 22,590 | 33,704 | 12,794 | 24,326 | 36,377 | -2% | -7% | -7% |
| GM (%) | 59.2% | 60.5% | 61.4% | 59.5% | 60.9% | 61.5% | -30bps | -39bps | -7bps |
| Operating profit | 7,548.6 | 15,000.7 | 23,638.1 | 7,476 | 15,714 | 26,116 | 1% | -5% | -9% |
| OPM (%) | 35.5% | 40.2% | 43.1% | 34.7% | 39.3% | 44.1% | 75bps | 84bps | -106bps |
| Pre-Tax profit | 7,972 | 15,150 | 23,856 | 7,924 | 15,972 | 26,504 | 1% | -5% | -10% |
| Net profit | 6,384 | 12,120 | 19,085 | 6,419 | 12,986 | 21,396 | -1% | -7% | -11% |
| Net Margin | 30.0% | 32.5% | 34.8% | 29.8% | 32.5% | 36.1% | 18bps | -4bps | -138bps |
| EPS (NT$) | 65.15 | 123.70 | 194.78 | 65.93 | 133.50 | 220.52 | -1% | -7% | -12% |
Consensus data is as of 22 Oct 2026.
Source: J.P. Morgan estimates, Bloomberg Finance .P.
Figure 56: MPI rev & YoY growth
Source: J.P. Morgan estimates, Company data.
Figure 58: MPI rev by segment
Source: J.P. Morgan estimates, Company data.
Figure 57: MPI EPS & YoY growth
Source: J.P. Morgan estimates, Company data.
Figure 59: MPI rev mix by segment
Source: J.P. Morgan estimates, Company data.
Figure 60: MPI 2026E rev mix by client
70%
Source: J.P. Morgan estimates.
80%
Figure 61: MPI 2026E probe card rev mix by client
Source: J.P. Morgan estimates.
Figure 62: HPC probe card TAM growth
Source: All data is based on J.P. Morgan estimates.
PI Investment Thesis
Strong probe card TAM growth
Figure 63: Probe card players' capacity expansion CAGR (2025-27E)
Source: All data is based on J.P. Morgan estimates.
New c stomer AMD
We expect MPI to start supplying probe card for AMD starting from its PC CPU project and to later expand into regular server CPU and GPU projects. We are estimating MPI's m/s for these chip projects at 20%/25% in 2027/28E. Our scenario analysis suggests that there's 2%/3% upside to MPI's rev if it captures 35/50% m/s in 2027/28E.
Table 12: Scenario analysis on AMD project contribution
| Cases | 2027E - Bear | 2027E - Base | 2027E - Bull | 2028E - Bear | 2028E - Base | 2028E - Bull |
|---|---|---|---|---|---|---|
| Probe card TAM (NT$mn) | ||||||
| AMD PC CPU | 1,977 | 2,159 | ||||
| AMD regular server CPU | 459 | 4,782 | ||||
| AMD GPU | 3,427 | 6,585 | ||||
| MPI m/s (%) | 5% | 20% | 35% | 10% | 25% | 50% |
| MPI rev (NT$mn) | ||||||
| AMD PC CPU | 99 | 395 | 692 | 198 | 494 | 988 |
| AMD regular server CPU | 23 | 92 | 161 | 46 | 115 | 230 |
| AMD GPU | 171 | 685 | 1,199 | 343 | 857 | 1,713 |
| Total rev from AMD | 293 | 1,172 | 2,052 | 586 | 1,466 | 2,931 |
| Upside to base case (%) | -2% | 0% | 2% | -2% | 0% | 3% |
Source: J.P. Morgan estimates.
Chip probing o tso rcing
Opport nity: Selected chip probing workloads moving from TSMC toward OSATs
Chip probing (CP) can be performed in house at TSMC (typically for more technically advanced projects or extrernally by the OSAT/testing houses. Based on our channel checks, TSMC capacity constraints could gradually drive selected CP workloads shifting toward OSATs, although sourcing decisions remain program specific. One example is Vera/Rosa CPU probing begins to move toward Amkor from 2026E, gains greater momentum in 2027, and may broaden toward ASE/SPIL thereafter, with selected peripheral programs following from 2028E. Historically, TSMC sources the components from selected vendors, with very close collaboration with Technoprobe (TPRO IM, covered by Craig A McDowell), which provides the majority of pins for TSMC turnkey products. Hence, this increasing CPU and peripheral chip outsourcing provides the more accessible opportunity for other probe card suppliers, especially the domestic players.
We assume MPI captures 55% of the outsourced Vera/Rosa probing opportunity, translating into estimated revenue of approximately NT4bn /6.7bn/11.3bn in 2026/27/28E, equivalent to roughly 19%/18%/21% of group revenue. Our share assumption leaves upside potential if the final supplier pool remains concentrated.
Table 13: MPI Vera/Rosa probe card rev contribution
%; NT$mn
| Metric | 2026E | 2027E | 2028E |
|---|---|---|---|
| CPU shipment (mn) | 3.9 | 5.2 | 7.0 |
| MPI m/s (%) | 55% | 55% | 55% |
| MPI Vera/Rosa probe card revenue (NT$mn) | 3,981 | 6,683 | 11,319 |
| MPI total rev (NT$mn) | 21,267 | 37,340 | 54,900 |
| Nvidia CPU probe card revenue mix (%) | 19% | 18% | 21% |
Source: J.P. Morgan estimates.
Capacity expansion & strong local support
3x capacity expansion to tackle strong TAM growth
Our modelled probe card pin capacity across major suppliers increases from ~355mn pins in 2026E to 632mn pins in 2028E, led by MPI, Technoprobe, FormFactor and Micronics Japan (6871 JP, NC). MPI is the most aggressive expander in our framework, with modeled VPC capacity (cobra + MEMS pins) reaching approximately 3x its 2025 level by 2027E (~80% CAGR), vs other probe card players' aggregate expansion cadence at ~38% CAGR. We read this two ways: capacity is a necessary condition for capturing the AI probing upcycle, and MPI is positioning more decisively than anyone, but simultaneous additions across several well capitalized incumbents erode the lead time scarcity that supports pricing power.
Also note that in advanced probe cards, capacity availability does not by itself secure revenue due to more concentrated market share landscape (winners take the most). MPI's utilization will therefore depend on the outcome of qualifications outcomes of the major AI chip testing projects, rather than on industry demand alone.
Strong local s pport the key advantage; b t migration to MEMS introd ces ncertainties
We believe that local support and response time is a key factor behind share allocations, and these are probably the key advantages vs global peers such as Technoprobe and FormFactor. However, we would not overstate the durability of this: service advantage improves the probability of retaining allocation, but it does not override a qualification outcome in the probe card industry, where technology is still the dominant factor. MEMS technology is where we think MPI's position is weaker relative to global probe card leaders such as Technoprobe and FormFactor. For years, MPI has excelled in cobra pin probe cards, a more mature type of pin technology vs the MEMS which is becoming more prevalent. Currently, Broadcom, which is one of MPI's largest customers, still adopts Cobra pins. We have not yet modelled Broadcom's transition to MEMS through 2028E. But note that the migration, if it happens, could open doors to more competition.
This leads to an important development trend that's not well discussed by investors: that key global competitors are also ramping up their operation scale in Taiwan. Globally, the probe card industry is led by two players, Technopobe and Formfactor, which together have 60 70% m/s in 2026E, according to our estimates. In the past, Technoprobe has been more focused on a major customer (TSMC), while Formfactor has been focused on memory plus US foundries. The investment efforts across several of these well capitalized incumbents could reduce lead time scarcity, moderate pricing power and make supplier specific share gains more dependent on actual qualification outcomes. High technical entry barriers therefore do not necessarily imply low competitive intensity once vendors enter the qualified supplier pool.
We see Technoprobe raising its capex for 2027E. Meanwhile, the company has built multiple in house PCB producers, including some located in Taiwan (such as DIS Tech). Technoprobe also works closely with Taiwan supply chain, including WinWay (Technoprobe signed a 5 year supply agreement with WinWay), plus equipment vendor Innostar (7828 TT, covered by William Yang), where Technoprobe has the exclusive right to utilize the patented double arm needle assembly machine.
Figure 64: Global probe card MEMS pin supply and demand
Source: All data is based on J.P. Morgan estimates Source: All data is based on J.P. Morgan estimates
Figure 65: Global probe card MEMS pin supply breakdown
Figure 66: Technoprobe global presence and presence in Taiwan - DIS (probe card PCB) and YeeWei (probe card assembly equipment)
Source: Technoprobe
Another consequential recent development, in our view, is FormFactor (FORM US, NC) sec ring a position as a second q alified probe card s pplier for Nvidia GPUs man fact red at TSMC. It has announced a target to increase foundry & logic rev mix (logic probe card) relative to memory probe card in 2030E vs 2025. With both global leaders now committed to logic MEMS and both adding capacity, we think MPI's position looks less like a dominant VPC incumbent extending into MEMS and more like a capable third entrant in a market where the two largest players hold materially longer MEMS track records.
Accordingly, MPI's earnings upside will increasingly depend on differentiated qualification wins, product mix and sustained customer allocation - not simply on being the fastest supplier to add capacity. This execution burden remains an important reason for our Neutral stance.
Prober business leads to CPO and other opportunities
MPI was founded as a semiconductor equipment company, and three decades of prober and photonics engineering positions it for CPO and emerging test solutions. The company's equipment heritage is, in our view, the least appreciated asset on the balance sheet. Both the chairman and current CEO came from semiconductor backgrounds and positioned MPI as an equipment company from the outset; probe cards arrived later, when Micronics Japan (6871 JP, NC) transferred CPC (Cantilever Probe Card) technology in 1995 to stay focused on memory. MPI did not pivot away from equipment thereafter: it entered optical electrical measurement in 2001, became the global No.1 in LED equipment by 2002, launched its prober in 2014, and acquired US and European teams in 2014 15 that brought thermal capability. VPC and MEMS were subsequently developed in house.
Equipment accounts for ~25% of MPI's total revenue. Advanced Semi Test segment (AST), which is wafer prober equipment, accounts for ~80% of equipment rev (10 15% of total rev). MPI's wafer prober is mainly used for R&D purposes, with customers ranging from companies, labs, to universities. We note that the same engineering base that produces a flexible R&D prober, an optical electrical LED tester and a -100°C to +300°C thermal device is the base from which CPO tooling and advanced thermal chucks are built. The Focus Microwaves acquisition (completed in 2025) - one of only two tuner patent holders - fits a consistent pattern of securing capability ahead of demand. CPO insertion tooling is therefore a natural course of development.
Table 14: CPO testing insertion 1-4
| Insertion | 1 | 2 | 3 | 4 |
|---|---|---|---|---|
| Desc | PIC probing | EIC-PIC probing (opto-electrical) | Optical Engine (OE) testing | CPO chip testing (burn-in, FT, SLT) |
| Notes | Verify the components in PIC (e.g. passive: waveguides; active: modulator, photodetector); temporary fiber array/fiber attached; Mainly O/O (passive reflection) | Goal: yield filtering >> avoid dicing faulty pairs co-testing after EIC (imp: electrical driver/TIA) is bonded to PIC: O/E and E/O co-test temporary fiber array/fiber attached | Full function test: ensure optical path is fully caliberated after dicing process/fiber array; temporary fiber array attached | System-level functional validation of the fully assembled package, including thermal management under load and multi-engine synchronization; temporary fiber array attached |
| Testing level | Wafer level | Wafer level | Die/package level | Package level |
| Testing items | - single sided probing - electrical/optical DC (power, loss, dark current etc) | - double sided probing - E/O, O/E, O/O - potentially high-speed, S-parameters | - full calibration/DC - high-speed functional, optical loopback - alternatively: S-parameters | - full system functional validation - optical loopback |
Source: J.P. Morgan
We believe MPI's prober expertise confers two advantages: better compatibility between the probe card and the prober, and the ability to develop customized probers as new test demands emerge. More consequentially, it can integrate new functions into a prober rather than supplying a standard platform when new test demands appear this flexibility is important when it comes to providing timely equipment solutions to new testing specifications like Co Packaged Optics (CPO).
CPO co ld help re-rating; however the o tlook for insertion-2 stage is still ncertain...
CPO (Co packaged Optics) is the chip design that integrates optical engines (OEs), which converts signals between electrical form and optical form. The manufacturing process involves bonding an optical wafer (PIC) and an electrical wafer (EIC) together, dicing the double sided wafer into OE, and mounting the OE onto the substrate alongside switch chip. As each step poses failure risk, CPO requires testing after each stage CPO testing is called insertion 1 to 4. Insertion 1 is the test for PIC. Insertion 2 is the double sided test after PIC and EIC are bonded with each other. Insertion 3 is to test each separate OE after they are diced from wafers. Lastly, insertion 4 takes place after OEs are mounted onto the substrate next to switch chip and serve as the test for the whole chip system's function.
MPI's CPO development spans both Insertion 2 wafer level optical electrical testing and Insertion 3 die level optical engine testing, extending the company's role beyond probe cards and test interfaces into integrated test equipment. We believe MPI's relevant differentiation lies in system integration: few suppliers hold all of these capabilities, and assembling them across multiple vendors is slower than sourcing from one.
Insertion 3 die-level prober
We are modelling CPO insertion 3 to account for 6%/6% of MPI's total rev in 2027/28E. Key assumptions include 1) 20/15 seconds testing time per die in 2027/28E, 2) 50% testing buffer (in addition to the testing demand), and 3) MPI holds 100% m/s.
Table 15: MPI CPO insertion-3 equipment model
| MPI - CPO insertion-3 die-level optical engine (OE) prober model | MPI - CPO insertion-3 die-level optical engine (OE) prober model | MPI - CPO insertion-3 die-level optical engine (OE) prober model |
| DUT demand | 2027E | 2028E |
| DUT - OE (mn) | 38 | 126 |
| DUT run rate per equipment | ||
| Testing time per DUT (OE) (sec) | 20 | 15 |
| DUT run rate per equipment annually (mn) | 1.1 | 1.4 |
| # Equipent required | ||
| In theory - # equipment required | 37 | 90 |
| Testing buffer | 50% | 50% |
| 56 | 135 | |
| MPI m/s | 100% | 100% |
| MPI ins-3 # equipment shipment | 56 | 80 |
| Ins-3 equipment ASP (NT$mn) | 40 | 40 |
| MPI ins-3 equipment rev (NT$mn) | 2,220 | 3,180 |
| Ins-3 equipment rev mix % of MPI's total rev | 6% | 6% |
Source: J.P. Morgan estimates.
Insertion-2 wafer level prober
We are modelling CPO insertion 2 to account for 3%/3%% of MPI's total rev in 2027/28E. Key assumptions include 1) 20/15 seconds testing time per die in 2027/28E, 2) 50% testing buffer (in addition to the testing demand), and 3) MPI holds 50% m/s.
However, recent industry discussions have repeatedly raised the prospect of the Insertion 2 being reduced or removed to contain total test time - a recurring driver of share price volatility on which investors remain divided. Management regards cancellation as unlikely while COUPE yields sit well below 100%. We nevertheless believe reduction/removal of Insertion 2 can't be ruled out at this point due to the substantial time and resources required by the process. Therefore, we discount our 2027E ins 2 equipment rev by 50% of probability (of the process to be included) to factor in the possibility that insertion 2 is cancelled. We note that the decision rests with the chip designer rather than with MPI, the foundry or the OSAT.
On the market share/competition side, we currently assume 50% share. Main competitor FiconTEC (under RoboTechnik Intelligent Technology, 300757 CH, NC), had its equipment qualified earlier, but we note that MPI's competitors' probers could be short of mass production requirements on speed, cooling and automation, according to our industry checks. Meanwhile, we believe MPI outperforms peers on automation readiness and wafer level test experience from wafer sorting. Hence, we think it's reasonable to assume 50% m/s for MPI despite the later qualification.
Table 16: Scenario analysis for MPI's CPO insertion-2 rev
| MPI - 2027E CPO insertion-2 E-PIC wafer-level prober scenario analysis Cases | Bear | Base | Bull |
|---|---|---|---|
| Step 1: # of wafer tested per equipment annually | |||
| E-PIC Testing time per die (sec) | 20 | ||
| # of die per wafer | 636 | ||
| Testing time per wafer (hr) | 4 | ||
| Testing hours per day | 16 | ||
| Wafer tested per day | 5 | ||
| Wafer tested per equipment annually | 1,653 | ||
| Step 2: wafer demand annually | |||
| TSMC PIC capacity (kwpm) | 10 | ||
| TSMC PIC capacity (k wafer annual) | 120 | ||
| # of die per wafer | 636 | ||
| Annual PIC production (mn) | 76 | ||
| SoIC yield % | 50% | ||
| OE production (mn) | 38 | ||
| Aggregate yield of all other testing and assembly stages (%) | 25% | ||
| Implied OE shipment (mn) | 10 | ||
| Step 3: # equipment required | |||
| Additional testing buffer % | 50% | ||
| # ins-2 equipment required | 109 | ||
| Ins-2 equipment ASP (NT$mn) | 40 | ||
| Ins-2 equipment TAM (NT$mn) | 4,360 | 4,360 | 4,360 |
| MPI m/s % | 50% | 100% | |
| Implied MPI # ins-2 equipment shipment | - | 55 | 109 |
| 2027 MPI ins-2 equipment rev (NT$mn) - before probability | - 0% | 2,180 50% | 4,360 30% |
| Scenario probability (of happening) | |||
| 2027E MPI ins-2 equipment rev (NT$mn) - discounted w/ probability Ins-2 equipment rev mix % of MPI's 2027E total rev | - 0% | 1,090 3% | 1,308 4% |
Source: J.P. Morgan estimates.
Strong earnings revisions so far, but risks should not be overlooked
We remain constructive on the structural growth of advanced probe card demand, supported by rising AI accelerator shipments, increasing test complexity and higher probe content per device. However, we believe the current valuation already discounts a meaningful portion of MPI's medium term earnings growth and CPO related optionality. Several assumptions required to sustain further upside - MEMS supplier allocation, the probe card sourcing decision flow, peer capacity expansion, the in house PCB ramp, and the commercialization path for Insertion 2 and Insertion 3 equipment - remain difficult to underwrite with high confidence.
MPI's current valuation implies investors are already underwriting robust probe card growth through 2027 28E, continued margin expansion and a meaningful contribution from CPO related equipment. While our earnings forecasts remain strong - we project a FY2026E 28E EPS CAGR of 73% - we see limited scope for further multiple expansion unless the company provides clearer evidence of sustained MEMS share, successful CPO equipment qualification and repeat production orders. Our Neutral rating is a statement about what is already in the price, not about the quality of the franchise.
Figure 67: Recent sell-side MPI 2027E EPS revisions
Source: Bloomberg Finance .P.
Figure 68: Recent sell-side MPI 2028E EPS revisions
Source: Bloomberg Finance .P.
Valuation: 28x 2028e EPS
We believe probe cards still command a technology premium over sockets, but a narrower one than the market applies: MPI at 28x vs WinWay at 26x. Our Dec 27 PT is based on 28x 2028E P/E. We retain a premium for probe cards over sockets, consistent with general market practice and with the view that higher technical requirements warrant a higher multiple.
We would stress, however, that our 2x spread to WinWay's 26x is considerably narrower than the typical street premium of 6 8x, as we re iterate that MPI does not necessarily stand out to us in the industry's migration to MEMS probe card (even with higher technology barriers). The probe card technical barrier argument is sound, but the competitive environment should not be overlooked: allocation is winner takes most and resets at each qualification, whereas we expect incumbent socket vendors to hold their leadership positions comparatively well.
MPI currently trades at 40x/25x 2027/28E EPS (JPMe). Probe card peers are currently trading at approximately 35x/25x 2027/28E EPS, versus 26x/21x for FT/ SLT sockets. We assign a ~15-20% PE premium vs global peers to MPI due to its competitive advantage from strong local support.
Figure 69: MPI 1-year forward P/E band
Source: J.P. Morgan estimates, Bloomberg Finance .P.
Investment Risks
Downside risk: CP test time reduction across chip generations
Our CP TAM build assumes test time and insertions rise with device complexity (10 15% CAGR). If adaptive testing, improved analytics or tester throughput gains compress CP test time faster than we model, pin consumption and card replacement frequency per platform would grow more slowly. We regard the risk as lower at the leading edge than in mature nodes - adaptive test reduction is most applicable where processes are stable and yields high, which is not the case for new AI accelerator ramps - but it remains a structural check on the TAM.
Downside risk: CPO insertion-2 cancellation
Our base case includes Insertion 2 revenue of approximately NT$1.1bn/1.4bn in 2027/28E (3%/3% of 2027/28E rev). Insertion 2 has been a key cause of share price fluctuations given recurring industry discussion of the process being reduced or removed to control total test time, and investors remain divided on the outcome. The corollary is symmetric: if the process remains in place, there is potential upside to both earnings and the multiple. The industry level constraint is that Insertion 2 wafer level volumes remains limited by the absence of automated equipment for PIC EIC optical side fiber array alignment, which is still performed largely manually - until that clears, volume and revenue contribution will stay modest regardless of share.
Downside risk: PCB importance rising in probe cards, and MPI's in-house ratio is still low
PCB is becoming the bottleneck and the value add in probe cards, and MPI is starting from a low in house base; planned ramp from ~5% to 50% by 2H27E is ambitious and, in our view, carries some execution risk. We regard the rising importance of the probe card PCB as one of the more underappreciated risks to MPI's competitive position. The physics are demanding: the distance that power current and electrical signal travel through the PCB is far greater than through the pin, and while an individual pin carries current from a single IO or bump, the PCB aggregates all of them. Power delivery and thermal management problems are therefore multiplied at the PCB rather than at the pin, and as pin counts and power envelopes rise, the PCB increasingly determines whether a probe card qualifies at all. Several of MPI's competitors recognized this early and secured captive supply - Technoprobe through DIS in Taiwan, which it acquired in 2023; FormFactor through Microprobes in US, which it acquired in 2012.
PCB expansion bottleneck: 1) technology and experience, 2) eq ipment lead time
MPI is responding. Management aims to raise its in house PCB ratio from approximately 5% currently to around 50% by 2H27, which would materially reduce dependence on external supply at a time when testing PCB availability is tightening. We are cautious on the timeline for two reasons. First, probe card PCBs are genuinely difficult to mass produce at scale; yields on high layer count, fine line designs are hard won, each design is customized to a specific chip design, and the learning curve is measured in years rather than quarters - which is precisely why incumbents buy capability rather than build it. Second, equipment lead times for the relevant process tools currently exceed twelve months, which compresses the window for installation, qualification and yield ramp ahead of a 2H27E target.
J PMORGAN
J PMORGAN
A shortfall against this plan would leave MPI exposed to external PCB tightness in the period when probe card demand is scaling fastest, and could constrain its ability to convert pin capacity into shipped cards. We would note the read across: the same dynamic that creates risk for MPI creates opportunity for CHPT, which we discuss below.
Downside risk #4: competition
Ind stry expanding aggressively with no stable market share
We believe the debate is no longer whether advanced AI programs will adopt more MEMS probe cards, but which suppliers will ultimately secure production allocation. Probe card selection is highly technology driven: multiple vendors may participate in parallel during design in and qualification, but volume production typically narrows to a single or dual source structure. This creates a winner takes most outcome, where relatively small differences in technical performance, qualification timing or production readiness can lead to materially different revenue allocation. Procurement ownership and procurement authority also vary across TSMC turnkey, customer managed and outsourced CP models, making supplier outcomes project specific rather than uniform.
Capacity availability does not by itself secure revenue. MPI's utilization will depend on the outcome of several large AI programs rather than broader industry demand alone. A favorable qualification outcome could allow the company to convert capacity into share gains, but weaker allocation or delayed ramp could leave utilization below plan despite a structurally strong end market. MPI's capacity nearly triples between 2025 and 2027E, meaning depreciation, staffing and ramp up costs were incurred ahead of the full revenue contribution. On the flip side, we do not see signals of this today: lead times remain long, and some players in the industry require customers to pre pay to secure capacity - a reliable indicator of genuine tightness.
Peer investment also limits the extent to which MPI's expansion creates a lasting scarcity advantage. Technoprobe, FormFactor and Micronics Japan are all adding capacity, while our model does not fully capture potential additions from emerging Chinese suppliers.
Litigation is an established feat re of this market
Probe card IP is actively enforced rather than merely held. Technoprobe sued FormFactor in the District of Delaware in August 2023. The case was dismissed with prejudice in June 2025, with a second Delaware action filed May 2024 and terminated the same month. For MPI specifically, we would highlight that it is already a participant in this dynamic: in April 2026 MPI sued Technoprobe in the Eastern District of Texas alleging infringement of patents covering probe card technology.
Upside risk #1: CPO ins-2 mass shipment could lead to rerating
Peer capacity ramp slippage or q alification delay
Given extended industry lead times and the winner takes most structure of probe card allocation, a peer delivery delay - whether from capacity ramp execution, qualification slippage or PCB supply constraint - could redirect allocation to MPI faster than we model. Localization becoming a stronger advantage than we anticipate is a related upside.
Upside risk #2: m/s gain if peer delivery delays
In a d al-so rce str ct re, the s pplier that delivers capacity gains share
Probe card capacity remains tight across the industry. Pins, PCBs and equipment assembly are all constrained at once, and adding capacity is limited by hiring as much as by equipment. Customers typically qualify two vendors, and the split can move from 50/50 to 70/30 or 80/20 depending on how each vendor performs. Because a single card takes at least 12 weeks to fabricate and 60 70% of orders are placed before volume production, a peer that falls behind on capacity ramp, pin yield or PCB supply can lose allocation quickly. There is precedent: MPI regained major supplier status at a key GPU account after a competitor's solution proved unstable, and shortened product cycles left the customer no time to tune it.
We think MPI is positioned to capture this kind of reallocation. Management cites product stability - in one customer comparison, two months of continuous running against two weeks for a peer - along with faster local repair and response than Western competitors. MPI is also adding capacity, with MEMS pin capacity expanding by 810mn/month in 2027E from 2.5mn/month in 2Q26. We do not include peer slippage in our base case, since Technoprobe has raised its equipment investment outlook through 2028. But if a peer delays, the share gain would flow to MPI faster than our allocation assumptions imply.
Company Background
Leading probe card supplier in Taiwan; dominant in AI ASIC
MPI Corporation is a Taiwan based semiconductor test and measurement company, founded in 1995 and headquartered in Hsinchu, where its probe card and equipment manufacturing is concentrated. The company was set up as a semiconductor equipment business, and probe cards came later through a technology transfer from Micronics Japan (6871 JP, NC), which wanted a logic partner so it could stay focused on memory. We estimate MPI ranks as No.3 in global non memory probe card. Its VPC and MEMS technologies were both developed in house.
MPI focuses on logic probe cards and does not compete in memory. Its main customers are AI ASIC, networking, gaming GPU and consumer SoC designers. It has supplied many of the largest AI ASIC programs since 2024, including Broadcom's TPU and AWS's Trainium, and works both through networking design houses and directly with hyperscalers. Structural trends are pushing demand up: more pins per card, migration from VPC to MEMS, and higher power. Each of these raises the engineering content of a probe card and makes a stable, high volume pin supply more valuable.
Also an equipment company
MPI's revenue comes from four businesses:
- Probe cards (~70% of revenue): cantilever (CPC), vertical (VPC) and MEMS. Substrates are already 100% in house. The company aims to raise its in house PCB ratio from about 5% to around 50% once a new PCB factory starts production in 2H27E, which would make all three key components in house.
- Advanced Semicond ctor Test (AST): R&D probers, where MPI and FormFactor (FORM US, NC) split the market roughly 50/50.
- Thermal test: systems that can move test temperatures between -100°C and +300°C within seconds.
- Photonics a tomation: built on its LED equipment heritage. This is the foundation of its optical electrical CPO test development.
Table 17: MPI income statement
NT$m
| NT$mn, year-end December | 1Q | 2Q | 3Q | 4Q | FY25 - 1Q | FY25 - 2Q | FY25 - 3QE | FY25 - 4QE | FY26E - 1QE | FY26E - 2QE FY27E | FY26E - 3QE | FY26E - 4QE | 1QE | 2QE FY28E | 3QE | 4QE | FY25 | FY26E | FY27E | FY28E | FY28E |
|---|---|---|---|---|---|---|---|---|---|---|---|---|---|---|---|---|---|---|---|---|---|
| Sales | 2,829 | 3,293 | 3,414 | 3,836 | 3,933 | 5,233 | 5,901 | 6,200 | 7,380 | 8,960 | 10,280 | 10,720 | 12,010 | 13,430 | 14,430 | 15,030 | 13,371 | 21,267 | 37,340 | 54,900 | 54,900 |
| Gross profit | 1,623 | 1,919 | 1,822 | 2,063 | 2,338 | 3,055 | 3,503 | 3,687 | 4,425 | 5,403 | 6,243 | 6,519 | 7,320 | 8,252 | 8,882 | 9,249 | 7,428 | 12,583 | 22,590 | 33,704 | 33,704 |
| Operating (EBIT) | 840 | 1,079 | 896 | 959 | 1,273 | 1,802 | 2,170 | 2,304 | 2,838 | 3,557 | 4,187 | 4,418 | 5,026 | 5,768 | 6,271 | 6,574 | 3,775 | 7,549 | 15,001 | 23,638 | 23,638 |
| Pre-tax profit | 888 | 756 | 1,053 | 1,147 | 1,525 | 1,906 | 2,212 | 2,328 | 2,868 | 3,591 | 4,242 | 4,449 | 5,072 | 5,816 | 6,351 | 6,616 | 3,844 | 7,972 | 15,150 | 23,856 | 23,856 |
| Net profit | 724 | 628 | 877 | 948 | 1,227 | 1,524 | 1,770 | 1,862 | 2,295 | 2,873 | 3,394 | 3,559 | 4,057 | 4,653 | 5,081 | 5,293 | 3,177 | 6,384 | 12,120 | 19,085 | 19,085 |
| EPS (NT$) | 7.68 | 6.67 | 9.23 | 9.67 | 12.53 | 15.55 | 18.06 | 19.01 | 23.42 | 29.32 | 34.64 | 36.32 | 41.41 | 47.49 | 51.86 | 54.02 | 33.32 | 65.15 | 123.70 | 194.78 | 194.78 |
| Revenue Breakdown | |||||||||||||||||||||
| Probe card | 68% | 75% | 67% | 62% | 63% | 72% | 72% | 77% | 72% | 73% | 77% | 77% | 79% 80% | 81% | 81% | 68% | 72% | 75% | 80% | 80% | |
| CPC | 15% | 14% | 15% | 11% | 8% | 11% | 9% | 10% | 6% | 5% | 5% | 5% | 4% | 4% | 3% | 3% | 14% | 9% | 5% | 4% | 4% |
| VPC | 53% | 61% | 52% | 51% | 55% | 61% | 64% | 68% | 66% | 68% | 72% | 73% | 75% | 76% | 78% | 77% | 54% | 63% | 70% | 77% | 77% |
| Equipment | 21% | 16% | 19% | 21% | 19% | 12% | 14% | 10% | 15% | 17% | 14% | 14% | 13% | 13% | 12% | 13% | 19% | 13% | 15% | 13% | 13% |
| Photonics Automation | 4% | 4% | 4% | 5% | 0% | 0% | 0% | 0% | 0% | 0% | 0% | 0% | 0% | 0% | 0% | 0% | 5% | 0% | 0% | 0% | 0% |
| Advanced Semi Test | 12% | 8% | 10% | 12% | 15% | 9% | 12% | 7% | 13% | 15% | 13% | 13% | 11% | 12% | 11% | 11% | 10% | 10% | 13% | 11% | 11% |
| Thermal Solution | 5% | 4% | 5% | 4% | 3% | 3% | 3% | 3% | 2% | 2% | 2% | 2% | 2% | 1% | 1% | 1% | 4% | 3% | 2% | 1% | 1% |
| Others | 11% | 8% | 14% | 17% | 19% | 16% | 14% | 13% | 12% | 10% | 9% | 8% | 8% | 7% | 7% | 7% | 13% | 15% | 10% | 7% | 7% |
| Margins (%) | |||||||||||||||||||||
| Gross | 57.4 | 58.3 | 53.4 | 53.8 | 59.4 | 58.4 | 59.4 | 59.5 | 60.0 | 60.3 | 60.7 | 60.8 | 60.9 | 61.4 | 61.6 | 61.5 | 55.6 | 59.2 | 60.5 | 61.4 | 61.4 |
| Operating | 29.7 | 32.8 | 26.2 | 25.0 | 32.4 | 34.4 | 36.8 | 37.2 | 38.5 | 39.7 | 40.7 | 41.2 | 41.8 | 42.9 | 43.5 | 43.7 | 28.2 | 35.5 | 40.2 | 43.1 | 43.1 |
| EBITDA | 35.5 | 38.4 | 32.4 | 31.2 | 38.8 | 39.9 | 40.9 | 41.1 | 42.0 | 42.6 | 43.3 | 43.6 | 44.3 | 45.1 | 45.5 | 45.7 | 34.1 | 40.3 | 43.0 | 45.2 | 45.2 |
| Net | 25.6 | 19.1 | 25.7 | 24.7 | 31.2 | 29.1 | 30.0 | 30.0 | 31.1 | 32.1 | 33.0 | 33.2 | 33.8 | 34.6 | 35.2 | 35.2 | 23.8 | 30.0 | 32.5 | 34.8 | 34.8 |
| Growth (%, Q/Q) | |||||||||||||||||||||
| Sales | -5.8 | 16.4 | 3.7 | 12.4 | 2.5 | 33.1 | 12.8 | 5.1 | 19.0 | 21.4 | 14.7 | 4.3 | 12.0 | 11.8 | 7.4 | 4.2 | |||||
| Gross profit | -3.8 | 18.2 | -5.0 | 13.2 | 13.3 | 30.7 | 14.7 | 5.2 | 20.0 | 22.1 | 15.6 | 4.4 | 12.3 | 12.7 | 7.6 | 4.1 | |||||
| EBIT | 11.6 | 28.4 | -17.0 | 7.1 | 32.7 | 41.5 | 20.4 | 6.2 | 23.2 | 25.3 | 17.7 | 5.5 | 13.8 | 14.8 | 8.7 | 4.8 | |||||
| Net profit | 1.2 | -13.2 | 39.5 | 8.1 | 29.5 | 24.1 | 16.1 | 5.2 | 23.2 | 25.2 | 18.1 | 4.9 | 14.0 | 14.7 | 9.2 | 4.2 | |||||
| EPS | 1.2 | -13.2 | 38.5 | 4.7 | 29.5 | 24.1 | 16.1 | 5.2 | 23.2 | 25.2 | 18.1 | 4.9 | 14.0 | 14.7 | 9.2 | 4.2 | |||||
| Growth (%, Y/Y) | |||||||||||||||||||||
| Sales | 38.2 | 37.6 | 25.1 | 27.7 | 39.0 | 58.9 | 72.9 | 61.6 | 87.6 | 71.2 | 74.2 | 72.9 | 62.7 | 49.9 | 40.4 | 40.2 | 31.5 | 59.1 | 75.6 | 47.0 | 47.0 |
| Gross profit | 58.2 | 47.6 | 17.8 | 22.2 | 44.0 | 59.2 | 92.2 | 78.7 | 89.2 | 76.9 | 78.2 | 76.8 | 65.4 | 52.7 | 42.3 | 41.9 | 33.6 | 79.5 | 69.4 49.2 | 69.4 49.2 | 69.4 49.2 |
| EBIT | 117.3 | 80.6 | 20.2 | 27.4 | 51.5 | 67.0 | 142.2 | 140.2 | 122.9 | 97.4 | 62.2 | 49.8 | 48.8 52.0 | 100.0 | 98.7 | 57.6 | |||||
| Net profit | 83.8 | 15.8 | 34.9 | 32.5 | 69.6 | 142.5 | 96.5 | 86.9 | 88.5 | 93.0 | 91.7 91.1 | 77.1 | 49.7 | 48.7 38.0 | 101.0 | 89.9 | 57.5 | 57.5 | 57.5 | ||
| 83.8 | 15.8 | 101.9 | 86.9 | 91.7 | 76.8 | 62.0 | 48.7 | 95.5 | 57.5 | ||||||||||||
| EPS | 33.9 | 27.5 | 63.1 | 133.2 | 95.6 | 96.5 | 88.5 | 91.7 | 91.1 | 76.8 | 62.0 | 49.7 | 36.4 | 89.9 |
Source: J.P. Morgan estimates, Company data.
PI income statement
Investment Thesis, Valuation and Risks
MPI(Neutral; Price Target: NT$5,350.00)
Investment Thesis
We are Neutral on MPI. Despite expected strong probe card TAM growth in the coming years and MPI's strong capacity expansion, competition across MEMS probe cards remains a big concern as the market is already dominated by other established players such as Technoprobe and FormFactor (both also expanding aggressively). We are genuinely positive on the structural growth of advanced probe card demand and we forecast an FY2026-28E EPS CAGR of 73%. Our caution is about valuation multiple and and the competitive landscape, not about the momentum of growth of the probe card industry.
Val ation
Our Dec 27 TP is based on 28x 2028e EPS. 28x is on par with its P/E average since 2023 (excl extremes). We believe this multiple is justified given the probe card industry is witnessing a structural upcycle driven by stong AI demand.
Risks to Rating and Price Target
Upside risks: 1) rev contribution and re rating from earlier than expected CPO equipment insertion 2 orders, 2) m/s gain in key HPC projects .
Downside risks: 1) Chip probing time reduction, 2) slower than expected probe card pin count growth, 3) market share loss in key AI chip projects, and 4) deceleration of CSP's AI capex.
MPI: Summary of Financials
| Income Statement | FY24A | FY25A | FY26E | FY27E | FY28E |
|---|---|---|---|---|---|
| Revenue | 10,172 | 13,371 | 21,267 | 37,340 | 54,900 |
| COGS | (4,054) | (5,152) | (7,659) | (13,710) | (20,036) |
| Gross profit | - | - | - | - | - |
| SG&A | (1,989) | (2,377) | (3,514) | (5,380) | (7,497) |
| Adj EBITDA | 3,039 | 4,566 | 8,574 | 16,041 | 24,798 |
| D&A | (556) | (792) | (1,025) | (1,040) | (1,160) |
| Adj EBIT | 2,483 | 3,775 | 7,549 | 15,001 | 23,638 |
| Net Interest | 9 | 4 | 31 | 90 | 158 |
| Adj PBT | 2,795 | 3,844 | 7,972 | 15,150 | 23,856 |
| Tax | (490) | (666) | (1,583) | (3,030) | (4,771) |
| Minority Interest | 1 | 1 | 0 | 0 | 0 |
| Adj Net Income | 2,301 | 3,177 | 6,384 | 12,120 | 19,085 |
| Reported EPS | 24.42 | 33.32 | 65.15 | 123.70 | 194.78 |
| Adj EPS | 24 42 | 33 32 | 65 15 | 123 70 | 194 78 |
| DPS | 7 50 | 15 88 | 22 00 | 44 21 | 83 94 |
| Payout ratio | 30.7% | 47.7% | 33.8% | 35.7% | 43.1% |
| Shares outstanding | 94 | 95 | 98 | 98 | 98 |
| Balance Sheet | FY24A | FY25A | FY26E | FY27E | FY28E |
| Cash and cash equivalents | 3,695 | 5,437 | 6,177 | 11,748 | 19,238 |
| Accounts receivable | 2,091 | 2,480 | 3,968 | 6,770 | 9,460 |
| Inventories | 3,477 | 5,011 | 7,103 | 11,872 | 16,339 |
| Other current assets | 241 | 389 | 629 | 1,087 | 1,524 |
| Current assets | 9,505 | 13,318 | 17,876 | 31,476 | 46,560 |
| PP&E | 4,561 | 7,729 | 12,841 | 14,802 | 16,644 |
| T investments | 0 | 0 | 0 | 0 | 0 |
| Other non current assets | 2,412 | 2,956 | 3,838 | 3,838 | 3,838 |
| Total assets | 16,479 | 24,003 | 34,555 | 50,116 | 67,042 |
| Short term borrowings | 858 | 1,366 | 210 | 240 | 240 |
| Payables | 766 | 1,342 | 1,901 | 3,178 | 4,374 |
| Other short term liabilities | 4,050 | 4,862 | 7,858 | 13,586 | 19,049 |
| Current liabilities | 5,673 | 7,569 | 9,969 | 17,005 | 23,663 |
| ong-term debt | 1,305 | 1,337 | 7,000 | 8,000 | 8,000 |
| Other long term liabilities | 193 | 518 | 632 | 771 | 940 |
| Total liabilities | 7,172 | 9,424 | 17,601 | 25,775 | 32,603 |
| Shareholders' equity | 9,307 | 14,579 | 16,954 | 24,341 | 34,439 |
| Minority interests | - | - | - | - | - |
| Total liabilities & equity | 16,479 | 24,003 | 34,555 | 50,116 | 67,042 |
| BVPS | 98 77 | 152 91 | 173 03 | 248 43 | 351 48 |
| y/y Growth | 22.1% | 54.8% | 13.2% | 43.6% | 41.5% |
| Net debt/(cash) | (1,532) | (2,734) | 1,033 | (3,508) | (10,998) |
| Cash Flow Statement | FY24A | FY25A | FY26E | FY27E | FY28E |
|---|---|---|---|---|---|
| Cash flow from operating activities | 1,377 | 1,530 | (1,874) | 4,205 | 11,283 |
| o/w Depreciation & amortization | 556 | 792 | 1,025 | 1,040 | 1,160 |
| o/w Changes in working capital | (1,283) | (1,494) | (3,260) | (6,752) | (6,398) |
| Cash flow from investing activities | (1,848) | (3,655) | (3,631) | (1,200) | (1,200) |
| o/w Capital expenditure | (1,229) | (3,881) | (3,355) | (1,600) | (1,600) |
| as % of sales | 12.1% | 29.0% | 15.8% | 4.3% | 2.9% |
| Cash flow from financing activities | 1,573 | 3,855 | 6,230 | 2,566 | (2,593) |
| o/w Dividends paid | (707) | (1,508) | (2,156) | (4,332) | (8,225) |
| o/w Shares issued/(repurchased) | 132 | 3,690 | 769 | 0 | 0 |
| o/w Net debt issued/(repaid) | 2,160 | 1,353 | 7,503 | 6,759 | 5,462 |
| Net change in cash | 1,089 | 1,718 | 710 | 5,571 | 7,490 |
| Adj Free cash flow to firm | 148 | (2,351) | (5,228) | 2,605 | 9,683 |
| y/y Growth | (149.0%)(1686.7%) | (149.0%)(1686.7%) | 122.4%(149.8%) | 122.4%(149.8%) | 271.7% |
| Ratio Analysis | FY24A | FY25A | FY26E | FY27E | FY28E |
| Gross margin | - | - | - | - | - |
| EBITDA margin | 29.9% | 34.1% | 40.3% | 43.0% | 45.2% |
| EBIT margin | 24.4% | 28.2% | 35.5% | 40.2% | 43.1% |
| Net profit margin | 22.6% | 23.8% | 30.0% | 32.5% | 34.8% |
| ROE | 27.2% | 26.6% | 40.5% | 58.7% | 64.9% |
| ROA | 15.9% | 15.7% | 21.8% | 28.6% | 32.6% |
| ROCE | 19.7% | 21.7% | 29.2% | 42.3% | 50.3% |
| SG&A/Sales | 19.6% | 17.8% | 16.5% | 14.4% | 13.7% |
| Net debt/Equity | NM | NM | 0.1 | NM | NM |
| Net debt/EBITDA | NM | NM | 0.1 | NM | NM |
| Sales/Assets (x) | 0.7 | 0.7 | 0.7 | 0.9 | 0.9 |
| Assets/Equity (x) | 1.7 | 1.7 | 1.9 | 2.1 | 2.0 |
| Interest cover (x) | NM | NM | NM | NM | NM |
| Operating leverage | 276.6% | 165.4% | 169.3% | 130.6% | 122.4% |
| Tax rate | 17.5% | 17.3% | 19.9% | 20.0% | 20.0% |
| Revenue y/y Growth | 24.9% | 31.5% | 59.1% | 75.6% | 47.0% |
| EBITDA y/y Growth | 51.4% | 50.3% | 87.8% | 87.1% | 54.6% |
| EPS y/y Growth | 75.4% | 36.4% | 95.5% | 89.9% | 57.5% |
| Valuation | FY24A | FY25A | FY26E | FY27E | FY28E |
| P/E (x) | 200.2 | 146.8 | 75.1 | 39.5 | 25.1 |
| P/BV (x) | 49.5 | 32.0 | 28.3 | 19.7 | 13.9 |
| EV/EBITDA (x) | 157.0 | 104.2 | 55.9 | 29.6 | 18.8 |
| Dividend Yield | 0.2% | 0.3% | 0.4% | 0.9% | 1.7% |
Source: Company data and J.P. Morgan estimates
Note: NT$ in millions (except per-share data).Fiscal year ends Dec. o/w - out of which
Overweight
6510.TWO, 6510 TT
Price (22 Oct 26):NT$3,065.00 Price Target (Dec-27):NT$4,900.00
Technology
erry Tsai AC (886-2) 2725-9867 jerry.tsai@jpmorgan.com J.P. organ Securities (Taiwan) Limited
| Quarterly Forecasts (FYE Dec) | Quarterly Forecasts (FYE Dec) | Quarterly Forecasts (FYE Dec) | Quarterly Forecasts (FYE Dec) |
| Adj EPS (NT$) | 2025A | 2026E | 2027E |
| Q1 | 6.75 | 10.43A | 24.77 |
| Q2 | 6.58 | 15.06A | 27.83 |
| Q3 | 8.41 | 16.80 | 30.96 |
| Q4 | 8.69 | 23.45 | 32.46 |
| FY | 30.41 | 65.74 | 116.02 |
Style Exposure
| uant - Factors | Current - %Rank | Hist %Rank (1=Top) - 6M | Hist %Rank (1=Top) - 1Y | Hist %Rank (1=Top) - 3Y | Hist %Rank (1=Top) - 5Y |
|---|---|---|---|---|---|
| Value | 51 | 56 | 57 | 48 | 38 |
| Growth | 3 | 1 | 3 | 91 | 30 |
| Momentum | 82 | 10 | 3 | 95 | 71 |
| Quality | 51 | 71 | 83 | 90 | 24 |
| Low Vol | 88 | 96 | 84 | 69 | 69 |
Chunghwa Precision Test Tech
PCB becoming the next technology bottleneck; OW
We re iterate our Overweight rating on CHPT, which we view as the most direct beneficiary of rising test intensity within the PCB layer of the test interface stack. As probe cards scale toward higher pin counts and multi kilowatt power envelopes, the PCB - not the pin - is increasingly where the engineering difficulty and the bottleneck sit (recall in an earlier section that ASP per pin increase is only 0 5% annually), and CHPT is the only player spe cializing in probe card PCBs.
- PCB content in probe cards is rising, and the technology barrier is rising with it. The physics favor the PCB as the hard problem. Current and signal travel far further through the PCB than through the pin, and while a pin carries load from a single IO or bump, the PCB aggregates every one of them - so power delivery and thermal stress are multiplied precisely where the design is most constrained. As pin counts move from thousands to tens of thousands, high layer count, fine line probe PCBs increasingly determine whether a card qualifies at all. The evidence that the market is catching up to this is in CHPT's order book: the company is being approached by a widening set of chip makers directly, and is now winning probe card total solution orders rather than compo nent orders alone. Supply is tightening on two fronts simultaneously - a rising number of chip designs, each requiring its own customized probe PCB design, and the value add from advanced packaging proliferation. That the established probe card players secured captive PCB capability early is the clearest validation of the thesis: FormFactor acquired Microprobe in US in 2012 and Technoprobe acquired DIS in Taiwan in 2023.
- CHPT at 30x 2028E P/E; re-rating is possible - PCB deserves the premi m over probe card pins. We re iterate our target 30x multiple on 2028E EPS (36x 2027/28E average EPS), the highest in our test interface coverage. Meanwhile, we don't rule out the possibility for CHPT to be re rated. We believe the company has the best chance of upward earnings revisions driven by more PCB (CHPT is the top player in probe card PCB) and probe card total solution order wins over the coming years, due to rising com plexity of probe card PCB and technology barriers. In addition, PCBs - where the com pany leads globally - are required for both probe cards and load boards (FT, SLT, burn in), the latter being where sockets are installed. CHPT therefore participates in the growth of both halves of the test interface market rather than taking a side, and benefits whether test intensity shifts left into CP or right into FT and SLT. We expect the impor tance of probe card PCB to be increasingly recognized, and see that recognition as the mechanism by which the multiple is sustained.
- B y on p ll-back. In the past 1 month, CHPT's share has fallen 17% vs TWSE 5% due to profit taking actions on the overall test interface segment (WinWay 17% while MPI 9%). The stock is now trading at 26x/19x 2027/28E JPMe EPS, which we think is unde manding given that the company is becoming the key technology value add in the probe card design and therefore enjoys bargaining power to ask for probe card pin business (while PCB's importance should surpass pin in probe card, we note that pin's content value is 4 5x vs PCB in one single probe card). We see upside risk to our 2027E and 2028E estimates on more total solution probe card (PCB+pin) project wins. We encour age investors to accumulate the stock on the recent pull back.
— 6510.TWO Price (NT$)
— TSE (rebased)
| YTD | 1m | 3m | 12m | |
|---|---|---|---|---|
| Abs | 34.1% | -17.2% | 13.1% | 77.7% |
| Rel | -24.9% | -13.5% | 10.4% | 11.2% |
Company Data
| Shares O/S (mn) | 33 |
|---|---|
| 52-week range (NT$) | 4,475.00-1,455.00 |
| Market cap ($ mn) | 3,083 |
| Exchange rate | 32.60 |
| Free float (%) | 51.6% |
| 3M ADV (mn) | 0.80 |
| 3M ADV ($ mn) | 77.8 |
| Volatility (90 Day) | 73 |
| Index | TAIEX |
| BBG ANR (Buy | Hold | Sell) | 13|0|0 |
Key Metrics (FYE Dec)
| NT$ in millions | FY25A | FY26E | FY27E | FY28E |
|---|---|---|---|---|
| Financial Estimates | ||||
| Revenue | 4,806 | 7,379 | 12,095 | 16,555 |
| Adj. EBIT | 1,190 | 2,506 | 4,491 | 6,384 |
| Adj. EBITDA | 1,606 | 2,969 | 5,051 | 6,944 |
| Adj. net income | 997 | 2,156 | 3,804 | 5,400 |
| Adj. EPS | 30.41 | 65.74 | 116.02 | 164.69 |
| BBG EPS | 29.08 | 63.92 | 115.00 | 165.49 |
| Cashflow from operations | 1,429 | 729 | 3,097 | 3,912 |
| FCFF | 1,275 | 229 | 2,697 | 3,512 |
| Margins and Growth | ||||
| Revenue Growth Y/Y (%) | 33.3% | 53.5% | 63.9% | 36.9% |
| EBIT margin | 24.8% | 34.0% | 37.1% | 38.6% |
| EBIT Growth Y/Y (%) | 143.5% | 110.5% | 79.2% | 42.2% |
| EBITDA margin | 33.4% | 40.2% | 41.8% | 41.9% |
| EBITDA Growth Y/Y (%) | 70.6% | 84.9% | 70.1% | 37.5% |
| Net margin | 20.7% | 29.2% | 31.5% | 32.6% |
| Adj. EPS growth | 95.6% | 116.2% | 76.5% | 42.0% |
| Ratios | ||||
| Adj. tax rate | 19.5% | 18.0% | 18.0% | 18.0% |
| Interest cover | NM | NM | NM | NM |
| Net debt/Equity | NM | NM | NM | NM |
| Net debt/EBITDA | NM | NM | NM | NM |
| ROE | 12.1% | 22.0% | 30.0% | 31.7% |
| Valuation | ||||
| FCFF yield | 1.3% | 0.2% | 2.7% | 3.5% |
| Dividend yield | 0.0% | 0.0% | 0.1% | 0.1% |
| EV/Revenue | 24.0 | 15.5 | 9.2 | 6.4 |
| EV/EBITDA | 71.8 | 38.4 | 21.9 | 15.3 |
| Adj. P/E | 100.8 | 46.6 | 26.4 | 18.6 |
Summary Investment Thesis and Valuation
Investment Thesis
CHPT's share price has been volatile YTD on lingering concerns about TPU v9 probe cards. As the project settles, we believe the spotlight will shift back to the strong earnings growth driven by Nvidia's GPU project. With strong technology expertise in producing high pin count and high layer test interface PCBs, we believe the increasing test interface complexity will help increase CHPT's presence in AI accelerator testing boards, which includes not only the flagship probe card and FT PCBs, but also SLT and burn in testing boards. The current valuation (discounted to other Taiwanese probe card peers) marks a good entry point for the stock, in our view.
Val ation
Our Dec 27 PT of NT$4,900 is based on a P/E multiple of 30x 2028E earnings (36x 2027/28E average earnings), the average of mid cycle multiple since 2019 (excluding extremes). 30x is the highest multiple in our test interface coverage (we assign 26/28x to WinWay/MPI), as we see the strongest earnings upgrade potential on CHPT's strength in probe PCBs, which is becoming a key binding constraint on probe PCB supply.
Performance Drivers
| Factors | 6M Corr | 1Y Corr |
|---|---|---|
| Market: MSCI Asia Pac ex JP | 0.38 | 0.28 |
| Region: Taiwan | 0.02 | 0.08 |
| Macro: | ||
| Generic 1st 'CO' Future | -0.38 | -0.38 |
| JP Morgan EMBI Global Spread | -0.31 | -0.21 |
| JP Morgan GBI-EM Global Div | 0.01 | 0.17 |
| Quant Styles: | ||
| Quality | 0.29 | 0.10 |
| Growth | -0.06 | 0.09 |
| DivYld | 0.12 | -0.06 |
64%
Figure 70: Probe card structure
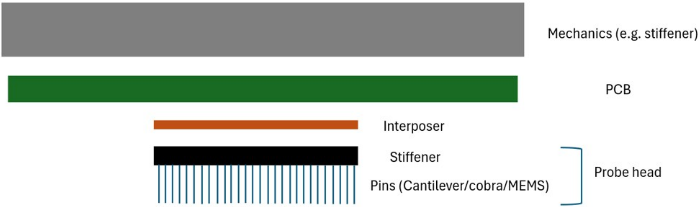
Source: J.P. Morgan
Table 18: Technoprobe & FormFactor's recent PCB company acquisitions
| Company | Description |
|---|---|
| Technoprobe (TPRO IM) | |
| DIS Tech (TW) | Zehntel has been part of Teradyne's Device Interface Solutions business since its acquisition by Teradyne in 1987. It was acquired by Technoprobe in 2023 and subsequently rebranded to DIS Tech. |
| Harbor Electronics (US) | Technoprobe acquired Harbor Electronics in 2023. |
| FormFactor (FORM US) | |
| Microprobe (US) | FormFactor acquired Microprobe in 2012. |
Source: Company data, J.P. Morgan.
Figure 71: CHPT potential total-solution probe card rev
Source: J.P. Morgan estimates.
Investment Thesis, Valuation and Risks
Chunghwa Precision Test Tech(Overweight; Price Target: NT$4,900.00)
Investment Thesis
CHPT's share price has been volatile YTD on lingering concerns about TPU v9 probe cards. As the project settles, we believe the spotlight will shift back to the strong earnings growth driven by Nvidia's GPU project. With strong technology expertise in producing high pin count and high layer test interface PCBs, we believe the increasing test interface complexity will help increase CHPT's presence in AI accelerator testing boards, which includes not only the flagship probe card and FT PCBs, but also SLT and burn in testing boards. The current valuation (discounted to other Taiwanese probe card peers) marks a good entry point for the stock, in our view.
Val ation
Our Dec 27 PT of NT$4,900 is based on a P/E multiple of 30x 2028E earnings (36x 2027/28E average earnings), the average of mid cycle multiple since 2019 (excluding extremes). 30x is the highest multiple in our test interface coverage (we assign 26/28x to WinWay/MPI), as we see the strongest earnings upgrade potential on CHPT's strength in probe PCBs, which is becoming a key binding constraint on probe PCB supply.
Risks to Rating and Price Target
Downside risks include: 1) slower than expected capacity expansion; and 2) market share losses in key HPC projects.
Upside catalysts include: 1) better than expected share allocations for major SoC clients; and (2) a faster than expected pace of new application adoption.
Chunghwa Precision Test Tech: Summary of Financials
| Income Statement - Annual | FY24A | FY25A | FY26E | FY27E | FY28E | Income Statement - Quarterly | Income Statement - Quarterly | 1Q26A | 2Q26A | 3Q26E | 4Q26E |
|---|---|---|---|---|---|---|---|---|---|---|---|
| Revenue | 3,605 | 4,806 | 7,379 | 12,095 | 16,555 | Revenue | 1,357 | 1,640 | 1,885 | 2,498 | |
| COGS | (1,225) | (1,722) | (2,802) | (4,980) | (7,047) | COGS | (487) | (576) | (720) | (1,020) | |
| Gross profit | 1,927 | 2,668 | 4,114 | 6,555 | 8,948 | Gross profit | 771 | 943 | 1,044 | 1,357 | |
| SG&A | (565) | (610) | (700) | (860) | (1,073) | SG&A | (163) | (163) | (177) | (197) | |
| Adj EBITDA | 941 | 1,606 | 2,969 | 5,051 | 6,944 | Adj EBITDA | 497 | 691 | 757 | 1,023 | |
| D&A | (453) | (416) | (463) | (560) | (560) | D&A | (100) | (121) | (121) | (121) | |
| Adj EBIT | 489 | 1,190 | 2,506 | 4,491 | 6,384 | Adj EBIT | 397 | 570 | 636 | 902 | |
| Net Interest | 27 | 44 | 60 | 82 | 135 | Net Interest | 7 | 15 | 19 | 19 | |
| Adj PBT | 553 | 1,225 | 2,620 | 4,632 | 6,579 | Adj PBT | 418 | 596 | 670 | 936 | |
| Tax | (68) | (238) | (472) | (834) | (1,184) | Tax | (80) | (103) | (121) | (168) | |
| Minority Interest | 25 | 11 | 7 | 6 | 6 | Minority Interest | 3 | 1 | 1 | 1 | |
| Adj Net Income | 510 | 997 | 2,156 | 3,804 | 5,400 | Adj Net Income | 342 | 494 | 551 | 769 | |
| Reported EPS | 15.55 | 30.41 | 65.74 | 116.02 | 164.69 | Reported EPS | 10.43 | 15.06 | 16.80 | 23.45 | |
| Adj EPS | 15 55 | 30 41 | 65 74 | 116 02 | 164 69 | Adj EPS | 10 43 | 15 06 | 16 80 | 23 45 | |
| DPS | 0 50 | 0 50 | 0 98 | 2 11 | 3 73 | DPS | 0 00 | 0 00 | 0 98 | 0 00 | |
| Payout ratio | 3.2% | 1.6% | 1.5% | 1.8% | 2.3% | Payout ratio | 0.0% | 0.0% | 5.8% | 0.0% | |
| Shares outstanding | 33 | 33 | 33 | 33 | 33 | Shares outstanding | 33 | 33 | |||
| FY27E | FY28E | Ratio | 33 | 33 | |||||||
| Balance Sheet & Cash Flow Statement Cash and cash equivalents | FY24A 2,280 | FY25A 3,452 | FY26E 4,747 | 8,011 | 12,356 | Analysis Gross margin | FY24A 53.5% | FY25A | FY26E 55.7% | FY27E 54.2% | FY28E 54.0% |
| Accounts receivable | 883 | 820 | 1,713 | 2,294 | 3,265 | EBITDA margin | 26.1% | 55.5% 33.4% | 40.2% | 41.8% | 41.9% |
| Inventories | 1,012 | 938 | 1,960 | 2,625 | 3,735 | EBIT margin | 13.6% | 24.8% | 34.0% | 37.1% | 38.6% |
| Other current assets | 188 | 174 | 364 | 488 | 694 | Net profit margin | 14.1% | 20.7% | 29.2% | 31.5% | 32.6% |
| Current assets | 4,363 | 5,385 | 8,785 | 13,418 | 20,050 | ||||||
| PP&E | 4,514 | 4,395 | 4,276 | 4,081 | 3,886 | ROE | 6.8% | 12.1% | 22.0% | 30.0% | 31.7% |
| T investments | - | - | - | - | - | ROA | 6.0% | 10.5% | 18.6% | 24.7% | 25.9% |
| Other non current assets | 150 | 150 | 150 | 150 | 150 | ROCE | 5.7% | 11.6% | 21.0% | 29.1% | 30.7% |
| Total assets | 9,026 | 9,930 | 13,210 | 24,086 | SG&A/Sales | 15.7% | 12.7% | 9.5% | 7.1% | 6.5% | |
| 17,649 | Net debt/equity | NM | NM | NM | NM | NM | |||||
| Short term borrowings | 0 | 0 | 0 | 0 | 0 | P/E (x) | 100.8 | 46.6 | 26.4 | 18.6 | |
| Payables Other short term liabilities | 299 853 | 276 791 | 598 1,652 | 806 2,212 | 1,151 3,148 | P/BV (x) | 197.2 12.9 | 11.5 | 9.3 | 6.9 | 5.1 |
| Current liabilities | 1,152 | 1,067 | 2,250 | 3,018 | 4,299 | EV/EBITDA (x) | 123.7 | 71.8 | 38.4 | 21.9 | 15.3 |
| ong-term debt | 0 | 0 | 0 | 0 | 0 | Dividend Yield | 0.0% | 0.0% | 0.0% | 0.1% | 0.1% |
| Other long term liabilities | 39 | 47 | 58 | 70 | 86 | ||||||
| Total liabilities | 1,190 | 1,114 | 2,307 | 3,088 | 4,385 | Sales/Assets (x) | 0.4 | 0.5 | 0.6 | 0.8 | 0.8 |
| Shareholders' equity | 7,767 | 8,747 | 10,834 | 14,491 | 19,632 | Interest cover (x) | NM | NM | NM | NM | NM |
| Minority interests | 69 | 69 | 69 | 69 | 69 | Operating leverage | (4113.9%) | 430.7% | 206.3% | 124.0% | 114.3% |
| 9,026 | 9,930 | 13,210 | 17,649 | 33.3% | 53.5% | ||||||
| Total liabilities & equity | 236 87 | 266 76 | 330 42 | 441 96 | 24,086 598 74 | Revenue y/y Growth EBITDA y/y Growth | 25.0% | 63.9% | 36.9% 37.5% | ||
| BVPS y/y Growth | 6.8% | 12.6% | 23.9% | 33.8% | 35.5% | Tax rate | 132.5% | 70.6% | 84.9% | 70.1% | |
| Net | (2,280) | (3,452) | (4,747) | (8,011) | (12,356) | 12.3% | 19.5% | 18.0% | 18.0% | 18.0% | |
| debt/(cash) | Adj. Net Income y/y Growth | 1463.5% 1463.5% | 95.6% 95.6% | 116.2% 116.2% | 76.5% 76.5% | 42.0% 42.0% | |||||
| Cash flow from operating activities | 96 | 1,429 | 729 | 3,097 | 3,912 | EPS y/y Growth y/y Growth | (95.7%) | 0.0% | 95.6% | 116.2% | 76.5% |
| o/w Depreciation & amortization | 453 | 416 | 463 | 560 | 560 | DPS | |||||
| o/w Changes in working capital | (741) | 127 | (1,782) | (1,162) | (1,942) | ||||||
| Cash flow from investing activities | 254 | 247 | (100) | 0 | 0 | ||||||
| o/w Capital expenditure | (146) | (153) | (500) | (400) | (400) | ||||||
| as % of sales | 4.1% | 3.2% | 6.8% | 3.3% | 2.4% | ||||||
| Cash flow from financing activities | 379 | 380 | 366 | 331 | 281 | ||||||
| o/w Dividends paid | (16) | (16) | (32) | (69) | (122) | ||||||
| o/w Net debt issued/(repaid) | 0 | 0 | 0 | 0 | 0 4,072 | ||||||
| Net change in cash | 607 | 1,933 | 874 | 3,306 | |||||||
| Adj Free cash flow to firm | (50) | 1,275 | 229 | 2,697 | 3,512 | ||||||
| y/y Growth | (158.8%)(2650.2%) | (82.0%)1075.7% | 30.3% |
Source: Company reports and J.P. Morgan estimates.
Note: NT$ in millions (except per-share data).Fiscal year ends Dec. o/w - out of which Analyst Certification: The Research Analyst(s) denoted by an 'AC' on the cover of this report certifies (or, where multiple Research Analysts are primarily responsible for this report, the Research Analyst denoted by an 'AC' on the cover or within the document individually certifies, with respect to each security or issuer that the Research Analyst covers in this research) that: (1) all of the views expressed in this report accurately reflect the Research Analyst's personal views about any and all of the subject securities or issuers; and (2) no part of any of the Research Analyst's compensation was, is, or will be directly or indirectly related to the specific recommendations or views expressed by the Research Analyst(s) in this report. For all Korea based Research Analysts listed on the front cover, if applicable, they also certify, as per KOFIA requirements, that the Research Analyst's analysis was made in good faith and that the views reflect the Research Analyst's own opinion, without undue influence or intervention.
All authors named within this report are Research Analysts who produce independent research unless otherwise specified. In Europe, Sector Specialists (Sales and Trading) may be shown on this report as contacts but are not authors of the report or part of the Research Department.
Important Disclos res
- Market Maker/ Liq idity Provider: J.P. Morgan is a market maker and/or liquidity provider in the financial instruments of/related to WinWay Technology, MPI, Chunghwa Precision Test Tech or related entities.
- Beneficial Ownership (1% or more): J.P. Morgan beneficially owns 1% or more of a class of common equity securities of WinWay Technology or related entities.
- Client: J.P. Morgan currently has, or had within the past 12 months, the following entity(ies) as clients: WinWay Technology, MPI, Chunghwa Precision Test Tech or related entities.
- Client/Non-Investment Banking, Sec rities-Related: J.P. Morgan currently has, or had within the past 12 months, the following entity(ies) as clients, and the services provided were non investment banking, securities related: WinWay Technology, MPI, Chunghwa Precision Test Tech or related entities.
- Non-Investment Banking Compensation Received: J.P. Morgan has received compensation in the past 12 months for products or services other than investment banking from WinWay Technology, MPI, Chunghwa Precision Test Tech or related entities.
- Debt Position: J.P. Morgan may hold a position in the debt securities of WinWay Technology, MPI, Chunghwa Precision Test Tech or related entities, if any.
Company-Specific Disclos res: J.P. Morgan does and seeks to do business with companies covered in its research reports. As a result, investors should be aware that the firm may have a conflict of interest that could affect the objectivity of this report. Investors should consider this report as only a single factor in making their investment decision. Important disclosures, including price charts and credit opinion history tables (if applicable), are available for compendium reports and all J.P. Morgan-covered companies, and certain non covered companies, by visiting https://www.jpmm.com/research/disclosures, calling 1 800 477 0406, or e mailing research.disclosure.inquiries@jpmorgan.com with your request.
WinWay Technology (6515.TW,6515 TT) Price Chart
Source: Bloomberg Finance L.P. and J.P. Morgan; price data adjusted for stock splits and dividends.
MPI (6223.TW, 6223TT) Price Chart
Source: Bloomberg Finance L.P. and J.P. Morgan; price data adjusted for stock splits and dividends. Initiated coverage Aug08, 2014. All share prices are as of market close on the previous business day. Break in coverage Feb 25, 2016 - Oct 26, 2026.
Chunghwa Precision Test Tech (6510.TWO, 6510 TT) Price Chart
Source: Bloomberg Finance L.P. and J.P. Morgan; price data adjusted for stock splits and dividends. Initiated coverage Jun 06, 2018. All share prices are as of market close on the previous business day.
The chart(s) show J.P. Morgan's continuing coverage of the stocks; the current analysts may or may not have covered it over the entire period. J.P. Morgan ratings or designations: OW = Overweight, N= Neutral, UW = Underweight, NR = Not Rated
Explanation of Eq ity Research Ratings, Designations and Analyst(s) Coverage Universe:
J.P. Morgan uses the following rating system: Overweight (over the duration of the price target indicated in this report, we expect this stock will outperform the average total return of the stocks in the Research Analyst's, or the Research Analyst's team's, coverage universe); Neutral (over the duration of the price target indicated in this report, we expect this stock will perform in line with the average total return of the stocks in the Research Analyst's, or the Research Analyst's team's, coverage universe); and Underweight (over the duration of the price target indicated in this report, we expect this stock will underperform the average total return of the stocks in the Research Analyst's, or the Research Analyst's team's, coverage universe. NR is Not Rated. In this case, J.P. Morgan has removed the rating and, if applicable, the price target, for this stock because of either a lack of a sufficient fundamental basis or for legal, regulatory or policy reasons. The previous rating and, if applicable, the price target, no longer should be relied upon. An NR designation is not a recommendation or a rating. Some stocks under coverage have a rating but no price target; in these cases, we expect the stock will outperform/perform in line/underperform the average total return of the stocks in the Research Analyst's, or the Research Analyst's team's, coverage universe of the relevant duration of the region. In our Asia (ex Australia and ex India) and U.K. small and mid cap Equity Research, each stock's expected total return is compared to the expected total return of a benchmark country market index, not to those Research Analysts' coverage universe. If it does not appear in the Important Disclosures section of this report, the certifying Research Analyst's coverage universe can be found on J.P. Morgan's Research website, https://www.jpmorganmarkets.com.
Coverage Universe: Tsai, Jerry : Chicony Power Technology (6412.TW), Chroma ATE (2360.TW), Chunghwa Precision Test Tech (6510.TWO), E Ink (8069.TWO), Elite Material Co (2383.TW), Flexium Interconnect Inc (6269.TW), Radiant Opto Electronics Corp. (6176.TW), Sunonwealth (2421.TW), Taiwan Surface Mount Tech (6278.TW), Tripod Technology Corp (3044.TW), Unimicron (3037.TW), WIN Semiconductors Corp (3105.TWO), YAGEO (2327.TW)
| Date | Rating | Price (NT$) | Price Target (NT$) |
|---|---|---|---|
| 23-Nov-23 | UW | 538.00 | 484 |
| 26-Feb-25 | N | 749.00 | 777 |
| 06- ay-26 | OW | 3660.00 | 4,800 |
| 11-Aug-26 | OW | 2845.00 | 4,200 |
| 08-Sep-26 | OW | 3470.00 | 4,900 |
J.P. Morgan Eq ity Research Ratings Distrib tion, as of October 03, 2026
| Overweight (buy) | Ne tral (hold) | Underweight (sell) | |
|---|---|---|---|
| J.P. Morgan Global Equity Research Coverage* | 53% | 35% | 12% |
| IB clients** | 83% | 81% | 72% |
| JPMS Equity Research Coverage* | 51% | 37% | 12% |
| IB clients** | 95% | 93% | 88% |
For p rposes of FINRA ratings distrib tion r les only, o r Overweight rating falls into a b y rating category; o r Ne tral rating falls into a hold rating category; and o r Underweight rating falls into a sell rating category. Please note that stocks with an NR designation are not incl ded in the table above. This information is c rrent as of the end of the most recent calendar q arter.
Eq ity Val ation and Risks: For valuation methodology and risks associated with covered companies or price targets for covered companies, please see the most recent company specific research report at http://www.jpmorganmarkets.com, contact the primary analyst or your J.P. Morgan representative, or email research.disclosure.inquiries@jpmorgan.com. For material information about the proprietary models used, please see the Summary of Financials in company specific research reports and the Company Tearsheets, which are available to download on the company pages of our client website, http://www.jpmorganmarkets.com. This report also sets out within it the material underlying assumptions used.
History of Investment Recommendations:
A history of J.P. Morgan investment recommendations disseminated during the preceding 12 months can be accessed on the Research & Commentary page of http://www.jpmorganmarkets.com where you can also search by analyst name, sector or financial instrument.
Analysts' Compensation:The research analysts responsible for the preparation of this report receive compensation based upon various factors, including the quality and accuracy of research, client feedback, competitive factors, and overall firm revenues.
Registration of non-US Analysts: Unless otherwise noted, the non US analysts listed on the front of this report are employees of non US affiliates of J.P. Morgan Securities LLC, may not be registered as research analysts under FINRA rules, may not be associated persons of J.P. Morgan Securities LLC, and may not be subject to FINRA Rule 2241 or 2242 restrictions on communications with covered companies, public appearances, and trading securities held by a research analyst account.
Other Disclos res
J.P. Morgan is a marketing name for investment banking businesses of JPMorgan Chase & Co. and its subsidiaries and affiliates worldwide.
UK MIFID FICC research nb ndling exemption: UK clients should refer to UK MIFID Research Unbundling exemption for details of J.P. Morgan's implementation of the FICC research exemption and guidance on relevant FICC research categorisation.
All research material made available to clients are simultaneously available on our client website, J.P. Morgan Markets, unless specifically permitted by relevant laws. Not all research content is redistributed, e mailed or made available to third party aggregators. For all research material available on a particular stock, please contact your sales representative.
Any long form nomenclature for references to China; Hong Kong; Taiwan; and Macau within this research material are Mainland China; Hong Kong SAR (China); Taiwan (China); and Macau SAR (China).
J.P. Morgan Research may, from time to time, write on issuers or securities targeted by economic or financial sanctions imposed or administered by the governmental authorities of the U.S., EU, UK or other relevant jurisdictions (Sanctioned Securities). Nothing in this report is intended to be read or construed as encouraging, facilitating, promoting or otherwise approving investment or dealing in such Sanctioned Securities. Clients should be aware of their own legal and compliance obligations when making investment decisions.
Digital assets, which may also be referred to as virtual or crypto assets or crypto currencies (e.g. bitcoin), discussed in this research report are subject to a rapidly changing regulatory landscape. The application of relevant laws in respect of such assets may be unsettled, and the legality of any digital asset investment may be unclear. Prior to making any investment decision regarding any digital asset, investors should seek their own legal advice and be aware of any legal considerations regarding the purchase, holding or selling of such an investment. For relevant regulatory advisories on digital assets, including bitcoin and ethereum, please see https://www.jpmorgan.com/disclosures/cryptoasset disclosure.
The author(s) of this research report may not be licensed to carry on regulated activities in your jurisdiction and, if not licensed, do not hold themselves out as being able to do so.
Exchange-Traded F nds (ETFs): J.P. Morgan Securities LLC ('JPMS') acts as authorized participant for substantially all U.S. listed ETFs. To the extent that any ETFs are mentioned in this report, JPMS may earn commissions and transaction based compensation in connection with the distribution of those ETF shares and may earn fees for performing other trade related services, such as securities lending to short sellers of the ETF shares. JPMS may also perform services for the ETFs themselves, including acting as a broker or dealer to the ETFs. In addition, affiliates of JPMS may perform services for the ETFs, including trust, custodial, administration, lending, index calculation and/or maintenance and other services.
Options and F t res related research: If the information contained herein regards options or futures related research, such information is available only to persons who have received the proper options or futures risk disclosure documents. Please contact your J.P. Morgan Representative or visit https://www.theocc.com/components/docs/riskstoc.pdf for a copy of the Option Clearing Corporation's Characteristics and Risks of Standardized Options or
https://www.finra.org/sites/default/files/2020 08/Security_Futures_Risk_Disclosure_Statement_2020.pdf for a copy of the Security Futures Risk Disclosure Statement.
Changes to Interbank Offered Rates (IBORs) and other benchmark rates: Certain interest rate benchmarks are, or may in the future become, subject to ongoing international, national and other regulatory guidance, reform and proposals for reform. For more information, please consult: https://www.jpmorgan.com/global/disclosures/interbank_offered_rates
Private Bank Clients: Where you are receiving research as a client of the private banking businesses offered by JPMorgan Chase & Co. and its subsidiaries ('J.P. Morgan Private Bank'), research is provided to you by J.P. Morgan Private Bank and not by any other division of J.P. Morgan, including, but not limited to, the J.P. Morgan Corporate and Investment Bank and its Global Research division.
Legal entity responsible for the prod ction and distrib tion of research: The legal entity identified below the name of the Reg AC Research Analyst who authored this material is the legal entity responsible for the production of this research. Where multiple Reg AC Research Analysts authored this material with different legal entities identified below their names, these legal entities are jointly responsible for the production of this research. Where more than one legal entity is listed under an analyst's name, the first legal entity is responsible for the production unless stated otherwise. Research Analysts from various J.P. Morgan affiliates may have contributed to the production of this material but may not be licensed to carry out regulated activities in your jurisdiction (and do not hold themselves out as being able to do so). Unless otherwise stated below in the legal entity disclosures, this material has been distributed by the legal entity responsible for production, or where more than one legal entity is listed under the analyst's name, the first legal entity will be responsible for distribution. If you have any queries, please contact the relevant Research Analyst in your jurisdiction or the entity in your jurisdiction that has distributed this research material.
Legal Entities Disclos res and Co ntry-/Region-Specific Disclos res:
Argentina: JPMorgan Chase Bank N.A Sucursal Buenos Aires is regulated by Banco Central de la República Argentina ('BCRA' Central Bank of Argentina) and Comisión Nacional de Valores ('CNV' Argentinian Securities Commission ALYC y AN Integral N°51).
A stralia: J.P. Morgan Securities Australia Limited ('JPMSAL') (ABN 61 003 245 234/AFS Licence No: 238066) is regulated by the Australian Securities and Investments Commission and is a Market Participant of ASX Limited, a Clearing and Settlement Participant of ASX Clear Pty Limited and a Clearing Participant of ASX Clear (Futures) Pty Limited. This material is issued and distributed in Australia by or on behalf of JPMSAL only to "wholesale clients" (as defined in section 761G of the Corporations Act 2001). A list of all financial products covered can be found by visiting https://www.jpmm.com/research/disclosures. J.P. Morgan seeks to cover companies of relevance to the domestic and international investor base across all Global Industry Classification Standard (GICS) sectors, as well as across a range of market capitalisation sizes. If applicable, in the course of conducting public side due diligence on the subject company(ies), the Research Analyst team may at times perform such diligence through corporate engagements such as site visits, discussions with company representatives, management presentations, etc. Research issued by JPMSAL has been prepared in accordance with J.P. Morgan Australia's Research Independence Policy which can be found at the following link: J.P. Morgan Australia Research Independence Policy.
Brazil: Banco J.P. Morgan S.A. is regulated by the Comissao de Valores Mobiliarios (CVM) and by the Central Bank of Brazil. Ombudsman J.P. Morgan: 0800 7700847 / 0800 7700810 (For Hearing Impaired) / ouvidoria.jp.morgan@jpmchase.com.
Canada: J.P. Morgan Securities Canada Inc. is a registered investment dealer, regulated by the Canadian Investment Regulatory Organization and the Ontario Securities Commission and is the participating member on Canadian exchanges. This material is distributed in Canada by or on behalf of J.P.Morgan Securities Canada Inc.
Chile: Inversiones J.P. Morgan Limitada is an unregulated entity incorporated in Chile.
China: J.P. Morgan Securities (China) Company Limited has been approved by CSRC to conduct the securities investment consultancy business.
Colombia: Banco J.P. Morgan Colombia S.A. is supervised by the Superintendencia Financiera de Colombia (SFC). Any reference in this material to products or services offered abroad by entities other than the Bank in Colombia is included exclusively for descriptive purposes. Such references do not constitute, and should not be construed as, promotional activity or the provision of financial products or services within Colombian territory, as defined under applicable Colombian regulation.
D bai International Financial Centre (DIFC): JPMorgan Chase Bank, N.A., Dubai Branch is regulated by the Dubai Financial Services Authority (DFSA) and its registered address is Dubai International Financial Centre The Gate, West Wing, Level 3 and 9 PO Box 506551, Dubai, UAE. This material has been distributed by JP Morgan Chase Bank, N.A., Dubai Branch to persons regarded as professional clients or market counterparties as defined under the DFSA rules.
E ropean Economic Area (EEA): Unless specified to the contrary, research is distributed in the EEA by J.P. Morgan SE ('JPM SE'), which is authorised as a credit institution by the Federal Financial Supervisory Authority (Bundesanstalt für Finanzdienstleistungsaufsicht, BaFin) and jointly supervised by the BaFin, the German Central Bank (Deutsche Bundesbank) and the European Central Bank (ECB). JPM SE is a company headquartered in Frankfurt with registered address at TaunusTurm, Taunustor 1, Frankfurt am Main, 60310, Germany. The material has been distributed in the EEA to persons regarded as professional investors (or equivalent) pursuant to Art. 4 para. 1 no. 10 and Annex II of MiFID II and its respective implementation in their home jurisdictions ('EEA professional investors'). This material must not be acted on or relied on by persons who are not EEA professional investors. Any investment or investment activity to which this material relates is only available to EEA relevant persons and will be engaged in only with EEA relevant persons.
Hong Kong: J.P. Morgan Securities (Asia Pacific) Limited (CE number AAJ321) is regulated by the Hong Kong Monetary Authority and the Securities and Futures Commission in Hong Kong, and J.P. Morgan Broking (Hong Kong) Limited (CE number AAB027) is regulated by the Securities and Futures Commission in Hong Kong. JP Morgan Chase Bank, N.A., Hong Kong Branch (CE Number AAL996) is regulated by the Hong Kong Monetary Authority and the Securities and Futures Commission, is organized under the laws of the United States with limited liability. Where the distribution of this material is a regulated activity in Hong Kong, the material is distributed in Hong Kong by or through J.P. Morgan Securities (Asia Pacific) Limited and/or J.P. Morgan Broking (Hong Kong) Limited.
India: J.P. Morgan India Private Limited (Corporate Identity Number U67120MH1992FTC068724), having its registered office at J.P. Morgan Tower, Off. C.S.T. Road, Kalina, Santacruz East, Mumbai - 400098, is registered with the Securities and Exchange Board of India (SEBI) as a 'Research Analyst' having registration number INH000001873. J.P. Morgan India Private Limited is also registered with SEBI as a member of the National Stock Exchange of India Limited and the Bombay Stock Exchange Limited (SEBI Registration Number - INZ000239730) and as a Merchant Banker (SEBI Registration Number MB/INM000002970). Telephone: 91 22 6157 3000, Facsimile: 91 22 6157 3990 and Website: http://www.jpmipl.com. JPMorgan Chase Bank, N.A. Mumbai Branch is licensed by the Reserve Bank of India (RBI) (Licence No. 53/ Licence No. BY.4/94; SEBI IN/CUS/014/ CDSL : IN DP CDSL 444 2008/ IN DP NSDL 285 2008/ INBI00000984/ INE231311239) as a Scheduled Commercial Bank in India, which is its primary license allowing it to carry on Banking business in India and other activities, which a Bank branch in India are permitted to undertake. For non local research material, this material is not distributed in India by J.P. Morgan India Private Limited. Compliance Officer: Ashutosh Sharma; ashutosh.j.sharma@jpmchase.com; +912261575002. Grievance Officer: Ramprasadh K, jpmipl.research.feedback@jpmorgan.com; +912261573000. Registration granted by SEBI and certification from NISM in no way guarantee performance of the intermediary or provide any assurance of returns to investors. Please visit Terms and Conditions and Most Important Terms and Conditions (MITC). The annual Compliance audit report is available at http://www.jpmipl.com/#research.
Indonesia: PT J.P. Morgan Sekuritas Indonesia is a member of the Indonesia Stock Exchange and is registered and supervised by the Otoritas Jasa Keuangan (OJK).
Korea: J.P. Morgan Securities (Far East) Limited, Seoul Branch, is a member of the Korea Exchange (KRX). JPMorgan Chase Bank, N.A., Seoul Branch, is licensed as a branch office of foreign bank (JPMorgan Chase Bank, N.A.) in Korea. Both entities are regulated by the Financial Services Commission (FSC) and the Financial Supervisory Service (FSS). For non macro research material, the material is distributed in Korea by or through J.P. Morgan Securities (Far East) Limited, Seoul Branch.
Japan: JPMorgan Securities Japan Co., Ltd. and JPMorgan Chase Bank, N.A., Tokyo Branch are regulated by the Financial Services Agency in Japan.
Malaysia: This material is issued and distributed in Malaysia by JPMorgan Securities (Malaysia) Sdn Bhd (18146 X), which is a Participating Organization of Bursa Malaysia Berhad and holds a Capital Markets Services License issued by the Securities Commission in Malaysia.
Mexico: J.P. Morgan Casa de Bolsa, S.A. de C.V., J.P. Morgan Grupo Financiero is member of the Mexican Stock Exchange ('Bolsa Mexicana de Valores') and the Institutional Stock Exchange ('Bolsa Institucional de Valores'), and it is authorized to act as a broker dealer by the National Banking and Securities Exchange Commission ('Comisión Nacional Bancaria y de Valores').
New Zealand: This material is issued and distributed by JPMSAL in New Zealand only to "wholesale clients" (as defined in the Financial Markets Conduct Act 2013). JPMSAL is registered as a Financial Service Provider under the Financial Service providers (Registration and Dispute Resolution) Act of 2008.
Nigeria: J.P. Morgan Chase Representative Office (Nigeria) Limited is regulated by the Central Bank of Nigeria.
Philippines: J.P. Morgan Securities Philippines Inc. is a Trading Participant of the Philippine Stock Exchange and a member of the Securities Clearing Corporation of the Philippines and the Securities Investor Protection Fund. It is regulated by the Securities and Exchange Commission.
Singapore: This material is issued and distributed in Singapore by or through J.P. Morgan Securities Singapore Private Limited (JPMSS) [MDDI (P) 070/08/2026 and Co. Reg. No.: 199405335R], which is a member of the Singapore Exchange Securities Trading Limited, and/or JPMorgan Chase Bank, N.A., Singapore branch (JPMCB Singapore), both of which are regulated by the Monetary Authority of Singapore. This material is issued and distributed in Singapore only to accredited investors, expert investors and institutional investors, as defined in Section 4A of the Securities and Futures Act, Cap. 289 (SFA). This material is not intended to be issued or distributed to any retail investors or any other investors that do not fall into the classes of 'accredited investors,' 'expert investors' or 'institutional investors,' as defined under Section 4A of the SFA. Recipients of this material in Singapore are to contact JPMSS or JPMCB Singapore in respect of any matters arising from, or in connection with, the material.
J PMORGAN
So th Africa: J.P. Morgan Equities South Africa Proprietary Limited and JPMorgan Chase Bank, N.A., Johannesburg Branch are members of the Johannesburg Securities Exchange and are regulated by the Financial Services Conduct Authority (FSCA).
Taiwan: J.P. Morgan Securities (Taiwan) Limited is a participant of the Taiwan Stock Exchange (company type) and regulated by the Taiwan Securities and Futures Bureau. Material relating to equity securities is issued and distributed in Taiwan by J.P. Morgan Securities (Taiwan) Limited, subject to the license scope and the applicable laws and the regulations in Taiwan. To the extent that J.P. Morgan Sec rities (Taiwan) Limited prod ces research materials on sec rities not listed on the Taiwan Stock Exchange or Taipei Exchange ('Non-Taiwan Listed Sec rities'), these materials shall not constit te sec rities recommendations for the p rpose of applicable Taiwan reg lations, and, for the avoidance of do bt, J.P. Morgan Sec rities (Taiwan) Limited does not act as broker for Non-Taiwan Listed Sec rities. According to Paragraph 2, Article 7 1 of Operational Regulations Governing Securities Firms Recommending Trades in Securities to Customers (as amended or supplemented) and/or other applicable laws or regulations, please note that the recipient of this material is not permitted to engage in any activities in connection with the material that may give rise to conflicts of interests, unless otherwise disclosed in the 'Important Disclosures' in this material.
Thailand: This material is issued and distributed in Thailand by JPMorgan Securities (Thailand) Ltd., which is a member of the Stock Exchange of Thailand and is regulated by the Ministry of Finance and the Securities and Exchange Commission. The registered address is 548 One City Center Building, 50th Floor, Ploenchit Road, Lumphini, Pathum Wan, Bangkok 10330.
UK: Research is produced in the UK by J.P. Morgan Securities plc ('JPMS plc') which is a member of the London Stock Exchange and is authorised by the Prudential Regulation Authority and regulated by the Financial Conduct Authority and the Prudential Regulation Authority or J.P. Morgan Markets Limited ('JPMML Ltd') which is authorised and regulated by the Financial Conduct Authority. Unless specified to the contrary, this material is distributed in the UK by JPMS plc and is directed in the UK only to: (a) persons having professional experience in matters relating to investments falling within article 19(5) of the Financial Services and Markets Act 2000 (Financial Promotion) (Order) 2005 ('the FPO'); (b) persons outlined in article 49 of the FPO (high net worth companies, unincorporated associations or partnerships, the trustees of high value trusts, etc.); or (c) any persons to whom this communication may otherwise lawfully be made; all such persons being referred to as "UK relevant persons". This material must not be acted on or relied on by persons who are not UK relevant persons. Any investment or investment activity to which this material relates is only available to UK relevant persons and will be engaged in only with UK relevant persons. A description of J.P. Morgan EMEA's policy for prevention and avoidance of conflicts of interest related to the production of Research can be found at the following link: J.P. Morgan EMEA Research Independence Policy.
U.S.: J.P. Morgan Securities LLC ('JPMS') is a member of the NYSE, FINRA, SIPC, and the NFA. JPMorgan Chase Bank, N.A. is a member of the FDIC. Material published by non U.S. affiliates is distributed in the U.S. by JPMS who accepts responsibility for its content.
General: Additional information is available upon request. The information in this material has been obtained from sources believed to be reliable. While all reasonable care has been taken to ensure that the facts stated in this material are accurate and that the forecasts, opinions and expectations contained herein are fair and reasonable, JPMorgan Chase & Co. or its affiliates and/or subsidiaries (collectively J.P. Morgan) make no representations or warranties whatsoever to the completeness or accuracy of the material provided, except with respect to any disclosures relative to J.P. Morgan and the Research Analyst's involvement with the issuer that is the subject of the material. Accordingly, no reliance should be placed on the accuracy, fairness or completeness of the information contained in this material. There may be certain discrepancies with data and/or limited content in this material as a result of calculations, adjustments, translations to different languages, and/or local regulatory restrictions, as applicable. These discrepancies should not impact the overall investment analysis, views and/or recommendations of the subject company(ies) that may be discussed in the material. Artificial intelligence tools may have been used in the preparation of this material, including assisting in data analysis, pattern recognition, and content drafting for research material. J.P. Morgan accepts no liability whatsoever for any loss arising from any use of this material or its contents, and neither J.P. Morgan nor any of its respective directors, officers or employees, shall be in any way responsible for the contents hereof, apart from the liabilities and responsibilities that may be imposed on them by the relevant regulatory authority in the jurisdiction in question, or the regulatory regime thereunder. Opinions, forecasts or projections contained in this material represent J.P. Morgan's current opinions or judgment as of the date of the material only and are therefore subject to change without notice. Periodic updates may be provided on companies/industries based on company specific developments or announcements, market conditions or any other publicly available information. There can be no assurance that future results or events will be consistent with any such opinions, forecasts or projections, which represent only one possible outcome. Furthermore, such opinions, forecasts or projections are subject to certain risks, uncertainties and assumptions that have not been verified, and future actual results or events could differ materially. The value of, or income from, any investments referred to in this material may fluctuate and/or be affected by changes in exchange rates. All pricing is indicative as of the close of market for the securities discussed, unless otherwise stated. Past performance is not indicative of future results. Accordingly, investors may receive back less than originally invested. This material is not intended as an offer or solicitation for the purchase or sale of any financial instrument. The opinions and recommendations herein do not take into account individual client circumstances, objectives, or needs and are not intended as recommendations of particular securities, financial instruments or strategies to particular clients. This material may include views on structured securities, options, futures and other derivatives. These are complex instruments, may involve a high degree of risk and may be appropriate investments only for sophisticated investors who are capable of understanding and assuming the risks involved. The recipients of this material must make their own independent decisions regarding any securities or financial instruments mentioned herein and should seek advice from such independent financial, legal, tax or other adviser as they deem necessary. J.P. Morgan may trade as a principal on the basis of the Research Analysts' views and research, and it may also engage in transactions for its own account or for its clients' accounts in a manner inconsistent with the views taken in this material, and J.P. Morgan is under no obligation to ensure that such other communication is brought to the attention of any recipient of this material. Others within J.P. Morgan, including Strategists, Sales staff and other Research Analysts, may take views that are inconsistent with those taken in this material. Employees of J.P. Morgan not involved in the preparation of this material may have investments in the securities (or derivatives of such securities) mentioned in this material and may trade them in ways different from those discussed in this material. This material is not an advertisement for or marketing of any issuer, its products or services, or its securities in any jurisdiction.
Confidentiality and Sec rity Notice: This transmission may contain information that is privileged, confidential, legally privileged, and/or exempt from disclosure under applicable law. If you are not the intended recipient, you are hereby notified that any disclosure, copying, distribution, or use of the information contained herein (including any reliance thereon) is STRICTLY PROHIBITED. Although this transmission and any attachments are believed to be free of any virus or other defect that might affect any computer system into which it is received and opened, it is the responsibility of the recipient to ensure that it is virus free and no responsibility is accepted by JPMorgan Chase & Co., its subsidiaries and affiliates, as applicable, for any loss or damage arising in any way from its use. If you received this transmission in error, please immediately contact the sender and destroy the material in its entirety, whether in electronic or hard copy format. This message is subject to electronic monitoring: https://www.jpmorgan.com/disclosures/email
MSCI: Certain information herein ('Information') is reproduced by permission of MSCI Inc., its affiliates and information providers ('MSCI') ©2026. No reproduction or dissemination of the Information is permitted without an appropriate license. MSCI MAKES NO EXPRESS OR IMPLIED WARRANTIES (INCLUDING MERCHANTABILITY OR FITNESS) AS TO THE INFORMATION AND DISCLAIMS ALL LIABILITY TO THE EXTENT PERMITTED BY LAW. No Information constitutes investment advice, except for any applicable Information from MSCI ESG Research. Subject also to msci.com/disclaimer
Any mentions of third party trademarks, brand names, products, and services are for referential purposes only and any mention thereof is not meant to imply any sponsorship, endorsement, or affiliation.
Sustainalytics: Certain information, data, analyses and opinions contained herein are reproduced by permission of Sustainalytics and: (1) includes the proprietary information of Sustainalytics; (2) may not be copied or redistributed except as specifically authorized; (3) do not constitute investment advice nor an endorsement of any product or project; (4) are provided solely for informational purposes; and (5) are not warranted to be complete, accurate or timely. Sustainalytics is not responsible for any trading decisions, damages or other losses related to it or its use. The use of the data is subject to conditions available at https://www.sustainalytics.com/legal disclaimers. ©2026 Sustainalytics. All Rights Reserved.
"Other Disclosures" last revised October 17, 2026.
Copyright 2026 JPMorgan Chase & Co. All rights reserved. This material or any portion hereof may not be reprinted, sold or redistrib ted witho t the written consent of J.P. Morgan. Witho t prior written consent from J.P. Morgan, it is prohibited to (A) se or share any material, commentary, information or other data received from J.P. Morgan or an a thorized third-party ("J.P. Morgan Data") in any artificial intelligence ("AI") systems or models, or (B) se a tomated means, incl ding robots, crawlers, web-scrapers or other a tomated tools or scripts, to access, collect, extract or harvest any J.P. Morgan Data, incl ding scraping of ser data, content, metadata, pricing information or other information. #$J&098$#*P
Completed 26 Oct 2026 08:04 PM HKT
Disseminated 26 Oct 2026 08:11 PM HKT