PDF 原檔:報告_GS_弘塑3131_20260526_original.pdf
原始內容
Grand Process Technology Corp. (3131.TWO)
Capacity expansion accelerates on stronger 2027/2028 demand visibility; reiterate Buy; TP up to NT$4,500
3131.TWO
12m Pri c e Target:
NT$4,500.00
Pri c e:
NT$3,115.00
Upside:
44.5%
GPTC hosted its 2Q26 analyst meeting on May 26, 2026. Management provided updates on 2026-2028 demand and capacity outlook, growth drivers across next-generation advanced packaging, and GM dynamics. Most notably, management for the fi rst time laid out a multi-year demand and capacity framework extending through 2028, with demand guided to grow at a ~45% CAGR and capacity at a ~50% CAGR , reinforcing our view that GPTC remains in an extended structural upcycle well beyond 2027. On the back of stronger demand visibility and higher GM uplift from 3D packaging mix shift, we revise our 2026E-28E estimates by 1.2%/-7.4%/23% and raise our 12m TP to NT$4,500 (from NT$4,000) based on 35x of 2H27-1H28E EPS (from 2027E previously). With 45% implied upside, we reiterate our Buy rating on GPTC.
New capacity & demand guidance points to multi-year tightness
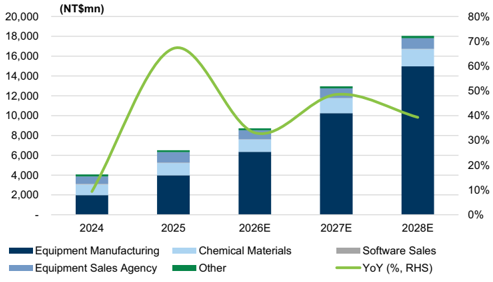
Management laid out its fi rst explicit multi-year demand and capacity outlook through 2028 at this meeting, with demand guided to grow at a 45% CAGR and capacity expansion at a slightly faster ~50% CAGR, rea ffi rming GPTC's previous capacity expansion plan. With GPTC's Phase 2 fab having now entered production, annual capacity is on track to reach ~200 units in 2026, with another c.100 units of capacity scheduled to come online by end-2027 and total annual output stepping up to ~450 units by 2028 . The multi-year ramp is also supported by a signi fi cant headcount expansion (already up to 350 employees as of May 2026 vs. 250 in end of 2025) alongside an ongoing transition toward higher self-production. Importantly, management noted that current capacity remains insu ffi cient even after the Phase 2 ramp , with demand supported by multiple growth drivers, including 2.5D advanced packaging, 3D IC, panel-level packaging (PLP), HBM, and Co-Packaged Optics (CPO). Overall, we reiterate our view that GPTC is moving beyond a single 2.5D-driven upcycle, with successive
BUY
Evelyn Yu
+886(2)2730-4187 | evelyn.yu@gs.com Goldman Sachs (Asia) L.L.C., Taipei Branch
Bruce Lu
+886(2)2730-4185 | bruce.lu@gs.com Goldman Sachs (Asia) L.L.C., Taipei Branch
Ryan Huang, CFA
+886(2)2730-4084 | ryan.huang@gs.com Goldman Sachs (Asia) L.L.C., Taipei Branch
Key Data _____________________________________
Market cap: NT$90.5bn / $2.9bn
Enterprise value: NT$92.2bn / $2.9bn
3m ADTV: NT$2.7bn / $85.0mn
Taiwan
Taiwan Semiconductor
M&A Rank: 3
Leases incl. in net debt & EV?: Yes
| GS Forecast | 12/25 | __________ 12/26E | 12/27E | 12/28E |
|---|---|---|---|---|
| Revenue(NT$mn) New | 6,514.5 | 8,721.7 | 12,955.4 | 18,047.5 |
| Revenue (NT$ mn) Old | 6,514.5 | 8,638.1 | 13,105.9 | 15,031.6 |
| EBITD A (NT$ mn) | 1,766.2 | 1,994.6 | 4,066.7 | 6,633.8 |
| EPS(NT$) New | 45.45 | 62.23 | 105.80 | 173.71 |
| EPS (NT$) Old | 45.45 | 61.52 | 114.27 | 141.24 |
| P/E (X) | 29.7 | 50.1 | 29.4 | 17.9 |
| P/B (X) | 8.3 | 22.9 | 17.4 | 12.7 |
| Dividend yield (%) | 3.4 | 2.0 | 3.5 | 5.7 |
| CROCI (%) | 49.1 | 13.3 | 47.0 | 70.2 |
| 3/26 | 6/26E | 9/26E | 12/26E | |
| EPS (NT$) | 16.11 | 9.13 | 14.11 | 22.88 |
Source: Company data, Goldman Sachs Research estimates. See disclosures for details.
Goldman Sachs does and seeks to do business with companies covered in its research reports. As a result, investors should be aware that the fi rm may have a con fl ict of interest that could a ff ect the objectivity of this report. Investors should consider this report as only a single factor in making their investment decision. For Reg AC certi fi cation and other important disclosures, see the Disclosure Appendix, or go to www.gs.com/research/hedge.html. Analysts employed by non-US a ffi liates are not registered/quali fi ed as research analysts with FINRA in the U.S.
e92c7a75ab8b4efbba794e6b187208c8
Grand Process Technology Corp. (3131.TWO)
Rating since Jun 25, 2025
Ratios & Valuation __________________________________________
| 12/25 | 12/26E | 12/27E | 12/28E | |
|---|---|---|---|---|
| P/E (X) | 29.7 | 50.1 | 29.4 | 17.9 |
| P/B (X) | 8.3 | 22.9 | 17.4 | 12.7 |
| FCF yield (%) | 4.2 | (0.2) | 3.4 | 4.7 |
| EV/EBITDAR (X) | 22.5 | 46.3 | 22.5 | 13.6 |
| EV/EBITDA (excl. leases) (X) | 22.5 | 46.3 | 22.5 | 13.6 |
| CROCI (%) | 49.1 | 13.3 | 47.0 | 70.2 |
| ROE (%) | 28.6 | 41.7 | 67.6 | 82.3 |
| Net debt/equity (%) | 5.9 | 41.9 | 8.3 | (10.4) |
| Net debt/equity (excl. leases) (%) | 5.9 | 41.9 | 8.3 | (10.4) |
| I n te r est c ov e r (X) | 35.5 | 30.5 | 64.6 | 106.8 |
| Days i nv e n t or y o utst , sales | 156.5 | 185.2 | 162.0 | 137.4 |
| Recei v able days | 37.7 | 43.5 | 39.7 | 39.1 |
| Days p ayable o utsta n di ng | 154.1 | 192.7 | 213.1 | 216.3 |
| DuP on t ROE (%) | 27.8 | 45.6 | 59.2 | 70.9 |
| Tu rnov e r (X) | 0.5 | 0.6 | 0.8 | 0.9 |
| L e v e r a g e (X) | 2.7 | 3.7 | 3.2 | 2.9 |
| Gro ss cas h i nv ested (ex cas h ) (NT $ ) | 5 , 948.6 | 6 , 805.4 | 6 , 992.6 | 7 , 927.9 |
| A v e r a g e ca p ital e mp l o yed (NT $ ) | 4 , 199.8 | 5 , 345.0 | 5 , 650.5 | 6 , 038.1 |
| BVP S (NT $ ) | 163.26 | 136.01 | 178.85 | 245.03 |
Growth & Margins (%) ______________________________________
| 12/25 | 12/26E | 12/27E | 12/28E | |
|---|---|---|---|---|
| Total revenue growth | 59.9 | 33.9 | 48.5 | 39.3 |
| EBITDA growth | 76.8 | 12.9 | 103.9 | 63.1 |
| EPS growth | 56.2 | 36.9 | 70 | 64.2 |
| DPS growth | 108.9 | 36.9 | 70 | 64.2 |
| EBIT margin | 25.1 | 21.1 | 30.1 | 35.8 |
| EBITDA margin | 27.1 | 22.9 | 31.4 | 36.8 |
| Net income margin | 20.4 | 20.8 | 23.9 | 28.1 |
Price Performance __________________________________________
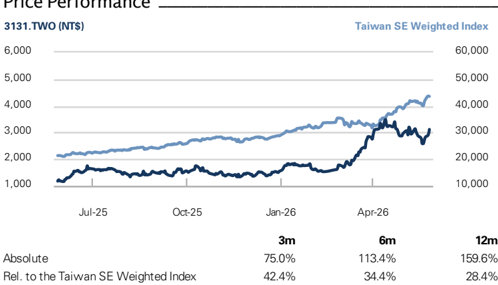
Source: FactSet. Price as of 26 May 2026 close.
Income Statement (NT$ mn) ________________________________
| 12/25 | 12/26E | 12/27E | 12/28E | |
|---|---|---|---|---|
| Tota l r e v e nu e | 6 ,514.5 | 8,721.7 | 12,955.4 | 18,047.5 |
| Co s t of good s s old | (3,833.1) | (5,451.6) | (7,247.9) | (9,453.5) |
| SG&A | (699.7) | (842.8) | (999.2) | (1,142.6) |
| R&D | (345.3) | (588.8) | (808.3) | (998.3) |
| Other operating inc./(exp.) E BITDA | -- 1 , 766 . 2 | -- 1 ,994. 6 | -- 4,0 66 . 7 | -- 6 , 6 33. 8 |
| Depreciation& amortization | (129.8) | (156.1) | (166.7) | (180.6) |
| E BIT | 1 , 6 3 6 . 5 | 1 , 8 3 8 . 5 | 3,900.0 | 6 ,4 5 3. 1 |
| Net intere s t inc./(exp.) | 19.7 | 18.8 | 20.3 | 20.3 |
| Income/(lo ss ) from a ss ociate s | -- | 2.7 | -- 3,9 2 0.3 | -- 6 ,4 7 3.4 |
| Pre-tax pro fi t | 1 , 68 9. 8 (364.8) | 2 , 27 4.0 (465.6) | (829.2) | (1,398.3) |
| Provi s ion for taxe s Minority intere s t | 2.4 | 1.8 | -- | -- |
| Preferred dividend s | -- | -- | -- | -- |
| ls) | ||||
| N et inc . ( pre-ex c ept i o n a | 1 ,3 27 .4 | 1 , 81 0. 2 | 3,09 1 . 2 | 5 ,0 75 . 1 |
| Po s t-tax exceptional s N et inc . ( po s t-ex c ept i o n | -- 1 ,3 27 .4 | -- 1 , 81 0. 2 | -- 3,09 1 . 2 1 0 5 . 8 | -- 5 ,0 75 . 1 17 3. 71 |
| a ls) E P S(b a sic , pre-ex c ept ) (N T $) | 4 5 .4 5 | 62 . 2 3 62 . 2 3 | 0 1 0 5 . 8 0 | |
| E P S(dilu te d , pre-ex c ept ) (N T $) | 4 5 .4 5 | 17 3. 71 | ||
| E P S(b a sic , po s t-ex c ept ) (N T $) | 4 5 .4 5 | 62 . 2 3 | 1 0 5 . 8 0 | 17 3. 71 71 |
| E P S(dilu te d , po s t-ex c ept ) (N T $) | 4 5 .4 5 | 62 . 2 3 | 1 0 5 . 8 0 | 17 3. |
| DPS (NT$) | 46.19 | 63.25 | 107.53 | 176.54 |
| Div. payout ratio (%) | ||||
| 101.6 | 101.6 | 101.6 | 101.6 | |
| Balance Sheet (NT$ mn) C a sh& c a sh equiv a lents | 12/25 2,544.6 | ______ 12/26E 972.7 | 12/27E 2,203.6 | 12/28E 3,382.4 2,365.6 |
| Accounts receiv a ble | 767.4 | 1,312.8 5,738.2 | 1,502.9 5,761.2 | 7,831.3 |
| Inventory Other current a ssets | 3,113.5 3,348.4 | 3,479.3 | 3,479.3 | 3,479.3 |
| Total current assets | 9 ,774. 0 | 11,5 0 2. 9 | 12, 9 47. 0 | 17, 0 |
| 2,204.7 | 2,368.1 | 2,540.7 | 58.6 2,780.6 | |
| Net PP&E Net int a ngibles | 355.0 | 305.3 | 326.0 | 345.5 |
| Tot a l investments | 314.3 | 463.8 | 463.8 | 463.8 |
| Other long-term a ssets | 294.0 | 213.7 | 213.7 16,4 9 1. 3 | 213.7 |
| Total assets | 12, 9 42.1 | 14,85 3 . 9 | 4,404.4 | 2 0 ,862.2 6,801.8 |
| Accounts p a y a ble | 1,697.7 | 4,058.4 0.0 | 0.0 | |
| Short-term debt Short-term le a se li a bilities | 100.0 -- | -- | -- | 0.0 -- |
| Other current li a bilities Total current liabilities | 3,983.9 | 8,428. 3 | 4,063.9 0 ,865.7 | |
| 3,481.3 0 | 8, 0 42.4 | 4,023.9 | 1 | |
| Long-term debt | 5,27 9 . 2,724.7 | 2,639.2 | 2,639.2 | 2,639.2 |
| Long-term le a se li a bilities Other long-term li a bilities | -- | -- 198.6 | -- 198.6 | -- 198.6 |
| Total long-term liabilities Total liabilities | 168.6 2,8 93 . | 2,8 3 7.7 | 11,266.1 -- | 2,8 3 7.7 1 3 ,7 03 .5 |
| 3 | 1 0 ,88 0 .1 | 2,8 3 7.7 | ||
| Preferred sh a res | 8,172. 3 -- | -- | -- 7,129.6 | |
| Tot a l commonequity Minority interest | 4,737.9 3 1. 9 | 3,944.7 2 9 .1 | 5,196.2 2 9 .1 | 2 9 .1 |
| Total liabilities &equity | 9 | 14,85 3 . 9 | 16,4 9 1. 3 | 2 0 ,862.2 |
| Net debt, a djusted | 435.5 | (743.3) | ||
| 12, 42.1 280.1 | __________ | |||
| Cash Flow (NT$ mn) | 1,666.5 | |||
| Net income D&Aadd-back | 12/25 1,327.4 | 12/26E 1,810.2 | 12/27E 3,091.2 166.7 | 12/28E 5,075.1 180.6 |
| Minority interest add-back Net (inc)/dec working | 129.8 (2.4) (668.4) | 156.1 (1.8) | -- 132.8 | -- |
| capital | (809.3) | (535.3) -- | ||
| Other operating cash flow Cash flow fro m operations | 1,034.3 1 , 820 . 7 | (1,103.4) 51 . 7 | -- 3,39 0 . | 4, 720 .4 |
| 7 | ||||
| Capital expenditures Acquisitions | (143.7) -- | (250.2) -- | (320.0) -- | (400.0) -- |
| Divestitures | -- | -- | -- | |
| Others | -- | 104.0 | -- | |
| Cash flow fro m investing | (2,045.3) ( 2 , 18 9. 0 ) | ( 1 4 6 . 1 ) | -- (3 20 . 0 ) | (4 00 . 0 ) |
| Repayment of lease liabilities | -- | -- | ||
| -- | -- | (1,839.7) | (3,141.6) -- | |
| Dividends paid(common& pref) Inc/(dec) in debt | (642.8) 1,363.6 | (1,349.0) (131.5) | -- | |
| Other financing cash flows | (792.9) ( 72 . 1 ) | 3.0 | 0.0 1 , 8 39. 7 ) | 0.0 4 1 . 6 ) |
| Cash flow fro m financing Total cash flow | (44 0 .4) | ( 1 ,4 77 . 6 ) ( 1 , 572 . 0 ) | ( 1 , 2 3 0 .9 | (3, 1 1 , 178 . 8 |
| Free cash flow | 4,320.4 | |||
| 1,677.0 | (198.4) | 3,070.7 |
Source: Company data, Goldman Sachs Research estimates.
e92c7a75ab8b4efbba794e6b187208c8
waves of advanced packaging - SoIC, PLP, CPO - extending its growth runway well into 2028 and beyond. Net net, we now model GPTC's revenue to grow 34%/49%/39% YoY in 2026E-2028E (vs. 33%/52%/15% YoY previously).
3D IC to drive next phase of growth
On 3D IC, management reiterated that GPTC will remain the major 3D IC wet clean equipment supplier , anchored by its technology leadership vs. local peers. While some degree of second-sourcing is to be expected as the technology matures, we continue to view SoIC as a key driver of content value uplift through 2027/2028, underpinned by rapid industry capacity expansion and structurally higher equipment ASP vs. CoWoS. Management characterized 3D packaging as the fastest-growing segment, with 2026 marking the year of initial volume production and 2027/2028 set to see a materially stronger revenue contribution as 3D IC adoption accelerates. Furthermore, management also highlighted that 3D IC wet clean equipment enjoys structurally higher GM vs. 2.5D wet clean equipment , providing a more favorable product mix tailwind to overall corporate GM through 2028. Overall, we view GPTC as a key bene fi ciary of SoIC, and project SoIC to account for c.50% of GPTC's equipment revenue in 2027E-28E, with CPO and future generations of AI chips to drive broader SoIC adoption.
GM expansion ahead on outsourcing ratio reduction and product mix shift
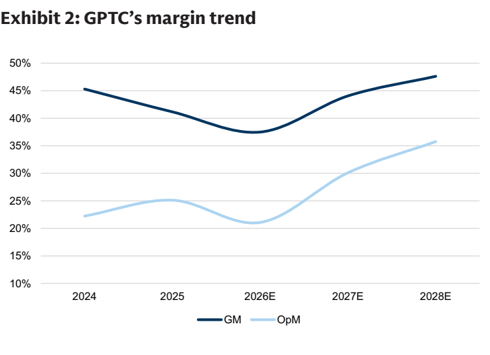
We see a clear path for GPTC's GM to trend meaningfully higher through 2026-28, supported by 1) outsourcing ratio reduction - with GPTC's Phase 2 fab now entering production, in-house manufacturing capacity is set to expand materially, enabling lower outsourcing ratio into 2027. 2) product mix shift towards higher-complexity equipment - 3D IC, panel level-packaging, and CPO brings not only higher dollar content value but also a richer underlying margin pro fi le, as more demanding wet clean processes command both stronger pricing and higher GM. Net net, we now model GM to reach 37.5%/44.1%/47.6% in 2026E-28E (vs. 37.3%/43.4%/46.1% previously), with the bulk of GM expansion concentrated in 2027 as the in-house production transition matures and the 3D IC/PLP product mix accelerates.
Exhibit 1: GPTC's revenue growth outlook
Source: Company data, Goldman Sachs Global Investment Research
Source: Company data, Goldman Sachs Global Investment Research e92c7a75ab8b4efbba794e6b187208c8
Earnings changes, valuation and risks
Forecast changes
We revise our 2026E-28E EPS by 1.2%/-7.4%/23.0% mainly as we factor in 1) stronger 2028 demand/capacity outlook, 2) higher GM on more favorable product mix and lower outsourcing ratio, and 3) higher opex on head count expansion.
Exhibit 3: Earnings revisions
| 2026E | 2026E | 2026E | 2027E | 2027E | 2027E | 2028E | 2028E | 2028E | |
|---|---|---|---|---|---|---|---|---|---|
| (NT$mn) | Old | New | Diff (%) | Old | New | Diff (%) | Old | New | Diff (%) |
| Revenue | 8,638 | 8,722 | 1.0% | 13,106 | 12,955 | -1.1% | 15,032 | 18,048 | 20.1% |
| Gross profit | 3,221 | 3,270 | 1.5% | 5,684 | 5,708 | 0.4% | 6,936 | 8,594 | 23.9% |
| Op. income | 1,810 | 1,839 | 1.6% | 4,010 | 3,900 | -2.7% | 5,041 | 6,453 | 28.0% |
| Net income | 1,789 | 1,810 | 1.2% | 3,339 | 3,091 | -7.4% | 4,127 | 5,075 | 23.0% |
| EPS (NT$) | 61.52 | 62.23 | 1.2% | 114.27 | 105.80 | -7.4% | 141.24 | 173.71 | 23.0% |
| GM | 37.3% | 37.5% | 0.2% | 43.4% | 44.1% | 0.7% | 46.1% | 47.6% | 1.5% |
| OpM | 21.0% | 21.1% | 0.1% | 30.6% | 30.1% | -0.5% | 33.5% | 35.8% | 2.2% |
| NM | 20.7% | 20.8% | 0.0% | 25.5% | 23.9% | -1.6% | 27.5% | 28.1% | 0.7% |
| 2Q26E | 2Q26E | 2Q26E | 3Q26E | 3Q26E | 3Q26E | 4Q26E | 4Q26E | 4Q26E | |
|---|---|---|---|---|---|---|---|---|---|
| (NT$mn) | Old | New | Diff (%) | Old | New | Diff (%) | Old | New | Diff (%) |
| Revenue | 1,821 | 1,828 | 0.4% | 2,295 | 2,308 | 0.5% | 2,925 | 2,989 | 2.2% |
| Gross profit | 653 | 657 | 0.7% | 865 | 875 | 1.2% | 1,164 | 1,199 | 3.0% |
| Op. income | 306 | 307 | 0.2% | 496 | 501 | 0.9% | 798 | 821 | 2.9% |
| Net income | 267 | 267 | 0.0% | 409 | 412 | 0.7% | 651 | 669 | 2.7% |
| EPS (NT$) | 9.13 | 9.13 | 0.0% | 14.01 | 14.11 | 0.7% | 22.27 | 22.88 | 2.7% |
| GM | 35.8% | 35.9% | 0.1% | 37.7% | 37.9% | 0.2% | 39.8% | 40.1% | 0.3% |
| OpM | 16.8% | 16.8% | 0.0% | 21.6% | 21.7% | 0.1% | 27.3% | 27.5% | 0.2% |
| NM | 14.6% | 14.6% | -0.1% | 17.8% | 17.9% | 0.0% | 22.2% | 22.4% | 0.1% |
Source: Company data, Goldman Sachs Global Investment Research
Maintain Buy with 12m TP revised up to NT$4,500 from NT$4,000 prior
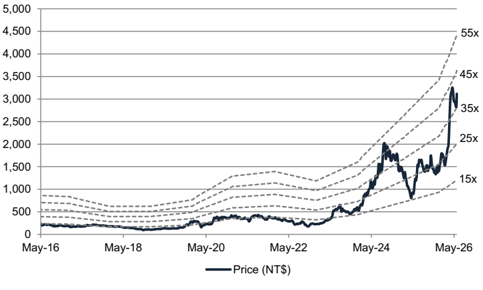
Following our upward earnings revisions, we raise our 12-month TP to NT$4,500 (from NT$4,000 previously). Our 12-month TP is based on a target P/E multiple of 35x (unchanged) applied to our FY2H27E-1H28E EPS (rolled over from 2027E on stronger demand visibility). Our 35x target P/E continues to be based on an avg. fwd P/E during the CoWoS ramp-up in mid-2024 to 2025. Our new TP implies 44.5% upside from current levels, and we maintain our Buy rating on GPTC.
e92c7a75ab8b4efbba794e6b187208c8
Exhibit 4: GPTC's P&L overview
| 1Q26 | 2Q26E | 3Q26E | 4Q26E | 1Q27E | 2Q27E | 3Q27E | 4Q27E | 2026E | 2027E | 2028E | |
|---|---|---|---|---|---|---|---|---|---|---|---|
| P&L | |||||||||||
| Revenue | 1,596 | 1,828 | 2,308 | 2,989 | 2,925 | 3,210 | 3,406 | 3,414 | 8,722 | 12,955 | 18,048 |
| Gross profit | 539 | 657 | 875 | 1,199 | 1,215 | 1,384 | 1,526 | 1,582 | 3,270 | 5,708 | 8,594 |
| Operating profit | 210 | 307 | 501 | 821 | 792 | 930 | 1,053 | 1,125 | 1,839 | 3,900 | 6,453 |
| Net income | 463 | 267 | 412 | 669 | 628 | 725 | 840 | 898 | 1,810 | 3,091 | 5,075 |
| EPS (NT$) | 16.11 | 9.13 | 14.11 | 22.88 | 21.51 | 24.80 | 28.74 | 30.75 | 62.23 | 105.80 | 173.71 |
| Margins (%) | |||||||||||
| GM | 33.8% | 35.9% | 37.9% | 40.1% | 41.6% | 43.1% | 44.8% | 46.3% | 37.5% | 44.1% | 47.6% |
| OpM | 13.2% | 16.8% | 21.7% | 27.5% | 27.1% | 29.0% | 30.9% | 33.0% | 21.1% | 30.1% | 35.8% |
| NM | 29.0% | 14.6% | 17.9% | 22.4% | 21.5% | 22.6% | 24.7% | 26.3% | 20.8% | 23.9% | 28.1% |
| YoY (%) | |||||||||||
| Revenue | 28.7% | 12.2% | 54.5% | 39.0% | 83.2% | 75.6% | 47.6% | 14.2% | 33.9% | 48.5% | 39.3% |
| Gross profit | 6.5% | -0.7% | 43.8% | 32.4% | 125.4% | 110.5% | 74.4% | 32.0% | 22.0% | 74.5% | 50.6% |
| Operating profit | -24.2% | -24.5% | 57.7% | 29.2% | 277.2% | 202.7% | 110.5% | 37.0% | 12.3% | 112.1% | 65.5% |
| Net income | 81.3% | 29.5% | 35.6% | 18.9% | 35.8% | 171.6% | 103.7% | 34.4% | 36.4% | 70.8% | 64.2% |
| EPS | 84.3% | 29.5% | 35.6% | 18.8% | 33.5% | 171.6% | 103.7% | 34.4% | 36.9% | 70.0% | 64.2% |
| QoQ (%) | |||||||||||
| Revenue | -25.7% | 14.5% | 26.2% | 29.5% | -2.1% | 9.8% | 6.1% | 0.2% | |||
| Gross profit | -40.4% | 21.9% | 33.2% | 37.0% | 1.4% | 13.8% | 10.3% | 3.6% | |||
| Operating profit | -67.0% | 46.3% | 62.9% | 64.0% | -3.5% | 17.4% | 13.3% | 6.8% | |||
| Net income | -17.7% | -42.3% | 54.5% | 62.2% | -6.0% | 15.3% | 15.9% | 7.0% | |||
| EPS | -16.4% | -43.3% | 54.5% | 62.2% | -6.0% | 15.3% | 15.9% | 7.0% |
Source: Company data, Goldman Sachs Global Investment Research
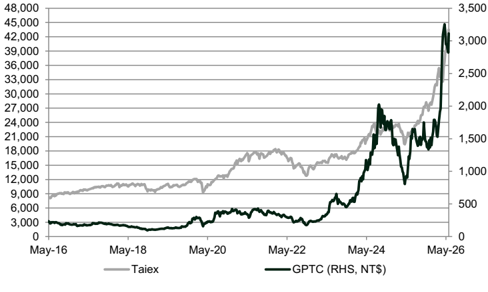
Exhibit 5: Taiex vs. GPTC
Source: TEJ
Exhibit 6: Forward P/E
Source: TEJ
e92c7a75ab8b4efbba794e6b187208c8
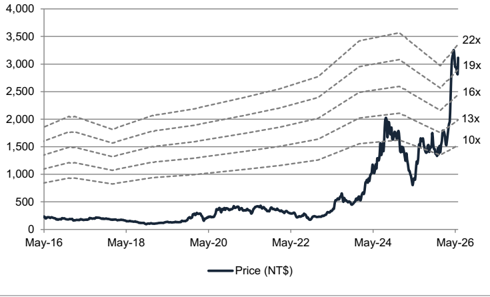
Exhibit 7: Forward P/B
Source: TEJ
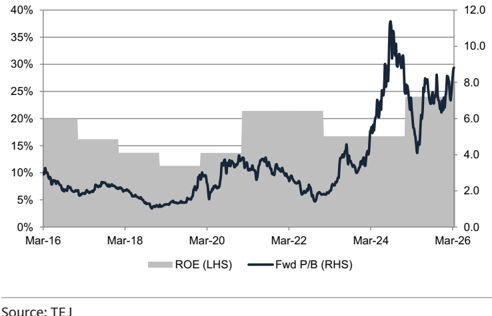
Exhibit 8: P/B vs. ROE
Source: TEJ
Investment Thesis - GPTC (3131.TWO)
GPTC is one of the premier suppliers of semiconductor wet processing equipment, primarily utilized in back-end advanced packaging processes. The company manufactures semiconductor wet processing equipment, including metal etching equipment and single-wafer cleaning equipment, as well as providing engineering and installation services to semiconductor manufacturers. GPTC is the main CoWoS wet clean equipment provider and has 50% of market share at TSMC and near 100% of market share at ASE/SPIL. GPTC is also the sole provider for SoIC wet clean equipment at TSMC given its leading technology versus local peers.
We favor GPTC as we expect its revenue/earnings CAGR to further accelerate to 40%/56% in 2025-28E, driven by 1) continued advanced packaging capacity expansion, and 2) equipment ASP increase amid rising advanced packaging (e.g. SoIC, CPO, FOPLP) technology complexity. The company is now trading below its AI cycle (2023-2025) average forward P/E of 29x; however, with proliferation of advanced packaging into non-AI application and increasing ASP thanks to rising technology complexity, we continue to see upside potential to its revenue and earnings growth and maintain a Buy rating on the name.
Price Target Risks and Methodology - GPTC (3131.TWO)
Valuation: We are Buy rated on GPTC. Our 12m TP of NT$4,500 is based on a target P/E multiple of 35x (based on avg. fwd P/E during the CoWoS ramp-up in mid-2024 to 2025) applied to our FY2H27E-1H28E EPS.
Key risks to our views: 1) softer AI/HPC demand, 2) slower adoption of new advanced packaging technologies, and 3) intensifying competition.
e92c7a75ab8b4efbba794e6b187208c8
圖片清單(已驗證 2026-07-02)
回補驗證:僅涵蓋已被 lib 頁嵌入的圖片,非全量驗證。
| 檔名 | size | 分類 | 親眼所見內容 |
|---|---|---|---|
報告_GS_弘塑3131_20260526_003.png |
37KB | 真資料圖 | 堆疊長條圖+YoY折線圖(單位NT$mn),分 Equipment Manufacturing/Chemical Materials/Software Sales/Equipment Sales Agency/Other 五類,橫軸 2024-2028E |