PDF 原檔:報告_Citi_南亞電8046_20260930_original.pdf
圖片清單(已驗證 2026-10-01)
| 檔名 | size | 分類 | 親眼所見內容 |
|---|---|---|---|
報告_Citi_南亞電8046_20260930_001.png |
16.4KB | — | <40KB 未逐張驗證,預設 logo/裝飾,未列 |
報告_Citi_南亞電8046_20260930_002.png |
45.8KB | 真資料圖 | NYCPB 12 個月遠期 P/E band 走勢圖(Sep21-Sep26),標示 Avg 23.1x/+1sd 34.4x/-1sd 11.8x,紅字標註 Latest PE 35.3 |
報告_Citi_南亞電8046_20260930_003.png |
50.8KB | 真資料圖 | NYCPB 12 個月遠期 P/B band 走勢圖(2005-2026),1.7x-3.7x 多檔倍數線 + ROE 疊圖 |
報告_Citi_南亞電8046_20260930_004.png |
63.9KB | 真資料圖 | NYPCB 股價走勢圖 + Bull/Base/Bear 目標價情境圖:30 Sep 26 收盤 NT$1,340 分別指向 NT$2,000/NT$1,700/NT$1,000 |
報告_Citi_南亞電8046_20260930_005.png |
112.5KB | 真資料圖 | NYPCB (8046.TW) Ratings and Target Price History 走勢圖(分析師 Jack Chen),附 13 筆評等/目標價/收盤價歷史對照表 |
報告_Citi_南亞電8046_20260930_006.png |
409.6KB | 真資料圖 | 綜合揭露圖:Samsung Electro-Mechanics(009150.KS)Ratings/TP History、Samsung Electronics(005930.KS)Ratings/TP History、NYPCB Short-Term View/Catalyst Watch History 三張走勢圖並列(分析師 Peter Lee/Jack Chen),非 NYPCB 專屬內容居多 |
報告_Citi_南亞電8046_20260930_007.png |
202.8KB | 真資料圖 | 綜合揭露圖:Samsung Electronics、Samsung Electro-Mechanics 的 Short-Term View/Catalyst Watch History 走勢圖(分析師 Peter Lee),不含 NYPCB 內容 |
006/007 為花旗標準揭露附錄圖(同時列出 Samsung Electronics/Samsung Electro-Mechanics 等覆蓋股票的評等揭露史),非針對南電(NYPCB)投資論點繪製,嵌入 lib 頁時不列為優先。
原始內容
[讀者資訊已遮蔽] citi
30 Sep 2026 08:08:20 ET │ 18 pages
NYPCB (8046.TW)
Favorable ABF and BT Trends Ahead; Buy
CITI'S TAKE
Previously, sentiment in NYCPB was damped by muted BT price hike in 4Q26, although we don't really view BT as our key investment thesis. Looking into 4Q26, we see favorable ABF/BT trend for NYPCB. For ABF, we expect stacking-up demand thanks to AI-chip production ramp with potential upsides from crowded-out demand from EMIB-T suppliers in the medium term. Meanwhile, its BT momentum seemingly tracks better-thanexpected, with robust memory demand likely offsetting smartphone weakness. Considering peers' plans of cutting BT capacity and NYPCB's full UTR in BT production lines, we don't rule out possibility of BT price hikes in upcoming quarters. Thus, we raise our earnings on better demand and price hikes and lift our DCF-based TP to NT$1,700 (30x 2027E EPS) from NT$1,600 (30x 2027E EPS). We open a 90-day upside CW, as we expect AIchip production ramp along with price hikes would drive NYPCB's monthly sales in 4Q26E.
3Q26 results preview: GM backed by both ABF and BT - We expect 3Q26E GM of 29.6% (+4.9ppt QoQ) vs consensus of 27.3%, backed by improving GM in both ABF and BT. We think BT GM expansion in this early upcycle seems to be stronger than expected, especially backed by memory demand, resulting in its current BT GM profile of close to 30% levels already (vs reaching close to 30% levels in 2H22 when the last cycle was about to end). Our 3Q26E EPS forecast is at NT$5.3, 3% higher than consensus 3Q26E forecasts.
ABF substrate: tighter supply with AI chips entering mass production - From top-down view, we expect industrywide ABF demand would see stronger momentum in 4Q26 vs 3Q26, backed by all the major AI chips entering mass production. We believe the tight ABF supply along with increase in raw material costs would trigger the ABF price hike in 4Q26E. Meanwhile, in the medium term, we think EMIB-T platform likely to consume much capacity of existing qualified vendors of ibiden, Shinko and Unimicron, which potentially would crowd out demand from other customers. Thus, we think there are likely some orders outflowing to nonEMIB-T ABF suppliers including NYPCB or Kinsus, benefiting their UTR and pricings. We currently expect NYPCB's ABF price hikes of 10-15% QoQ from 4Q26E onwards till 4Q27E.
Earnings Summary
| Year to 31 Dec | Net Profit (NT$M) | Diluted EPS (NT$) | EPS growth (%) | P/E (x) | P/B (x) | ROE (%) | Yield (%) |
|---|---|---|---|---|---|---|---|
| 2024A | 204 | 0.32 | -96.5 | na | 19.1 | 0.4 | 0.1 |
| 2025A | 1,947 | 3.01 | 855.6 | na | 18.8 | 4.3 | 0.1 |
| 2026E | 11,127 | 17.22 | 471.6 | 77.8 | 15.6 | 21.9 | 0.8 |
| 2027E | 36,741 | 56.86 | 230.2 | 23.6 | 10.1 | 52.1 | 2.5 |
| 2028E | 59,577 | 92.20 | 62.2 | 14.5 | 7.0 | 57.2 | 3.8 |
Source: Powered by dataCentral
See Appendix A-1 for Analyst Certification, Important Disclosures and Research Analyst Affiliations.
n Buy
Catalyst Watch: Upside
Price (30 Sep 26 13:30) NT$1,340.00
Target price NT$1,700.00↑
from NT$1,600.00
Expected share price return
26.9%
Expected dividend yield
0.8%
Expected total return
27.6%
Market Cap NT$865,862M US$27,202M
Price Performance (RIC: 8046.TW, BB: 8046 TT)
Jack Chen AC
+886-2-8726-9091 jack1.chen@citi.com
Laura (Chia Yi) Chen +886-2-8726-9090 laura.cy.chen@citi.com
Nicholas Lai +886-2-8726-9093
nicholas.lai@citi.com [讀者資訊已遮蔽]
30 September 2026
| Profit & Loss (NT$m) | 8046.TW: Fiscal year end 31-Dec - 2024 | 2025 | 2026E | 2027E | 2028E | Price: NT$1,340.00; TP: NT$1,700.00; - Valuation ratios | Market Cap: NT$865,862m; Recomm: Buy - 2024 | Market Cap: NT$865,862m; Recomm: Buy - 2025 | Market Cap: NT$865,862m; Recomm: Buy - 2026E | Market Cap: NT$865,862m; Recomm: Buy - 2027E | Market Cap: NT$865,862m; Recomm: Buy - 2028E |
|---|---|---|---|---|---|---|---|---|---|---|---|
| Sales revenue | 32,283 | 40,173 | 59,172 | 114,311 | 171,526 | PE (x) | na | na | 77.8 | 23.6 | 14.5 |
| Cost of sales | -31,926 | -36,526 | -43,882 | -65,705 | -92,910 | PB (x) | 19.1 | 18.8 | 15.6 | 10.1 | 7.0 |
| Gross profit | 358 | 3,647 | 15,290 | 48,606 | 78,616 | EV/EBITDA (x) | na | 96.7 | 42.4 | 16.0 | 10.1 |
| Gross Margin (%) | 1.1 | 9.1 | 25.8 | 42.5 | 45.8 | FCF yield (%) | 0.1 | 0.5 | -0.3 | -0.1 | 5.9 |
| EBITDA (Adj) | 5,167 | 8,851 | 20,227 | 54,189 | 85,000 | Dividend yield (%) | 0.1 | 0.1 | 0.8 | 2.5 | 3.8 |
| EBITDA Margin (Adj) (%) | 16.0 | 22.0 | 34.2 | 47.4 | 49.6 | Payout ratio (%) | 317 | 66 | 60 | 60 | 56 |
| Depreciation | -6,433 | -6,869 | -7,056 | -9,279 | -11,820 | ROE (%) | 0.4 | 4.3 | 21.9 | 52.1 | 57.2 |
| Amortisation | 0 | 0 | 0 | 0 | 0 | Cashflow (NT$m) | 2024 | 2025 | 2026E | 2027E | 2028E |
| EBIT (Adj) | -1,267 | 1,982 | 13,171 | 44,909 | 73,180 | EBITDA | 5,167 | 8,851 | 20,227 | 54,189 | 85,000 |
| EBIT Margin (Adj) (%) | -3.9 | 4.9 | 22.3 | 39.3 | 42.7 | Working capital | -3,425 | -2,143 | -7,393 | -13,796 | -10,464 |
| Net interest | 238 | 144 | 153 | 90 | 160 | Other | 1,470 | -36 | -2,044 | -8,168 | -13,603 |
| Associates | 23 | 2 | -9 | 25 | 29 | Operating cashflow | 3,212 | 6,672 | 10,790 | 32,224 | 60,932 |
| Non-Op/Except/Other Adj | 1,170 | 217 | 401 | 324 | 324 | Capex | -2,379 | -2,422 | -13,774 | -33,000 | -10,000 |
| Pre-tax profit | 163 | 2,346 | 13,717 | 45,348 | 73,693 | Net acq/disposals | 584 | 61 | 176 | -25 | -29 |
| Tax | 41 | -399 | -2,590 | -8,607 | -14,116 | Other | 0 | 0 | 0 | 0 | 0 |
| Extraord./Min.Int./Pref.div. | 0 | 0 | 0 | 0 | 0 Investing cashflow | -1,795 | -2,361 | -13,598 | -33,025 | -10,029 | |
| Reported net profit | 204 | 1,947 | 11,127 | 36,741 | 59,577 | Dividends paid | -3,554 | -646 | -1,292 | -6,676 | -22,045 |
| Net Margin (%) | 0.6 | 4.8 | 18.8 | 32.1 | 34.7 | Financing cashflow | -5,267 | -4,202 | -2,817 | 3,244 | -22,125 |
| Core NPAT | 204 | 1,947 | 11,127 | 36,741 | 59,577 | Net change in cash | -3,849 | 109 | -5,625 | 2,443 | 28,779 |
| Per share data | 2024 | 2025 | 2026E | 2027E | 2028E | Free cashflow to s/holders | 833 | 4,250 | -2,984 | -776 | 50,932 |
| Reported EPS ($) | 0.32 | 3.01 | 17.22 | 56.86 | 92.20 | ||||||
| Core EPS ($) | 0.32 | 3.01 | 17.22 | 56.86 | 92.20 | ||||||
| DPS ($) | 1.00 | 2.00 | 10.33 | 34.12 | 51.19 | ||||||
| CFPS ($) | 4.97 | 10.33 | 16.70 | 49.87 | 94.30 | ||||||
| FCFPS | 1.29 | 6.58 | -4.62 | 78.82 | |||||||
| ($) BVPS ($) | 70.34 | 71.38 | 85.87 | -1.20 132.27 | 190.23 | ||||||
| Wtd avg ord shares (m) | 646 | 646 | 646 | 646 | 646 | ||||||
| Wtd avg diluted shares (m) | 646 | 646 | 646 | 646 | 646 | ||||||
| Growth rates | 2024 | 2025 | 2026E | 2027E | 2028E | ||||||
| Sales revenue (%) | -23.6 | 24.4 | 47.3 | 93.2 | 50.1 | ||||||
| EBIT (Adj) (%) | -120.0 | 256.5 | 564.4 | 241.0 | 62.9 | ||||||
| Core NPAT (%) | -96.5 | 855.6 | 471.6 | 230.2 | 62.2 | ||||||
| Core EPS (%) | -96.5 | 855.6 | 471.6 | 230.2 | 62.2 | ||||||
| Balance Sheet (NT$m) | 2024 | 2025 | 2026E | 2027E | 2028E | ||||||
| Cash & cash equiv. | 8,481 | 8,590 | 2,964 | 5,408 | 34,187 | ||||||
| Accounts receivables | 6,996 | 9,552 | 15,647 | 29,398 | 40,280 | ||||||
| Inventory | 4,101 | 5,068 | 9,038 | 16,981 | 23,267 | ||||||
| Net fixed & other | 40,450 | 35,874 | 43,317 | 67,038 | 65,218 | ||||||
| tangibles Goodwill & intangibles | 0 | 0 | 0 | 0 | 0 | ||||||
| Financial & other assets | 2,910 | 2,124 | 3,089 | 4,561 | 5,736 | ||||||
| Total assets | 62,938 | 61,207 | 74,055 | 123,386 | 168,688 | ||||||
| Accounts payable | 1,518 | 1,711 | 2,308 | 3,377 | 4,676 | ||||||
| Short-term debt | 0 | 0 | 0 | 0 | 0 | ||||||
| Long-term debt | 0 | 0 | 0 | 10,000 | 10,000 | ||||||
| Provisions & other liab | 15,970 | 13,374 | 16,262 | 24,539 | 31,090 | ||||||
| Total liabilities | 17,488 | 15,085 | 18,570 | 37,916 | 45,766 | ||||||
| Shareholders' equity | 45,450 | 46,123 | 55,485 | 85,470 | 122,922 | ||||||
| interests | 0 | 0 | 0 | 0 | 0 | ||||||
| Minority Total equity | 45,450 | 46,123 | 55,485 | 85,470 | 122,922 | ||||||
| Net debt (Adj) | -8,481 | -8,590 | -2,964 | 4,592 | -24,187 | ||||||
| Net debt to equity (Adj) (%) | -18.7 | ||||||||||
| For definitions of the items in this table, | please click here. | -18.6 | -5.3 | 5.4 | -19.7 |
[讀者資訊已遮蔽] BT substrate: improving industrywide supply with sustainable memory demand - In the near term, while we do observe fading BT demand from smartphone, we also see robust memory demand likely help offset the weakness in smartphone. To note that, NYPCB's memory sales mix has increased to >60% currently from 30% in the past. Although the market was disappointed about NYPCB's muted BT price hike in 4Q26, we think its BT demand, especially from memory products, is likely to be more resilient than expected, with potential upsides in 4Q26E or 1Q27E. In the medium term, we also observe Unimicron and SEMCO (report here) are converting its BT capacity into ABF one, which would gradually benefit the industrywide BT supply side from 4Q26 onward. More meaningful outflowing BT orders would likely occur after 2Q27 with the last BT orders placed by customers to Unimicron and SEMCO.
Demand continues to build up; upward earnings revisions; Buy - We see favorable ABF/BT trend for NYPCB in the upcoming quarters. For its PCB segment (with demand mostly from non-AI applications now), it seems to be stabilizing in the past few quarters and likely sees some upsides from new applications. Thus, we raise our 2026/27/28E earnings by 2%/8%/6% to factor better demand and price hikes on supply tightness. We raise our TP to NT$1,700 (30x 2027E EPS) from NT$1,600 (30x 2027E EPS) and reiterate our Buy rating. We also open 90-day upside CW for NYPCB, as we expect AI chip production ramp along with price hikes would drive NYPCB upcoming monthly sales momentum in 4Q26E.
Figure 1. NYPCB - 3Q26 Results Preview
| (NT$mn) | 3Q26 Citi | 2Q26 Actual | Q/Q | 3Q25 Actual | Y/Y | 3Q26 Cons. | Diff. |
|---|---|---|---|---|---|---|---|
| Revenue | 16,131 | 13,575 | 19% | 10,967 | 47% | 16,335 | -1% |
| Gross profit | 4,776 | 3,360 | 42% | 1,050 | 355% | 4,459 | 7% |
| Gross margin | 29.6% | 24.7% | +4.9 ppt | 9.6% | +20.0 ppt | 27.3% | +2.3 ppt |
| Op. profit | 4,196 | 2,899 | 45% | 620 | 576% | 4,094 | 2% |
| OP margin | 26.0% | 21.4% | +4.7 ppt | 5.7% | +20.4 ppt | 25.1% | +0.9 ppt |
| Net income | 3,440 | 2,262 | 52% | 725 | 375% | 3,452 | 0% |
| EPS (NT$) | 5.32 | 3.50 | 52% | 1.12 | 375% | 5.19 | 3% |
© 2026 Citigroup Inc. No redistribution without Citigroup's written permission.
Source: Citi Research Estimates, Bloomberg, Company reports [讀者資訊已遮蔽]
Figure 2. NYCPB - Earnings Revisions
| (NT$mn) | 3Q26E - New | 3Q26E - Old | 3Q26E - Chg. | 4Q26E - New | 4Q26E - Old | 4Q26E - Chg. | 2026E - New | 2026E - Old | 2026E - Chg. | 2027E - New | 2027E - Old | 2027E - Chg. | 2028E - New | 2028E - Old | 2028E - Chg. |
|---|---|---|---|---|---|---|---|---|---|---|---|---|---|---|---|
| Sales | 16,131 | 16,197 | 0% | 18,289 | 18,005 | 2% | 59,172 | 58,955 | 0% | 114,311 | 108,538 | 5% | 171,526 | 166,798 | 3% |
| Sequential growth (%) | 19% | 19% | 13% | 11% | 47% | 47% | 93% | 84% | 50% | 54% | |||||
| Gross profit | 4,776 | 4,738 | 1% | 5,383 | 5,248 | 3% | 15,290 | 15,117 | 1% | 48,606 | 44,627 | 9% | 78,616 | 73,299 | 7% |
| Opex | 581 | 583 | 0% | 658 | 648 | 2% | 2,119 | 2,111 | 0% | 3,697 | 3,508 | 5% | 5,436 | 5,287 | 3% |
| Operating profit | 4,196 | 4,155 | 1% | 4,724 | 4,600 | 3% | 13,171 | 13,006 | 1% | 44,909 | 41,119 | 9% | 73,180 | 68,012 | 8% |
| Pre-tax profit | 4,301 | 4,253 | 1% | 4,842 | 4,711 | 3% | 13,717 | 13,537 | 1% | 45,348 | 41,476 | 9% | 73,693 | 68,442 | 8% |
| Net income | 3,440 | 3,487 | -1% | 4,116 | 3,863 | 7% | 11,127 | 10,920 | 2% | 36,741 | 34,010 | 8% | 59,577 | 56,122 | 6% |
| EPS (NT$) | 5.32 | 5.40 | -1% | 6.37 | 5.98 | 7% | 17.22 | 16.90 | 2% | 56.86 | 52.63 | 8% | 92.20 | 86.85 | 6% |
| Gross margin (%) | 29.6% | 29.2%+0.4 | ppt | 29.4% | 29.1%+0.3 | ppt | 25.8% | 25.6%+0.2 | ppt | 42.5% | 41.1% | +1.4 ppt | 45.8% | 43.9% | +1.9 ppt |
| Opex ratio (%) | 3.6% | 3.6%+0.0 | ppt | 3.6% | 3.6%-0.0 | ppt | 3.6% | 3.6%+0.0 | ppt | 3.2% | 3.2%+0.0 | ppt | 3.2% | 3.2%-0.0 | ppt |
| Operating margin (%) | 26.0% | 25.6%+0.4 | ppt | 25.8% | 25.5%+0.3 | ppt | 22.3% | 22.1%+0.2 | ppt | 39.3% | 37.9% | +1.4 ppt | 42.7% | 40.8% | +1.9 ppt |
| Net margin (%) | 21.3% | 21.5% | -0.2 ppt | 22.5% | 21.5% | +1.1 ppt | 18.8% | 18.5%+0.3 | ppt | 32.1% | 31.3%+0.8 | ppt | 34.7% | 33.6% | +1.1 ppt |
© 2026 Citigroup Inc. No redistribution without Citigroup's written permission.
Source: Citi Research Estimates
Figure 3. NYCPB - Forecast Summary
| NYPCB - (NT$ in Mn, year-end Dec) | 1Q | 2026 - 2Q | 2026 - 3Q E | 4Q E | 1QE | 2QE | 3Q E | 2027 - 4Q E | 2027 - 2018 | 2019 | 2020 | 2021 | 2022 | 2023 | 2024 | 2025 | 2026E | 2027E | 2028E |
|---|---|---|---|---|---|---|---|---|---|---|---|---|---|---|---|---|---|---|---|
| Revenue | 11,177 | 13,575 | 16,131 | 18,289 | 22,963 | 26,681 | 30,306 | 34,360 | 28,833 | 31,094 | 38,513 | 52,228 | 64,647 | 42,253 | 32,283 | 40,173 | 59,172 | 114,311 | 171,526 |
| COGS | -9,406 | -10,216 | -11,354 | -12,906 | -14,332 | -15,517 | -16,832 | -19,024 | -28,483 | -29,467 | -32,761 | -37,346 | -38,779 | -34,075 | -31,926 | -36,526 | -43,882 | -65,705 | -92,910 |
| Gross Profit | 1,771 | 3,360 | 4,776 | 5,383 | 8,631 | 11,164 | 13,474 | 15,337 | 349 | 1,627 | 5,752 | 14,883 | 25,868 | 8,177 | 358 | 3,647 | 15,290 | 48,606 | 78,616 |
| Operating Expense | -419 | -460 | -581 | -658 | -781 | -907 | -909 | -1,100 | -1,535 | -1,555 | -1,644 | -2,012 | -2,293 | -1,847 | -1,624 | -1,665 | -2,119 | -3,697 | -5,436 |
| SG&A expenses | -419 | -460 | -581 | -658 | -781 | -907 | -909 | -1,100 | -1,535 | -1,555 | -1,644 | -2,012 | -2,293 | -1,847 | -1,624 | -1,665 | -2,119 | -3,697 | -5,436 |
| R&D expenses | 0 | 0 | 0 | 0 | 0 | 0 | 0 | 0 | 0 | 0 | 0 | 0 | 0 | 0 | 0 | 0 | 0 | 0 | 0 |
| EBIT | 1,352 | 2,899 | 4,196 | 4,724 | 7,851 | 10,257 | 12,565 | 14,237 | -1,186 | 71 | 4,108 | 12,871 | 23,575 | 6,330 | -1,267 | 1,982 | 13,171 | 44,909 | 73,180 |
| Net Interest Income | 34 | 41 | 39 | 39 | 15 | 15 | 30 | 30 | 5 | 50 | 37 | 14 | 114 | 308 | 238 | 144 | 153 | 90 | 160 |
| Net Other Income | 212 | 35 | 66 | 79 | 91 | 91 | 76 | 91 | 597 | 264 | -142 | 210 | 1,673 | 469 | 1,192 | 219 | 392 | 349 | 353 |
| Pre-Tax Profit | 1,598 | 2,976 | 4,301 | 4,842 | 7,957 | 10,362 | 12,671 | 14,358 | -584 | 385 | 4,003 | 13,095 | 25,362 | 7,107 | 163 | 2,346 | 13,717 | 45,348 | 73,693 |
| Tax | 290 | 714 | 860 | 726 | 1,432 | 2,487 | 2,534 | 2,154 | 0 | -77 | -337 | -2,514 | -5,946 | -1,290 | 41 | -399 | -2,590 | -8,607 | -14,116 |
| Net Profit | 1,309 | 2,262 | 3,440 | 4,116 | 6,525 | 7,875 | 10,137 | 12,204 | -584 | 308 | 3,666 | 10,582 | 19,416 | 5,817 | 204 | 1,947 | 11,127 | 36,741 | 59,577 |
| EPS (NT$) | 2.03 | 3.50 | 5.32 | 6.37 | 10.10 | 12.19 | 15.69 | 18.89 | -0.90 | 0.48 | 5.67 | 16.38 | 30.05 | 9.00 | 0.32 | 3.01 | 17.22 | 56.86 | 92.20 |
| Revenue breakdown (%) | |||||||||||||||||||
| PCB | 6% | 9% | 9% | 10% | 5% | 5% | 6% | 6% | 34% | 31% | 25% | 19% | 14% | 17% | 21% | 14% | 9% | 5% | 4% |
| PP | 29% | 28% | 31% | 28% | 24% | 22% | 21% | 20% | 32% | 29% | 29% | 31% | 27% | 22% | 30% | 29% | 29% | 21% | 16% |
| FC | 64% | 62% | 60% | 62% | 72% | 73% | 74% | 75% | 33% | 41% | 46% | 50% | 58% | 62% | 49% | 57% | 62% | 73% | 80% |
| Margins (%) | |||||||||||||||||||
| Gross Margin | 15.8 | 24.7 | 29.6 | 29.4 | 37.6 | 41.8 | 44.5 | 44.6 | 1.2 | 5.2 | 14.9 | 28.5 | 40.0 | 19.4 | 1.1 | 9.1 | 25.8 | 42.5 | 45.8 |
| Operating Margin | 12.1 | 21.4 | 26.0 | 25.8 | 34.2 | 38.4 | 41.5 | 41.4 | -4.1 | 0.2 | 10.7 | 24.6 | 36.5 | 15.0 | -3.9 | 4.9 | 22.3 | 39.3 | 42.7 |
| Net Margin | 11.7 | 16.7 | 21.3 | 22.5 | 28.4 | 29.5 | 33.4 | 35.5 | -2.0 | 1.0 | 9.5 | 20.3 | 30.0 | 13.8 | 0.6 | 4.8 | 18.8 | 32.1 | 34.7 |
| Sequential Growth (%) | |||||||||||||||||||
| Revenue | 0.1 | 21.5 | 18.8 | 13.4 | 25.6 | 16.2 | 13.6 | 13.4 | 8.3 | 7.8 | 23.9 | 35.6 | 23.8 | -34.6 | -23.6 | 24.4 | 47.3 | 93.2 | 50.1 |
| Gross Profit | 26.7 | 89.7 | 42.2 | 12.7 | 60.4 | 29.3 | 20.7 | 13.8 | n.m. | 365.5 | 253.6 | 158.7 | 73.8 | -68.4 | -95.6 | 919.6 | 319.2 | 217.9 | 61.7 |
| EBIT | 40.4 | 114.4 | 44.7 | 12.6 | 66.2 | 30.6 | 22.5 | 13.3 | n.m. | n.m. | 5659.7 | 213.3 | 83.2 | -73.1 | n.m. | n.m. | 564.4 | 241.0 | 62.9 |
| Net Profit | 8.9 | 72.8 | 52.1 | 19.6 | 58.5 | 20.7 | 28.7 | 20.4 | n.m. | n.m. | 1089.4 | 188.6 | 83.5 | -70.0 | -96.5 | 855.6 | 471.6 | 230.2 | 62.2 |
| EPS | 8.9 | 72.8 | 52.1 | 19.6 | 58.5 | 20.7 | 28.7 | 20.4 | n.m. | n.m. | 1089.4 | 188.6 | 83.5 | -70.0 | -96.5 | 855.6 | 471.6 | 230.2 | 62.2 |
© 2026 Citigroup Inc. No redistribution without Citigroup's written permission.
Source: Citi Research Estimates, Company Reports [讀者資訊已遮蔽]
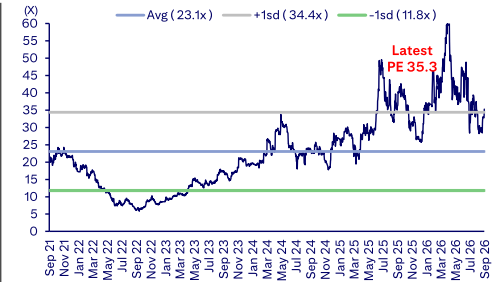
Figure 4. NYCPB - 12M Forward P/E Band on BBG consensus Figure 5. NYCPB - 12M Forward P/B Band
© 2026 Citigroup Inc. No redistribution without Citigroup's written permission. Source: Citi Research, Bloomberg
© 2026 Citigroup Inc. No redistribution without Citigroup's written permission. Source: dataCentral, Citi Research
Companies Mentioned:
NYPCB (8046.TW; NT$1340.0; 1; 30 Sep 26; 13:30) Ibiden (4062.T; ¥11030.0; 1; 30 Sep 26; 15:30) Kinsus Interconnect Technology (3189.TW; NT$970.0; 1; 30 Sep 26; 13:30) Samsung Electro-Mechanics (009150.KS; W1528000.0; 1; 29 Sep 26; 15:45) Samsung Electronics (005930.KS; W272500.0; 1; 29 Sep 26; 15:45) Unimicron (3037.TW; NT$1175.0; 1; 30 Sep 26; 13:30)
[讀者資訊已遮蔽]
Adding Upside 90-Day Catalyst Watch on NYPCB (8046.TW)
Direction:
Duration:
Catalyst:
Upside
Within 90 Days Earnings
We expect AI chip production ramp along with price hikes would drive NYPCB's upcoming monthly sales momentum in 4Q26.
[讀者資訊已遮蔽]
Bull/Bear: NYPCB (8046.TW)
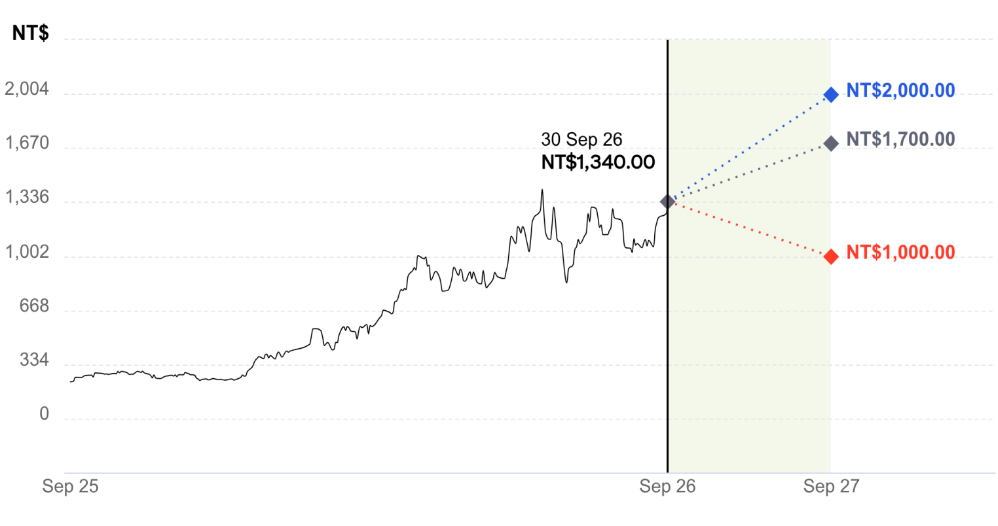
Spread 75pp
Current Price and expected returns (upside/downside) as of 30 Sep 2026
BULL Assumptions
- Higher-than-expected ABF shortage to boost pricing and margins
- Market share gains for new ABF/BT projects
BASE Assumptions
- +47%/+93% revenue growth for 2026E/27E
- 25.8%/42.5% GM and +22.3%/+39.3% OPM for 2026E/27E
BEAR Assumptions
- US entity list impact more than expected
- Weaker traditional PCB demand
- Lower-than-expected margins
[讀者資訊已遮蔽]
NYPCB
(8046.TW; NT$ 1340.0; 1; 30 Sep 26; 13:30)
Company description
Established in 1997, Nan Ya Printed Circuit Board (NYPCB) is a technology subsidiary of the Formosa Plastics Group. Nan Ya PCB's main products include conventional PCB, HDI, Flip Chip substrate (FCBGA and FCCSP), Wire Bond Substrate, etc. The company has manufacturing sites in Taiwan and Kunshan, China.
Investment strategy
We rate NYPCB shares as Buy. We believe ABF/BT should see a solid recovery in 2026 on robust AI demand: 1) NYPCB is the purest ABF play with a significant earnings turnaround, driven by growing chip sizes and layer counts for AI ASIC/networking; and 2) the BT business should benefit from price hikes on rising memory demand and T glass shortage. Considering T glass support from NYPCB's parent company, we believe NYPCB would have a better chance to win additional AI ASIC/networking business going forward.
Valuation
Our DCF-based TP for NYPCB is NT$1,700. With a risk-free rate of 5.00% (10year government bond rate), a market risk premium of 7% and an equity beta of 1.22 (YTD weekly share price), we calculate NYPCB's WACC as 13.4%. Our TP is equivalent to 30x/13x 2027E EPS/BVPS, which reflects its high P/E multiple during upcycles. NYPCB traded at 15-20x P/E during its 2003-2008 upcycle driven by PC/NB demand strength. In 2010-11 when the market was recovering from the global financial crisis, NYPCB traded at 25-35x P/E. In the last 2019-22 upcycle when ABF was in shortage, NYPCB traded at 30-40x P/E.
Risks
Key downside risks that could prevent the NYPCB shares from reaching our target price include: 1) weaker-than-expected ABF demand from key customers; 2) BT business seasonality weakness and fewer-than-expected price hikes; and 3) severe T glass shortages that cause a bottleneck to its production.
[讀者資訊已遮蔽] If you are visually impaired and would like to speak to a Citi representative regarding the details of the graphics in this document, please call USA 1-888-500-5008 (TTY: 711), from outside the US +1-210-677-3788