PDF 原檔:報告_Aletheia_旺矽6223_20260610_original.pdf
原始內容
MPI Corp
Al#Semiconductor#AdvancedPackaging
Price: TWD 5,885
Angus Lin
+852 9250 7088
angus.lin@aletheia-capital.com
Warren Lau
+852 9181 4766
warren.lau@aletheia-capital.com
MPI Corp
| Bloomberg | 6223 TT |
|---|---|
| RIC | 6223. TW |
| Market cap (USDbn) | 18.2 |
| Average daily T/O (USD]m) | 175 |
MPI Key Reports
Initiation (2025/10/13) Yours to Discover TP raise (2026/03/11) Into the Light Latest results note (2026/05/14) Solid 1Q
Target Price: TWD 10,000
Upside: 70%
Massive Probing Imperative
Massive wafer probing demand is driving increasingly severe supply constraints across the probe card industry, prompting the leading vendors (TechnoProbe & FormFactor) to target 2x pin capacity within the next two years. We believe MPI may need to expand even more meaningfully-potentially by 4x-to keep pace with demand from Al ASICs, Al networking ICs, and inference CPUs. Notably, major Al/HPC customers are securing vertical MEMS probe card capacity at premium ASP, in some cases paying 50%+ above the average, indicating that highend vertical-MEMS probe cards have become scarce strategic assets, similar to leading-edge front-end packaging capacity. MPI is gaining share via its complete probe card portfolio and rising PCB insourcing ratio, strengthening both customer attachment and margin profile. With that, we raise our FY26E-28E EPS by 20-60% to be 20-50% above consensus and raise our TP to NT$10,000 (35x 2028E PER) from NT$4,000 (35x 2027E PER). Given the rapid growth (EPS up 3.5x in three years), expanded TAM & client portfolio, we include MPI in our Alpha Portfolio.
Vertical MEMS probe card supply constraints
TSMC plans to accelerate capacity expansion significantly across advanced nodes (N3, N2, A16, A14) over the next two years, adding 70k/150k/200kwpm in CY26E-28E. This will drive substantial demand for wafer probing nine months post the WFE installation, hence massive and accelerating probing demand into CY28E beyond. We believe that MPI will have to expand its vertical MEMS pin capacity by 4x in CY25-28E, outpacing global peers, that is, TechnoProbe (>2x) and FormFactor (<2x). MPI is the go-to supplier for vertical MEMS probe cards for Al ASICs (particularly sub-dies & 1/0 dies; and increasingly main compute dies), Al networking ICs, and inference-oriented CPUs thanks to its full-stack probe card capability (PCB+MLO+PH), whereas most competitors mainly supply sub-components.
Massive pin-consuming projects pouring in
We expect a series of new drivers for MPI: (1) AMD's PC & server CPU probe card with demand sized equivalent to MPI's FY25 full-year probe card revenue; (2) a meaningful share gain in Vera CPUs; (3) substantially higher probe card demand (~3x) from AVGO v8 & V9 TPU vS V7 TPU; (4) growing networking probe card demand from Mellanox, Marvell, and ALAB; (5) a custom ASIC project with 60k-pin probe card (main dies, sub dies, 1/0 dies); and (6) a sizeable demand from a key Chinese customer. MPI may be fully loaded across its VPC/MEMS and CPC platforms (OLED DDI), hence we raise our FY26E-28E EPS by c.20-60%. Our forecast is based on customer projects and may differ from reported revenue timing due to revenue recognition schedules.
Progressing in CPO with broader Al/HPC customer base
MPI is in the process of mass production qualification of its CPO test systems for insertions #2 for Nvidia and #3 for Marvell and an Austin GPU company but has received positive feedback at foundry/OSAT site. We still view that the initial CPO prober TAM (excl. testers) will be >NT$10bn during 2H26-2027, which MPI can address. Based on current engineering orders and early customer demand, we expect MPI's equipment revenue will grow 30%/102%/73% in FY26E/ 27E/ 28E. We estimate that every NT$1bn of CPO revenue could translate into NT$4-5 of EPS for MPI.
KEY FINANCIAL AND VALUATION MATRIX
| FYE Dec (TWD mn) FY22A | FY23A | FY24A | FY25A | FY26E | FY27E | FY28E | |
|---|---|---|---|---|---|---|---|
| Revenues | 7,412 | 8,147 | 10,172 | 13,371 | 24,000 | 53,433 | 76,274 |
| Op. Profit | 1,250 | 1,471 | 2,483 | 3,775 | 8,510 | 20,839 | 32,174 |
| Net Profit | 1,219 | 1,312 | 2,301 | 3,177 | 7,360 | 17,579 | 27,005 |
| FD EPS (NT$) | 12.8 | 13.8 | 24.4 | 33.4 | 78.1 | 186.5 | 286.5 |
| Consensus EPS (NT$) | 62.5 | 123.3 | 224.5 | ||||
| PER (X) | 403.8 | 373.5 | 212.1 | 154.5 | 66.1 | 27.7 | 18.0 |
| PBR (X) | 71.4 | 64.3 | 52.4 | 33.7 | 24.6 | 14.9 | 9.8 |
| Dividend Yield (%) | 0.1 | 0.1 | 0.1 | 0.3 | 0.4 | 0.9 | 2.0 |
| ROE (%) | 18.8 | 18.1 | 27.2 | 26.6 | 42.8 | 66.9 | 65.6 |
| ROA (%) | 11.7 | 11.2 | 15.9 | 15.7 | 26.9 | 45.6 | 48.7 |
10 June 2026 Technology Hardware Taiwan
a Portfolio
Total return: 72%
Risk: High
MPI Corp
Massive Probing Imperative
TSMC's monstrous multi-year capex driving advanced probe card cycles
TSMC's aggressive front-end capacity expansion a key underlying driver
TSMC has been increasingly aggressive about capacity expansion, and we expect the new addition of its advanced nodes (<N5) to be 70k/150k/200k in CY26E /27E/28E. Total capacity for advance nodes will grow to 750k exiting CY28E, from 325k last year, 2.3x in three years.
Its back-end capacity expansion will be even faster. We believe TSMC plans to grow its annual CoWoS wafer capacity by ~80%/50% to 1.15m/1.73m in CY26E/27E, followed by an earlier ramp of CoPoS by end-CY27E/1H28E; this is two to four quarters ahead of the original schedule. It will repurpose some of its 8-inch fab for interposer manufacturing to accommodate the growing demand. SolC capacity is also expected to grow to 20/40/80kwpm ending CY26E/27E/28E from <10kwpm now.
We believe this aggressive expansion is driven by not only the existing Al GPUs, HBM base die, networking & ASICs but more recently, agentic Al devices such as CPU (x86 and Arm), DSP and
FIGURE 1: PROJECTIONS FOR TSMC'S ADVANCED CAPACITY EXPANSION PLAN
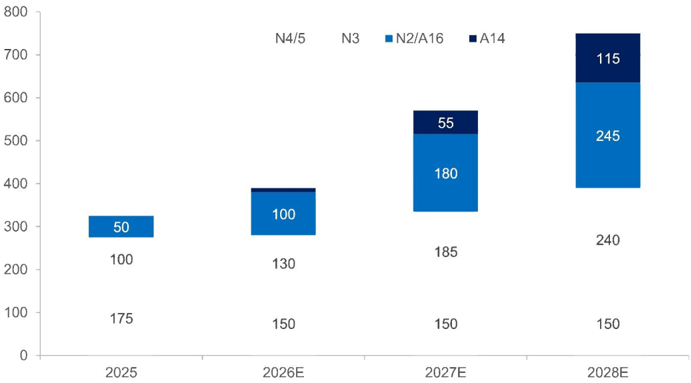
Source: Aletheia/TAG
Against the backdrop of TSMC's aggressive front-end capacity expansion, with nearly 80% of incremental leading-edge capacity additions scheduled for CY27E/28E (Figure 2), we expect the WFE investment cycle to peak in CY27E and remain elevated through CY28E.
This should translate into a favorable back-end equipment cycle, given the typical lag between front-end WFE investment and back-end demand. We estimate it takes roughly three months for WFE installation, followed by another five or six months for wafer production ramp, implying about a 9-10-month lag from WFE procurement to wafer probing
As a result, we expect demand for testing equipment-including both wafer probing and final test-to accelerate meaningfully and peak no earlier than CY28E-29E.
MPI Corp Massive Probing Imperative
CAPITAL
FIGURE 2: PROJECTION FOR TSMC'S ADVANCED CAPACITY EXPANSION PLAN IN TERMS OF PHASES
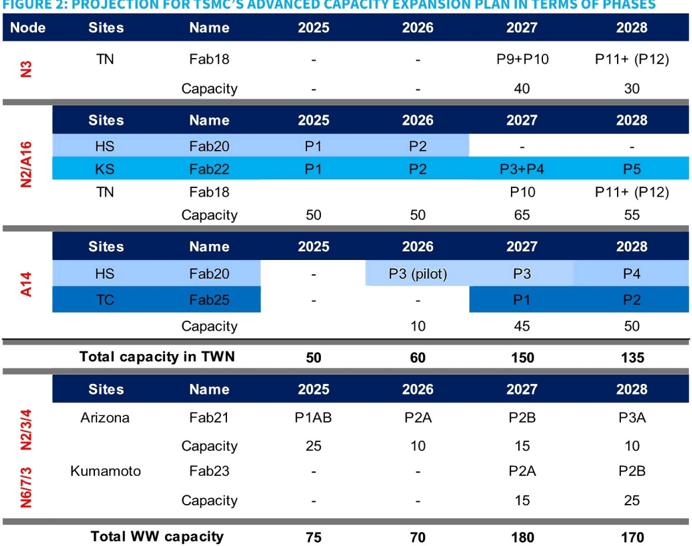
| Sites | Name | 2025 | 2026 | 2027 | 2028 | |
|---|---|---|---|---|---|---|
| TN | Fab18 | P9+P10 | P11+ (P12) | |||
| TN | Capacity | 40 | 30 | |||
| Sites | Name | 2025 | 2026 | 2027 | 2028 | |
| N2/A16 | HS | Fab20 | P1 | P2 | ||
| N2/A16 | KS | Fab22 | P1 | P2 | P3+P4 | P5 |
| N2/A16 | TN | Fab18 Capacity | 50 | 50 | P10 65 | P11+ (P12) 55 |
| Sites | Name | 2025 | 2026 | 2027 | 2028 | |
| HS | Fab20 | P3 (pilot) | P3 | P4 | ||
| Fab25 | P1 | P2 | ||||
| Capacity | 10 | 45 | 50 | |||
| Total capacity in TWN | 50 | 60 | 150 | 135 | ||
| Sites | Name | 2025 | 2026 | 2027 | 2028 | |
| N2/3/4 | Arizona | Fab21 | P1AB | P2A | P2B | РЗА |
| N2/3/4 | Arizona | Capacity | 25 | 10 | 15 | 10 |
| N6/7/3 | Kumamoto | Fab23 | P2A | P2B | ||
| N6/7/3 | Kumamoto | Capacity | 15 | 25 | ||
| Total WW capacity | 75 | 70 | 180 | 170 |
Note: Capacity figure is expressed in '000 wpm. Source: Aletheia/TAG
Global leading probe card vendors to scale up pin capacity aggressively
Technoprobe (TPRO IM) and FormFactor (FORM US) are widely regarded as the two leading probe card vendors in advanced vertical MEMS technology. We view MPI as their closest challenger among probe card suppliers in narrowing the technology gap with these incumbents (from pseudo-MEMS to advanced MEMS).
All three companies are pursuing aggressive capacity expansion plans over the next two to three years, reflecting the continued growth of the Al GPU and HPC ecosystem, which remains the primary driver of advanced MEMS probe card development. Al GPUs have long required the most advanced vertical MEMS probe cards, with Technoprobe historically holding a leading position at TSMC for these applications.
Historically, custom ASICs typically trailed GPUs by roughly two to three process nodes, resulting in lower performance, bandwidth, and power-density requirements that could be adequately served by mid-tier MEMS probe solutions. However, that paradigm is rapidly changing. As custom ASICs migrate to advanced nodes such as N3 and beyond, with substantially higher transistor density, larger die complexity, faster 1/0 speeds, and increasing power density, their probe card requirements are increasingly converging with those of Al GPUs.
We believe this transition is one of the key structural drivers behind the sharp increase in demand for advanced vertical MEMS probe cards, benefiting leading suppliers such as Technoprobe, FormFactor, and increasingly MPI.
TechnoProbe announced a plan to double capacity by the end of 2028, and this has been meaningfully pulled forward to 1Q 2027. In their recently published Q1 results, TechnoProbe stated they are running well ahead of schedule. They will achieve a doubling of capacity run rates in an 18-month timeframe-from the initial announcement in Q4 2025 to completion in Q1 2027. Despite historical hesitation driven by massive exposure to Apple via TSMC and the delayed hand-off to Nvidia outgrowing Apple in mid-2025, TechnoProbe has now massively
MPI Corp
Massive Probing Imperative
FIGURE 4: NVIDIA HOPPER GPU
accelerated investments, bolstered by a strong balance sheet holding approximately $600mn in cash. We do not exclude the possibility that its doubled capacity will be completely full by Q1 2027 and that it will likely have to announce another doubling of capacity within the next six months.
FormFactor was historically conservative during market down cycles, especially due to a disastrous logic business heavily over-indexed to Intel. The company recently performed very well due to HBM exposure; hence it announced a major capacity expansion involving the purchase of a facility in Texas. While exact numbers are opaque, we estimate this represents close to a doubling of capacity.
MPI has been planning on doubling its vertical MEMS capacity by end-CY26E versus end-ofCY25. Based on customer pin demand and our check with OSATs, we believe MPI may need to scale up further by as much as 4x vertical MEMS pin capacity over the next two years vs end-CY25.
Complexity adds new insertions and extends CP test times
Figure 3 below shows our current view of the testing process for CoWoS chips. The expansion of heterogenous chiplet architecture used in CoWos advanced packaging and the expanding reticle size of chips are driving more front-end testing to minimize scrap costs and mitigate overall system risks. For example, partial-assembly tests mentioned earlier effectively shift some test steps from final tests to CoW tests, driving up substantial demand for wafer probing and its testing variant (that is, CPO insertion #2 and #3).
FIGURE 3: TESTING PROCESS FOR COWOS CHIPS
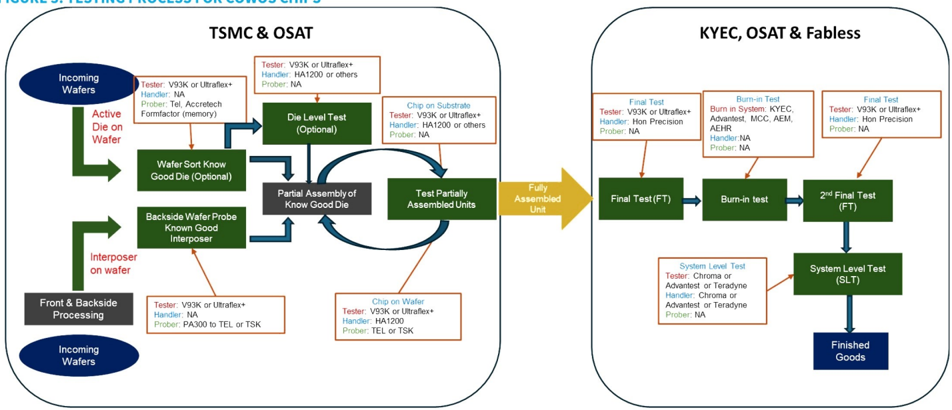
Note: *Here we focus more on Nvidia, but manufacturers can be interchangeable - this is only an estimated flow chart Source: Aletheia/TAG
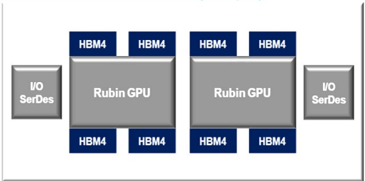
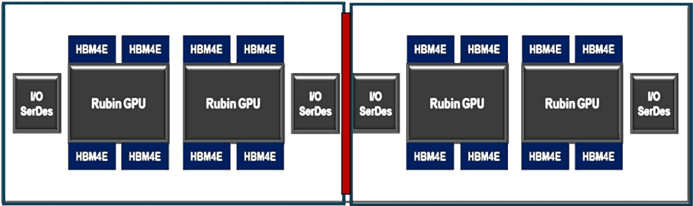
The following schematic diagrams represent the evolution of Nvidia Al chips, which have significantly increased in chiplets and reticle size.
FIGURE 5: NVIDIA BLACKWELL GPU (2024-26)
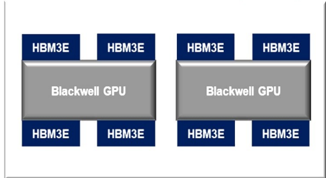
FIGURE 6: NVIDIA RUBIN GPU (2026/27)
MPI Corp
Massive Probing Imperative
Note: Not to scale Source: Aletheia/TAG
CAPITAL
FIGURE 7: TOPOLOGY OF RUBIN ULTRA GPU [BLOCK IN RED REPRESENTS STICTCHING]
Source: Aletheia/TAG
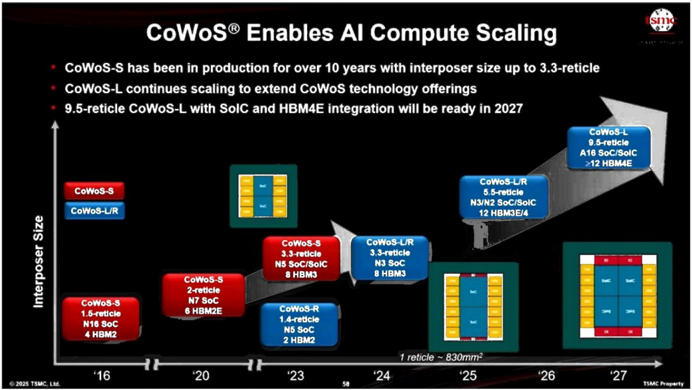
FIGURE 8: TSMC'S COWOS PACKAGING ROADMAP
Source: TSMC
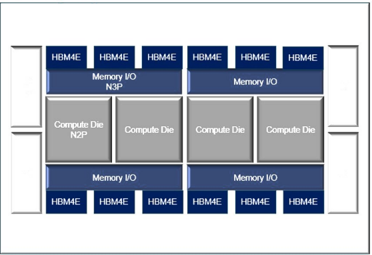
Increasing reticle size allows more chiplets to be attached on top of the interposer. Compared to Blackwell, Rubin separates the 1/0 functions from the GPU compute die to increase processing speeds. However, this introduces two newer types of wafers (one is the N3 wafer and the other is the N4 wafer) and therefore two additional wafer-sort testing processes, because both 1/0 dies have different designs using different process nodes. Therefore, compared to Blackwell, which only needs wafer sort for one type of Blackwell wafer, Rubin will need three different test stations with three different probe cards for three wafer types. While the two I/O dies are smaller than the Rubin GPU (therefore they will take less time), we estimate the total testing time spent on all three wafers to complete wafer sorts for Rubin could be 1.7-1.8x higher versus Blackwell. This means the demand for testing capacity would increase accordingly, if not more.
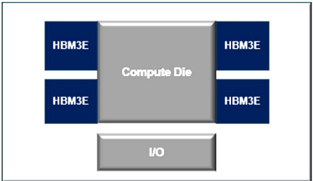
The increase in the types of wafers also increases for ASICs, as shown in the following figure, where we expect AWS, Google and Meta to begin adopting three to four different types of wafers for their chiplet architecture starting in 2026-28. These are all driving up massive probe card consumptions as more type of wafers to be probed.
MPI Corp
Massive Probing Imperative
FIGURE 9: TOPOLOGY OF ZEBRA TPU (2027) AND HUMUFISH (2028)
Source: Aletheia/TAG
FIGURE 10: SPECIFICATIONS OF SELECTED AI GPU & ASIC DEVICES
| nVidia | HVM | Architecture | Packaging | Logic core | Based die | 1/0 | Types of wafers | |
|---|---|---|---|---|---|---|---|---|
| Hopper GPU | Mid-22 | Monolithic | CoWos-s | 1x N4 | ||||
| Blackwell GPU | Mid-24 | Dual-monolithic | CoWoS-L | 2x N4P | ||||
| Grace CPU | Mid-21 | Monolithic | 1x N4 | |||||
| Rubin GPU | Mid-26 | Hete-Chiplet | CoWoS-L | 2x N3 | 1x N3+1x N4 | 3 | ||
| Vera CPU | Mid-26 | Hete-Chiplet | CoWoS-R | 1x N3 | 4x N3+1x N4 | 3 | ||
| Feynman GPU | Mid-28 | Hete-Chiplet | CoWoS-L+SoIC | 4-8x A16 | 2-4x A16 | 4xN3 | ||
| Google - TPU | HVM | Architecture | Packaging | Logic core | 1/0 | ASIC partners | Types of wafers | |
| Trillium (V6) | 4Q24 | Hete-Chiplet | CoWoS-s | 1XN5 | 1XN7 | AVGO | 2 | |
| GhostFish? (V7p) | 4Q25 | Hete-Chiplet | CoWoS-S | 2XN3E | 1xN5 | AVGO | ||
| SunFish (V8ax) | 1H26 | Hete-Chiplet | CoWoS-S | 2XN3P | 1XN4P | AVGO | ||
| ZebraFish (V8x) | 4Q26 | Hete-Chiplet | CoWos-S | 1xN3 | 1xN6 | GOOG/MTK | 2 | |
| HumuFish (V9x) | 4Q27 | Hete-Chiplet | COWOS-L | 4xN2 | 4xN3+4xN3 | GOOG/MTK | 3 | |
| TBD (V9ax)' | 2027 | Hete-Chiplet | CoWoS-L | N2 | N3 | AVGO | ||
| META | HVM | Architecture | Packaging Logic core | Base die | 1/0 | SolC | Types of wafers | |
| MTIA 1/1.5 | 2023/24 | Monolithic | 1x N7 | - | ||||
| MTIA 2 | 2H24/25 | Monolithic | 1x N5 | - | ||||
| MTIA 3 | 2H26 | Hete-Chiplet | CoWoS-S | 1x N3 | 2x N4 | 2 | ||
| MTIA 41 | 2027 | Hete-Chiplet | NA | NA | NA | NA | NA | NA |
| MTIA 5 | 2028 | Hete-Chiplet | CoWoS-L | 16x N2 | N2 or N3 | Yes | 4 | |
| AWS | HVM | Architecture | Packaging | Logic core | Logic core | 1/0 | Solc | Types of wafers |
| Trainium 1 | 2023/24 | Monolithic | 1x N7 | 1x N7 | ||||
| Trainium 2 | 2H24/25 | Dual-monolithic | CoWoS-R | 2x N5 | 2x N5 | |||
| Trainium 3 | Mid-26 | Dual-monolithic | CoWoS-R | 2x N3 | 2x N3 | |||
| Trainium 4 | 2027 | Hete-Chiplet | CoWoS-L | 4x N2 | 4x N2 | 1x N3 | Yes | 3 |
Note: 1-details to be determined or not available at the time of writing. 2-or known as Ironwood Source: Aletheia/TAG (as of February 2026)
CAPITAL
Massive Probing Imperative
Agentic Al driving CPU testing demand
[This section is an excerpt from our recent Al Opportunities-CPU report, published on 29 March]
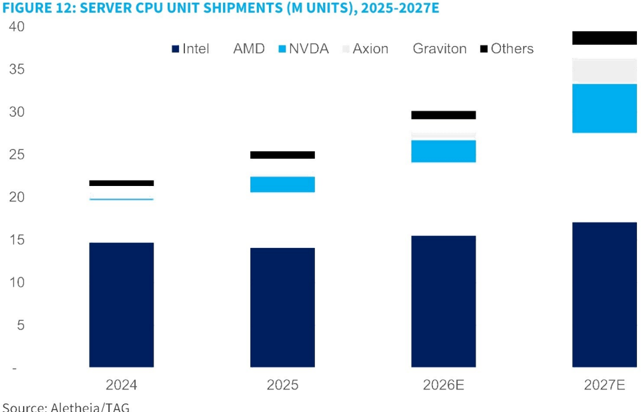
We estimate the total server CPU market amounted to ~25m units in 2025, with 80% of the total being x86-based CPUs. We are anticipating ~20% YoY unit growth for this year to bring the market to 30m. The volume could be higher if there is no supply constraint. Arm-based CPUs, especially Google's Axion2 and NVDA's Grace/Vera, have phenomenal growth, partially driven by the attachments with GPUs and TPUs. We expect AMD to grow its units by 30%+ YoY, driven by strong demand from its CSP customers. Intel, unfortunately, suffered from its capacity constraint and was down YoY in 1Q26E despite strong demand, but the company expects a comeback starting 2Q26E. Net-net, we estimate x86 will continue to have an 80% share of the units s in 2026E.
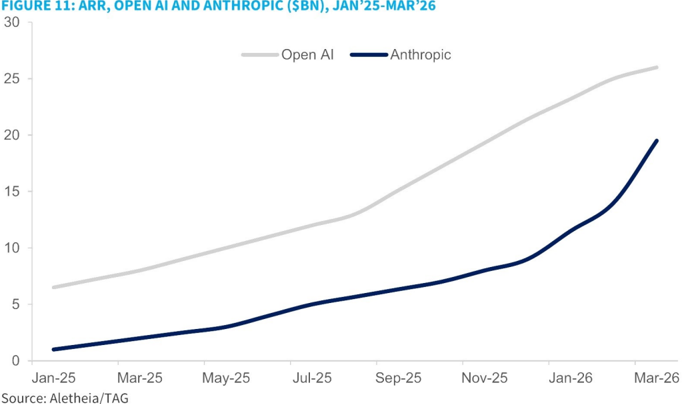
We are just in the first year of agentic Al in 2026E. Compared with Al infrastructure investment in the past three years, the key difference now is that agentic Al can generate income. Anthropic is the best case. While its ARR growth in 2025 was already exponential from $1b in January 2025 to $9b exiting the year, it has further doubled in just three months to an estimated $19-20b in March 2026, driven mainly by its Claude Opus 4.6. Open Al, which is more consumer-centric, was growing at a slower pace but has still expanded its ARR by threefold from <$7b at the beginning of 2025 to $21b exiting the year. It has also grown its ARR by $5b in 1Q26 to $26b now. Combined ARR growth was $23b in 2025, but it has already reached $15b in just one quarter this year. Its ARR would have grown even faster if there had been enough compute power.
It is always difficult to pinpoint a CAGR for a longer-term timeframe, say, three to five years. But several signs make us believe that the unit growth for CPU units will be even stronger in 2027E than this year. We are modelling 30%+ YoY CPU unit growth in 2027E, with it mainly coming from Nvidia, Axion (Google), and AMD. At its "Arm everywhere" event, Arm also guided for its data center CPU TAM to double in five years, from $50b in FY26E (ending March 2026) to $100b+ in FY31E. Our studies and conversations with other CPU makers suggest Arm may have overestimated its F26E TAM while underestimating F31E. In any case, all indicators are pointing to a stronger CAGR from here.
In the next few sections, we outline our key observations from the supply chain that drives server CPU unit growth.
Source: Aletheia/TAG
CAPITAL
MPI Corp
Massive Probing Imperative
Source: Aletheia/TAG
Nvidia's SuperPOD: GPU to CPU ratio could hit 2.4x vs 0.5x before!
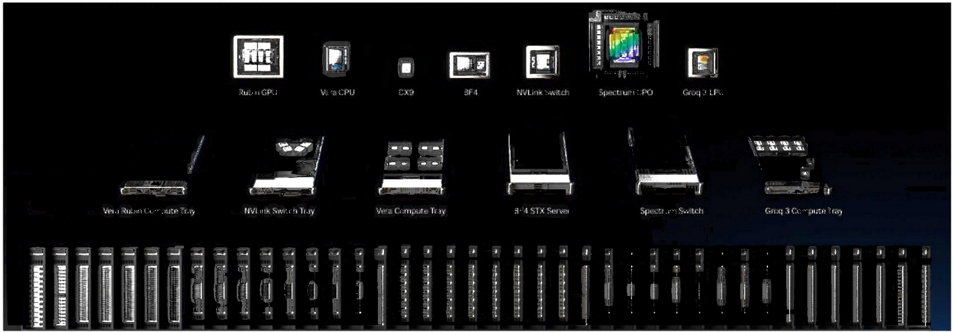
Nvidia introduced its Vera Rubin SuperPOD at its GTC 2026. Different from the previous generation Grace-Blackwell, which had only one rack solution (NVL72), Nvidia released five different racks in the Vera Rubin generation, trying to address all different tiers of inferencing demand. In addition to the widely expected VR NVL72, which consists of Rubin GPU and Vera CPU, the other four racks include a Vera CPU rack, LPX rack (for LPUs), a Bluefield 4 STX storage rack, and a Spectrum switch networking rack.
This approach significantly increased the GPU-to-CPU attachment rate. Within this 40-rack SuperPOD, the total Rubin GPU (16 racks) amounts to 1,152, while total Vera CPU numbers are as high as 1,088. The GPU-to-CPU ratio is 0.95, almost double the 0.5 for the GPU rack only. The story does not end here. There are 36x host CPUs in each LPX rack. In addition, Bluefield 4 shares the same logic die as its Grace CPU. Should we include all these CPUs in our math, the GPU-to-CPU ratio will balloon to 2.4x, up from 0.75x in the original solutions (CPU plus Bluefield DPU in GB or VR rack).
We estimate Nvidia produced ~2m Grace CPUs last year and will produce 2.5-3m combined Grace and Vera CPUs this year. Looking at 2027E, we expect Nvidia to produce a total of 5-6m combined Grace and Vera CPUs, with Vera taking the majority. Grace and Vera CPUs in 2025/26E are mostly used for its Bianca and Strata module shipments, together with Blackwell and Rubin GPUs. There will be some standalone CPU shipments this year for inhouse and external customer usage; Meta is the first external customer. We anticipate there will be more CPU-only customers in the next year.
MPI Corp
Massive Probing Imperative
FIGURE 13: NVDA'S VERA RUBIN SUPERPOD: 7 DIFFERENT CHIPS AND 5 DIFFERENT RACKS
CAPITAL
Source: NVDA, Aletheia/TAG
FIGURE 14: DETAILS OF NVIDIA'S NVL SUPERPOD STRUCTURE AND MEMORY CONTAIN
| Devices | VR NVL72 | Vera CPU | Groq LPX | BF4 STX (storage) | Spectrum-6 SPX (networking) |
|---|---|---|---|---|---|
| GPU | 72x | ||||
| CPU | 36x | 256x | 32x | ||
| BF4 DSP | 18x | 64x | 32x | 72x | |
| LPU | - | 256x | |||
| NVLink | 18x | ||||
| SP6 | - | - | 16x | ||
| # of racks per Superpod | 16 | 2 | 10 | 8 | 4 |
Source: NVDA, Aletheia/TAG
AWS: new inferencing server form factors
Nvidia is not alone. We also learned from the supply chain that AWS is requesting some new CPU server form factors. For instance, the first model will be six Intel CPUs (Granite Rapids) sitting on the same server board, with each of them equipped with six R-DIMM and each DIMM will support 64GB server DRAM. This compares with the usual CPU server board of one or two CPUs per board. DRAM density will also be significant per board at 2.3TB. More importantly, we believe this is not the only SKU and there will be more to follow.
Notably, AWS has developed its in-house Arm-based CPU (Graviton) since 2018. It is already the fifth generation this year. Its Graviton 5 will be fabricated at TSMC's N3. We expect AWS to continue to use its in-house CPU for ~50% of its demand, while it will also continue to source x86 CPUs aggressively, evidenced by the inferencing server mentioned above.
Google: strong growth for both in-house and x86 CPUs
Google launched its Axion CPU in late 2024, but we expect volumes will only take off from its second-generation Axion 2 this year. Nevertheless, the driver for Axion 2 this year is mainly to ship together with its TPUs. Its current TPUv7 (Ironwood, Ghostfish) is shipping together with Intel's CPU, with the TPU-to-CPU ratio at 2:1. However, we believe its TPUv8 families, including Sunfish from AVGO and Zebrafish from MediaTek, will be equipped with Axion 2. We forecast combined Sunfish and Zebrafish shipments will reach 1.3m+ this year, suggesting ~700k demand for TPU racks. Total Axion shipments should reach 1m+ this year accordingly. Looking into 2027E, we are forecasting total TPU shipments of 6m+, with 5m+ from TPU v8 and v9 families. This implies demand of 2.5m+ Axion CPUs for TPU racks, and 3m+ total shipments should not be difficult.
Massive Probing Imperative
CAPITAL
Google is also buying external x86 CPUs aggressively. For instance, we believe it requested up to 3-4m CPUs from AMD earlier this year, compared with ~1m in 2025E. There is no way AMD can fulfill such demand given the current supply constraint. We believe the demand strength will continue into 2027E. Most of Axion unit growth is captured by its TPU racks and Google will continue to need x86 CPUs for its agent and other workloads.
AMD: strong order backlog accelerates since 3Q25
AMD was already growing its server CPU shipments from a 1.2-1.4m/qtr run rate in 2024 to around 1.5m/qtr in 1H25, thanks to its Bergamo and Turin CPUs which are optimized for CSPs. The run rate further accelerated to 1.7-1.9m/qtr in 2H25, and we believe it has jumped to 2m/qtr+ this year. Meta was the first client to top up its demand for AMD back in late 3Q25, soon followed by MSFT. As aforementioned, Google has also come in to request multiple times volume in 2026E vs 2025E, but AMD already cannot fulfill this demand.
We believe AMD is aggressively trying to secure capacity for the years to come. AMD CEO Lisa Su was widely reported to have visited Korea and Taiwan recently to secure memory and foundry capacity. In addition, AMD is aggressively requesting CoWoS-like capacity from OSATs, which should be related to its upcoming Venice CPU. ASE just announced its subsidiary SPIL bought an old fab from Innolux for TWD6.3b ($200m). We believe this is related to its LEAP business, for which CoWoS-like packaging (FOCUS and FOCUS-Bridge) will become important in 2027/28E. If everything goes smoothly, this new fab should be able to serve customers and contribute to ASE revenues before mid-2027E.
Peer comparison: AMD vs Arm-based CPUs
Arm-based CPUs can offer as much as 50-60% better power efficiency compared to x86 CPUs; however, AMD's processors maintain a strong value proposition in the world of agentic Al. Below, we compare, in detail, the specifications between AMD's Turin-X/Venice-X and four major Arm-based competitors: AWS Graviton 5, Google Axion 2, NVIDIA Vera, and the upcoming Arm AGI CPU. In brief, while Arm-based peers excel in energy density and raw memory throughput, AMD's Turin-X provides larger local data residency, which results in lower operational latency. Furthermore, its software compatibility remains superior to its Arm-based counterparts.
Architecture: Cache Residency vs. Memory Bandwidth
The Graviton 5, Arm AGI, and NVIDIA Vera CPUs are equipped with wider memory bandwidth compared to Turin-X. The former two support DDR5-8800 (delivering up to 140.8 GB/s), while Vera uses an LPDDR5X interface on SOCAMM2, reaching up to 1.2 TB/s. Turin-X operates on DDR5-6400 with a maximum theoretical bandwidth of 102.4 GB/s.
Nevertheless, Turin-X features the largest on-die memory in its class, with over 1.2 GB of SRAM density (L2+L3 cache)-roughly 2-4x that of its Arm-based peers. In agentic Al, Time to First Token (TTFT) and complex task orchestration are critical metrics. AMD's "Cache-First" architectural choice lowers operational latency by keeping the "working set" of an agentic loop-including scratchpads, tool-call metadata, and small-model parameters-entirely within the SRAM. By doing so, AMD avoids the power-hungry and high-latency penalties associated with external memory fetches, effectively offsetting the power efficiency benefits of its Arm competitors.
Software Compatibility and Ecosystem Reliability
A critical Total Cost of Ownership (TCO) factor often overlooked is Software Portability. TurinX runs on the x86 architecture, which remains the native target for the vast majority of enterprise software and Python-based agent frameworks. Migrating to custom Arm silicon, such as Axion 2 or Graviton 5, often requires significant engineering resources for optimization and debugging. While it is easier for cloud service providers (CSPs) to run internal workloads on their own customized Arm CPUs, their external customers-whose platforms are typically built on x86—face a much steeper transition.
The Future: Venice-X
The upcoming Venice-X is designed to neutralize Arm's current bandwidth advantage Venice-X is expected to use 16-channel MCR-DIMM technology, which will provide the CPU with up to 1.6 TB/s of bandwidth, effectively surpassing the throughput of NVIDIA Vera. Additionally, it will expand on-die SRAM density to an estimated 2.3 GB+. This makes VeniceX potentially the most balanced engine for agentic Al, combining the world's highest cachehit rates with elite-tier memory throughput.
FIGURE 15: SERVER CPU SPECIFICATIONS
| Supplier | AMD | AMD | AWS | ARM | Nvidia | |
|---|---|---|---|---|---|---|
| Product | Turin-X | Venice-X | Axion2 | Graviton5 | AGI CPU | Vera |
| Architecture | Zen 5 (x86) | Zen 6 (x86) | Neoverse N3 (ARM) | Neoverse V3 (ARM) | Neoverse V3 (ARM) | Olympus (ARM) |
| Total SRAM density | 1,636MB | ~2,800GB | ~200 MB | ~400 MB | 640 MB | 338 MB |
| Max Core Count | 128 cores | 256 Cores | 72 VCPUs | 192 Cores | 136 Cores | 88 Cores |
| Peak Clock | 5.0 GHZ | >5.0 GHz | ~3.5 GHZ | -3.7 GHZ | 3.7 GHz | ~3.5 GHz |
| DRAM Standard | 12-Ch DDR5-6400 | 16-Ch MCR-DDR6 | DDR5-5600 | DDR5-8800 | 12-Ch DDR5-8800 8x SOCAMMLPDDR5X | |
| Max DRAM Density | 6 TB | 12 TB | 768 GB* | 1.5 TB | 6 TB | 1.5 TB* |
| TDP | 400W-500W | 500W-700W+ | 200W-300W | 250W-350W | 300W | 150W-250W |
| TSMC process node | N3/N4 | N2 | N3 | N3 | N3 | N3 |
Note: * Axion 2 C4A variant carries up to 768GB memory density, up from 192GB in Tau T2A - the first generation of Axion CPU. Vera can support up to 1.5TB of LPDDR5X density, up from 520MB in Grace.
Sources: Companies, Aletheia/TAG
Arm: launching AGI CPU
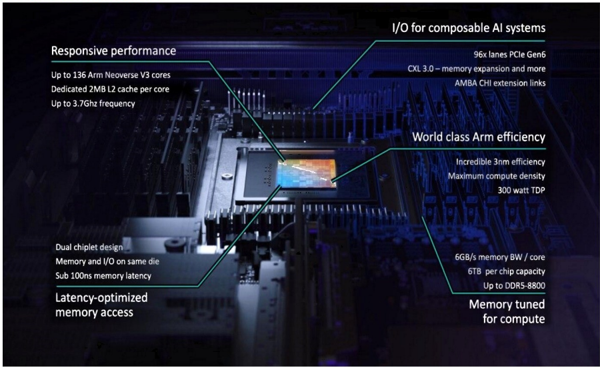
On March 24, 2026, Arm launched its first silicon product named Arm AGI CPU, an Armdesigned CPU for Al data centers, built to address a rising class of Agentic Al workloads. According to Arm, agentic Al systems are the primary catalyst for its foray into silicon solutions as these systems demand CPU become the "pacing element" in Al infrastructure for orchestration, scheduling workloads, managing memory and coordinating multi-agent execution flows which is very much in line with our thesis. Arm explicitly stated that ecosystem partners demanded deeper solutions beyond IP licensing. To address this, ARM extended its platform from CPU IP to Compute Subsystems (CSS) to now full silicon products.
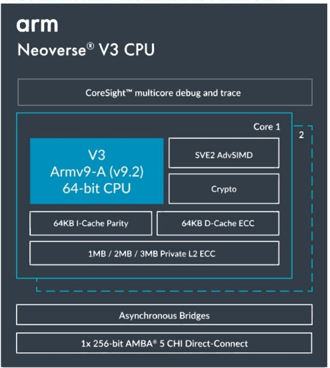
The Arm AGI CPU, which is built on the TSMC N3, is based on the Arm Neoverse V3 platform and is optimized for rack-scale Al infrastructure. and It has up to 136 Neoverse V3 cores running at 3.2 GHz all-core and 3.7 GHz boost across two dies with 300W TDP. It supports 2x 128-bit SVE (Scalable Vector Extension) and has an L2 cache of 2MB per core. The device also supports 12 channels of DDR5 memory up to 8800 MT/s, which translates to memory bandwidth of ~6 GB/s per core. The I/0 includes 96 lanes of PCle Gen6 and CXL 3.0 for memory pooling and expansion. It also supports AMBA CHI links for accelerator integration.
Arm referenced its new Arm AGI CPU 1OU dual node server platform, which adopts dual-node (2N) configuration, enabling two independent compute nodes within a single IU chassis. This design allows data center operators to double the nodes per rack unit, increasing overall compute density in the same physical footprint. As two AGI CPUs fit per blade, a standard rack can hold 30 blades, meaning 60 AGI CPUs resulting in 8,160 cores in total. Whereas, a liquid-cooled 200kW rack configuration can house 336 chips, resulting in 45,696 cores in total. Arm has partnered with Supermicro to build liquid cooled configurations. Arm claims the AGI CPU delivers >2x performance per rack compared to x86 systems achieved through higher memory bandwidth, better per-thread performance and higher usable thread count.
CAPITAL
MPI Corp
Massive Probing Imperative
FIGURE 16: ARM AGI CPU
Source: Arm
FIGURE 17: ARM NEOVERSE V3 PLATFORM
Source: Arm
Rising inference CPU adoption - Implications for MPI
MPI is gaining share in probe cards for AMD's PC and server CPU platforms. We believe MPI is targeting to capture the majority of AMD's probe card demand, representing a revenue opportunity potentially comparable to MPI's entire FY25 probe card revenue base of
The key swing factor, in our view, is not demand but capacity availability. Whether MPI can expand capacity quickly enough to support the full demand opportunity will likely determine the ultimate share gain. That said, we believe AMD has a strong incentive to allocate as much business to MPI as possible.
We expect a hybrid supply model to emerge, whereby MPI provides the higher-value MLO and PCB design/content while certain probe head components may be sourced externally when capacity becomes constrained. For the portions where capacity is available, MPI would continue supplying the complete probe card solution. This approach would allow AMD to maximize MPl's participation while mitigating supply bottlenecks during the current advanced probe card shortage.
For Vera CPU, we now expect Vera CPU to be >2mn and >5mn in CY26E and CY27E, driving up substantial probe card demand towards both Winway-TP and MPI's vertical MEMS probe cards. We suspect that MPI will increase its allocation from previously <10% to currently 30%+ with very lucrative probe card pricing. We do not exclude more upward revisions in this space
MPI Corp
Massive Probing Imperative
Earnings estimate change
We raise our FY26E-FY28E EPS estimates by 23%-63% to NT$75.08/NT$186.50/NT$286.50, respectively, to reflect our assumptions for higher production pin capacity, now projected to double each year during CY26E-28E.
We expect blended VPC/MEMS probe card ASPs to grow by 18%/14%/5% in FY26E/27E/28E, driven by the increasing mix of vertical MEMS probe cards-for which the ASPs can be as high as $12 or, in some cases, far exceeding $15 per pin. We do not factor in any price upside to CPC probe cards in our forecasting period.
For legacy CPC probe card business, we currently expect a nearly fully loaded capacity from 2Q-3Q26 onwards due to Novatek's OLED DDI for a US smartphone maker. We expect CPC probe card ASP to stay still in our forecasting period.
For equipment business, we currently expect the major incremental revenue to come mainly from CPO insertion #2 and #3, potentially leading to NT$5bn and NT$10bn revenue out of the NT$10bn initial TAM.
For margins, we begin to factor growing margin profile for VPC/MEMS probe card starting CY27E-28E to factor in the growing insourcing ratio of PCBs in the company's Hukou plant Moreover, we expect certain high-end vertical MEMS probe card projects to bear substantially higher margins.
FIGURE 18: OUR P&L ESTIMATES CHANGE
| 2Q26E | 2Q26E | 2Q26E | 3Q26E | 3Q26E | 3Q26E | 2026E | 2026E | 2026E | 2027E | 2027E | 2027E | 2028E | 2028E | 2028E | |
|---|---|---|---|---|---|---|---|---|---|---|---|---|---|---|---|
| (TWDSmn) | New | Prev | Var (%) | New | Prev | Var (%) | New | Prev | Var (%) | New | Prev | Var (%) | New | Prev | Var (%) |
| Sales | 5,132 | 4,759 | 7.8 | 6,792 | 5,736 | 18.4 | 1400) | 21,384 | 12.2 | 53,433 | 36,223 | 47.5 | 76,274 | n.a. | |
| Gross profit | 3,098 | 2,150 | 12.3 | 1.7.. | 3,303 | 22.2 | 12,506 | 16.4 | 33,514 | 21,988 | 52.4 | a./ | n.a. | ||
| Operating profit | 1,800 | 1,545 | 16.5 | 2,448 | 1,932 | 26.7 | 8,510 | 7,079 | 20.2 | 20,839 | 13,289 | 56.8 | 32,174 | n.a. | |
| Net profit | 1,537 | 1,312 | 17.1 | 2,074 | 1,631 | 27.2 | 7,360 | 5,988 | 22.9 | 17,579 | 11,241 | 56.4 | 27,005 | n.a. | |
| Diluted EPS (TWD$) | 15.67 | 13.38 | 17.1 | 21.16 | 16.64 | 27.1 | 75.08 | 61.08 | 22.9 | 186.50 | 114.66 | 62.7 | 286.50 | n.a. | |
| Gross margins (%) | 60.4 | 58.0 | 2.4 | 60.8 | 59.0 | 1.9 | 60.7 | 58.5 | 2.2 | 62.7 | 60.7 | 2.0 | 63.4 | ||
| OP margins (%) | 35.1 | 32.5 | 2.6 | 36.0 | 33.7 | 2.4 | 35.5 | 33.1 | 2.4 | 39.0 | 36.7 | 2.3 | 42.2 | ||
| Net margins (%) | 29.9 | 27.6 | 2.4 | 30.5 | 28.4 | 2.1 | 30.7 | 28.0 | 2.7 | 32.9 | 31.0 | 1.9 | 35.4 | Tl.d |
Source: Aletheia/TAG
FIGURE 19: OUR P&L ESTIMATES VS CONSENSUS
| 2Q26E | 2Q26E | 2Q26E | 3Q26E | 3Q26E | 3Q26E | 2026E | 2026E | 2026E | 2027E | 2027E | 2027E | 2028E | 2028E | 2028E | |
|---|---|---|---|---|---|---|---|---|---|---|---|---|---|---|---|
| (TWD$mn) | Aletheia | Street | Var (%) Aletheia | Street | Var (%) | Aletheia | Street | Var (%) Aletheia | Street | Var (%) Aletheia | Street | Var (%) | |||
| Sales | 5,132 | 4,849 | 5.8 | 6,792 | 5,632 | 20.6 | 24,000 | 21,114 | 13.7 | 53,433 | 36,332 | 47.1 | 76,274 | 60,793 | 25.5 |
| Gross profit | 3,098 | 2,840 | 9.1 | 4,133 | 3,329 | 24.1 | 14,561 | 12,466 | 16.8 | 33,514 | 21,767 | 54.0 | 48,320 | 38,178 | 26.6 |
| OP profit | 1,800 | 1,579 | 14.0 | 2,448 | 1,924 | 27.2 | 8,510 | 7,104 | 19.8 | 20,839 | 13,916 | 49.8 | 32,174 | 25,568 | 25.8 |
| Net profit | 1,537 | 1,345 | 14.2 | 2,074 | 1,631 | 27.2 | 7,360 | 6,130 | 20.1 | 17,579 | 11,618 | 51.3 | 27,005 | 21,161 | 27.6 |
| Diluted EPS (TWD$) | 15.67 | 13.72 | 14.2 | 21.16 | 16.64 | 27.2 | 75.08 | 62.52 | 20.1 | 186.50 | 123.26 | 51.3 | 286.50 | 224.50 | 27.6 |
| Gross margins (%) | 60.4 | 58.6 | 1.8 | 60.8 | 59.1 | 60.7 | 59.0 | 1.6 | 62.7 | 59.9 | 2.8 | 63.4 | 62.8 | 0.6 | |
| OP margins (%) | 35.1 | 32.6 | 2.5 | 36.0 | 34.2 | 35.5 | 33.6 | 1.8 | 39.0 | 38.3 | 0.7 | 42.2 | 42.1 | 0.1 | |
| Net margins (%) | 29.9 | 27.7 | 2.2 | 30.5 | 29.0 | 1.6 | 30.7 | 29.0 | 1.6 | 32.9 | 32.0 | 0.9 | 35.4 | 34.8 | 0.6 |
Source: Bloomberg, Aletheia/TAG
Valuation and recommendation
We give MPI Corporation a Buy rating and a target price of NT$10,000 (vs NT$4,000 previously), now based on a target PER of 35x applied to our FY28E EPS of NT$286.50 (vs based on FY27E EPS of NT$114.66 previously). Our targeted PER multiple is at the upper bound of the past five years trading range of within a 15-35x forward PER range. The higher PER multiple reflects our view about an acceleration in MPI's earnings at a CAGR of 85% in FY24-28E from
Our FY26E-28E EPS estimates are 20%-51% above consensus, as we believe the market has yet to factor in (1) massive vertical-MEMS probe card demand that is 3x-4x higher than the original 2x expectation; (2) the recent development of MPI's CPO offerings at both insertions 2 and 3; as well as (3) the business opportunity from the next wave of Al ASIC projects— many of which will feature high pin counts and N2-based compute die designs beginning to ramp in 2027. This transition should double the pin count per probe card, effectively doubling ASPs,
CAPITAL
while, starting next year, MPI expands its MEMS probe card capacity at a larger scale and faster pace.
We remain constructive about both the probe card industry and MPI, as increasingly complex chiplet architectures will continue to drive demand for chip probes, given the increasing number of wafer types per CoWoS package. Simultaneously, the content value of probe cards is expected to double, supported by higher pin counts across Al GPU and ASIC roadmaps. Notably, MPI serves as a near-exclusive supplier for Broadcom and Marvell's Al ASICs, positioning it at the core of this structural upcycle. Consequently, we forecast revenue CAGR to accelerate from 14% in FY20-24 to 65% in FY24-28E, and core earnings to grow 10x by FY28E versus FY24, underpinned by a superior ROE and strong operating leverage.
MPI's valuation stacks up well with its global peers in the advanced packaging SPE and probe card industry. The probe card group currently trades at an average of 54x and 33x FY1 and FY2 PER, where FY1 refers to the current fiscal year and FY2 to the next, accounting for variations in fiscal year definitions across markets. While MPI is trading at 66.1x and 28x FY1 and FY2 PER which is broadly in line with global peers of 54x and 33x due to the strong semiconductor testing cycle, we highlight that MPI is severely undervalued by market by its FY28E (FY3) growth potential, which we expect 54% EPS growth driven by continuous vertical MEMS probe card capacity expansion cater to Al ASICs, Al networking, and more ultra-high pin count probe card demand from both Broadcom, Marvell, and Nvidia as well as the substantial growth from its own PCB self sufficiency plans and the high-volume production of its CPO insertion #2 and #3 wafer and die level prober for TSMC and OSATs.
With that, MPI is currently only trading at 18x FY28E PER, meaningfully below the level benchmarked to its FY24-28E earnings CAGR of 85%. Despite this valuation gap, MPI's twoyear EPS CAGR is meaningfully above the peer group average, reinforcing its strong relative
| As of June 9, 2026** | |||||||||||||
|---|---|---|---|---|---|---|---|---|---|---|---|---|---|
| Probe card peer group | |||||||||||||
| MPI* (Dec FYE) | 18.2 | 66.1 | 27.7 | 133.8 | 138.8 | 20.3 | 12.8 | 14.9 | |||||
| CHPT (Dec FYE) | 3.5 | 49.5 | 28.1 | 125.4 | 75.9 | 37.7 | 19.2 | 10.5 | |||||
| TechnoProbe (Dec FYE) | 24.4 | 81.9 | 50.9 | 162.9 | 61.0 | 49.6 | 32.0 | 13.81 | 0.1 | ||||
| Winway (Dec FYE) | 9.8 | 90.0 | 46.2 | 103.8 | |||||||||
| Formfactor (Mar FYE) | 9.7 | 50.5 | 39.0 | 89.5 | |||||||||
| Average (excl. MPI) | 54.4 | 32.8 | 57.9 | ||||||||||
| Adv. Packaging SPE peer group | Adv. Packaging SPE peer group | ||||||||||||
| Hon precision* (Dec FYE) | 39.5 | 53.5 | 30.5 | 72.1 | .5 | 12.3 | 47.3 | 0.9 | 0.9 | ||||
| Chroma* (Dec FYE) | 32.1 | 53.1 | 29.1 | 67.3 | 23 3.5 | .0 | 71.9 | 0.8 | 2.4 | ||||
| Disco* (Mar FYE) | 48.4 | 60.7 | 53.3 | 12.2 | 40. | 12.1 | 10. . 6 | .9 | 19.9 | 0.7 | 0.8 | ||
| Shibaura* (Mar FYE) | 2.1 | 17.5 | 12.2 | 46.8 | 42.7 | 11.7 | 8.4 | 4.5 | 25.9 | 29.2 | 2.3 | 3.3 | |
| Advantest* (Mar FYE) | 120.3 | 30.9 | 24.0 | 65.6 | 28.4 | 22.2 | 15.8 | 10.2 | 65.1 | 51.8 | 0.2 | 0.3 | |
| BESI (Dec FYE) | 27.4 | 75.3 | 49.0 | 133.5 | 53.7 | 0.1 | 39.1 | 28.0 | 62.4 | 69.7 | 1.1 | 1.5 | |
| ASMPT (Dec FYE) | 9.9 | 47.4 | 31.8 | • 226.1 | 49.0 | 27.7 | 4.2 | .9 | 9. .4 | 12.5 | 1.0 | ||
| Teradyne* (Dec FYE) | 58.7 | 41.3 | 26.7 | 127.9 | 54.9 | 33.9 | 17.8 | 13.2 | 42.7 | 49.7 | 0.2 | 0.2 | |
| Average (excl. MPI) | 47.4 | 32.1 | 93.9 | 50.0 | 17.6 | 16.8 | 12. . € | 39.0 | 44.0 | 0.9 | 1.4 |
Source: Bloomberg, Aletheia/TAG
Note: *Aletheia official coverage others are Bloomberg consensus estimates
MPI Corp
Massive Probing Imperative
EARNINGS MODEL
Source: Company, Aletheia/TAG
MPI Corp
Massive Probing Imperative
Financial statements
INCOME STATEMENT
Revenue
FYE Dec. (TWD, bn)
COGS
Gross profit
Operating expense
EBITDA
Operating profit
Net non-op income
Profit before tax
Minority Interest
Tax
Net Profit
FD EPS, TWD
Change
Revenue
Gross profit
Operating profit
Net Profit
EPS
CASH FLOW
FYE Dec. (TWD, bn)
Net profit
Dep. & amortisation
Chg in WC
Others
OPN cash flow
Capex
Chg in investment
Others
Investing CF
Chg in debt
Equity raised
Dividends (paid)
Others
Financing CF
FX & other adj.
Chg in cash
Beginning cash
End cash
76.3
FY27F FY28F
53.4
(19.9)
33.5
(28.0)
48.3
(12.7) (16.1)
23.5
36.0
20.8
21.4
0.6
(3.9)
0.0
17.6
0.8
32.2
32.9
(5.9)
0.0
27.0
FY26F
24.0
(9.4)
14.6
(6.1)
9.8
8.5
0.5
9.0
(1.6)
7.4
78.1
286.5
186.5
FY23A FY24A FY25A
8.1
(4.3)
3.9
(2.4)
2.0
1.5
0.1
1.6
(0.3)
0.0
1.3
10.2
(4.6)
5.6
(3.1)
3.0
2.5
0.3
2.8
(0.5)
0.0
2.3
13.4
(5.9)
7.4
(3.7)
4.6
3.8
0.1
3.8
(0.7)
0.0
3.2
13.8
33.4
24.4
9.9% 24.9% 31.5%
79.5% 122.6% 42.7%
14.4%
42.7%
17.7% 68.7%
7.6% 75.4%
8.1% 76.1%
FY23A
FY24A
1.3
0.5
-0.1
-0.0
1.7
-0.4
-0.0
-0.9
-1.3
0.4
0.0
-0.7
0.0
-0.2
-0.0
0.2
2.4
2.6
FCF
1.3
Source: Company, Aletheia/TAG
2.3
0.6
-1.3
1.2
2.8
-0.3
0.0
-1.1
-1.3
0.4
0.0
-0.7
-0.0
-0.3
-0.0
1.1
2.6
3.7
2.5
33.6%
44.2%
96.0% 130.2%
52.0% 125.5% 144.9% 54.4%
38.0% 131.7% 138.8%
53.6%
37.3% 133.5% 138.8%
FY25A
FY26F
FY27F
3.2
0.8
-1.4
0.9
3.5
-4.0
-0.2
0.1
-4.1
3.8
0.0
-1.5
-0.1
2.3
0.0
1.7
3.7
5.4
-0.4
7.4
1.3
17.6
2.7
-8.5
0.3
12.0
-1.8
-0.0
0.0
-1.8
-0.2
0.0
-4.6
0.0
-4.9
0.0
5.4
5.8
11.1
10.2
53.6%
FY28F
27.0
3.8
-2.4
0.3
28.7
-0.7
-0.0
0.0
-0.7
-0.2
0.0
-10.2
0.0
-10.4
0.0
17.6
11.1
28.8
28.0
0.0
BALANCE SHEET
CAPITAL
| BALANCE SHEET FYE Dec. (TWD, bn) | FY23A FY24A FY25A FY26F | FY27F FY28F | ||||
|---|---|---|---|---|---|---|
| Cash/ST investments | 2.6 | 3.7 | 5.4 | 5.8 | 11.1 | 28.8 |
| Inventory | 2.8 | 3.5 | 5 | 7 | 12.8 | 13.9 |
| Receivable | 1.2 | 1.9 | 2.4 | 5 | 10.6 | 13 |
| Current assets | 6.9 | 9.5 | 13.3 | 18.4 | 35.0 | 56.3 |
| Fixed Assets | 3.6 | 4.7 | 8.3 | 9.9 | 5.9 | |
| Goodwill & intangibles | 0.3 | 0.3 | 0.6 | 0.6 | 0.5 | 0.5 |
| Other LT assets | 1.7 | 1.9 | 1.8 | 1.8 | 1.8 | 1.8 |
| LT assets | 5.5 | 7 | 10.7 | 12.3 | 11.4 | 8.2 |
| Total assets | 12.4 | 16.5 | 24 | 30.7 | 46.4 | 64.5 |
| Payable | 0.7 | 1.4 | 1.8 | 2.8 | 5.6 | 6.7 |
| Other liability | 2.4 | 4.3 | 5.8 | 6.3 | 6.6 | 6.9 |
| Current liabilities | 3.1 | 5.7 | 7.6 | 9.1 | 12.2 | 13.6 |
| LT liabilities | 1.7 | 1.5 | 1.9 | 1.8 | 1.5 | 1.3 |
| Total liabilities | 4.8 | 7.2 | 9.4 | 10.9 | 13.7 | 14.9 |
| Common shares | 0.9 | 0.9 | 1 | 1 | 1.0 | 1 |
| Retained earnings | 4 | 5.5 | 6.9 | 12.2 | 25.1 | 41.9 |
| Equity | 7.6 | 9.3 | 14.6 | 19.8 | 32.7 | 49.6 |
| Liability&equity | 12.4 | 16.5 | 24 | 30.7 | 46.4 | 64.5 |
RATIOS & PER SHARE DATA *
FYE Dec. (TWD)
FY23A
Gross margin
EBITDA Margin
Op. Profit Margin
Net Profit Margin
ROE (%)
ROA (%)
Gross gearing
Net gearing
Asset turn (x)
Leverage (x)
Payable days
Receivable days
Inventory days
EPS
BVPS
Net cash per share
SPS
FOFPS
DPS
47.8%
24.6%
18.1%
16.1%
18.1%
11.2%
FY24A
54.7%
29.9%
24.4%
22.6%
27.2%
15.9%
FY26F
60.7%
40.7%
FY25A
55.6%
34.1%
28.2%
35.5%
23.8% 30.7%
26.6% 42.8%
15.7% 26.9%
24.9%
17.5%
25.0%
22.1%
-8.9% -14.7% -15.2% -11.8%
0.7
0.9
0.7
0.7
1.6
55.4
50.0
236.2
13.8
80.3
7.2
85.9
14.1
7.0
1.7
84.1
55.3
247.3
24.4
98.5
14.4
107.6
26.8
7.5
1.7
99.2
58.5
261.4
33.4
153.5
23.3
140.8
(4.3)
15.9
1.6
89.3
56.5
233.6
78.1
209.9
24.8
254.6
24.0
22.9
FY27F
62.7%
44.0%
39.0%
FY28F
63.4%
47.2%
42.2%
32.9%
35.4%
66.9%
65.6%
45.6% 48.7%
9.8%
6.1%
-24.2%
1.4
1.5
76.7
53.5
-52.0%
1.4
1.3
80.0
56.5
182.2
175.0
186.5 286.5
347.3
525.9
84.1 273.5
566.9
809.2
108.2
49.1
297.1
107.9
Massive Probing Imperative
Global Strategy
Asianomics
Tech Thematic Strategy
Asia Equity Strategy
China Strategy
Tactical Alpha Strategy
Godd commodities
Aletheia Research Team
i Jonathan Wimot
Technology Hardware
- Dr. Jim Walker
*Vincent Chan
Justin Collazo
- Steven Schlegel
Product Marketing Teams

Consumer & Internet
China Technology
CrossASEAN
CAPITAL
MPI Corp
Massive Probing Imperative
Firm Disclosures
Aletheia Capital Ltd ("Aletheia") is a limited company registered in Hong Kong, located at Unit 2407, World-Wide House, 19 Des Voeux Road, Central, Hong Kong.
Aletheia Analyst Network Ltd ("AAN") is a limited company registered in Hong Kong and is a wholly owned by Aletheia and is regulated by the Hong Kong Securities and Futures Commission, is a registered investment advisor with the U.S. Securities and Exchange Commission and is regulated by the Financial Conduct Authority, Firm Reference Number 794762.
Aletheia Capital (Singapore) Pte Ltd ("ACSG") is a limited company registered in Singapore, UEN 201823248E, and is a wholly owned by AAN and is an Exempt Financial Adviser as defined in the Financial Advisers Act.
This report was published by AAN and is distributed by AAN and ACSG. For investors in Singapore, this material is provided by ACSG pursuant to Regulation 32C of the Financial Advisers Regulations. If there are any matters arising from, or in connection with this material, please contact ACSG, Level 39, MBFC Tower 2, 10 Marina Blvd, Singapore 018983.
Additional information will be made available upon request.
圖片清單(已驗證 2026-07-02)
回補驗證:僅涵蓋已被 lib 頁嵌入的圖片,非全量驗證。
| 檔名 | size | 分類 | 親眼所見內容 |
|---|---|---|---|
報告_Aletheia_旺矽6223_20260610_003.png |
202KB | 真資料圖 | Figure 標題「Testing process for CoWoS chips」流程圖,左側方框「TSMC & OSAT」內含 Wafer Sort/Die Level Test/Test Partially Assembled Units 等步驟與 Tester/Handler/Prober 設備標註(V93K、Ultraflex+、HA1200 等),右側方框「KYEC, OSAT & Fabless」內含 Final Test/Burn-in Test/2nd Final Test/System Level Test 至 Finished Goods 流程 |