PDF 原檔:260622_2409_3034_ms_2h-june-panel-px_original.pdf
原始內容
M June 22, 2026 04:32 PM GMT
Greater China Technology Hardware | Asia Pacific
TFT-LCD Panel Prices for June 2026: TVs Flat, Monitors +0.1%, NBs Flat MoM
We expect TV panel prices to decline from 3Q26 and IT panel prices from 4Q26. While we remain constructive on the opportunities for glass in advanced packaging, we believe it will take time for supply chain players to generate meaningful revenue.
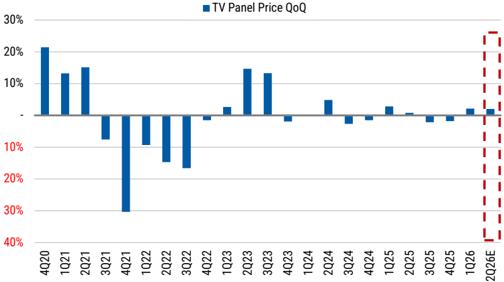
TV panel prices stayed flat MoM in June: Mainstream 32", 43", 55", 65", and 75" TV panel prices held flat MoM in June. Order momentum began to slow as earlier restocking since the start of the year tapered off, although panel makers continue to maintain disciplined utilization to align output with demand. Looking into 2H26, we maintain the view that panel orders could come in below seasonal levels, which could further weaken panel makers' bargaining power. We therefore expect TV panel prices to trend down from 3Q26. On a quarterly average basis, TV panel prices should increase by low single digits QoQ in 2Q26.
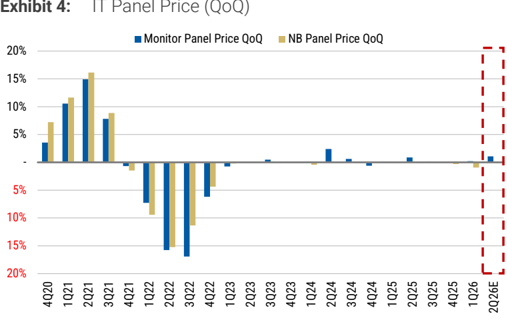
IT panel prices were largely stable in June: Monitor panel prices edged up 0.1% MoM, while notebook panels remained flat MoM. Overall, we expect IT panel prices to remain relatively more stable than TV panels in the coming quarters. On a quarterly average basis, IT panel prices should be roughly flat QoQ in 2Q26.
Glass opportunities in packaging continue to gain attention: Our checks indicate that Innolux is supplying a glass core with TGV (Through Glass Via) to a major foundry player to validate the benefits of a simulated glass core ABF substrate. While improved coplanarity, lower CTE, higher effective modulus, and better power integrity are encouraging, we note that the TGV process remains challenging for Innolux, with yield as a key gating factor for mass production. Our understanding is that adoption could begin with CoWoS and potentially extend to CoPoS later. We expect meaningful revenue contribution no earlier than 2028 (see more in our deep dive report).
Risk/reward less attractive: We view valuations as less attractive, particularly for Taiwan names AUO (2409.TW; 1.5x P/B) and Innolux (3481.TW; 2.5x P/B), as incremental contributions from advanced packaging will take more time to materialize and competition could intensify at the mass production stage, with multiple supply chain players targeting the opportunity. Within China, we prefer BOE (000725.SZ; 1.8x P/B) over TCL (000100.SZ; 1.8x P/B), reflecting BOE's scale advantage, higher concentration in display, and faster progress in glass core substrates.
Morgan Stanley Taiwan Limited+
Derrick Yang
Equity Analyst
Derrick.Yang@morganstanley.com
+886 2 2730-2862
Morgan Stanley & Co. International plc+
Shawn Kim
Equity Analyst
Shawn.Kim@morganstanley.com
+44 20 7677-1018
Morgan Stanley Taiwan Limited+
Vivi Huang
Research Associate
Vivi.Huang@morganstanley.com
+886 2 2730-2860
Sharon Shih
Equity Analyst Sharon.Shih@morganstanley.com
+886 2 2730-2865

Greater China Technology Hardware
Asia Pacific Industry View
S. Korea Technology
Asia Pacific
Industry View
In-Line
Attractive
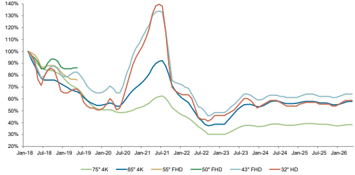
Exhibit 1 : TFT-LCD TV Panel Price Trends
Source: Trendforce, Morgan Stanley Research
Morgan Stanley does and seeks to do business with companies covered in Morgan Stanley Research. As a result, investors should be aware that the firm may have a conflict of interest that could affect the objectivity of Morgan Stanley Research. Investors should consider Morgan Stanley Research as only a single factor in making their investment decision.
For analyst certification and other important disclosures, refer to the Disclosure Section, located at the end of this report.
+= Analysts employed by non-U.S. affiliates are not registered with FINRA, may not be associated persons of the member and may not be subject to FINRA restrictions on communications with a subject company, public appearances and trading securities held by a research analyst account.
Idea
M
Pricing Chart
Exhibit 2: TFT-LCD Panel Prices - June 2026
| Screen Size Format Resolution BLU 75" 4K2K 3840x2160 Open-Cel Change (%) 65" 4K2K 3840x2160 Open-Cel Change (%) 55" 4K2K 3840x2160 Open-Cel Change (%) 32" HD 1366x768 Open-Cel Change (%) 23.8" FHD 1920x1080 Edge-LED Change (%) 14.0" WUXGA 1920x1200 Flat-LED Change (%) 11.6" HD 1366x768 Flat-LED Change (%) | 1/1/2024 2/1/2024 241 243 248 0.0% 0.8% 2.1% 173 176 181 0.0% 1.7% 2.8% 132 134 137 0.0% 1.5% 2.2% 34 35 36 3.0% 2.9% 2.9% 47.9 47.9 48.3 0.0% 0.0% 0.8% 42.50 42.30 42.10 -0.5% -0.5% -0.5% 24.75 24.75 24.75 0.0% 0.0% 0.0% | 3/1/2024 4/1/2024 253 2.0% 186 2.8% 139 1.5% 37 2.8% 48.8 1.0% 42.10 0.0% 24.85 0.4% | 5/1/2024 6/1/2024 7/1/2024 255 255 253 0.8% 0.0% -0.8% 188 188 186 1.1% 0.0% -1.1% 140 140 139 0.7% 0.0% -0.7% 37 37 36 0.0% 0.0% -2.7% 49.4 49.7 49.7 1.2% 0.6% 0.0% 42.10 42.10 42.10 0.0% 0.0% 0.0% 24.95 25.05 25.05 0.4% 0.4% 0.0% | 9/1/2024 10/1/2024 11/1/2024 248 248 248 -0.8% 0.0% 0.0% 181 181 181 -1.1% 0.0% 0.0% 134 134 134 -2.2% 0.0% 0.0% 34 34 34 -2.9% 0.0% 0.0% 49.6 49.4 49.2 -0.2% -0.4% -0.4% 42.10 42.10 42.10 0.0% 0.0% 0.0% 25.05 25.05 25.05 0.0% 0.0% 0.0% | 12/1/2024 250 253 0.8% 1.2% 182 184 0.6% 1.1% 134 135 0.0% 0.7% 34 35 0.0% 2.9% 49.2 49.2 0.0% 0.0% 42.10 0.0% 0.0% 25.05 0.0% 0.0% | 1/1/2025 2/1/2025 256 1.2% 186 1.1% 136 0.7% 35.5 1.4% 49.2 0.0% 42.10 42.10 0.0% 25.05 25.05 0.0% | 3/1/2025 4/1/2025 5/1/2025 257 257 257 0.4% 0.0% 0.0% 187 187 187 0.5% 0.0% 0.0% 137 137 137 0.7% 0.0% 0.0% 36 36 36 1.4% 0.0% 0.0% 49.4 49.7 49.9 0.4% 0.6% 0.4% 42.10 42.10 42.10 0.0% 0.0% 0.0% 25.05 25.05 25.05 0.0% 0.0% 0.0% | 6/1/2025 7/1/2025 8/1/2025 256 253 253 -0.4% -1.2% 0.0% 186 183 183 -0.5% -1.6% 0.0% 136 134 134 -0.7% -1.5% 0.0% 36 35 35 0.0% -2.8% 0.0% 49.9 49.9 49.9 0.0% 0.0% 0.0% 42.10 42.10 42.10 0.0% 0.0% 0.0% 25.05 25.05 25.05 0.0% 0.0% 0.0% | 9/1/2025 10/1/2025 253 251 0.0% -0.8% 183 181 0.0% -1.1% 134 133 0.0% -0.7% 35 35 0.0% 0.0% 49.9 49.9 0.0% 0.0% 42.10 42.10 0.0% 0.0% 25.05 25.05 0.0% 0.0% | 11/1/2025 12/1/2025 248 245 -1.2% -1.2% 178 178 -1.7% 0.0% 131 131 -1.5% 0.0% 34 34 -2.9% 0.0% 49.9 49.9 0.0% 0.0% 42.00 41.90 -0.2% -0.2% 25.05 25.05 0.0% | 1/1/2026 245 0.0% 179 0.6% 132 0.8% 35 2.9% 49.9 0.0% 41.70 -0.5% 24.95 0.0% -0.4% | 2/1/2026 247 0.8% 182 1.7% 134 1.5% 36 2.9% 50.1 0.4% 41.50 -0.5% 24.85 -0.4% | 3/1/2026 250 1.2% 185 1.6% 136 1.5% 37 37 2.8% 50.4 0.6% 41.50 41.50 0.0% 0.0% 24.85 0.0% | 4/1/2026 5/1/2026 251 251 0.4% 0.0% 187 187 1.1% 0.0% 136 136 0.0% 0.0% 37 0.0% 0.0% 50.7 50.9 0.6% 0.4% 41.50 0.0% 24.85 24.85 0.0% 0.0% | Jun-26 (A) Jun-26 251 251 0.0% 0.0% 187 187 0.0% 0.0% 136 136 0.0% 0.0% 37 37 0.0% 0.0% 51 51.1 0.2% 0.4% 41.50 41.50 0.0% 24.85 0.0% | (E) Diff% 0.0% 0.0% 0.0% 0.0% -0.2% 0.0% 0.0% 24.85 0.0% 0.0% |
|---|---|---|---|---|---|---|---|---|---|---|---|---|---|---|---|---|
Source: TrendForce, Morgan Stanley Research
Note: To be more consistent with the industry practice, WitsView changed the way it publishes panel price quotes in January 2025. It now only provides expectations of the fullmonth panel price outlook on the 5th of every month, instead of specific quotes for the first half of the month. It will then provide finalized prices for the month on the 20th of every month, which will be similar to the original 2H panel pricing quotes.
M
TV Panel Prices To Start Trending Down from 3Q26
TV panel prices started to edge up at the beginning of this year, rising 1% MoM in January, 2% MoM in February and 2% MoM in March. April, May and June were largely flat, and we expect TV panel prices to trend down from 3Q26. That said, we do not expect the decline to be significant, as supply-side discipline should provide downside support.
Source: Trendforce, Morgan Stanley Research (E) estimates
Below Seasonal Panel Shipments in 2H26
Over the past decade, TV panel shipments have averaged a 49%-51% split between 1H and 2H. In 2026, we see the mix skew toward 1H26, as TV brands restocked ahead of major promotional events, including the Winter Olympics in February, the FIFA World Cup in June-July, and China's 618 campaign. We see no clear evidence that these events will materially boost global TV demand, but shipment timing has consistently shifted across quarters around such promotions. The earlier restocking momentum since the start of the year should taper off, with panel order momentum slowing into 2H26.
Display Fab Utilization Stayed at 80-85% in 2Q26
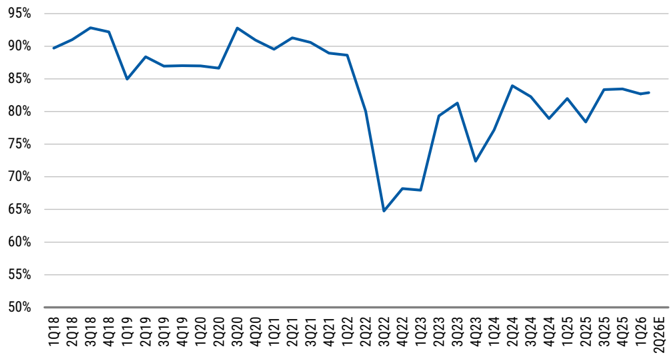
Stronger TV panel shipments supported display fab utilization at ~80% in 4Q24 and 82% in 1Q25. Utilization declined to 78% in 2Q25 as brands turned more conservative after earlier pull-ins faded and the impact of China's trade-in program eased. Utilization rebounded to 80%-85% in 3Q25 as restocking resumed for year-end promotions and stayed at similar levels in 4Q25 despite seasonal softness, as well as into 1Q26. Industry utilization remained broadly flat QoQ at 80%-85% in 2Q26, reflecting ongoing output discipline.
Over the medium to long term, we maintain the view that the display segment is undergoing structural change. Chinese panel makers have shifted from top-line growth to profitability, with fewer government subsidies reinforcing supply discipline. We believe more investors now accept that the industry's 'production-to-order' model can remain sustainable, particularly as panel price cycles shortened to quarters in 2023-24 versus multi-year cycles in the prior decade. Consolidation moves - including LG Display's sale of its Gen 8.5 Guangzhou fab to TCL and Sharp's shutdown of its Gen 10 Sakai fab - also support a healthier supply backdrop (for more information, see Display - Structural
Exhibit 3: TV Panel Price Trend (QoQ)
Source: Trendforce, Morgan Stanley Research (E) estimates
M
Changes on Supply Side Not Fairly Priced In, June 17, 2021).
Exhibit 5: Industry Average Utilization at Display Fabs
Source: WitsView, Morgan Stanley Research (E) estimates
M
Risk/Reward Remains Less Attractive
We believe this round of panel price hikes is coming to an end, and thus risk/reward is less attractive, especially for Taiwanese names. Below are our current views:
- AUO (2409.TW, Derrick Yang): We are EW on AUO, with a PT of NT$14.00, based on a 0.7x 2026e P/B multiple. Although TV panel price hikes are ongoing, we think the valuation of 1.5x 2026e P/B has priced in all favorable dynamics vs. its midcycle average of 0.8x since 2022.
- BOE (000725.SZ, Derrick Yang): We have a relative preference for BOE, owing to its scale advantage, more diversified revenue mix across applications and technologies, and relatively cheap valuation vs. its Chinese peer TCL. Our PT of Rmb5.20 is based on 1.4x 2026e P/B vs. its mid-cycle average of 1.2x since 2022, and we think the premium is justified by its solid industry position.
- Innolux (3481.TW, Derrick Yang): On its FOPLP business, we think Innolux could leverage its existing technology expertise and legacy capacity, but more meaningful contributions are likely to take time. The company also announced its April 2026 preliminary profit today as per TWSE requirements: pretax income was NT $2,313mn (+935% YoY), vs. 96%/52% of MS/consensus estimated pretax income of NT$2,408mn/NT$4,487mn for 2Q26; net profit was NT$2,159mn (+2654% YoY; EPS NT$0.27), vs. 132%/60% of MS/consensus estimated net profit of NT $1,630mn (EPS NT$0.20)/NT$3,592mn (EPS NT$0.15) for 2Q26. Though we think there should be some non-op gains in April, the number points to some upside to both MSe and consensus estimates for 2Q26.
- LG Display (034220.KS, Shawn Kim): Meaningful OLED revenue contribution should increasingly improve earnings from 2H25, but potentially weaker endmarkets keep us from turning bullish on LGD. The stock trades at 0.8x 2026e P/B vs. a historical mid-cycle level of 0.5x.
- TCL (000100.SZ, Derrick Yang): We are EW with a price target of Rmb4.70 (1.7x 2026e P/B). The stock is trading at 1.8x 2026e P/B vs. its mid-cycle average of 1.4x since 2022, so we think the panel price hike cycle has been mostly baked into its share price.
- Corning (GLW.N, Meta Marshall): GLW's display business operates efficiently and sees further margin support from additional currency-related price increases, while the optical business resumes growth as carrier fiber deployments pick up. GLW's display business closely correlates with panel maker utilization, and is its largest earnings contributor.
- Greater China DDIC supply chain implications - Novatek (3034.TW, Daniel Yen): Daniel's UW thesis is based on weaker PC, smartphone and auto demand, gross margin pressure and lack of new growth drivers. That said, Novatek's OLED DDI roadmap looks more competitive than that of its key Korean competitors on performance and cost, helping it increase its market share in Apple's iPhone supply chain.
M
Exhibit 6: AUO Share Price vs. Panel Price
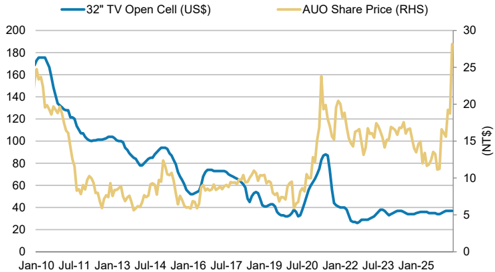
Source: Company data, WitsView, FactSet, Morgan Stanley Research
Exhibit 8: BOE Share Price vs. Panel Price
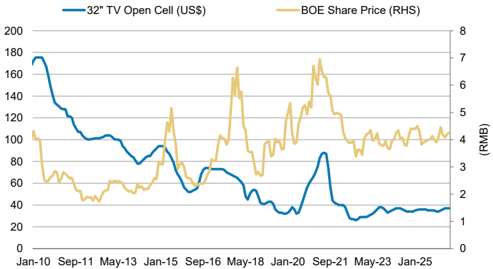
Source: Company data, WitsView, FactSet. Morgan Stanley Research
Exhibit 7: Innolux Share Price vs. Panel Price
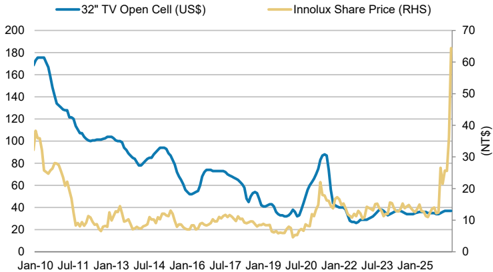
Source: Company data, WitsView, FactSet, Morgan Stanley Research
Exhibit 9: TCL Share Price vs. Panel Price
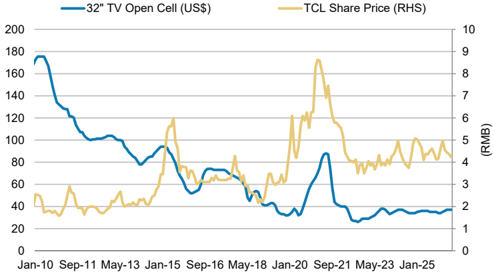
Source: Company data, WitsView, FactSet, Morgan Stanley Research
Past performance is no guarantee of future results. Results shown do not include transaction costs.
Exhibit 10: GLW Display Volumes vs. Utilization
Exhibit 11: GLW Display Revenue vs. Utilization
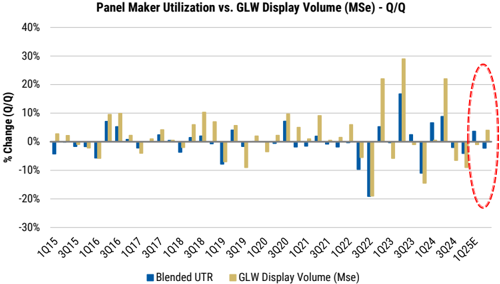
Source: Company data, WitsView, Morgan Stanley Research estimates
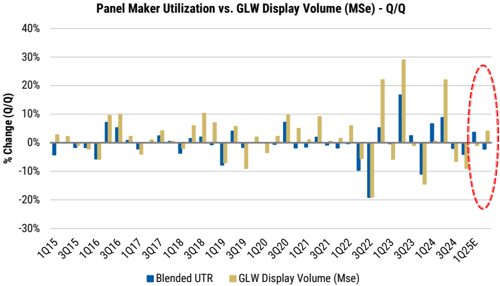
Source: Company data, WitsView, Morgan Stanley Research estimates
M
Where Could We Be Wrong?
- Stronger end-demand: If end-demand for major applications turns out to be better than expected, there could be stronger panel shipments and less panel price pressure.
- More stringent output control: If major panel makers collectively adjust utilization to an extreme extent, they could mitigate pricing pressure in the case of softer demand.
- Non-commodity display business: If the non-commodity business progresses faster than expected, panel makers could show better financial results.
Idea
M
Disclosure Section
The information and opinions in Morgan Stanley Research were prepared or are disseminated by Morgan Stanley Asia Limited (which accepts the responsibility for its contents) and/or Morgan Stanley Asia (Singapore) Pte. (Registration number 199206298Z) and/or Morgan Stanley Asia (Singapore) Securities Pte Ltd (Registration number 200008434H), regulated by the Monetary Authority of Singapore (which accepts legal responsibility for its contents and should be contacted with respect to any matters arising from, or in connection with, Morgan Stanley Research), and/or Morgan Stanley Taiwan Limited and/or Morgan Stanley & Co International plc, Seoul Branch, and/or Morgan Stanley Australia Limited (A.B.N. 67 003 734 576, holder of Australian financial services license No. 233742, which accepts responsibility for its contents), and/or Morgan Stanley Wealth Management Australia Pty Ltd (A.B.N. 19 009 145 555, holder of Australian financial services license No. 240813, which accepts responsibility for its contents), and/or Morgan Stanley India Company Private Limited having Corporate Identification No (CIN) U22990MH1998PTC115305, regulated by the Securities and Exchange Board of India ('SEBI') and holder of licenses as a Research Analyst (SEBI Registration No. INH000001105); Stock Broker (SEBI Stock Broker Registration No. INZ000244438), Merchant Banker (SEBI Registration No. INM000011203), and depository participant with National Securities Depository Limited (SEBI Registration No. IN-DP-NSDL-567-2021) having registered office at Altimus, Level 39 & 40, Pandurang Budhkar Marg, Worli, Mumbai 400018, India; Telephone no. +91-22-61181000; Compliance Officer Details: Mr. Tejarshi Hardas, Tel. No.: +91-22-61181000 or Email: tejarshi.hardas@morganstanley.com; Grievance officer details: Mr. Tejarshi Hardas, Tel. No.: +91-22-61181000 or Email: msic-compliance@morganstanley.com which accepts the responsibility for its contents and should be contacted with respect to any matters arising from, or in connection with, Morgan Stanley Research, and their affiliates (collectively, "Morgan Stanley"). Morgan Stanley India Company Private Limited (MSICPL) may use AI tools in providing research services. All recommendations contained herein are made by the duly qualified research analysts.
For important disclosures, stock price charts and equity rating histories regarding companies that are the subject of this report, please see the Morgan Stanley Research Disclosure Website at www.morganstanley.com/eqr/disclosures/webapp/generalresearch, or contact your investment representative or Morgan Stanley Research at 1585 Broadway, (Attention: Research Management), New York, NY, 10036 USA.
For valuation methodology and risks associated with any recommendation, rating or price target referenced in this research report, please contact the Client Support Team as follows: US/Canada +1 800 303-2495; Hong Kong +852 2848-5999; Latin America +1 718 754-5444 (U.S.); London +44 (0)20-7425-8169; Singapore +65 6834-6860; Sydney +61 (0)2-9770-1505; Tokyo +81 (0)3-6836-9000. Alternatively you may contact your investment representative or Morgan Stanley Research at 1585 Broadway, (Attention: Research Management), New York, NY 10036 USA.
圖片清單(已驗證 2026-07-02)
回補驗證:僅涵蓋已被 lib 頁嵌入的圖片,非全量驗證。
| 檔名 | size | 分類 | 親眼所見內容 |
|---|---|---|---|
260622_2409_3034_ms_2h-june-panel-px_002.png |
24KB | 真資料圖 | 折線圖,Y軸0-140%,X軸Jan-18至Jan-26,六條不同顏色線分別代表75" 4K、60" 4K、55" FHD、50" FHD、43" FHD、32" HD 六種面板尺寸的價格指數走勢 |
260622_2409_3034_ms_2h-june-panel-px_006.png |
45KB | 真資料圖 | 雙軸折線圖,左軸「32" TV Open Cell (US$)」0-200,右軸「AUO Share Price」(NT$) 0-30,X軸Jan-10至Jan-26,兩條線分別為面板價格與友達股價走勢 |
260622_2409_3034_ms_2h-june-panel-px_008.png |
42KB | 真資料圖 | 雙軸折線圖,左軸「32" TV Open Cell (US$)」0-200,右軸「Innolux Share Price」(NT$) 0-70,X軸Jan-10至Jan-26,兩條線分別為面板價格與群創股價走勢 |