PDF 原檔:報告_UBS_ASIC與CPU產業_20260922_original.pdf
圖片清單(已驗證 2026-09-24)
| 檔名 | size | 分類 | 親眼所見內容 |
|---|---|---|---|
報告_UBS_ASIC與CPU產業_20260922_001.png |
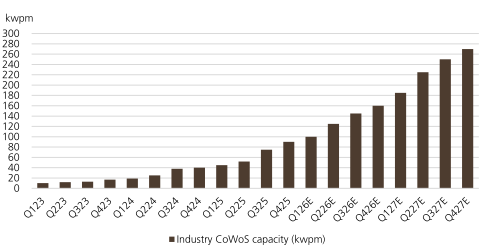
22.3KB | 真資料圖 | Figure 9:Industry CoWoS capacity 柱狀圖,Q123-Q427E 逐季,2027 年底達約 270kwpm |
報告_UBS_ASIC與CPU產業_20260922_002.png |
25.4KB | 真資料圖 | Figure 10:TSMC vs. non-TSMC CoWoS capacity 雙柱對比圖,Q123-Q427E,non-TSMC(ASE/Amkor)占比逐季提升 |
報告_UBS_ASIC與CPU產業_20260922_003.png |
29.3KB | 真資料圖 | Figure 11:Industry CoWoS capacity vs. Nvidia's volume 雙柱對比圖,Q123-Q427E |
報告_UBS_ASIC與CPU產業_20260922_004.png |
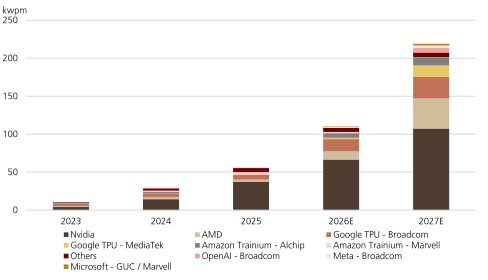
17.2KB | 真資料圖 | Figure 12:CoWoS demand from major customers 堆疊柱狀圖(Nvidia/AMD/Google TPU-Broadcom/Google TPU-MediaTek/Amazon Trainium-Alchip/Amazon Trainium-Marvell/Meta/OpenAI/Microsoft/Others),2023-2027E |
報告_UBS_ASIC與CPU產業_20260922_005.png |
24.3KB | 真資料圖 | Figure 14:N3 demand by Cloud AI vs. smartphones/PCs 堆疊柱狀圖+TSMC's N3 capacity 折線,Q126-Q427E,Cloud AI 占比持續上升 |
報告_UBS_ASIC與CPU產業_20260922_006.png |
24.1KB | 真資料圖 | Figure 15:N3 capacity share by client in 2026E 圓餅圖(Apple 38%/Nvidia 11%/Broadcom 11%/Qualcomm 7%/Intel 7%/MediaTek 3%/Others 23%) |
報告_UBS_ASIC與CPU產業_20260922_007.png |
24.7KB | 真資料圖 | Figure 16:N3 capacity share by client in 2027E 圓餅圖(Nvidia 30%/Broadcom 17%/Apple 14%/MediaTek 6%/Intel 3%/Qualcomm 2%/Others 28%),Cloud AI(Nvidia/Broadcom/MediaTek)占比較 2026E 明顯提升 |
報告_UBS_ASIC與CPU產業_20260922_008.png |
42.2KB | 真資料圖 | Figure 21:GPTC's 12M forward PE band 折線圖,Dec-14~Aug-26,Average=16.6x/+1std=24.9x/-1std=8.3x;2026 中股價本益比高點近 50x |
原始內容
UBS Global I/O Semiconductors
ASICs and CPUs move to center stage, driving the next wave o CoWoS expansion
Stronger and diversifying CoWoS capacity expansion in 2027-2
Following UBS Taiwan Summit (Day 1, Day 2&3) and our CoWoS industry analysis, we are urther raising CoWoS industry capacity to 270kwpm rom 260kwpm end-2027E, up rom 160kwpm end-2026E. Current visibility suggests requirement or urther CoWoS capacity expansion in 2028, even with Intel's EMIB-T and TSMC's CoPoS ramping or large package AI accelerator in 2028-29. We believe the trend re lects more robust Cloud AI chip demand, especially rom CPUs and ASICs, which we think should mostly stay at CoWoS in 2028-29. The migration toward larger package with heterogenous integration also consumes a lot more capacity. Meanwhile, CoWoS supply continues to diversi y, thanks to improving capabilities o OSATs and larger capacity requirement. For CoW, we view ASE's expansion to be more aggressive to reach 70kwpm capacity end o 2027E rom 20kwpm end o 2026E, vs TSMC / Amkor's CoW capacity at 180kwpm / 20kwpm end o 2027E. For WoS, as we recently highlighted, TSMC could introduce a new OSAT partner or mass production in 2028 on top o its collaboration with ASE.
ASIC efforts bearing fruit
A ter several years o investment, the large hyperscalers and AI natives are making solid progress on custom silicon or accelerator and CPU into 2027. On accelerator, Microso t's Maia 300 per ormance appears to be competitive, and we estimate Maia 200/300 units o 50/350k in 2027, up rom ~100k o total Maias in 2026. OpenAI's Jalapeño may also ramp to 600-700k units in 2027E rom 150k in 2026E. Meta's MTIA also targets higher volume to ~450k units in 2027, although visibility seems lower than Microso t and OpenAI. Large projects such as Google TPUs and Amazon Trainium are on track to reach our estimates o 9m / 3.2m packages in 2027 rom 4.1m / 2.5m in 2026E.
Upside to Nvidia and AMD's demand
We raise Nvidia's AI GPU production units in 2027 rom 8.2m to 8.8m with higher Rubin estimates and ~200k Rubin CPX units. Rubin Ultra with similar package architecture and HBM de-spec may ramp more smoothly and quickly rom mid 2027. We li t AMD's CoWoS demand in 2027E by 11% to actor in more robust ramp o the Venice server CPU, which may reach 5mn in 2027E vs our prior estimate o 4mn. We keep AMD's accelerator units at 1.9mn or 2027E due to tight supply.
Stock recommendations
Along the semiconductor supply chain or Cloud AI, our top picks are TSMC (the industry's leading Cloud AI oundry), MediaTek (design services or Google TPU with new ASIC opportunity; Key Call Buy), and ASE (advanced packaging & testing). We estimate backend, including advanced packaging, to reach ~12%/16% o TSMC sales in 2026/27E. TSMC's advanced packaging sales should sustain ~50% CAGR growth in 2026-30E even with Intel's EMIB competition. Critical equipment suppliers or advanced packaging & testing could also bene it rom aster CoWoS expansion and the trend toward larger and more complicated package structure, and we like All Ring, GPTC, Chroma, Hon Precision, and ASMPT. We lower our price target or GPTC rom NT $5,000 to NT$4,300, based on the same 33x average 2027-28E PE. We lower our GPTC EPS estimates by 25%/21%/8% in 2026/27/28E as we actor in lower tool unit or sales recognition in 2026 and lower ASP assumption. Maintain Buy as we believe GPTC will be a key bene iciary o advanced packaging capacity expansion. We like Aspeed or its strong BMC outlook, and Alchip or its Amazon Trainium3 and Trainium4 opportunities.
Equities
Asia
Semiconductors
Sunny Lin
Analyst
sunny.lin@ubs.com +886-2-8722 7346
Randy Abrams
Analyst
randy.abrams@ubs.com +886-2-8722 7338
Nicolas Gaudois
Analyst
nicolas.gaudois@ubs.com +65-6495 5148
Timothy Arcuri
Analyst
+1-415-352 5676
Jerry Su
Analyst jerry.su@ubs.com +886-28-722 7306
Ryan Sun
Analyst
ryan-za.sun@ubs.com +886-2-8722 7267
Christine Chen, CFA Associate Analyst christine.chen@ubs.com
+886-2-8722 7352
Shingo Hirata, CFA Analyst
shingo.hirata@ubs.com +81-3-5208 6224
Diana Chang
Analyst
diana.chang@ubs.com +886-2-8722 7335
Jimmy Yoon
Analyst
jimmy.yoon@ubs.com +65-6495 4617
Figure 1: Valuation comparison
| Company name | Ticker | Rating | Market cap (US$m) | Price target (LC) | Share price (LC) | EPS growth (%) - 2026E | EPS growth (%) - 2027E | P/E (x) - 2026E | P/E (x) - 2027E | P/BV (x) - 2026E | P/BV (x) - 2027E | ROE (%) - 2026E | ROE (%) - 2027E | Dividend yield (%) - 2026E | Dividend yield (%) - 2027E |
|---|---|---|---|---|---|---|---|---|---|---|---|---|---|---|---|
| Foundry | |||||||||||||||
| TSMC | 2330.TW | Buy | 2,004,651 | 3,650 | 2,460 | 64.5 | 36.9 | 22.6 | 16.5 | 8.4 | 6.1 | 43.4 | 42.7 | 0.9 | 1.2 |
| Fabless | |||||||||||||||
| Alchip | 3661.TW | Buy | 9,048 | 6,600 | 3,540 | 130.9 | 38.3 | 22.1 | 16.0 | 4.4 | 3.7 | 24.4 | 25.3 | 1.0 | 0.9 |
| Aspeed | 5274.TWO | Buy | 22,915 | 22,000 | 19,290 | 81.8 | 73.9 | 102.1 | 58.7 | 65.5 | 39.8 | 77.5 | 84.3 | 0.4 | 0.7 |
| GUC | 3443.TW | Buy | 30,096 | 6,700 | 7,150 | 106.2 | 86.3 | 123.3 | 66.2 | 53.1 | 32.8 | 50.2 | 61.4 | 0.2 | 0.3 |
| MediaTek | 2454.TW | Buy | 237,389 | 6,500 | 4,710 | 2.2 | 168.4 | 69.7 | 26.0 | 16.9 | 13.0 | 25.5 | 56.5 | 1.1 | 1.1 |
| Semi-backend | |||||||||||||||
| ASE | 3711.TW | Buy | 89,175 | 835 | 638 | 102.4 | 63.8 | 33.7 | 20.5 | 6.4 | 5.4 | 21.2 | 28.5 | 1.0 | 1.9 |
| KYEC | 2449.TW | Buy | 11,200 | 325 | 292 | 40.5 | 61.9 | 31.9 | 19.7 | 5.8 | 4.9 | 19.9 | 26.9 | 2.0 | 2.0 |
| Equipment | |||||||||||||||
| All Ring | 6187.TWO | Buy | 3,831 | 1,700 | 1,250 | 98.6 | 57.4 | 41.2 | 26.2 | 13.1 | 10.2 | 35.6 | 43.9 | 0.9 | 1.7 |
| ASMPT | 0522.HK | Buy | 8,882 | 200 | 168 | 97.3 | 47.7 | 33.4 | 22.6 | 3.8 | 3.5 | 11.8 | 16.0 | 0.8 | 1.6 |
| Chroma ATE | 2360.TW | Buy | 30,616 | 2,960 | 2,290 | 63.6 | 37.5 | 50.5 | 36.7 | 27.9 | 20.3 | 57.6 | 64.0 | 0.4 | 0.9 |
| GPTC | 3131.TWO | Buy | 2,245 | 4,300 | 2,445 | 29.6 | 66.7 | 41.5 | 24.9 | 25.8 | 16.1 | 45.5 | 79.6 | 1.9 | 1.7 |
| Hon Precision | 7769.TW | Buy | 36,978 | 10,000 | 6,540 | 71.1 | 85.5 | 50.1 | 27.0 | 16.0 | 11.7 | 35.8 | 50.1 | 0.8 | 1.4 |
Source: LSEG, UBS estimates. Note: Priced as o 18 Sept 2026.
Figure 2: Total CoWoS interposer wafer demand
| Interposer Wafer Demand (kps) | Q126 | Q226 | Q326E | Q426E | Q127E | Q227E | Q327E | Q427E | 2024 | 2025 | 2026E | 2027E |
|---|---|---|---|---|---|---|---|---|---|---|---|---|
| Nvidia | 128 | 154 | 231 | 286 | 274 | 300 | 342 | 374 | 174 | 444 | 799 | 1,290 |
| AMD | 11 | 11 | 30 | 77 | 91 | 122 | 124 | 138 | 37 | 42 | 129 | 475 |
| ASICs and others | 79 | 98 | 106 | 110 | 173 | 216 | 233 | 242 | 147 | 193 | 393 | 865 |
| Google TPU - Broadcom | 60 | 76 | 195 | 338 | ||||||||
| Google TPU - MediaTek | 0 | 0 | 21 | 182 | ||||||||
| Amazon Trainium - Alchip | 26 | 5 | 71 | 131 | ||||||||
| Amazon Trainium - Marvell | 17 | 38 | 21 | 3 | ||||||||
| Meta | 7 | 8 | 9 | 41 | ||||||||
| OpenAI | 0 | 0 | 8 | 70 | ||||||||
| Microsoft | 1 | 1 | 7 | 29 | ||||||||
| Others | 37 | 65 | 62 | 72 | ||||||||
| Total | 218 | 264 | 367 | 473 | 538 | 637 | 700 | 755 | 358 | 679 | 1,321 | 2,630 |
Source: Company data, UBS estimates
Figure 3: Breakdown of CoWoS demand
| ASIC vendor as a % of CoWoS wafers demand | 2024 | 2025 | 2026E | 2027E |
|---|---|---|---|---|
| 17% | 11% | 16% | 20% | |
| Broadcom | 17% | 11% | 15% | 13% |
| MediaTek | 0% | 0% | 2% | 7% |
| Amazon | 12% | 6% | 7% | 5% |
| Alchip | 7% | 1% | 5% | 5% |
| Marvell | 5% | 6% | 2% | 0% |
| Meta | 2% | 1% | 1% | 2% |
| Intel / Habana | 2% | 1% | 0% | 0% |
| Microsoft | 0% | 0% | 1% | 1% |
| OpenAI | 0% | 0% | 1% | 3% |
| Tesla | 0% | 0% | 0% | 0% |
| Others | 8% | 9% | 5% | 3% |
| Total ASIC | 41% | 28% | 30% | 33% |
| GPU vendors as a % of CoWoS wafers demand | ||||
| Nvidia | 49% | 65% | 60% | 49% |
| AMD | 10% | 6% | 10% | 18% |
| Total GPU | 59% | 72% | 70% | 67% |
| Total | 100% | 100% | 100% | 100% |
Source: Company data, UBS estimates
Figure 4: Nvidia's supply chain build units
| Nvidia Supply Chain Build Units (k chips) | Q126 | Q226 | Q326E | Q426E | Q127E | Q227E | Q327E | Q427E | 2024 | 2025 | 2026E | 2027E |
|---|---|---|---|---|---|---|---|---|---|---|---|---|
| Ampere | 0 | 0 | 0 | 0 | 0 | 0 | 0 | 0 | 134 | 0 | 0 | 0 |
| Hopper | 180 | 251 | 215 | 100 | 0 | 0 | 0 | 0 | 4,086 | 1,402 | 747 | 0 |
| Blackwell B200/B300 and GB200/GB300 | 1,703 | 1,855 | 1,715 | 953 | 350 | 111 | 81 | 0 | 314 | 5,520 | 6,225 | 542 |
| Rubin R200 and VR200 | 0 | 70 | 678 | 1,399 | 1,676 | 1,814 | 1,497 | 844 | 0 | 0 | 2,148 | 5,832 |
| Rubin R300 and VR300 | 0 | 0 | 0 | 0 | 0 | 137 | 639 | 1,416 | 0 | 0 | 0 | 2,193 |
| Rubin CPX | 0 | 0 | 0 | 26 | 61 | 71 | 40 | 45 | 0 | 0 | 26 | 217 |
| Vera CPU | 0 | 100 | 428 | 1,054 | 1,025 | 1,180 | 1,543 | 1,754 | 0 | 0 | 1,582 | 5,502 |
| Total | 1,883 | 2,276 | 3,036 | 3,532 | 3,112 | 3,313 | 3,800 | 4,060 | 4,534 | 6,921 | 10,728 | 14,286 |
Source: Company data, UBS estimates
Figure 5: AMD's supply chain build units
| AMD Supply Chain Build Units (k chips) | Q126 | Q226 | Q326E | Q426E | Q127E | Q227E | Q327E | Q427E | 2024 | 2025 | 2026E | 2027E |
|---|---|---|---|---|---|---|---|---|---|---|---|---|
| MI300 + MI325X + MI308X+MI355X | 163 | 170 | 87 | 89 | 93 | 82 | 15 | 4 | 544 | 626 | 510 | 194 |
| MI400 | 0 | 0 | 38 | 225 | 295 | 433 | 415 | 369 | 0 | 0 | 263 | 1,510 |
| MI500 | 0 | 0 | 0 | 0 | 0 | 0 | 66 | 177 | 0 | 0 | 0 | 242 |
| Venice CPU | 0 | 0 | 400 | 900 | 1,000 | 1,300 | 1,300 | 1,400 | 0 | 0 | 1,300 | 5,000 |
| Others | 1 | 1 | 1 | 2 | 2 | 3 | 3 | 4 | 11 | 4 | 6 | 13 |
| Total | 164 | 171 | 526 | 1,217 | 1,390 | 1,817 | 1,799 | 1,954 | 555 | 630 | 2,079 | 6,960 |
Source: Company data, UBS estimates
Figure 6: ASIC's supply chain build units
| ASIC Supply Chain Build Units (k chips) | 2024 | 2025 | 2026E | 2027E |
|---|---|---|---|---|
| Google TPU - Broadcom | 2,045 | 2,565 | 3,680 | 5,000 |
| Google TPU - MediaTek | 0 | 0 | 467 | 4,000 |
| Amazon Trainium - Alchip | 1,000 | 176 | 1,780 | 3,080 |
| Amazon Trainium - Marvell | 600 | 1,335 | 686 | 85 |
| Meta | 348 | 421 | 165 | 445 |
| Microsoft | 26 | 34 | 104 | 400 |
| OpenAI | 0 | 0 | 150 | 650 |
| Others | 251 | 188 | 64 | 0 |
| Total | 4,270 | 4,719 | 7,096 | 13,660 |
Source: Company data, UBS estimates. Note: Others include Intel's Habana, Tesla's Dojo, etc.
Figure 7: SoIC volume
| SoIC (kps) | Q126 | Q226 | Q326E | Q426E | Q127E | Q227E | Q327E | Q427E | 2024 | 2025 | 2026E | 2027E |
|---|---|---|---|---|---|---|---|---|---|---|---|---|
| SoIC volume | 14 | 17 | 23 | 29 | 44 | 52 | 57 | 61 | 20 | 42 | 83 | 214 |
Source: Company data, UBS estimates
Figure : TSMC's back-end sales analysis
| TSMC's backend sales (US$m) | Q126 | Q226 | Q326E | Q426E | Q127E | Q227E | Q327E | Q427E | 2024 | 2025 | 2026E | 2027E |
|---|---|---|---|---|---|---|---|---|---|---|---|---|
| Sales from adv packaging | 2,704 | 3,247 | 4,437 | 5,766 | 6,295 | 7,462 | 8,347 | 9,258 | 5,240 | 8,899 | 16,154 | 31,362 |
| Sales from bumping & testing | 919 | 1,019 | 1,162 | 1,278 | 1,329 | 1,462 | 1,609 | 1,705 | 2,348 | 3,156 | 4,379 | 6,105 |
| Total TSMC's backend sales | 3,623 | 4,266 | 5,599 | 7,044 | 7,624 | 8,924 | 9,956 | 10,963 | 7,588 | 12,056 | 20,533 | 37,467 |
| % of TSMC's sales | 10.1% | 10.6% | 12.3% | 14.0% | 14.6% | 15.5% | 15.7% | 16.3% | 8.4% | 9.8% | 11.9% | 15.6% |
Source: Company data, UBS estimates
Figure 9: Industry CoWoS capacity
Source: Company data, UBS estimates
Figure 10: TSMC vs. non-TSMC CoWoS capacity
Source: Company data, UBS estimates. Note: Non-TSMC CoWoS capacity includes ASE and Amkor.
Figure 11: Industry CoWoS capacity vs. Nvidia's volume
Source: Company data, UBS estimates
Figure 13: N3 supply & demand analysis
| Client | Products | Die size (mm2) | N3 - Q126E | N3 - Q226E | N3 - Q326E | N3 - Q426E | N3 - 2026 demand (k) capacity | N3 - Q127E requirement | N3 - Q227E (kwpm) | N3 - Q327E | N3 - Q427E | N3 - 2027 demand (k) |
|---|---|---|---|---|---|---|---|---|---|---|---|---|
| Nvidia | Rubin | 1,628 | 0 | 2 | 15 | 31 | 141 | 37 | 40 | 33 | 19 | 384 |
| Rubin Ultra | 1,628 | 0 | 0 | 0 | 0 | 0 | 0 | 4 | 16 | 36 | 169 | |
| Vera CPU | 800 | 0 | 1 | 5 | 11 | 51 | 11 | 13 | 17 | 19 | 178 | |
| Broadcom | Google - TPU v7 Ironwood | 1,400 | 6 | 11 | 16 | 21 | 158 | 14 | 8 | 6 | 0 | 85 |
| Google - TPU v8i | 1,400 | 0 | 0 | 2 | 4 | 18 | 7 | 17 | 25 | 35 | 250 | |
| Meta - MTIA v3 | 1,600 | 0 | 1 | 1 | 2 | 11 | 2 | 2 | 3 | 3 | 29 | |
| OpenAI | 1,600 | 0 | 0 | 0 | 3 | 10 | 3 | 3 | 3 | 3 | 32 | |
| AMD | MI355 | 840 | 2 | 2 | 1 | 1 | 17 | 1 | 1 | 0 | 0 | 7 |
| Alchip | Amazon - Trainium 3 | 1,600 | 0 | 4 | 12 | 23 | 115 | 24 | 18 | 12 | 6 | 181 |
| Marvell | Amazon - Trainium 2.5 | 1,600 | 0 | 0 | 0 | 2 | 6 | 0 | 0 | 0 | 0 | 2 |
| MediaTek | Google - TPU v8t | 800 | 0 | 0 | 1 | 4 | 15 | 9 | 11 | 11 | 13 | 129 |
| Other CPUs / accelerators and products like networking | Other CPUs / accelerators and products like networking | Other CPUs / accelerators and products like networking | 2 | 4 | 10 | 20 | 109 | 22 | 23 | 25 | 33 | 310 |
| Capacity requirement - Cloud AI (kwpm) | Capacity requirement - Cloud AI (kwpm) | Capacity requirement - Cloud AI (kwpm) | 9 | 24 | 62 | 122 | 652 | 130 | 140 | 151 | 167 | 1,763 |
| % of N3 demand | % of N3 demand | % of N3 demand | 7% | 18% | 38% | 64% | 36% | 69% | 72% | 73% | 76% | 73% |
| Apple | iPhone's apps processor | 110 | 43 | 43 | 39 | 22 | 442 | 13 | 11 | 9 | 10 | 128 |
| Mac's processor | 165 | 10 | 10 | 8 | 7 | 106 | 7 | 6 | 6 | 6 | 74 | |
| iPad's M processor for Pro & Air | 160 | 14 | 12 | 12 | 8 | 135 | 11 | 10 | 8 | 8 | 111 | |
| iPad's A17 Pro processor | 104 | 2 | 2 | 1 | 1 | 15 | 3 | 2 | 2 | 2 | 30 | |
| Qualcomm | Flagship smartphone SoC | 120 | 17 | 13 | 9 | 3 | 129 | 5 | 5 | 4 | 3 | 51 |
| MediaTek | 5G smartphone SoC | 120 | 5 | 4 | 3 | 1 | 39 | 2 | 2 | 2 | 1 | 19 |
| Intel | Outsourced PC CPUs | 100 | 15 | 15 | 8 | 8 | 137 | 8 | 8 | 5 | 4 | 70 |
| Others like Bitcoin, tablet, ARM based PC CPU | Others like Bitcoin, tablet, ARM based PC CPU | Others like Bitcoin, tablet, ARM based PC CPU | 10 | 10 | 20 | 20 | 180 | 10 | 10 | 20 | 20 | 180 |
| Capacity requirement - Consumer and other devices (kwpm) | Capacity requirement - Consumer and other devices (kwpm) | Capacity requirement - Consumer and other devices (kwpm) | 116 | 109 | 100 | 69 | 1,183 | 60 | 53 | 55 | 53 | 663 |
| % of N3 demand | % of N3 demand | % of N3 demand | 93% | 82% | 62% | 36% | 64% | 31% | 28% | 27% | 24% | 27% |
| Total N3 demand | Total N3 demand | Total N3 demand | 125 | 133 | 162 | 191 | 1,834 | 190 | 193 | 206 | 220 | 2,426 |
| TSMC's N3 installed capacity | TSMC's N3 installed capacity | TSMC's N3 installed capacity | 120 | 130 | 150 | 170 | 1,710 | 170 | 185 | 195 | 210 | 2,280 |
| Capacity utilisation | Capacity utilisation | Capacity utilisation | 104% | 102% | 108% | 113% | 107% | 112% | 104% | 106% | 105% | 106% |
Source: Company data, UBS estimates. Note: kwpm stands or thousands o wa ers per month.
Figure 12: CoWoS demand from major customers
Source: Company data, UBS estimates
kwpm
Figure 14: TSMC is accelerating N3 capacity expansion to meet strong demand from cloud AI
Source: Company data, UBS estimates
Figure 15: N3 capacity share by client in 2026E
Source: Company data, UBS estimates
Figure 16: N3 capacity share by client in 2027E
Source: Company data, UBS estimates
Figure 17: Summary of major advanced packaging equipment vendors
| Product category | Ticker | Company name | Market cap (US$m) | Share price (LCY) | Stock YTD performance | P/E (x) - 2026E | P/E (x) - 2027E | P/E (x) - 2028E | Major equipment offering(s) |
|---|---|---|---|---|---|---|---|---|---|
| Die attach | 0522.HK | ASMPT | 8,882 | HKD 168.1 | 117.0% | 33.4 | 22.6 | 18.2 | • Die bonder for on-substrate (mass reflow) • Thermo-compression bonder (Chip-to-substrate/Chip-to- wafer) • Hybrid bonder |
| Die attach | BESI.AS | BE Semiconductor Industries | 16,518 | € 186.7 | 39.6% | 43.1 | 28.5 | 18.5 | • Hybrid bonder • Thermo-compression bonder • Flip chip bonder |
| Die attach | 042700.KS | Hanmi Semiconductor | 16,206 | KRW 236,000.0 | 85.2% | 70.0 | 44.5 | 37.2 | • Thermo-compression bonder |
| Die attach | KLIC.O | Kulicke and Soffa | 6,383 | $83.1 | 82.5% | 21.5 | 14.1 | 15.5 | • Thermo-compression bonder (Chip-to-substrate/Chip-to- wafer) • Ball bonder in InFO |
| Die attach | 6590.T | Shibaura Mechatronics | 1,698 | JPY 3,790.0 | 0.1% | 16.4 | 12.4 | 8.7 | • Die bonder for chip-on-wafer (mass reflow) • Hybrid bonder |
| 3131.TWO | Grand Process Technology | 2,245 | TWD 2,445.00 | 56.7% | 41.5 | 24.9 | 15.1 | • Wet process cleaning tool | |
| Wet process | 3583.TW | Scientech | 1,848 | TWD 702.00 | 110.2% | 35.3 | 23.7 | 16.7 | • Wet process cleaning tool • Temporary bonding/debonding system |
| Underfill | 6187.TWO | All Ring | 3,831 | TWD 1,250.00 | 243.4% | 41.2 | 26.2 | 16.0 | • Underfill dispenser • Automated optical inspection (AOI) tool |
| Underfill | NDSN.O | Nordson Corporation | 17,819 | $311.6 | 29.6% | 26.2 | 24.1 | 21.8 | • Underfill dispenser |
| Metrology | 2360.TW | Chroma ATE | 30,566 | TWD 2,290.00 | 195.5% | 51.4 | 34.3 | 26.4 | • Redistribution layer measurement |
| Temporary bondingSMHNn.DE | Temporary bondingSMHNn.DE | SÜSS MicroTec | 1,493 | € 68.1 | 73.9% | 34.5 | 21.4 | 16.1 | • Temporary bonding/debonding system |
Source: Company data, LSEG, UBS estimates. Share price in local currency. Note: Asian stocks priced as o 18 Sept 2026; non-Asian stocks priced as o 18 Sept 2026. EPS estimates or non-covered (Kulicke and So a, Shibaura Mechatronics, Scientech, Nordson Corporation) companies are based on LSEG consensus orecasts.
Forecast changes - GPTC
Figure 1 : Revisions to our earnings estimates - GPTC
| (NT$m) | New - 2026E | New - 2027E | New - 2028E | Old - 2026E | Old - 2027E | Old - 2028E | Change - 2026E | Change - 2027E | Change - 2028E |
|---|---|---|---|---|---|---|---|---|---|
| Revenue | 8,072 | 13,052 | 20,473 | 10,363 | 15,873 | 22,521 | -22% | -18% | -9% |
| - YoY chg (%) | 24% | 62% | 57% | 59% | 53% | 42% | |||
| Gross profit | 3,163 | 5,776 | 9,233 | 4,239 | 7,106 | 10,167 | -25% | -19% | -9% |
| - Gross margin | 39.2% | 44.3% | 45.1% | 40.9% | 44.8% | 45.1% | 2% | 1% | 0% |
| Operating profit | 1,720 | 3,557 | 5,884 | 2,419 | 4,407 | 6,338 | -29% | -19% | -7% |
| - Operating margin | 21.3% | 27.3% | 28.7% | 23.3% | 27.8% | 28.1% | 2% | 1% | -1% |
| Pre-tax profit | 2,132 | 3,555 | 5,878 | 2,815 | 4,432 | 6,355 | -24% | -20% | -8% |
| Reported net profit | 1,703 | 2,844 | 4,702 | 2,251 | 3,545 | 5,084 | -24% | -20% | -8% |
| - Net margin | 21.1% | 21.8% | 23.0% | 21.7% | 22.3% | 22.6% | |||
| Reported EPS (NT$) | 58.90 | 98.17 | 162.32 | 78.45 | 123.59 | 177.23 | -25% | -21% | -8% |
| - YoY chg (%) | 30% | 67% | 65% | 73% | 58% | 43% |
Source: UBS estimates
Figure 19: Our revised earnings estimates vs. consensus - GPTC
| (NT$m) | UBS - 2026E | UBS - 2027E | UBS - 2028E | Consensus - 2026F | Consensus - 2027F | Consensus - 2028F | Difference - 2026E | Difference - 2027E | Difference - 2028E |
|---|---|---|---|---|---|---|---|---|---|
| Revenue | 8,072 | 13,052 | 20,473 | 8,129 | 12,480 | 15,772 | -1% | 5% | 30% |
| - YoY chg (%) | 24% | 62% | 57% | 25% | 54% | 26% | |||
| Gross profit | 3,163 | 5,776 | 9,233 | 3,149 | 5,242 | 6,840 | 0% | 10% | 35% |
| - Gross margin | 39.2% | 44.3% | 45.1% | 38.7% | 42.0% | 43.4% | |||
| Operating profit | 1,720 | 3,557 | 5,884 | 1,744 | 3,300 | 4,617 | -1% | 8% | 27% |
| - Operating margin | 21.3% | 27.3% | 28.7% | 21.4% | 26.4% | 29.3% | |||
| Pretax profit | 2,132 | 3,555 | 5,878 | 2,147 | 3,327 | 4,644 | -1% | 7% | 27% |
| Net profit | 1,703 | 2,844 | 4,702 | 1,736 | 2,644 | 3,681 | -2% | 8% | 28% |
| - Net margin | 21.1% | 21.8% | 23.0% | 21.4% | 21.2% | 23.3% | |||
| Basic EPS (NT$) | 58.90 | 98.17 | 162.32 | 60.08 | 91.19 | 126.84 | -2% | 8% | 28% |
| - YoY chg (%) | 30% | 67% | 65% | 32% | 52% | 39% |
Source: Visible Alpha, UBS estimates
Figure 20: UBS earnings forecasts - GPTC
| (NT$m) | 2025 | Q126 | Q226 | Q326E | Q426E | 2026E | Q127E | Q227E | Q327E | Q427E | 2027E | 2028E | 2029E | 2030E |
|---|---|---|---|---|---|---|---|---|---|---|---|---|---|---|
| Revenue | 6,514 | 1,596 | 1,727 | 2,283 | 2,466 | 8,072 | 2,813 | 3,172 | 3,484 | 3,583 | 13,052 | 20,473 | 25,888 | 29,837 |
| - YoY chg (%) | 60% | 29% | 6% | 53% | 15% | 24% | 76% | 84% | 53% | 45% | 62% | 57% | 26% | 15% |
| - QoQ chg (%) | -26% | 8% | 32% | 8% | 14% | -61% | 24% | 13% | ||||||
| Gross profit | 2,681 | 539 | 671 | 921 | 1,032 | 3,163 | 1,240 | 1,401 | 1,542 | 1,592 | 5,776 | 9,233 | 11,684 | 13,464 |
| - Gross margin | 41.2% | 33.8% | 38.9% | 40.3% | 41.9% | 39.2% | 44.1% | 44.2% | 44.3% | 44.4% | 44.3% | 45.1% | 45.1% | 45.1% |
| Operating profit | 1,636 | 210 | 365 | 532 | 613 | 1,720 | 762 | 862 | 950 | 983 | 3,557 | 5,884 | 7,542 | 8,989 |
| - Operating margin | 25.1% | 13.2% | 21.1% | 23.3% | 24.9% | 21.3% | 27.1% | 27.2% | 27.3% | 27.4% | 27.3% | 28.7% | 29.1% | 30.1% |
| Pre-tax profit | 1,690 | 580 | 406 | 533 | 612 | 2,132 | 762 | 862 | 949 | 982 | 3,555 | 5,878 | 7,532 | 8,979 |
| Net profit | 1,327 | 463 | 324 | 427 | 490 | 1,703 | 609 | 689 | 759 | 786 | 2,844 | 4,702 | 6,026 | 7,183 |
| - YoY chg (%) | 57% | 81% | 57% | 40% | -13% | 28% | 32% | 113% | 78% | 60% | 67% | 65% | 28% | 19% |
| - QoQ chg (%) | -18% | -30% | 32% | 15% | 24% | -60% | 25% | 14% | ||||||
| Basic EPS (NT$) | 45.45 | 16.11 | 11.18 | 14.72 | 16.90 | 58.90 | 21.03 | 23.80 | 26.21 | 27.12 | 98.17 | 162.32 | 208.00 | 247.95 |
| - YoY chg (%) | 56% | 84% | 58% | 42% | -12% | 30% | 31% | 113% | 78% | 60% | 67% | 65% | 28% | 19% |
| - QoQ chg (%) | -16% | -31% | 32% | 15% | 24% | -60% | 25% | 14% |
Source: Company data, UBS estimates
Figure 21: GPTC's 12M forward PE band (x)
Source: LSEG, UBS
Valuation Method and Risk Statement
Tech investing involves risk. It is di icult or the investment community, UBS included, to project the inancial results o tech companies, as their operating models are highly volatile and unpredictable, and they compete in a highly dynamic marketplace. In addition to their low predictability, valuing tech stocks can be challenging because neither traditional nor nontraditional valuation measures have provided much insight into how tech stocks trade. We value GPTC based on PE methodology.
Downside risks include: 1) slower-than-expected CoWoS capacity expansion; 2) competitors achieving technological advancements; 3) geopolitical uncertainty; and 4) worse-thanexpected AI growth.
Quantitative Research Review
UBS Global Research publishes a quantitative assessment o its analysts' responses to certain questions about the likelihood o an occurrence o a number o short term actors in a product known as the 'Quantitative Research Review'. The views or this month can be ound below. Views contained in this assessment on a particular stock re lect only the views on those short term actors which are a di erent time rame to the 12-month time rame re lected in any equity rating set out in this note. For previous responses please make re erence to (i) previous UBS Global Research reports; and (ii) where no applicable research report was published that month, the Quantitative Research Review which can be ound at https://neo.ubs.com/quantitative, or contact your UBS sales representative or access to the report or the Quantitative Research Team on ubs-quant-answers@ubs.com. A consolidated report which contains all responses is also available and again you should contact your UBS sales representative or details and pricing or the Quantitative Research Team on the email above.
Grand Process Technology
| Question | Response |
|---|---|
| 1. Is the industry structure facing the firm likely to improve or deteriorate over the next six months? Rate on a scale of 1-5 (1 = getting worse, 3 = no change, 5 = getting better, N/A = no view) | 4 |
| 2. Is the regulatory/government environment facing the firm likely to improve or deteriorate over the next six months? Rate on a scale of 1-5 (1 = getting tougher 3 = no change, 5 = getting better, N/A = no view) | 3 |
| 3. Over the last 3-6 months in broad terms have things been improving/no change/getting worse for this stock? Rate on a scale of 1-5 (1 = getting a lot worse, 3 = not much change, 5 = getting a lot better, N/A = no view) | 3 |
| 4. Relative to the current CONSENSUS EPS forecast, is the next company EPS update likely to lead to: (1 = negative surprise vs consensus, 3 = in-line with consensus, 5 = positive surprise vs consensus expectations, N/A = no view) | 3 |
| 5. What's driving the difference? | |
| 6. Relative to YOUR current earnings forecast, is there relatively greater risk at the next earnings result of:(1 = downside skew risk to earnings, 3 = equal upside or downside risk to earnings, 5 = upside skew risk to earnings, N/A = no view) | 3 |
| . What's driving the difference? | |
| 8. Is there an upcoming catalyst for the company over the next three months? | No Catalyst |
| 9. Is there an actual or approximate date for the catalyst? | |
| 10. Is the catalyst date an actual or approximate date? | |
| 11. What is the catalyst? |