PDF 原檔:報告_UBS_穩懋3105_20261002_original.pdf
圖片清單(已驗證 2026-10-06)
ingest 時建立的「眼見為憑」圖片索引,是 lib/ 嵌圖的唯一真相來源;建立步驟見
ingest_steps.mdStep 2.5。
| 檔名 | size | 分類 | 親眼所見內容 |
|---|---|---|---|
報告_UBS_穩懋3105_20261002_001.png |
39KB | 真資料圖(估值情境) | 股價走勢加 12 個月情境區塊:現價 TWD 538.0(10/1),上檔 1000.0(+86%)、基本 725.0(+35%)、下檔 345.0(-36%),上下檔比 2.4 比 1 |
報告_UBS_穩懋3105_20261002_002.png |
27KB | 真資料圖 | 兩顆衛星示意圖:V2(2023 年 2 月發射,下行容量 96 GBPS)與 V3(目標 2026 年發射,下行容量 1,024 GBPS),V3 太陽能板明顯較長 |
報告_UBS_穩懋3105_20261002_003.png |
36KB | 真資料圖 | Falcon 9/Falcon Heavy/Starship 規格比較表(高度、直徑、質量、LEO/GTO/火星酬載、飛行次數、首飛日),Starship 全可重複使用、LEO 酬載標 100+ Mt |
報告_UBS_穩懋3105_20261002_004.png |
37KB | 真資料圖 | Starlink V3 與 V2/V2 Mini 天線系統表:V3 Ku 相位陣列 5 片×2,048 元件、gateway 4 片×1,024 元件,合計 PA 14,336/LNA 18,432;V2 Ku 5 片×512、gateway 3 片×256,合計 PA 3,328/LNA 4,096 |
報告_UBS_穩懋3105_20261002_005.png |
42KB | 真資料圖(財務) | 2017–2030E 營收堆疊柱(Mobile PA/WiFi PA/Infrastructure/VCSEL-Optical/Other)加毛利率折線,2030E 營收約 4.4 萬(NT$mn)、毛利率約 39% |
報告_UBS_穩懋3105_20261002_006.png |
29KB | 真資料圖(財務) | 稼動率(柱)與毛利率(線)2016–2030E,稼動率 2023 谷底後回升至 2030E 約 90% 以上 |
報告_UBS_穩懋3105_20261002_007.png |
35KB | 真資料圖(財務) | 營收(柱)與毛利率、營益率(線)2016–2030E,營益率 2023 年約 0% 後回升至 2030E 約 26% |
報告_UBS_穩懋3105_20261002_008.png |
35KB | 真資料圖(財務) | 2013-09 至 2026-09 股價與 NTM P/E,平均 22x、+1 標準差 34x、-1 標準差 9x |
報告_UBS_穩懋3105_20261002_009.png |
39KB | 真資料圖(財務) | 股價與外資(QFII)持股比重 2012–2026,外資持股 2021 年約 53% 高點後降至 2025 年約 17%,近期回升 |
報告_UBS_穩懋3105_20261002_010.png |
58KB | 真資料圖(財務) | 2023-08 至 2026-10 目標價(藍階梯線)與股價(黑線)走勢,下方評等條:Neutral 至 2026-07 末改 Buy |
原始內容
WIN Semiconductors
LEO satellite drives the next leg of growth
Significant RF content growth opportunity on Starlink V3/ obile V2 upgrades
We reiterate Buy on Win Semi, which we view as one of the clearest long-term eneficiaries of the Low Earth Or it (LEO) satellite upgrade cycle. We elieve Starlink's transition to V3 satellites and Mo ile V2 platforms will materially increase RF content, driven y higher throughput, enhanced ackhaul capa ility, and roader direct-to-cell (D2C) adoption. Based on our analysis, total power amplifier (PA) and low noise amplifier (LNA) content per V3 satellite could increase y ~4-5x vs V2. More importantly, the shift toward higher performance compound semiconductor technology implies the consumption of GaAs and GaN materials could increase y ~6-7x per satellite. We elieve the ramp in V3 and Mo ile V2 deployments will emerge as a key earnings driver for WIN Semi over the next several years. We raise our 2027E/28E EPS y 23%/31%, placing us 38%/45% a ove consensus, and lift our PT to NT$725 from NT$500.
Infrastructure business to reach nearly half of total of sales in 2028E
We elieve Win Semi is uniquely positioned to capitalize on Starlink's V3 and Mo ile V2 ramp given its leadership in oth GaAs and GaN foundry. We estimate LEO satellites will contri ute ~10% of total sales (~30% of infra revenue) in 2026E, and accelerate to ~30% in 2028E, lifting overall infrastructure segment contri ution to reach ~50% of total sales in 2028E from ~35% this year. We also elieve the faster growth of infrastructure sales and adoption of GaN PA for V3 satellite (10-20 ppt higher GM than GaAs PA) should drive overall GM to expand from 29.4% in 2026E to 37.1% y 2028E.
Optical business on track to ramp from H226E
WIN Semi started mass production of photodiodes (PD) in late Q226 and remains on track for a more meaningful production ramp in H226F. While CW laser and EML products remain under qualification with more meaningful sales contri ution from 2027F and eyond, we elieve the PD ramp alone should support overall optical sales to reach 18% of total sales in 2028E (vs 11% in 2025). This should help overall AI/datacom revenue (optical driver, PIC, laser diode, PD, and etc) exposure to reach mid-teens % of total sales in 2028E, up from a low-single-digit contri ution in 2025. Together with the PD ramp and resilient cellular demand, we expect WIN Semi's Q426E sales to remain ro ust for +1% QoQ, ahead of a seasonal mid- to high-single % QoQ decline.
Valuation: Retain Buy, raise PT to NT$725
We raise Win Semi's earnings growth to 72%/31% YoY in 2027/28E and PT to NT$725 (from NT$500), as we roll over to 40x 2028E PE (from 40x average 2027-28E) vs historical range of 10-57x, supported y a 2025-30E EPS CAGR of 44%. We reiterate Buy, as Win Semi is well positioned to capture LEO satellite and optical communication growth opportunities in 2026-30E, while its margins should further advance on etter product mix and operating leverage. We view Q326 results as the next catalyst, if mgmt. provides stronger Q426 and 2027 outlook on greater visi ility on LEO content upgrade.
| Highlights (NT$m) | 12/23 | 12/24 | 12/25 | 12/26E | 12/27E | 12/28E | 12/29E | 12/30E |
|---|---|---|---|---|---|---|---|---|
| Revenues | 15,836 | 17,458 | 16,639 | 21,657 | 29,170 | 34,830 | 39,346 | 44,130 |
| EBIT (UBS) | (56) | 762 | 715 | 3,246 | 6,617 | 8,958 | 10,572 | 12,496 |
| Net earnings (UBS) | (80) | 768 | 1,694 | 3,409 | 5,860 | 7,671 | 8,916 | 10,508 |
| EPS (UBS, diluted) (NT$) | (0.19) | 1.81 | 4.00 | 8.04 | 13.82 | 18.09 | 21.03 | 24.79 |
| DPS (net) (NT$) | 0.00 | 1.00 | 2.00 | 4.02 | 6.91 | 9.05 | 10.52 | 12.39 |
| Net (debt) / cash | (17,322) | (14,649) | (5,365) | (7,600) | (11,535) | (8,739) | (9,056) | (7,531) |
| Profitability/valuation | 12/23 | 12/24 | 12/25 | 12/26E | 12/27E | 12/28E | 12/29E | 12/30E |
| EBIT (UBS) margin % | (0.4) | 4.4 | 4.3 | 15.0 | 22.7 | 25.7 | 26.9 | 28.3 |
| ROIC (EBIT) % | (0.2) | 2.4 | 2.8 | 14.7 | 26.4 | 32.2 | 34.9 | 37.5 |
| EV/EBITDA (UBS core) x | 14.2 | 9.7 | 7.2 | 32.7 | 21.9 | 17.6 | 15.2 | 13.2 |
| P/E (UBS, diluted) x | NM | 77.4 | 26.0 | 67.4 | 39.2 | 30.0 | 25.8 | 21.9 |
| Equity FCF (UBS) yield % | 1.6 | 6.2 | 21.6 | (0.7) | (1.1) | 2.5 | 1.5 | 2.6 |
| Dividend yield (net) % | 0.0 | 0.7 | 1.9 | 0.7 | 1.3 | 1.7 | 1.9 | 2.3 |
Source: Company accounts, LSEG Eikon, UBS estimates. Metrics marked as (UBS) have had analyst adjustments applied. Valuations: ased on an average share price that year, (E): ased on a share price of NT$ 538.00 on 01-Oct-2026 22:29:37 CST
Equities
Taiwan
Semiconductors
| 12-month rating | Buy |
|---|---|
| 12m price target | NT$725.00 |
| Prior : NT$500.00 | |
| Price (01 Oct 2026) | NT$538.00 |
RIC: 3105.TWOBBG: 3105 TT
Trading data and key metrics
| 52-wk range | NT$617.00-93.10 |
|---|---|
| arket cap. | NT$228 /US$7.14 |
| Shares o/s | 424m (ORD) |
| Free float | 77% |
| Avg. daily volume ('000) | 24.5 |
| Avg. daily value (m) | NT$10.3 |
| Common s/h equity (12/26E) | NT$44.9 |
| P/BV (12/26E) | 5.1x |
| Net debt to EBITDA (12/26E) | 1.2x |
| EPS (UBS, diluted) (TWD) | EPS (UBS, diluted) (TWD) - From | EPS (UBS, diluted) (TWD) - To | EPS (UBS, diluted) (TWD) - % ch | EPS (UBS, diluted) (TWD) - Cons. |
|---|---|---|---|---|
| 12/26E | 7.79 | 8.04 | 3 | 7.07 |
| 12/27E | 11.27 | 13.82 | 23 | 9.98 |
| 12/28E | 13.83 | 18.09 | 31 | 12.42 |
Jerry Su
Analyst jerry.su@u s.com +886-28-722 7306
Annie Chen
Associate Analyst annie.chen@u s.com +886-2-8722 7281
Thesis Map UBS Research THESIS AP a guide to our thinking and what´s where in this report
Pivotal Questions
UBS VIEW
EVIDENCE
WHAT´S PRICED IN?
Upside/Downside Spectrum
Q: Can the RF business resume growth amid potentially softer smartphone demand?
Likely. We expect growth for the Wi-Fi and infrastructure usinesses to improve, driving overall RF growth. Its Wi-Fi PA revenue dou led in 2024 from its 2022 trough on Wi-Fi 6E/7 proliferation and new customer design wins. Infrastructure demand for 5G BTS remains sta le, while LEO could see further upside on spec upgrades and adoption of higher ASP material. For cellular PA, although its revenue declined in 2025, we expect it to recover from 2026 on customers' market share gains and improved demand from high-end/premium handsets, despite an inflationary environment. We also elieve WIN Semi is well positioned to capture opportunities from China's localisation and potential outsourcing y top fa less design houses, OEM rands or IDM customers.
Q: Can the optical business resume growth in 2026 and beyond?
Likely. Optical sales contracted for several years due to a lack of spec upgrades in 3D sensing and a major client's market share losses. In response, WIN Semi turned its focus to non-3D sensing customers in automotive LiDAR, droids, humanoid ro otics and data communications, resulting in the 3D sensing share of optical sales falling from 90% efore 2023 to 60% in 2025. With the rampup in photo diodes and penetration into EML/CW lasers from H226, we expect overall optical revenue to re ound from its 2025 trough and deliver a 38% CAGR through 2030E.
Q: Can WIN Semi further improve its margin profile?
Yes. Following WIN's disciplined capex spending in 2023-25, we expect depreciation to remain low in the next few years. Moreover, a higher loading rate and shift in the sales mix toward infrastructure and optical usiness should help its GM further recover from 24.2% in 2025 to 37.1% in 2028E.
We reiterate our Buy rating on WIN Semi and raise our 2026/27/28E EPS y 3%/23%/31%, respectively, primarily reflecting higher sales contri utions from LEO satellite and optical driver for transceiver. We raise our PT from NT$500 to NT$725, ased on 40x 2028E PE (vs historical range of 10-57x), supported y a 2025-30E EPS CAGR of 44%. Our 2027E/28E EPS is 38%/45% ahead of consensus as we expect a much stronger revenue growth in 2026-28E supported y LEO satellite and optical usiness, with higher GM on etter mix.
WIN Semi's utilisation recovered to 65% in Q226 and we expect further improvements, supported y infrastructure growth, new optical project wins, cellular share gains and Wi-Fi 7 proliferation. This should support a GM recovery, especially as depreciation is guided to remain low following disciplined capex control from 2023-25 and the disposal of the Kaohsiung plant. With higher loading and reduced sales exposure to the lower-margin smartphone-related usiness (down from 70% of sales in 2020-22 to 50% in 2025), its GM recovered to nearly 30% in H225.
The stock has re ounded ~29% over the past three months vs ~3% for TAIEX on ro ust H226 outlook with etter sentiment for its margin and earning profile. We elieve WIN Semi's improving fundamentals, including gross margin recovery and stronger infrastructure traction, are not reflected in the current share price. We expect a 44% CAGR in earnings over 2025-30E and foresee potential upward revisions in consensus earnings estimates eing a catalyst.
| Value drivers (2027/28E) | Cellular/Wi-Fi sales growth | Infra sales growth | Optical sales growth | Gross margin |
|---|---|---|---|---|
| NT$1,000.00 upside | +6%/+4% | +82%/+36% | +45%/+35% | 36.7%/40.1% |
| NT$725.00 ase | +3%/+1% | +77%/+21% | +40%/+29% | 34.9%/37.1% |
| NT$345.00 downside | -9%/-7% | +55%/+20% | +20%/+16% | 30.4%/30.5% |
Source: UBS estimates
Company Description WIN Semiconductors is a leading compound semiconductor foundry in Taiwan.
Starlink V3 satellites deliver ~10x increase in downlink capacity
SpaceX successfully launched Starship Flight 14 on Septem er 28, 2026 (see John Hodulik's note for more detail), deploying 26 Starlink V3 satellites into the or it and marking the eginning of Starlink's next generation upgrade cycle. The V3 platform represents a major architecture upgrade over the existing V2 and V2 Mini satellites, delivering significantly higher throughput, greater eamforming capa ility, and expanded ackhaul capacity. Rather than expanding coverage, the V3 rollout is aimed at addressing Starlink's increasingly important network-capacity constraint. While V2 esta lished glo al road and coverage, V3 is designed to support much larger traffic loads across consumer road and, enterprise connectivity, mo ility applications, and future AI-driven workload, while lowering the cost per it delivered. Importantly, the technology developed for the V3 satellite is also expected to support the migration of Starlink Mo ile from V1 to V2, ena ling near terrestrial-like LTE connectivity directly to standard, unmodified cellular devices.
As Starlink's su scri er ase continues to expand, capacity constraints have ecome increasingly visi le in densely populated regions, resulting in slower speed and traffic management measures for heavy users. With glo al coverage largely esta lished, the key challenge is no longer the num er of satellites in or it, ut the amount of throughput each satellite can deliver. At the same time, growing congestion at Starlink's current operating altitude of approximately 550 km has increased pressure on the or ital resource. To address oth issues, Starlink's new-generation V3 satellites are designed to operate at a lower altitude of roughly 350 km, which should reduce end-user latency from around 40-50 ms to elow 20 ms, while also improving overall networking responsiveness.
Figure 1: Starlink V3 vs V2 satellite key specification comparisons
| Starlink V3 | Starlink V2 | |
|---|---|---|
| Orbit | 350 km | 550 km |
| Downlink Capacity | 1,000 Gbps (1 Tbps) | 96 Gbps |
| Uplink Capacity | 160 Gbps | 7-8 Gbps |
| Downlink Beams | 2,048 | 192 |
| Uplink Beams | 2,048 | 144 |
| RF Backhaul Capacity | 1.2 Tbps | 140 Gbps |
| Bands | Ka, Ku, V, E, W, D (potential) | Ka, Ku, V, E |
| Laser Links | 6 x 400 Gbps | 3 x 200 Gbps |
| Solar Power | 2x | Baseline |
| Satellite Mass | ~2,000 kg | ~800 kg |
| Launch Vehicle | Starship | Falcon 9 |
Source: Company data, UBS estimates
The V3 platform represents a step-function increase in network capacity over the current V2 Mini generation. According to SpaceX, each V3 satellite is capa le of delivering up to 1 T ps of downlink throughput and 160 G ps of uplink throughput, representing approximately a 10x increase in downlink capacity versus V2 (~96 G ps) and a 22x increase in uplink capacity (~7 G ps). V3 further expands the num er of independently steera le communication eams to 2,048 for oth downlink and uplink, compared with 192 downlink eams and 144 uplink eams on V2 satellites. These improvements are ena led y a new generation of in-house designed eamforming chips, more powerful modem processors, and a much denser phased-array antenna architecture.
Beyond improving access capacity, V3 also introduces meaningful upgrades to Starlink's network ack one. While retaining Ku- and Ka- and for user connectivity, V3 expands ackhaul capacity through roader utilization of E- and and V- and spectrum, while adding support for W- and frequencies. Each satellite also carries four quad- and RF ackhaul antennas and six 400-G ps optical inter-satellite laser links, materially increasing overall network transport capacity. These enhancements are particularly important as Starlink scales enterprise networking, aviation, and maritime connectivity, all of which place significantly greater demands on uplink and ackhaul resources than traditional residential road and. This also supports the migration of Starlink Mo ile satellite upgrade to V2, which ena les 4x the num er of eams compared to the V1 and 4x the channel andwidth, supporting the full range of mo ile road and data and voice service.
The su stantial performance gains offered y V3 come with a corresponding increase in satellite size, power consumption, and system complexity. Supporting 10× higher throughput requires larger phased array antennas, more advanced eamforming hardware, higher-performance on oard processing, and solar arrays generating roughly twice the power of current V2 satellites. In addition, operating at approximately 350 km exposes V3 satellites to materially higher atmospheric drag compared with the 550 km or it used y V2. To maintain or it, conduct regular station-keeping maneuvers, and ena le controlled end-of-life de-or iting, V3 requires larger propulsion systems and greater propellant capacity. As a result, V3 satellite mass is expected to exceed 2,000 kg, compared with ~800 kg for V2 Mini. The larger form factor effectively necessitates a transition from SpaceX's Falcon 9 launch vehicle to Starship, whose payload capacity is specifically intended to support deployment of the V3 constellation.
Figure 2: Starlink V3 satellite is designed with 2x wide of solar array panels over V2
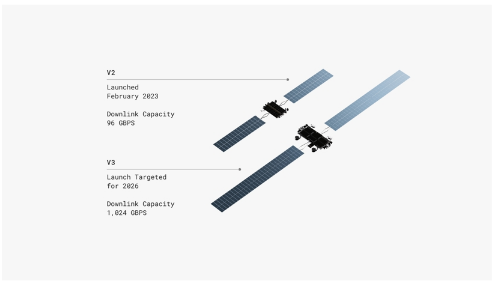
Figure 3: Starship V3 offers 4-5x payload capacity over Falcon 9
Source: Company data
Source: Company data
The launch economics also improve su stantially under the V3 architecture. V2 Mini satellites were specifically designed to fit within Falcon 9 constraints, ena ling deployment of approximately 20-27 satellites per launch. As each satellite provides ~100 G ps of downlink capacity, a typical Falcon 9 mission adds around 2-3 T ps of network capacity to the constellation. By contrast, each V3 satellite can deliver up to 1 T ps of downlink capacity, and SpaceX expects Starship to eventually deploy as many as 60 V3 satellites per launch. This translates into ~60 T ps of incremental network capacity per launch, or roughly 20x more capacity per mission than a Falcon 9 mission carrying V2 Mini satellites. The com ination of significantly higher satellite throughput and vastly improved launch efficiency should materially accelerate Starlink's a ility to scale capacity while reducing network deployment costs over time.
Figure 4: Starship can add 20x more network capacity per launch than Falcon 9
| Starlink V3 | Starlink V2 | |
|---|---|---|
| Launch Vehicle | Starship | Falcon 9 |
| Satellite Mass | ~2,000 kg | ~800 kg |
| Satellites per Launch | ~60 satellites | ~20-27 satellites |
| Downlink Capacity per Satellite | 1 Tbps | ~100 Gbps |
| Uplink Capacity per Satellite | 160 Gbps | ~7 Gbps |
| Total Network Capacity Added per Launch | ~60 Tbps | ~2-3 Tbps |
| Capacity per Launch vs V2 | ~20x higher | 1x |
| Planned Satellites | 100,000 satellites requested in FCC filings | ~30,000 staellites |
Source: Company data, UBS estimates
V3 satellite drives ~4-5x expansion in RF content opportunity
We provide a deep dive analysis ased on our industry checks, recent management discussions, and Starlink deployment assumptions from our US telecom team. The transition from Starlink V2 to V3 represents one of the most significant radio frequency (RF) content upgrades across the satellite communication supply chain. While SpaceX has not pu licly disclosed the exact num er of power amplifiers (PAs) or low noise amplifiers (LNAs) integrated into each satellite, the pu lished system specifications point to a su stantial increase in RF front-end content. Key drivers: 1) a ~10x increase in downlink capacity, 2) a ~22x increase in uplink capacity, 3) a 10-14x increase in eam counts, 4) the addition of E/V/W- and ackhaul payload, and 5) full-scale deployment of D2C functionality for Mo ile V2.
Figure 5: Starlink V3 stallite operates at much higher frequencies
| Band | Frequency | Primary use |
|---|---|---|
| Ku | ~10.7 - 18 GHz | user terminals |
| Ka | ~17.8 - 30 GHz | user and gateway links |
| V | ~37.5 - 51 GHz | high-capactiy backhual |
| E | ~71 - 86 GHz | gateway backhual |
| W | ~75 - 110 GHz | High-capacity backhaul and feeder links |
| D | ~110 -170+ GHz, with filings extending up to 275 GHz | future ultra high-capactiy backhual |
Source: Company data, UBS
We assume each radiating antenna element corresponds to a dedicated RF channel, requiring one PA for transmission and 1-2 LNAs for receiving. Based on our industry checks, we elieve oth V3 and V2 Mini feature five Ku- and antenna panels, where we assume the V3 satellite includes a 32 x 64 high-density matrix, resulting in a total of 2,048 radiating elements per panel. For V2, we estimate 512 elements per panel, ased on 16 x 32 configuration. Under these assumptions, total Ku- and PA and LNA content increases to ~20,480 units per V3 satellite, versus ~5,120 units for V2 Mini.
A similar content expansion is likely occurring within the gateway ackhaul system. We elieve V3 employs four gateway panels vs three for V2 Mini, and has upgraded the gateway panels from a 16 x 16 architecture in V2 to a denser 32 x 32 configuration, increasing element count from 256 to 1,024 per panel. The higher element density is necessary to support the higher frequency requirements associated with E-, V- and, and ultra-high frequency W- and (up to 110 GHz). As a result, we estimate total gateway PA and LNA content rises to ~12,288 units per V3 satellite, up from 2,304 units for V2 Mini.
D2C capa ility provides a further layer of RF content growth. After D2C functions were initially tested on Starlink Mo ile V1 satellites, Mo ile V2 is expected to feature optimized and massive phased-array antennas to connect directly to unmodified LTE smartphones. This will support seamless emergency texting, voice, standard data and IoT transmissions outside of the coverage from traditional ase transceiver stations. We estimate the Mo ile V2 satellite integrated approximately 3,000 - 4,000 independent low- to mid- and cellular RF elements operating across the 1.6 to 2.7 GHz spectrum to ena le the D2C function.
| Starlink V3 Antenna system type | Application | # of Antenna panels | Elements per antenna | Total PA | Total LNA |
|---|---|---|---|---|---|
| Ku-band phased array | Ground user terminal | 5 | 2,048 | 10,240 | 10,240 |
| Ka/E/V/W band gateway array | Ground large-scale gateways | 4 | 1,024 | 4,096 | 8,192 |
| Total PA and LNA per Satellite | 14,336 | 18,432 |
Figure 6: V3 expands the RF content by ~4-5x vs V2
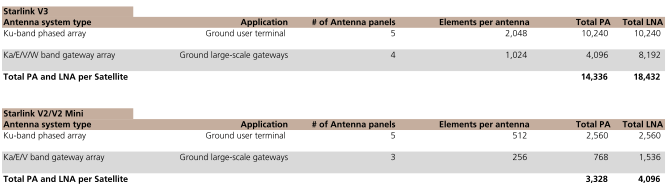
| Starlink V2/V2 Mini Antenna system type | Application | # of Antenna panels | Elements per antenna | Total PA | Total LNA |
|---|---|---|---|---|---|
| Ku-band phased array | Ground user terminal | 5 | 512 | 2,560 | 2,560 |
| Ka/E/V band gateway array | Ground large-scale gateways | 3 | 256 | 768 | 1,536 |
| Total PA and LNA per Satellite | 3,328 | 4,096 |
Source: Company data, UBS estimates
Com ining the Ku- and access payload and gateway ackhaul system, we estimate total PA and LNA content increases to nearly ~33,000 units per V3 satellite, respectively, compared with ~7,500 units for V2 Mini. This implies a ~4-5x increase in RF semiconductor content per satellite as Starlink migrates from the V2 to the V3 platform. For Mo ile V2 satellite, we estimate total PA and LNA content increases to ~15,000 units from ~2,600 in V1. These create a meaningful TAM expansion opportunity for RF component suppliers across the satellite communication ecosystem.
Compound semi content growth is even more substantial
While the V3 platform expands overall RF content y roughly 4-5x versus V2, we elieve the increase in compound semiconductor content is even more pronounced. Based on our analysis, Starlink's V2 satellite relied heavily on Silicon-Germanium (SiGe BiCMOS) and conventional Gallium Arsenide (GaAs) technologies for RF front-end modules, particularly in Ku- and applications. As V3 pushes toward 1 T ps throughput, we elieve the RF architecture is increasingly approaching the performance limits of SiGeased solutions, driving a meaningful migration toward higher performance compound semiconductor technologies.
For V2, we estimate SiGe accounted for the vast majority of LNA content for Ku- and, given its favoura le integration with other components, lower cost, and low-noise characteristics. GaAs was likely deployed in Ku- and PA, selective higher-frequency ackhaul applications (Ka, E- and V- and PAs), and certain LNAs. Among nearly ~7,500 PA and LNA devices for V2 satellite, we estimate ~45% were SiGe ased with the remaining ~55% utilizing GaAs technologies.
The material mix ecomes su stantially more favoura le for compound semis in V3. As operating frequencies extend further into Ka-, E-, V-, and newly introduced W- and spectrum, the performance limitations of traditional SiGe architectures ecome increasingly evident. Higher frequencies require improved power density, greater efficiency, and superior thermal performance, particularly for high-capacity ackhaul links. We therefore expect most Ka-, E-, V-, and W- and power amplifiers within the V3 platform to migrate toward Gallium Nitride (GaN), given its superior electrical characteristics, significantly higher power density, lower atmospheric loss, and stronger thermal management capa ilities. We estimate GaN can deliver roughly 4-8x higher power density than conventional GaAs solutions, making it particularly attractive for next-generation satellite payloads operating at extremely high frequencies. Within the user-link payload, we elieve Ku- and PAs will continue to adopt GaAs solutions.
For LNAs, we continue to elieve SiGe will play an important role for ackhaul receiver applications given its superior noise performance, high integration capa ility, and cost advantages. That said, we expect GaAs adoption to increase in performance-critical applications for ackhaul LNAs, where the demands of ultra-high-frequency operation ecome increasingly challenging for silicon- ased technologies.
Com ining the higher RF channel count with the ongoing migration toward GaAs and GaN, we estimate that V3 satellites will contain approximately 33,000 PA and LNA devices in total. Of this, we estimate roughly 75% will e GaAs- ased, ~13% SiGeased, and ~12% GaN- ased. Under this framework, compound semiconductors (GaAs + GaN) would account for ~87% of total RF devices in V3, compared with only ~55% in V2. As a result, we elieve the compound semiconductor content opportunity could expand y roughly 6-7x on a per-satellite asis, significantly outpacing the ~4-5x increase in overall RF unit content and creating a disproportionately large growth opportunity for suppliers like WIN Semi with exposure to advanced GaAs and GaN technologies.
Figure 7: Compound semi (GaAs and GaN) TA for V3 satellite could expand 6-7x from V2
| Material | Starlink V2 use cases | V2 PAs/LNAs units | Starlink V3 use cases | V3 PAs/LNAs units | V3/V2 |
|---|---|---|---|---|---|
| SiGe | Ku-band LNA and certain backhaul LNA | 3,328 | Backhaul LNA | 4,096 | 1.2x |
| GaAs | Ku/Ka/E/V-band PA and certain LNA | 4,096 | Ku-band PA/LNA, backhaul LNA | 24,576 | 6x |
| GaN | E/V/W-band PA | 4,096 | n.a. | ||
| GaAs+GaN | 4,096 | 28,672 | 7x | ||
| Material | V2 PAs/LNAs mix | V3 PAs/LNAs mix | |||
| SiGe | ~45% | ~13% | |||
| GaAs | ~55% | ~75% | |||
| GaN | limited | ~12% | |||
| GaAs+GaN | ~55% | ~87% |
Source: Company data, UBS estimates
WIN Semi stands out as a key beneficiary of Starlink V3 upgrade cycle
We view WIN Semi as one of the primary eneficiaries of Starlink's migration from the V2 to V3 satellite platform, given its esta lished position in the compound semi supply chain. Based on industry checks, discussion with management, and prior disclosures, we elieve WIN Semi has een a key foundry partner supporting Starlink's V2 RF front-end devices, particularly for GaAs- ased PAs and LNAs. As Starlink transitions toward V3 platform with higher throughput and wider adoption of D2C feature on Mo ile V2, we elieve the su stantial growth in RF content and higher adoption of GaAs/GaN technologies meaningfully expand WIN Semi's growth opportunity.
According to press reports, US FCC has accepted SpaceX's filing of launching 100,000 Starlink V3 satellites, which is part of the larger scheme for up to 1 mn satellites. We elieve RF component production for V3 satellites has already egun in 2026, with wafer demand poised to accelerate meaningfully in 2027-28E as deployment ramps. Our ase case assumes component uilds for ~ 3,000 V3 satellites in 2027E, rising to ~4,500 satellites in 2028E, ased on SpaceX's initial goal of launching up to 30,000 V3 satellites in the coming years. As the V3 satellite adopts su stantially more GaAs and GaN PAs/LNAs, we elieve this will drive a strong revenue and earnings growth for WIN Semi in 2027-30E.
The most attractive growth driver, in our view, is the emergence of GaN- ased RF content. As Starlink expands into E-, V-, and W- and applications, while simultaneously increasing throughput and eamforming sophistication, we elieve GaN adoption will increase materially relative to the V2 generation. We estimate each V3 satellite could initially consume the equivalent of roughly four 4' GaN wafers. There is additional upside should future generations incorporate even higher-frequency D- and spectrum (~110 - 170 GHz) , which would further strengthen the performance advantages of GaN technologies.
Importantly, GaN offers su stantially more attractive economics for WIN Semi than conventional GaAs. We estimate GaN wafer ASPs of US$8,000-10,000 per wafer, compared with ~US$2,000-3,000 for regular GaAs wafers. In addition, GaN also offers 10-20 ppt higher GM over matured GaAs- ased process due to more sophisticated manufacturing technology. As a result, even a modest increase in GaN wafer volume can have a disproportionate impact on WIN Semi's earnings growth.
WIN Semi has already een investing to expand its GaN capacity in 2026 and we elieve the company is also evaluating additional capacity expansion initiatives, including potential cleanroom and fa investments, as well as migrating from its current 4' platform toward higher-productivity 6' production (2.25x area versus 4"). Given current GaN capacity of less than 1,000 4' wafer/month, we elieve its GaN capacity could potentially dou le over the next 2 years, positioning WIN Semi to capture the anticipated ramp in satellite-related demand at Starlink, as well as other potential customers.
Under our assumptions, revenue derived from LEO satellite could increase to ~25% of total sales in 2027E, up from ~10% in 2026E, efore rising further toward ~30% in 2028E and ~32% in 2030E, growing at ~61% CAGR in 2026-30E. This would make LEO satellite one of WIN Semi's most important growth drivers and could lift overall infrastructure-related revenue contri ution to reach ~50% of total sales in 2028E, up from ~35% in 2026E.
Figure 8: V3 satellite driving WIN Semi's Infra revenue to reach 50% of total sales in 2028E
| LEO GaN contribution | 2027 | 2028 | 2029 | 2030 |
|---|---|---|---|---|
| V3 component shipments | 3,000 | 4,500 | 5,200 | 6,000 |
| GaN wafer per V3 | 4.00 | 4.00 | 4.15 | 4.30 |
| 4" GaN wafer ASP (US$) | 9,000 | 8,700 | 8,500 | 8,300 |
| Yield | 80% | 82% | 85% | 87% |
| Infra revenue (NT$ mn) | 2027 | 2028 | 2029 | 2030 |
| LEO Satellite (GaAs) | 2,937 | 4,552 | 5,462 | 6,281 |
| LEO Satellite (GaN) | 4,253 | 6,016 | 6,798 | 7,753 |
| Total LEO Satellite | 7,189 | 10,567 | 12,260 | 14,035 |
| Other Infra business | 6,083 | 6,857 | 7,747 | 8,606 |
| Total Infra revenue | 13,272 | 17,425 | 20,006 | 22,641 |
| Infra as % of total revenue | 45% | 50% | 51% | 51% |
| LEO as % of total revenue | 25% | 30% | 31% | 32% |
| YoY | ||||
| LEO Satellite (GaAs) | 62% | 55% | 20% | 15% |
| LEO Satellite (GaN) | n.m. | 41% | 13% | 14% |
| Other Infra business | 25% | 13% | 13% | 11% |
| Total Infra revenue | 77% | 31% | 15% | 13% |
| FX | 31.5 | 31.5 | 31.5 | 31.5 |
Source: Company data, UBS estimates
Earnings estimate revisions
We raise our 2027E and 2028E earnings forecasts for WIN Semi y 23% and 31%, respectively, driven primarily y stronger growth in infrastructure and optical usinesses. Our revised estimates incorporate a more aggressive ramp in LEO satellite demand, underpinned y Starlink's transition to the V3 and Mo ile V2 platforms, along with the associated increase in RF content per satellite. We estimate LEO satellite-related revenue will account for ~10% of total sales in 2026E, representing ~30% of infrastructure segment revenue. As Starlink V3 deployment accelerates, we expect this contri ution to expand to ~30% of total sales y 2028E. As a result, infrastructure revenue should increase from ~35% of total sales in 2026E to ~50% y 2028E, ecoming WIN Semi's largest growth driver and reducing dependency on the more cyclical handset market. Relative to VA consensus, our key point of differentiation is infrastructure sales outlook. Following our deep-dive analysis of WIN Semi's LEO opportunity, we assume stronger satellite deployments, higher RF content per satellite and faster migration from SiGe/ GaAs to higher-value GaAs/GaN solutions than currently reflected in consensus. While our 2026E sales estimate is roadly in line, we forecast infrastructure revenue reaching NT$13.3 n and NT$17.4 n in 2027E/2028E, versus consensus at NT$9.1 n and NT $10.7 n, respectively. This implies infrastructure contri utes 45.5% and 50.0% of total sales in 2027E/2028E, compared with consensus expectations of 35.6% and 36.5%.
In addition to the volume opportunity, we expect a favoura le product mix shift to support profita ility. The increasing adoption of higher-value GaN- ased PAs for Starlink V3, which we estimate carry gross margins 10-20 ppts a ove conventional GaAs infrastructure products, should contri ute to meaningful margin expansion. We therefore forecast corporate gross margin to improve from 29.4% in 2026E to 37.1% y 2028E, driven y mix upgrade and operating leverage from higher infrastructure utilization, with our gross margin estimates also a ove consensus (UBSe 34.9%/37.1% vs consensus 32.6%/34.6%) in 2027/28E due to our higher infrastructure sales mix assumptions.
For its optical usiness, WIN Semi has started mass production for photodiodes (PD) in late Q226 and remains on track for a more meaningful production ramp in H226E. While CW laser and EML products remain under qualification with more meaningful revenue contri ution from 2027E and eyond, we elieve the PD ramp alone should support overall optical sales (including Face ID VCSEL) to reach 16% of total sales in 2026E (vs 11% in 2025), efore rising further to 18% of total sales in 2028E. This should help overall AI/datacom revenue (optical driver, PIC, laser diode, PD, and etc) exposure to reach high-single % of total revenue y end-2026, up from a low-single-digit contri ution in 2025, and further increase to mid-teens % of total revenue in 2028E,
Figure 9: WIN Semi's G to recover to high-30% level on higher Infra sales mix
Source: Company data, UBS estimates
ased on our estimates. Together with PD ramp and resilient cellular demand, we expect WIN Semi's Q426E sales to remain ro ust for +1% QoQ, ahead of seasonal mid- to highsingle % QoQ decline.
Figure 10: WIN Semi's utilization is recovering from trough as it ramps infra and optical businesses
Source: Company data, UBS estimates
Figure 11: WIN Semi's margins recovering on better product mix and higher loading
Source: Company data, UBS estimates
Figure 12: UBS estimate changes and VA consensus - Q226-Q426E and 2025-27E
| (NT$m) | Q226 - Actual | Q326E - UBSe | Q326E - UBSe prior | Q326E - VA | Q426E - UBSe | Q426E - UBSe prior | Q426E - VA | 2025 2026E - Actual | 2025 2026E - UBSe UBSe prior | 2025 2026E - VA | 2027E - UBSe | 2027E - UBSe prior | 2027E - VA |
|---|---|---|---|---|---|---|---|---|---|---|---|---|---|
| Revenue | 5,257 | 5,882 | 5,895 | 5,891 | 5,928 | 5,842 | 5,816 | 16,639 | 21,657 21,584 | 21,554 | 29,170 | 25,506 | 25,551 |
| - QoQ / YoY | 14.5% | 11.9% | 12.1% | 12.1% | 0.8% | -0.9% | -1.3% | -4.7% | 30.2% 29.7% | 29.5% | 34.7% | 18.2% | 18.5% |
| Gross profit | 1,485 | 1,806 | 1,783 | 1,826 | 1,871 | 1,786 | 1,797 | 4,026 | 6,370 6,262 | 6,319 | 10,180 | 8,369 | 8,339 |
| - Gross margin | 28.2% | 30.7% | 30.2% | 31.0% | 31.6% | 30.6% | 30.9% | 24.2% | 29.4% 29.0% | 29.3% | 34.9% | 32.8% | 32.6% |
| Operating profit | 742 | 1,025 | 999 | 1,002 | 1,049 | 962 | 943 | 717 | 3,246 3,135 | 3,118 | 6,617 | 5,185 | 4,677 |
| - OP margin | 14.1% | 17.4% | 16.9% | 17.0% | 17.7% | 16.5% | 16.2% | 4.3% | 15.0% 14.5% | 14.5% | 22.7% | 20.3% | 18.3% |
| Non-Op | 447 | 18 | 20 | 36 | 41 | 24 | 0 | 672 | 606 591 | 578 | 179 | 289 | 94 |
| Pre-tax profit | 1,188 | 1,043 | 1,019 | 1,033 | 1,090 | 986 | 943 | 1,389 | 3,853 3,725 | 3,696 | 6,796 | 5,474 | 4,771 |
| Tax | 284 | 188 | 183 | 198 | 196 | 177 | 178 | 297 | 751 728 | 738 | 1,276 | 1,035 | 914 |
| - Tax rate | -24% | -18% | -18% | -19% | -18% | -18% | -19% | -21% | -19% -20% | -20% | -19% | -19% | -19% |
| Net profit | 977 | 935 | 916 | 968 | 964 | 879 | 847 | 1,696 | 3,409 3,305 | 3,325 | 5,860 | 4,779 | 4,238 |
| EPS (NT$) | 2.30 | 2.21 | 2.16 | 2.28 | 2.27 | 2.07 | 2.00 | 4.00 | 8.04 7.79 | 7.84 | 13.82 | 11.27 | 9.99 |
Source: Company data, Visi le Alpha, UBS estimates
Figure 13: UBS vs. VA consensus infra/non-infra sales - we see stronger infra sales on LEO content upgrade
| (NT$m) | 2025 - Actual | 2026E - UBSe | 2026E - VA | 2027E - UBSe | 2027E - VA | 2028E - UBSe | 2028E - VA |
|---|---|---|---|---|---|---|---|
| Total Sales | 16,639 | 21,657 | 21,554 | 29,170 | 25,551 | 34,830 | 29,384 |
| Infrastructure | 5,678 | 7,491 | 7,380 | 13,272 | 9,106 | 17,425 | 10,737 |
| - % of sales | 34.1% | 34.6% | 34.2% | 45.5% | 35.6% | 50.0% | 36.5% |
| Mobile PA + WiFi PA + Optical | 10,960 | 14,166 | 14,174 | 15,898 | 16,445 | 17,405 | 18,647 |
| - % of sales | 65.9% | 65.4% | 65.8% | 54.5% | 64.4% | 50.0% | 63.5% |
| Gross Margin | 24.2% | 29.4% | 29.3% | 34.9% | 32.6% | 37.1% | 34.6% |
Source: Company data, Visi le Alpha, UBS estimates
Figure 14: WIN Semi - annual P&L summary
| Ticker Shares outstanding (mn) - Year | Ticker Shares outstanding (mn) - 2025 | 3105.TWOCurrent Price (NT$) 424.2 Mkt cap (NT$ mn) - 2026E | 3105.TWOCurrent Price (NT$) 424.2 Mkt cap (NT$ mn) - 2027E | 3105.TWOCurrent Price (NT$) 424.2 Mkt cap (NT$ mn) - 2028E | $538.0 $228,239 - 2029E | $538.0 $228,239 - 2030E |
|---|---|---|---|---|---|---|
| Revenues (NT$ mn) | $16,639 | $21,657 | $29,170 | $34,830 | $39,346 | $44,130 |
| YoY Growth (%) | 30.2% | 34.7% | 19.4% | 13.0% | 12.2% | |
| Gross profit (NT$mn) | $4,026 | $6,370 | $10,180 | $12,916 | $14,883 | $17,227 |
| GM (%) | 24.2% | 29.4% | 34.9% | 37.1% | 37.8% | 39.0% |
| Operating profit (NT$mn) | $717 | $3,246 | $6,617 | $8,958 | $10,572 | $12,496 |
| OPM (%) | 4.3% | 15.0% | 22.7% | 25.7% | 26.9% | 28.3% |
| Net profit (NT$ mn) | $1,696 | $3,409 | $5,860 | $7,671 | $8,916 | $10,508 |
| EPS (NT$) | $4.00 | $8.04 | $13.82 | $18.09 | $21.03 | $24.79 |
| EPS growth (%) | 101.0% | 71.9% | 30.9% | 16.2% | 17.9% | |
| P/E (x) | 134.5 | 66.9 | 38.9 | 29.7 | 25.6 | 21.7 |
| Dividend yield (%) | 0.4% | 0.7% | 1.3% | 1.7% | 2.0% | 2.3% |
| P/B (x) | 4.3 | 3.9 | 3.6 | 3.1 | 2.7 | 2.4 |
| ROE (%) | 3.2% | 5.9% | 9.2% | 10.4% | 10.7% | 11.1% |
Source: Company data, UBS estimates. Note: Data as of 1 Octo er 2026.
Figure 15: WIN Semi - annual and quarterly forecast summary
3.2% 29.4% 28.4% 39.1% 31.1% 23.6% 14.4% 20.5% 10.2% -4.7% 30.2% 34.7% 19.4%
26.9% 31.8% 26.3% 28.2% 30.7% 31.6% 29.5% 32.9% 23.2% 24.2% 29.4% 34.9% 37.1%
8.6% 13.9% 9.4% 14.1% 17.4% 17.7% 14.2% 19.3% 4.4% 4.3% 15.0% 22.7% 25.7%
-23.8% -12.9% -15.6% -23.9% -18.0% -18.0% -18.0% -22.0% 2.1% -21.4% -19.5% -18.8% -19.0%
368.7% -392.1% 3312.4% -332.1% -12.6% -6.3% 40.1% 13.6% -1065.8% 120.5% 101.0% 71.9% 30.9%
| Quarters | Q325 | Q425 | Q126 | Q226 | Q326E | Q426E | Q127E | Q227E |
|---|---|---|---|---|---|---|---|---|
| Revenues (NT$ mn) | $4,488 | $4,794 | $4,590 | $5,257 | $5,882 | $5,928 | $5,250 | $6,335 |
| -- QoQ Growth (%) | 18.7% | 6.8% | -4.3% | 14.5% | 11.9% | 0.8% | -11.4% | 20.7% |
| -- YoY Growth (%) | 3.2% | 29.4% | 28.4% | 39.1% | 31.1% | 23.6% | 14.4% | 20.5% |
| Gross profit | $1,205 | $1,525 | $1,209 | $1,485 | $1,806 | $1,871 | $1,547 | $2,083 |
| -- Gross Margin (%) | 26.9% | 31.8% | 26.3% | 28.2% | 30.7% | 31.6% | 29.5% | 32.9% |
| Operating Profit | $385 | $665 | $431 | $742 | $1,025 | $1,049 | $743 | $1,224 |
| -- OP Margin (%) | 8.6% | 13.9% | 9.4% | 14.1% | 17.4% | 17.7% | 14.2% | 19.3% |
| Non-op | $511 | $437 | $101 | $447 | $18 | $41 | $58 | $84 |
| Pre-tax profit (NT$ mn) | $897 | $1,102 | $532 | $1,188 | $1,043 | $1,090 | $801 | $1,307 |
| Tax | ($213) | ($142) | ($83) | ($284) | ($188) | ($196) | ($144) | ($288) |
| -- tax rate (%) | -23.8% | -12.9% | -15.6% | -23.9% | -18.0% | -18.0% | -18.0% | -22.0% |
| Net profit (NT$ mn) | $1,070 | $1,029 | $533 | $977 | $935 | $964 | $747 | $1,110 |
| -- QoQ Growth (%) | -354.2% | -3.9% | -48.2% | 83.2% | -4.3% | 3.1% | -22.5% | 48.5% |
| -- YoY Growth (%) | 368.7% | -392.1% | 3312.4% | -332.1% | -12.6% | -6.3% | 40.1% | 13.6% |
| EPS (NT$) | $2.52 | $2.43 | $1.26 | $2.30 | $2.21 | $2.27 | $1.76 | $2.62 |
| 2024 | 2025 | 2026E | 2027E | 2028E |
|---|---|---|---|---|
| $17,458 | $16,639 | $21,657 | $29,170 | $34,830 |
| 10.2% $4,042 23.2% $763 4.4% $334 $7 2.1% | -4.7% $4,026 24.2% $717 4.3% $672 $1,389 ($297) | 30.2% $606 | 34.7% $10,180 34.9% $6,617 22.7% $179 $6,796 -18.8% | 19.4% $12,916 37.1% $8,958 25.7% $135 $9,093 -19.0% |
| $6,370 | ||||
| 29.4% | ||||
| $3,246 | ||||
| 15.0% | ||||
| ($429) | ||||
| $3,853 | ||||
| ($751) | ($1,276) | ($1,726) | ||
| -21.4% | -19.5% | |||
| $769 | $1,696 | $3,409 | $5,860 | $7,671 |
| -1065.8% | 120.5% | 101.0% | 71.9% | 30.9% |
| $1.81 | $4.00 | $8.04 | $13.82 | $18.09 |
Source: Company data, UBS estimates
Valuation: Raise price target to NT$725; reiterate Buy
WIN Semi stock has re ounded ~29% over the past three months versus ~3% for the TAIEX, supported y a ro ust 2H26 outlook and improving sentiment toward its margin and earnings profile. The stock has also re-rated and now trades at 39x/30x 2027/28E UBS EPS, reflecting improving earnings visi ility and a more diversified usiness mix with less exposure to consumer end markets, including LEO satellite and optical communications. While we elieve the re-rating has een driven primarily y growing confidence in the optical usiness ramp and etter infrastructure outlook, we do not elieve the market has fully reflected WIN Semi's improving fundamentals and multiyear earnings expansion cycle. Key earnings drivers are: 1) accelerating satellite-related infrastructure demand; 2) rising optical and AI/datacom revenue contri ution; and 3) sustained margin recovery driven y a more favoura le mix, improving loading, and operating leverage. In particular, we elieve the LEO satellite opportunity remains underappreciated, and the successful Starship launch on 28 Septem er should increase investor's confidence in the pace of Starlink V3 deployment over the next several years, supporting our a ove-consensus infrastructure growth and margin assumptions.
We raise our PT to NT$725 (from NT$500), as we roll over to 40x 2028E PE (from 40x average 2027-28E), vs historical range of 10-57x, supported y a 2025-30E EPS CAGR of 44%. We reiterate Buy, as WIN Semi is well positioned to capture the LEO satellite and optical communication growth opportunities in 2026-28E, while its margins should further advance on etter product mix and operating leverage. Our 2027/28E EPS estimates are 38%/45% a ove consensus, and we foresee potential upward revisions in consensus earnings estimates eing a catalyst.
Figure 16: WIN Semi - PE range since 2013
Source: LSEG
Figure 17: WIN Semi vs FINI holdings - share prices
Source: TEJ
Figure 18: WIN Semi is trading below peers at 39x 2027 P/E
| name | Ticker | Market Cap | Share Price | EPS | (LC$) | (LC$) | EPS growth (%) | EPS growth (%) | P/E | (x) | P/BV (x) | P/BV (x) | ROE (%) | ROE (%) | |
| Company | (US$m) | (LC$) | 2026E | 2027E | 2028E | 2026E | 2027E | 2028E | 2027E | 2028E | 2027E | 2028E | 2027E | 2028E | |
| WIN Semiconductors Corp | 3105.TWO | 7,222 | 538.00 | 8.04 | 13.82 | 18.09 | 101.0 | 71.9 | 30.9 | 39.2 | 30.0 | 3.6 | 3.1 | 9.2 | 10.4 |
| RF peers | |||||||||||||||
| Advanced Wireless Semiconductor Co | 8086.TWO | 707 | 115.00 | 5.35 | 5.95 | 8.68 | 72.5 | 11.2 | 45.7 | 19.3 | 13.3 | 2.3 | 1.9 | 13.0 | 15.6 |
| Qorvo, Inc. | QRVO.O | 10,100 | 114.48 | 6.52 | 7.62 | 7.95 | 23.3 | 16.9 | 4.3 | 15.0 | 14.4 | 2.7 | 2.4 | 15.7 | 15.8 |
| Maxscend Microelectronics Co Ltd | 300782.SZ | 6,019 | 70.17 | -0.16 | 1.12 | 0.61 | n.a. | n.a. | -45.3 | 62.8 | 114.8 | 3.4 | 3.2 | 1.9 | 3.1 |
| Vanchip (Tianjin) Technology Co Ltd | 688153.SS | 1,629 | 25.37 | 0.10 | 0.54 | 0.82 | -37.5 | 440.0 | 50.9 | 47.0 | 31.1 | 2.7 | 2.5 | 3.6 | 7.4 |
| MACOM Technology Solutions Holdings, Inc. | MTSI.OQ | 21,752 | 284.82 | 5.48 | 8.39 | 10.00 | 57.8 | 53.2 | 19.2 | 34.0 | 28.5 | 9.8 | 7.6 | 33.3 | 29.1 |
| Filtronic PLC | FTC.L | 691 | 237.50 | 0.03 | 0.03 | 0.04 | -42.8 | -5.4 | 27.2 | 72.5 | 57.0 | 10.7 | - | - | - |
| Analog Devices, Inc. | ADI.N | 192,232 | 396.61 | 12.88 | 16.71 | 19.82 | 67.7 | 29.7 | 18.6 | 23.7 | 20.0 | 5.5 | 5.2 | 20.1 | 21.2 |
| Space Exploration Technologies Corp | SPCX.OQ | 2,047,596 | 150.86 | -0.02 | 1.78 | 4.80 | n.a. | n.a. | 168.8 | 84.5 | 31.5 | 10.4 | 7.7 | 14.4 | 30.0 |
| Average | 44.8 | 38.8 | 5.9 | 4.4 | 14.6 | 17.5 | |||||||||
| Optical peers | |||||||||||||||
| Visual Photonics Epitaxy Co., Ltd. | 2455.TW | 3,244 | 546.00 | 5.76 | 9.96 | 15.91 | 87.7 | 72.8 | 59.8 | 54.8 | 34.3 | 18.5 | 14.4 | 42.1 | 50.6 |
| LandMark Optoelectronics Corp | 3081.TWO | 8,620 | 2,660.00 | 19.66 | 41.36 | 60.00 | 349.7 | 110.4 | 45.1 | 64.3 | 44.3 | 28.2 | 19.5 | 47.9 | 44.0 |
| IntelliEPI Inc (Cayman) | 4971.TWO | 799 | 534.00 | 7.09 | 11.70 | - | 1588.1 | 65.0 | n.a. | 45.6 | n.m. | 7.8 | - | 18.7 | - |
| FOCI FIBER OPTIC COMMUNICATIONS, INC. | 3363.TWO | 2,318 | 641.00 | 0.21 | 16.93 | 48.74 | -76.0 | 8156.1 | 188.0 | 37.9 | 13.2 | 17.1 | 7.6 | 55.0 | 78.6 |
| Lumentum Holdings Inc. | LITE.OQ | 87,122 | 971.26 | 8.10 | 21.54 | 33.63 | 310.9 | 165.9 | 56.1 | 45.1 | 28.9 | 13.6 | 8.9 | 48.8 | 52.0 |
| Coherent Corp. | COHR.N | 56,362 | 287.81 | 5.46 | 9.38 | 14.01 | 55.3 | 71.7 | 49.4 | 30.7 | 20.5 | 4.9 | 4.3 | 16.1 | 23.3 |
| Average | 46.4 | 28.2 | 15.0 | 10.9 | 38.1 | 49.7 |
Source: Company data, LSEG, UBS estimates. Note: Data as of 1 Octo er 2026. Consensus data used for all ut WIN Semi (UBSe).
WIN Semiconductors (3105.TWO)
| Income Statement (NT$m) | 12/23 | 12/24 | 12/25 | 12/26E | %ch | 12/27E | %ch | 12/28E | 12/29E | 12/30E |
|---|---|---|---|---|---|---|---|---|---|---|
| Revenues | 15,836 | 17,458 | 16,639 | 21,657 | 30.2 | 29,170 | 34.7 | 34,830 | 39,346 | 44,130 |
| Gross profit | 3,469 | 4,042 | 4,026 | 6,370 | 58.2 | 10,180 | 59.8 | 12,916 | 14,883 | 17,227 |
| EBITDA (UBS) | 4,684 | 5,462 | 4,708 | 6,328 | 34.4 | 9,399 | 48.5 | 11,714 | 13,388 | 15,312 |
| Depreciation & amortisation | (4,739) | (4,700) | (3,994) | (3,082) | 22.8 | (2,782) | 9.8 | (2,756) | (2,816) | (2,816) |
| EBIT (UBS) | (56) | 762 | 715 | 3,246 | 354.2 | 6,617 | 103.8 | 8,958 | 10,572 | 12,496 |
| Associates & investment income | (5) | 83 | 266 | 495 | 85.7 | 390 | -21.1 | 390 | 320 | 320 |
| Other non-operating income | (3) | 146 | 952 | 512 | -46.2 | 118 | -76.9 | 108 | 108 | 108 |
| Net interest | (615) | (658) | (546) | (400) | 26.8 | (329) | 17.7 | (363) | (337) | (278) |
| Exceptionals (incl goodwill) | 0 | 0 | 0 | 0 | - | 0 | - | 0 | 0 | 0 |
| Pre-tax profit | (679) | 333 | 1,387 | 3,853 | 177.8 | 6,796 | 76.4 | 9,093 | 10,663 | 12,647 |
| Tax | 121 | 7 | (297) | (751) | -152.7 | (1,276) | -69.9 | (1,726) | (2,022) | (2,399) |
| Profit after tax | (558) | 340 | 1,090 | 3,102 | 184.6 | 5,520 | 78.0 | 7,366 | 8,641 | 10,248 |
| Preference dividends | 0 | 0 | 0 | 0 | - | 0 | 0 | 0 | 0 | |
| Minorities | 478 | 428 | 604 | 307 | -49.2 | 340 | - 10.7 | 305 | 275 | 260 |
| Extraordinary items | 0 | 0 | 0 | - | 0 | - | 0 | 0 | 0 | |
| Net earnings (local GAAP) | (80) | 768 | 1,694 | 0 3,409 | 101.3 | 5,860 | 71.9 | 7,671 | 8,916 | 10,508 |
| 71.9 | ||||||||||
| Net earnings (UBS) | (80) | 768 | 1,694 | 3,409 | 101.3 | 5,860 | 7,671 | 8,916 | 10,508 | |
| Tax rate (%) | 0.0 | 0.0 | 21.4 | 19.5 | -9.0 | 18.8 | -3.7 | 19.0 | 19.0 | 19.0 |
| Per Share (NT$) EPS (UBS, diluted) | 12/23 (0.19) | 12/24 1.81 | 12/25 4.00 | 12/26E 8.04 | %ch 101.3 | 12/27E 13.82 | %ch 71.9 | 12/28E 18.09 | 12/29E 21.03 | 12/30E 24.79 |
| EPS (local GAAP, diluted) | (0.19) | 1.81 | 4.00 | 8.04 | 101.3 | 13.82 | 71.9 | 18.09 | 21.03 | 24.79 |
| EPS (UBS, asic) | (0.19) | 1.81 | 4.00 | 8.04 | 101.3 | 13.82 | 71.9 | 18.09 | 21.03 | 24.79 |
| DPS (net) (NT$) | 0.00 | 1.00 | 2.00 | 4.02 | 101.0 | 6.91 | 71.9 | 9.05 | 10.52 | 12.39 |
| Cash EPS (UBS, diluted) 1 | 10.99 | 12.90 | 13.42 | 14.1 | 20.39 | 33.1 | 24.60 | 27.67 | 31.43 | |
| Book value per share | 80.09 | 89.91 | 98.00 | 15.31 105.82 | 8.0 | 114.82 | 8.5 | 125.28 | 136.62 | 150.28 |
| Average shares (diluted) | 424 | 424 | 424 | 424 | 0.0 | 424 | 0.0 | 424 | 424 | 424 |
| Balance Sheet (NT$m) | 12/23 | 12/24 | 12/25 | 12/26E | %ch | 12/27E | %ch | 12/28E | 12/29E | 12/30E |
| Cash and equivalents Other current assets | 10,469 | 5,602 | 7,294 7,263 | 4,927 10,851 | -32.5 49.4 | 5,991 | 21.6 | 8,538 14,835 | 7,220 17,085 | 7,746 19,231 |
| Total current assets | 6,694 17,163 | 6,853 12,455 | 14,557 | 15,778 | 8.4 | 15,439 21,431 | 42.3 35.8 | 23,373 | 24,306 | 26,976 |
| Net tangi le fixed assets | 31,312 | 28,265 | 19,672 | 19,267 | -2.1 | 19,885 | 3.2 | 21,229 | 22,613 | 23,298 |
| Net intangi le fixed assets | 527 | 66 | 81 | 22.9 | 81 | 0.0 | 81 | 81 | 81 | |
| Investments / other assets | 20,165 | 145 | 29,581 | 11.9 | 33,527 | 13.3 | 33,553 | 35,228 | 36,840 | |
| 69,168 | 23,393 64,259 | 26,434 60,729 | 74,923 | 15.8 | 78,236 | 82,228 | ||||
| Total assets | 3,884 | 64,707 | 6.6 | 87,194 | ||||||
| Trade paya les & other ST lia ilities Short term de t | 4,962 | 5,534 | 6,472 3,554 | 16.9 | 7,616 | 17.7 | 6,771 3,554 | 6,852 | 6,933 3,554 | |
| Total current liabilities | 7,762 12,724 | 3,719 | 331 | 10,026 | NM 70.9 | 3,554 11,169 | 0.0 11.4 | 10,325 | 3,554 10,406 | 10,487 |
| Long term de t | 20,030 | 7,603 16,532 | 5,865 12,328 | 8,973 | -27.2 | 13,973 | 55.7 | 13,723 | 12,723 | 11,723 |
| 46.0 | 789 | |||||||||
| Other long term lia ilities Preferred shares | 1,065 0 | 986 | 545 | 560 | 2.8 - | 817 0 | - | 0 | 894 0 | 990 0 |
| 33,819 | 0 | 0 | 0 | 24,836 | ||||||
| Total liabilities (incl pref shares) | 25,121 | 18,738 | 19,559 | 4.4 | 25,959 | 32.7 | 53,113 | 24,023 | 23,199 | |
| Common s/h equity | 33,955 | 38,118 1,020 | 41,545 | 44,861 | 8.0 | 48,677 | 8.5 0.0 | 287 | 57,918 | 63,708 |
| Minority interests Total liabilities & equity | 1,394 69,168 | 64,259 | 446 60,729 | 287 64,707 | -35.6 6.6 | 287 74,923 | 15.8 | 78,236 | 287 82,228 | 287 87,194 |
| Cash Flow (NT$m) | 12/23 | 12/24 | 12/25 | 12/26E | 12/27E | %ch | 12/28E | 12/29E | 12/30E | |
| Net income ( efore pref | (80) | 768 | 1,694 | 3,409 | %ch | 5,860 | 71.9 | 7,671 | 8,916 | 10,508 |
| divs) Depreciation & amortisation | 4,739 | 4,700 | 3,994 | 3,082 | 101.3 -22.8 | 2,782 | -9.8 | 2,756 | 2,816 | 2,816 |
| Net change in working capital | 422 | (227) | 207 | (3,046) | - | (3,192) | -4.8 | 450 | (1,674) | (1,614) |
| Other operating | (812) | (341) | (942) | (2,065) | -119.4 | (4,539) | -119.7 | (1,022) | (2,445) | (2,322) |
| Operating cash flow | 4,270 | 4,900 | 4,953 | 1,380 | -72.1 | 911 | -34.0 | 9,855 | 7,612 | 9,388 |
| Tangi le capital expenditure | (3,203) | (1,220) | 4,543 | (2,913) | - | (3,400) | -16.7 - | (4,100) | (4,200) | (3,500) |
| Intangi le capital expenditure | 0 | 0 | 0 | - | 0 | 0 | ||||
| Net (acquisitions) & disposals | 0 | 0 0 | - | 0 | - | 0 | 0 | 0 | ||
| Other investing | 450 | 0 165 | 569 | 0 295 | -48.2 | 0 | 0 | 0 0 | 0 0 | |
| Investing cash flow | (2,753) | (1,055) 0 | 5,112 | (2,618) | - | (3,400) | - -29.8 | (4,100) | (4,200) | (3,500) |
| Equity dividends paid | (1,060) | (424) 0 | (848) | -100.0 | (1,705) | -101.0 - | (2,930) 0 | (3,836) | (4,458) 0 | |
| 0 | 0 | 0 | 0 | 0 | ||||||
| Share issues / ( uy acks) | - | |||||||||
| Other financing | (609) | (826) (8,113) | (654) | (21) | 96.8 96.3 | 258 5,000 | - - | (28) (250) | 106 (1,000) | 96 (1,000) |
| Change in de t & pref shares Financing cash flow | (7) (1,676) | (8,939) | (7,202) (8,280) | (270) (1,139) | 86.2 | 3,553 | (3,209) | (4,730) | (5,362) | |
| Cash flow inc/(dec) in cash | (160) | (2,377) | (1,318) | 525 | ||||||
| 1,785 (93) | 10 | - - | 1,064 0 | - - - | 2,547 0 | 0 | 0 | |||
| FX / non cash items in cash | 128 (32) | (5,094) 227 | (2,367) | - | 1,064 | |||||
| (4,867) | 1,692 | 2,547 | (1,318) | |||||||
| 525 | ||||||||||
| Balance sheet inc/(dec) | - |
Source: Company accounts, UBS estimates. (UBS) metrics use reported figures which have een adjusted y UBS analysts. 1 Cash EPS (UBS, diluted) is calculated using UBS net income adding ack depreciation and amortization.
WIN Semiconductors (3105.TWO)
| Valuation (x) | 12/23 | 12/24 | 12/25 | 12/26E | 12/27E | 12/28E | 12/29E | 12/30E |
|---|---|---|---|---|---|---|---|---|
| P/E (local GAAP, diluted) | NM | NM | 26.0 | 66.9 | 38.9 | 29.7 | 25.6 | 21.7 |
| P/E (UBS, diluted) | NM | 77.4 | 26.0 | 66.9 | 38.9 | 29.7 | 25.6 | 21.7 |
| P/CEPS | 14.5 | 10.9 | 7.7 | 35.4 | 26.6 | 22.0 | 19.6 | 17.2 |
| Equity FCF (UBS) yield % | 1.6 | 6.2 | 21.6 | (0.7) | (1.1) | 2.5 | 1.5 | 2.6 |
| Dividend yield (net) % | 0.0 | 0.7 | 1.9 | 0.7 | 1.3 | 1.7 | 2.0 | 2.3 |
| P/BV | 2.0 | 1.6 | 1.1 | 5.1 | 4.7 | 4.3 | 4.0 | 3.6 |
| EV/revenues (core) | 4.2 | 3.0 | 2.0 | 9.6 | 7.1 | 5.9 | 5.2 | 4.6 |
| EV/EBITDA (UBS core) | 14.2 | 9.7 | 7.2 | 32.7 | 21.9 | 17.6 | 15.2 | 13.2 |
| EV/EBIT (core) | NM | 69.7 | 47.5 | 63.8 | 31.1 | 23.1 | 19.3 | 16.1 |
| EV/OpFCF (core) | 15.4 | 9.9 | 7.4 | 32.6 | 22.0 | 18.4 | 15.5 | 13.3 |
| EV/op. invested capital | 2.0 | 1.7 | 1.3 | 9.4 | 8.2 | 7.4 | 6.7 | 6.0 |
| Enterprise value (NT$m) | 12/23 | 12/24 | 12/25 | 12/26E | 12/27E | 12/28E | 12/29E | 12/30E |
| Market cap. | 67,571 | 59,465 | 43,979 | 228,080 | 228,080 | 228,080 | 228,080 | 228,080 |
| Net de t (cash) | 17,546 | 15,985 | 15,985 | 6,482 | 9,567 | 10,137 | 8,898 | 8,294 |
| Buy out of minorities | 1,394 | 1,020 | 446 | 287 | 287 | 287 | 287 | 287 |
| Pension provisions/other | 0 | 0 | 0 | 0 | 0 | 0 | 0 | 0 |
| Total enterprise value | 86,511 | 76,470 | 60,410 | 234,849 | 237,934 | 238,504 | 237,264 | 236,661 |
| Non core assets | (20,165) | (23,393) | (26,434) | (29,581) | (33,527) | (33,553) | (35,228) | (36,840) |
| Core enterprise value | 66,346 | 53,077 | 33,976 | 205,268 | 204,407 | 204,950 | 202,036 | 199,821 |
| Growth (%) | 12/23 | 12/24 | 12/25 | 12/26E | 12/27E | 12/28E | 12/29E | 12/30E |
| Revenue | (13.6) | 10.2 | (4.7) | 30.2 | 34.7 | 19.4 | 13.0 | 12.2 |
| EBITDA (UBS) | (19.1) | 16.6 | (13.8) | 34.4 | 48.5 | 24.6 | 14.3 | 14.4 |
| EBIT (UBS) | - | - | (6.2) | NM | 103.8 | 35.4 | 18.0 | 18.2 |
| EPS (UBS, diluted) | - | - | 120.5 | 101.3 | 71.9 | 30.9 | 16.2 | 17.9 |
| Net DPS | (100.0) | - | 100.0 | 101.0 | 71.9 | 30.9 | 16.2 | 17.9 |
| argins & Profitability (%) | 12/23 | 12/24 | 12/25 | 12/26E | 12/27E | 12/28E | 12/29E | 12/30E |
| Gross profit margin | 21.9 | 23.2 | 24.2 | 29.4 | 34.9 | 37.1 | 37.8 | 39.0 |
| EBITDA margin | 29.6 | 31.3 | 28.3 | 29.2 | 32.2 | 33.6 | 34.0 | 34.7 |
| EBIT (UBS) margin | (0.4) | 4.4 | 4.3 | 15.0 | 22.7 | 25.7 | 26.9 | 28.3 |
| Net earnings (UBS) margin | NM | 4.4 | 10.2 | 15.7 | 20.1 | 22.0 | 22.7 | 23.8 |
| ROIC (EBIT) | NM | 2.4 | 2.8 | 14.7 | 26.4 | 32.2 | 34.9 | 37.5 |
| ROIC post tax | NM | 2.4 | 2.0 | 11.4 | 21.1 | 25.8 | 28.1 | 30.2 |
| ROE (UBS) | (0.2) | 2.1 | 4.3 | 7.9 | 12.5 | 15.1 | 16.1 | 17.3 |
| Capital structure & Coverage (x) | 12/23 | 12/24 | 12/25 | 12/26E | 12/27E | 12/28E | 12/29E | 12/30E |
| Net de t / EBITDA | 3.7 | 2.7 | 1.1 | 1.2 | 1.2 | 0.7 | 0.7 | 0.5 11.8 |
| Net de t / total equity % | 49.0 | 37.4 | 12.8 | 16.8 | 23.6 | 16.4 | 15.6 | |
| Net de t / (net de t + total equity) % | 32.9 | 27.2 | 11.3 | 14.4 | 19.1 | 14.1 | 13.5 | 10.5 |
| Net de t/EV % | 20.3 | 20.9 | 16.6 | 2.8 | 4.0 122.2 | 4.3 | 3.8 | 3.5 |
| Capex / depreciation % Capex / revenue % | 67.6 | 26.0 | (113.8) | 94.5 | 148.8 | 149.2 | 124.3 | |
| 20.2 | 7.0 | NM | 13.5 | 11.7 | 11.8 | 10.7 | 7.9 | |
| EBIT / net interest Dividend cover (UBS) | - - | 1.3 | 1.8 | 9.4 2.0 | 21.3 | 25.7 2.0 | 32.3 | 46.1 |
| 1.8 | 2.0 | 2.0 | 2.0 | 2.0 | ||||
| Div. payout ratio (UBS) % | - | 55.2 | 50.1 | 50.0 | 50.0 | 50.0 | 50.0 | 50.0 |
| Revenues by division (NT$m) | 12/23 | 12/24 | 12/25 | 12/26E | 12/27E | 12/28E | 12/29E | 12/30E |
| Infrastructure Mo ile | 4,181 | 4,926 7,169 | 5,678 5,479 | 7,491 | 13,272 6,629 | 17,425 6,688 | 20,006 | 22,641 7,596 |
| Light wave | 6,275 | 6,479 | 6,838 | 8,901 | ||||
| 2,401 | 2,236 | 1,789 | 3,419 | 4,796 | 6,201 | 7,800 | ||
| Wi-Fi | 2,012 | 2,645 | 2,992 | 3,207 | 3,340 | 3,335 | 3,471 | 3,711 |
| Others | 967 | 482 | 701 | 1,061 | 1,133 | 1,181 | 1,231 | 1,281 |
| Total | 15,836 | 17,458 | 16,639 | 21,657 | 29,170 | 34,830 | 39,346 | 44,130 |
| EBIT (UBS) by division (NT$m) | 12/25 | 12/26E | 12/28E | 12/29E | 12/30E | |||
| Core | 12/23 | 12/24 | 715 | 12/27E | 12,496 | |||
| Others | (56) 0 | 762 0 | 0 | 3,246 0 | 6,617 0 | 8,958 0 | 10,572 0 | 0 |
| Total | (56) | 762 | 715 | 3,246 | 6,617 | 8,958 | 10,572 | 12,496 |
Source: Company accounts, UBS estimates. (UBS) metrics use reported figures which have een adjusted y UBS analysts.
Forecast returns
| Forecast price appreciation | 34.8% |
|---|---|
| Forecast dividend yield | 0.7% |
| Forecast stock return | 35.5% |
| Market return assumption | 6.3% |
| Forecast excess return | 2 .2% |
Company Description
Esta lished in 1999, WIN Semiconductors is a leading foundry for compound semiconductor wafers glo ally, with 43k 6-inch wafer capacity per month as of end-2022. While it offers different types of compound semiconductors (GaAs, GaN, InP, etc.), the GaAs compound contri utes the majority of its revenue. Its products are used to make signal power amplifiers that customers use in networking equipment and communication devices, including ase stations and smartphones.
Valuation ethod and Risk Statement
We value WIN Semi using PE relative to its historical trading range and peer average. Investing in WIN Semi involves risks that include, ut are not limited to, rapid technological changes, increasing competition, exposure to macroeconomic cycles and uncertain enddemand. Slower wireless technology migration and poor performances y customers could also significantly affect WIN Semi's fundamental performance. WIN Semi's LEO satellite customers may face execution challenges in launching satellites, which will impact WIN Semi's infrastructure revenue growth outlook. On the other hand, its progress on developing and qualifying the optical communication laser diodes will have a significant impact to its earnings outlook and market sentiment. Moreover, it is extremely difficult to project the financial results of tech companies, since their operating models are highly volatile and unpredicta le.
Quantitative Research Review
UBS Glo al Research pu lishes a quantitative assessment of its analysts' responses to certain questions a out the likelihood of an occurrence of a num er of short term factors in a product known as the 'Quantitative Research Review'. The views for this month can e found elow. Views contained in this assessment on a particular stock reflect only the views on those short term factors which are a different timeframe to the 12-month timeframe reflected in any equity rating set out in this note. For previous responses please make reference to (i) previous UBS Glo al Research reports; and (ii) where no applica le research report was pu lished that month, the Quantitative Research Review which can e found at https://neo.u s.com/quantitative, or contact your UBS sales representative for access to the report or the Quantitative Research Team on u s-quant-answers@u s.com. A consolidated report which contains all responses is also availa le and again you should contact your UBS sales representative for details and pricing or the Quantitative Research Team on the email a ove.
WIN Semiconductors
| Question | Response |
|---|---|
| 1. Is the industry structure facing the firm likely to improve or deteriorate over the next six months? Rate on a scale of 1-5 (1 = getting worse, 3 = no change, 5 = getting better, N/A = no view) | 4 |
| 2. Is the regulatory/government environment facing the firm likely to improve or deteriorate over the next six months? Rate on a scale of 1-5 (1 = getting tougher 3 = no change, 5 = getting better, N/A = no view) | 3 |
| 3. Over the last 3-6 months in broad terms have things been improving/no change/getting worse for this stock? Rate on a scale of 1-5 (1 = getting a lot worse, 3 = not much change, 5 = getting a lot better, N/A = no view) | 4 |
| 4. Relative to the current CONSENSUS EPS forecast, is the next company EPS update likely to lead to: (1 = negative surprise vs consensus, 3 = in-line with consensus, 5 = positive surprise vs consensus expectations, N/A = no view) | 4 |
| 5. What's driving the difference? | |
| 6. Relative to YOUR current earnings forecast, is there relatively greater risk at the next earnings result of:(1 = downside skew risk to earnings, 3 = equal upside or downside risk to earnings, 5 = upside skew risk to earnings, N/A = no view) | 3 |
| 7. What's driving the difference? | |
| 8. Is there an upcoming catalyst for the company over the next three months? | Positive Catalyst |
| . Is there an actual or approximate date for the catalyst? | |
| 10. Is the catalyst date an actual or approximate date? | N/A |
| 11. What is the catalyst? | Q326 results |