PDF 原檔:報告_MS_雲端半導體_20260722_original.pdf
報告主體
Morgan Stanley《Cloud Semis: Unlikely to slow down》,主要覆蓋 Aspeed Technology(5274.TWO,台股信驊)與 Montage Technology(688008.SS,中國 A 股,vault 目前無對應頁面,未新建)。內文亦引用 Google TPU、AWS Trainium、Meta MTIA 之 BMC/BIC 搭載估算與全球雲端資本支出追蹤數據。
圖片清單(已驗證 2026-07-23)
| 檔名 | size | 分類 | 親眼所見內容 |
|---|---|---|---|
報告_MS_雲端半導體_20260722_001.png |
66KB | 裝飾·logo·banner | "Asia Summer School 2026" 泳池主題廣告 banner |
報告_MS_雲端半導體_20260722_002.png |
21KB | 真資料圖 | Capex Efficiency 長條圖:General server/H100 server/GB300 NVL72/AI ASIC server 每 BMC 對應資本支出金額(US$k) |
報告_MS_雲端半導體_20260722_003.png |
54KB | 真資料圖 | Aspeed 2026 年 3 月版 BMC TAM Forecast 堆疊長條圖(2026–2030,依 General/AI-related General/GPU/AI ASIC Server 分類,2030 達 65.77mn 單位) |
報告_MS_雲端半導體_20260722_004.png |
58KB | 真資料圖 | Aspeed 產品世代規劃時間軸(BMC/BIC/PFR,2026–2030:AST2700→AST2755→AST2800,含 Caliptra v1.2/v2.1/v3.x) |
報告_MS_雲端半導體_20260722_005.png |
93KB | 真資料圖 | Aspeed 完整產品路線圖時間軸(2023–2027,涵蓋 BMC/BIC/PFR/I-O Expander/AVoIP/Cupola360 各產品線 Design-in/Ramp-up/Production-ready 節點) |
報告_MS_雲端半導體_20260722_006.png |
39KB | 真資料圖 | 伺服器相關公司(Aspeed、緯穎、Accton、Lotes、英業達、廣達等)月營收 YoY 平均成長率折線圖(2022/1–2026/3) |
報告_MS_雲端半導體_20260722_007.png |
52KB | 真資料圖 | 美國處理器年度出口金額+YoY 長條/折線圖(2010–2025) |
報告_MS_雲端半導體_20260722_008.png |
70KB | 真資料圖 | 美國處理器月度出口金額+YoY 長條/折線圖(2023/1–2025/12) |
報告_MS_雲端半導體_20260722_009.png |
49KB | 真資料圖 | 美國資料中心建築支出 vs 其他辦公支出趨勢折線圖(2014–2025) |
報告_MS_雲端半導體_20260722_010.png |
95KB | 真資料圖 | 美國雲端資本支出(Alphabet/Microsoft/Amazon/Meta 合計)YoY 成長率折線圖,1Q26 達 92% |
報告_MS_雲端半導體_20260722_011.png |
55KB | 真資料圖 | MS 雲端資本支出追蹤模型:Current vs Prior 預估比較折線圖(2014–2027,2026e 92% vs 前次 87%) |
報告_MS_雲端半導體_20260722_012.png |
54KB | 真資料圖 | Top 14 雲端業者資本支出金額長條圖(2013–2027,2026e US$916bn、2027e US$1,048bn、MS'27E US$1,304bn) |
報告_MS_雲端半導體_20260722_013.png |
49KB | 真資料圖 | Top 14 雲端業者資本密集度(Capex/Revenue)長條圖(2014–2027,2025 達 18.6%、MS'27E 36.9%) |
報告_MS_雲端半導體_20260722_014.png |
82KB | 真資料圖 | Aspeed BMC 出貨 YoY vs Intel/AMD 伺服器 CPU 出貨 YoY 對比折線圖(1Q22–近期) |
報告_MS_雲端半導體_20260722_015.png |
328KB | 真資料圖 | AWS 官方產品圖:Amazon EC2 Trn3 UltraServer 機櫃實體照(最高 144 顆 Trainium3、362 FP8 PFLOPS、706TB/s 頻寬) |
報告_MS_雲端半導體_20260722_016.png |
758KB | 真資料圖 | AWS Trainium3 UltraServer 機櫃架構圖:Power/BBU shelves、TOR switch、Trainium3 compute tray、NeuronLink switch tray 分層結構 |
報告_MS_雲端半導體_20260722_017.png |
49KB | 真資料圖 | Aspeed FY2 EPS Revision(3 個月移動平均)vs 股價年增率對比折線圖 |
報告_MS_雲端半導體_20260722_018.png |
36KB | 真資料圖 | Aspeed 遠期本益比(Forward P/E)折線圖,含 ±1 標準差帶(Avg 42x、+1SD 54x、-1SD 30x) |
報告_MS_雲端半導體_20260722_019.png |
37KB | 真資料圖 | Aspeed Risk Reward Chart:歷史股價 + 目標價區間扇形圖(Bull NT$25,500/Base NT$20,888/Bear NT$10,000,至 2027/7) |
報告_MS_雲端半導體_20260722_020.png |
31KB | 真資料圖 | Aspeed Consensus Rating Distribution(Overweight 94%/Equal-weight 6%/Underweight 0%)+ Risk Reward Themes(Secular Growth: Positive)資料卡 |
報告_MS_雲端半導體_20260722_021.png |
25KB | 真資料圖 | Aspeed Global Revenue Exposure 區域別營收占比甜甜圈圖(APAC ex-Japan/Mainland China/India、Mainland China、North America 各 20–30%) |
報告_MS_雲端半導體_20260722_022.png |
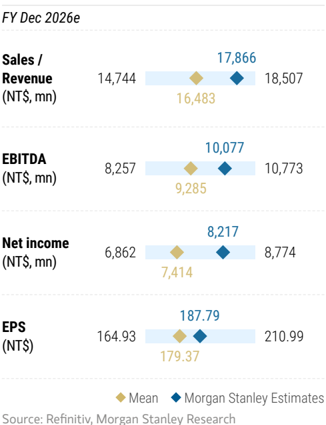
43KB | 真資料圖 | Aspeed MS Estimates vs Consensus 對比圖(FY2026e Sales/EBITDA/Net income/EPS,MS 估值皆高於市場共識) |
報告_MS_雲端半導體_20260722_023.png |
81KB | 真資料圖 | Aspeed 歷史股價走勢+歷次評等與目標價調整標記圖(2023/7–2026/6,目標價自 NT$2,363.64 逐步上調至 NT$21,323.64) |
報告_MS_雲端半導體_20260722_024.png |
65KB | 真資料圖 | Montage Technology 歷史股價走勢+歷次評等與目標價調整標記圖(2023/7–2026/6,目標價自 RMB63 逐步上調至 RMB377) |
原始內容
M July 22, 2026 10:25 PM GMT
Greater China Semiconductors | Asia Pacific
Cloud Semis: Unlikely to slow down
We expect both CPU and GPU server TAM to expand into 2027. We reiterate our OW ratings on both Aspeed and Montage into earnings; accumulate into cloud capex prints.
Key Takeaways
- Our recent China World AI Congress trip suggests ongoing upside for CPU servers, from both China and US vendors.
- The more diversified scale-up solutions for GPU servers in 2027 should translate into strong cloud semis growth.
- Better product mix should support the high GMs for both Aspeed and Montage.
CPU server segment showing more upside, especially in China: We maintain our bull thesis (Cloud semis: Much Larger TAM Ahead) and expect further upside. In our July 17-20 Shanghai WAIC trip, we noted increasing adoption of AMD, Nvidia and Hygon solutions. AMD's multicore benefits, Nvidia's Vera bundle sales strategy, and Hygon's government support and performance catch-up with legacy 6 gen Intel CPU are now attracting increasing orders (see Hygon initiation). High-end x86 CPU pricing continued to trend up in China, nearly 2x Y/Y.
GPU servers strong, with potentially more SuperPods solutions: Almost every domestic GPU vendor displayed a 64- or 128-card scale-up system. Chinese AI GPUs are limited by wafer production/supply at the chip level, but try to connect each GPU together (WAIC note). Nvidia could also have a greater variety of racks in 2027 (see Joe Moore's Nvidia NDR note). We believe SuperPods could be one of the solutions, connecting multiple racks with optics (multi-racks scale-up). Kimi K3 also demonstrated the Nvidia GPU importance in training.
Margin likely to be maintained at high levels: We think cloud semis vendors will benefit from spec migration, driven by strong high-performance server demand. Gross margins for the new solutions (e.g., AST 2700 BMC, legacy BMC with software offering and DDR5 gen 3 interface) are usually higher than that of the prior solutions, which could help offset the higher cost burden, especially from OSAT.
Buy into cloud capex earnings; OW Aspeed and Montage: We believe the upcoming cloud capex announcements could see meaningful upward revision, mainly for memory, but also yielding positive signs for cloud semis companies. We factor in share dividend impact and cut our Aspeed price target, by 11%, to NT $20,888. We think the Korean government's investigation (see results note) offers a good entry point for Montage.
Idea
| Morgan Stanley Taiwan Limited+ Daniel Yen, CFA Equity Analyst Daniel.Yen@morganstanley.com | +886 2 2730-2863 |
|---|---|
| Charlie Chan Equity Analyst Charlie.Chan@morganstanley.com Morgan Stanley Asia Limited+ | +886 2 2730-1725 |
| Daisy Dai, CFA Equity Analyst Daisy.Dai@morganstanley.com | +852 2848-7310 |
| Tiffany Yeh Equity Analyst Tiffany.Yeh@morganstanley.com | +886 2 7712-3032 |
| Ethan Jia Research Associate Ethan.Jia@morganstanley.com | +852 3963-2287 |

Greater China Technology Semiconductors
Asia Pacific
Industry View
Attractive
| What's Changed Aspeed Technology (5274.TWO) | From | To |
|---|---|---|
Morgan Stanley does and seeks to do business with companies covered in Morgan Stanley Research. As a result, investors should be aware that the firm may have a conflict of interest that could affect the objectivity of Morgan Stanley Research. Investors should consider Morgan Stanley Research as only a single factor in making their investment decision.
For analyst certification and other important disclosures, refer to the Disclosure Section, located at the end of this report.
+= Analysts employed by non-U.S. affiliates are not registered with FINRA, may not be associated persons of the member and may not be subject to FINRA restrictions on communications with a subject company, public appearances and trading securities held by a research analyst account.
M
Key charts
Idea
The baseboard management controller (BMC) integrated circuit (IC) (i.e., a specialized microchip) is the key component on the server board. It helps enable remote control for the server firmware system and maintain datacenter stability. Previously, Aspeed indicated that general servers and AI ASIC servers actually generate higher efficiency in hyperscaler capex spending ( Exhibit 1 ). As a result, as the CPU plays a critical role in enabling agentic AI (as the central coordinator that executes instructions, manages system resources, and ensures reliable, real-time decision-making), we expect the growing demand for CPUs/ general servers to further lift Aspeed's BMC revenue in the coming years.
Currently, Aspeed has ~70% sales market share in the CPU server BMC market, with major US and Chinese hyperscalers being its end-customers, including Meta, AWS, Alibaba and Microsoft. As it migrates into the new generation BMC product - AST2700 - we expect it to expand its market share in customers including Dell and Google, which would help expand its revenue, as spec migration also brings 40-50% ASP increase.
Exhibit 1: General servers and AI ASIC servers generate the highest capex efficiency for BMCs
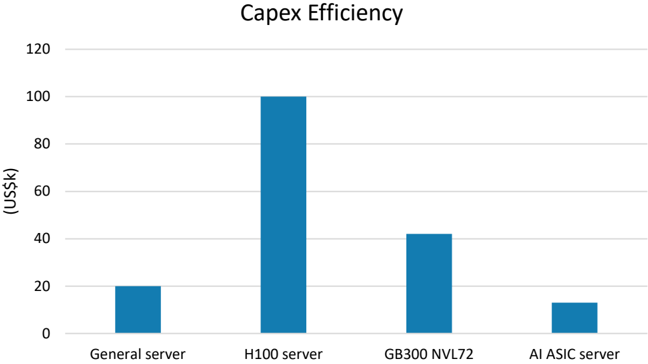
Source: Company data, Morgan Stanley Research. Note: Capex efficiency is defined as the amount of server spend that will contribute to one BMC demand. The lower the capex efficiency, the better for Aspeed.
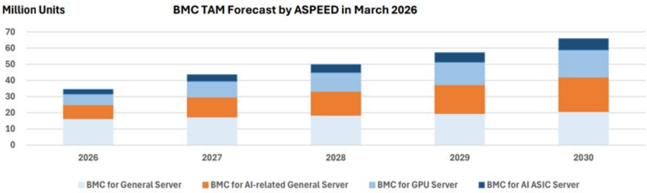
Aspeed, in April, announced an increase in its BMC TAM, from 46.5mn to 65.77mn units in 2030, driven by AI-related general server demand. We think agentic AI will be the key driving force behind this growth. General server growth should be stable at 6% over 2025-30, while AI-related general servers should account for: 1) 25% of total 2026 general server demand; 2) 45% in 2027; and 3) 20% throughout 2028-30 (see Exhibit 29 ).
On the order visibility front, customers began providing forecasts at 7-8x Aspeed's singlemonth revenue. Although Aspeed could not roll out any double booking, the current dynamic is that shipments are well beyond all customers' needs. Customers also expect to double capacity Y/Y in 2027.
70
60
1/0 Expander
50
BIC
40
30
20
10
Cupola360
PFR
AVolP
dounpou annot naadeu
BMC
BMC TAM Forecast Revised
Delivering quantum-resilient OCP Caliptra security across the entire
BIC
BMC
PFR
AST2600
AST2700
Ramp-up
Design-in Phase
AST2700
Production-ready
M
AST1700
Design-in Phase
AST1040
Caliptra v2.1
AST1630 AST1532
AST1530
& AST1535
Ramp-up
Ramp-up
Dual Chips
AST1235
2026
Ramp-up
AST1080
2027
2028
Caliptra v2.1
Ramp-up
BMC for General Server
2023
• BMC for Al-related General Server
2024
Note : 1) BMC for General Servers will grow at 6% CAGR.
Exhibit 2: Aspeed expects its BMC TAM to reach 65.7mn units in 2030
Production-ready
Ramp-up
New BIC
Design-in Phase
Caliptra v3.x AST1540 Production-ready
- New PFR
- 2029 2030 Caliptra v3.x
• BMC for GPU Server
2025
2) BMC for Al-related General Servers is estimated to be 8.5 million in 2026, with 45% growth rate in 2027 and 20% thereafter.
2026
2027
2028
3) BMC for GPU servers and Al ASIC servers in 2026 is based on the estimate of GPU and Al ASIC shipment and the server architecture.
4) Assuming BMC for GPU Servers grow at 45% in 2027 and 20% afterwards. We also include BMCs for ICMS here.
5) Assuming BMC for Al ASIC Servers grow at 45% in 2027 and 20% afterwards.
Source: Aspeed
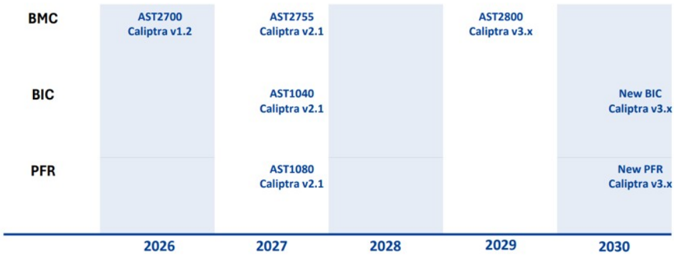
Exhibit 3: Aspeed's product roadmap
Source: Aspeed
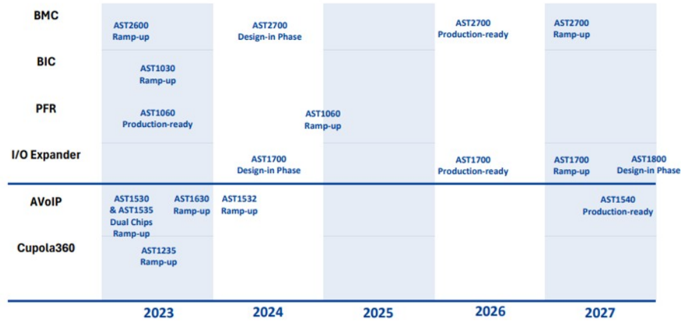
Exhibit 4: Aspeed Product Roadmap
Source: Aspeed
• BMC for Al ASIC Server
AST2700
Ramp-up
M
Idea
Exhibit 5: Server-related companies maintain high Y/Y revenue growth - but slowing a bit because of a high base
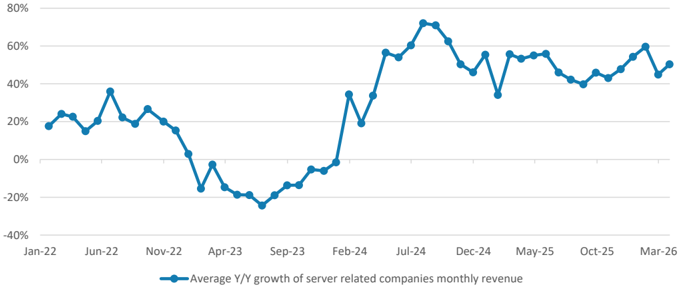
Source: Company data, Morgan Stanley Research. Note: Monthly revenue includes revenue from Aspeed, Wiwynn, Accton, Lotes, Inventec, Quanta, LandMark, Giga-Byte, TSMC, KYEC, AllRing, FOCI, AVC, Auras, Gold Circuit, Unimicron, and Hon Hai.
Exhibit 6: Full-year processor exports increased 68% y/y in 2025
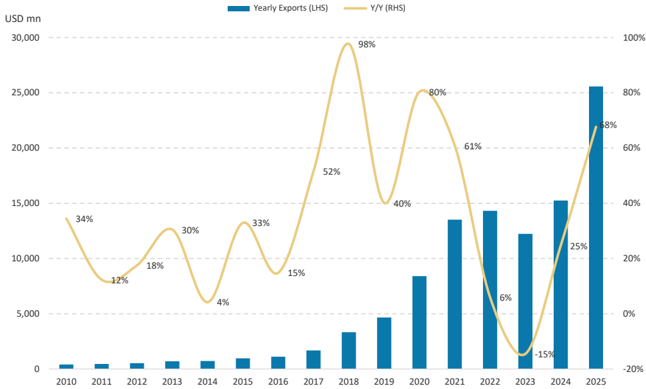
Source: International Trade Administration, Morgan Stanley Research.
M
Exhibit 7: Processor exports maintain strength, with 20 consecutive months of Y/Y growth
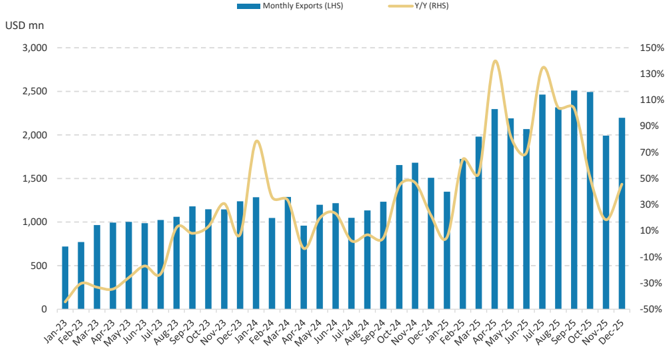
Source: International Trade Administration, Morgan Stanley Research.
Exhibit 8: Data center construction spending rose 35% Y/Y while other office spending declined
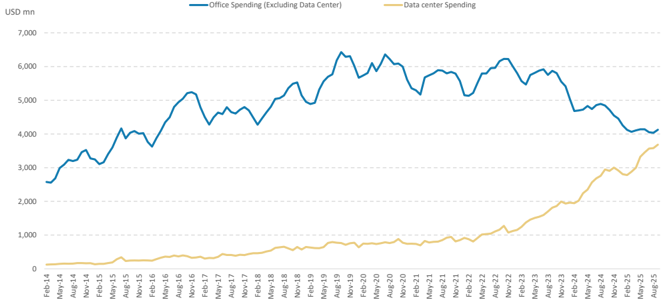
Source: United States Census Bureau, Morgan Stanley Research.
M
Exhibit 9: 1Q26 US cloud capex increased 64% Y/Y, maintaining a level similar to the 65% Y/Y rise in 3Q25
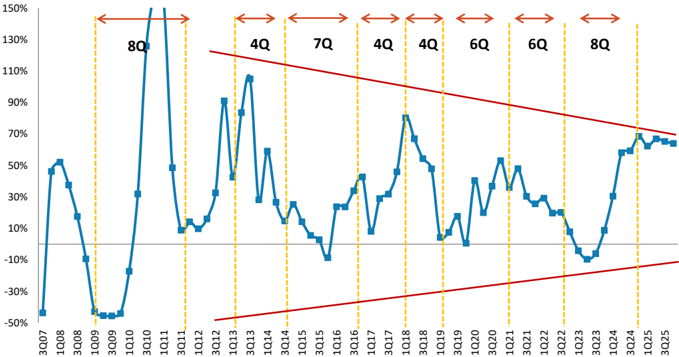
Source: Company data, Morgan Stanley Research. US cloud capex calculated from Alphabet, Microsoft, Amazon, and Meta.
Exhibit 10: Post-US hyperscaler C1Q26 earnings, our cloud capex tracker is now pointing to 92% Y/Y growth in 2026, up 5ppt from the prior forecast of +87% Y/Y in late March 2026
Top 14 Cloud Providers: Cloud Capex Y/Y Growth
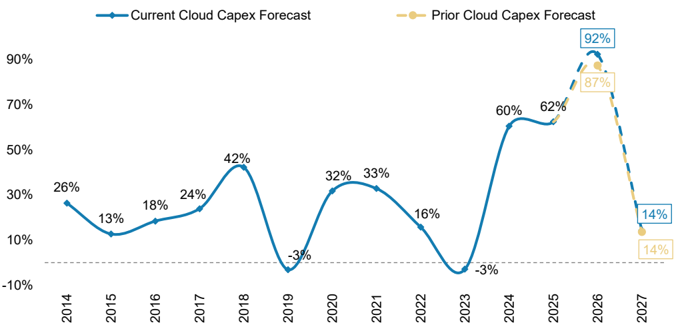
Source: Company data, FactSet, Morgan Stanley Research. Note: Cloud capex includes capex from Alphabet, Amazon, Microsoft, Meta Platforms, Alibaba, Tencent, Baidu, CoreWeave, Apple, IBM, Nebius, IREN, Tesla and Oracle. We start to include CRWV from 2024.
M
Idea
Exhibit 11: Cumulatively, the top 14 cloud players are expected to devote US$916bn to capex in 2026 (MSe), up from US$476bn in 2025
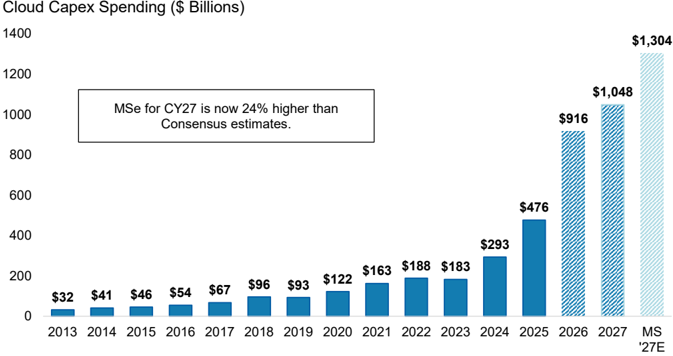
Source: FactSet, Morgan Stanley Research (E) estimates. Note: ORCL forecasts not updated following latest earnings.
Exhibit 12: With stronger cloud capex now expected in 2026, overall capital intensity is now exceeding 31%, a new all-time high
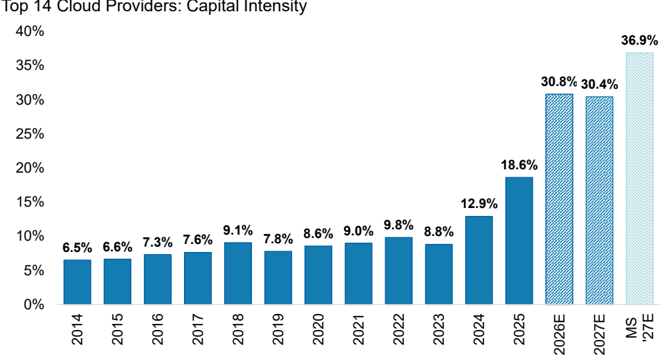
Source: FactSet, Morgan Stanley Research (E) estimates. Note: Dark blue bars based on consensus estimates, light blue bar based on MSe. ORCL forecasts not updated following latest earnings.
200.0%
150.0%
100.0%
50.0%
0.0%
-50.0%
-100.0%
1Q22
M
Exhibit 13: Quarterly Aspeed shipments Y/Y and Intel + AMD CPU shipments Y/Y
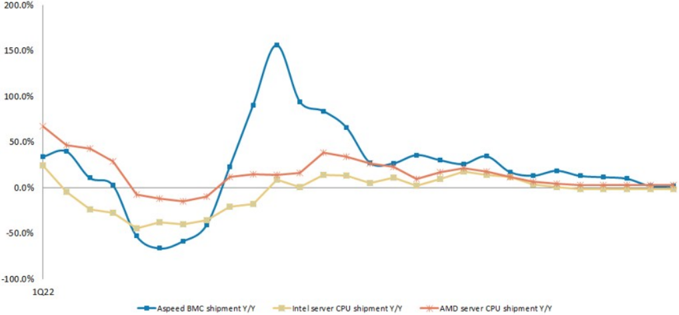
Source: Company data, Morgan Stanley Research (E) estimates.
--Aspeed BMC shipment Y/Y
Intel server CPU shipment Y/Y
Idea
M
Gauging the AI ASIC BMC TAM
Aspeed maintains the lion's share in AI servers, including at NVIDIA, AMD and Trainium. Google TPU has long used MCUs for remote control. Starting with TPUv8t (codename: Sunfish), given better performance, we expect Google to adopt Aspeed's AST2700 BMC controller. Together with our latest updates on 2027e CoWoS and implied ASIC shipment, we estimate an additional 4% revenue contribution in 2026 and 14% in 2027.
Together with other ASICs (mainly TPU, MTIA, and Teton), we expect ASIC racks to contribute 10% and 21% of Aspeed's total revenue in 2026 and 2027, respectively. Further upside potential could come as orders beyond 2026 remain uncertain for now, and other ASIC players - including Microsoft, SoftBank/Arm, Apple, and Fujitsu - all plan to build ASIC servers in the coming years.
We therefore expect AI ASIC servers to strengthen Aspeed's growth over the next few years.
Exhibit 14: Gauging the ASIC TAM for Aspeed: We expect 2026-27 to see ASIC racks contribute respective 10% and 21% of its total revenue
| 2026e chip shipment | 2026e chip shipment | 2026e chip shipment | 2027e chip shipment | 2027e chip shipment | 2027e chip shipment | |||||||
|---|---|---|---|---|---|---|---|---|---|---|---|---|
| CSP | Rack | Rack MPtime | Accelerator name | BMCGeneration | BMCtoASICper rack% | BIC to ASIC per rack% | Accelerator chip shipment (k units) | BMC (k units) | BIC (k units) | Accelerator chip shipment (k units) | BMC (k units) | BIC (k units) |
| AWS | Teton3 Teton4 | 2H26-2027 1H28 | Trainium 3 Trainium 4 | AST2700 AST2700 | 69% 69% | 1,700 | 1,181 | 2,380 150 | 1,653 104 | |||
| TPU v8i | 2026 | Sunfish | AST2700 | 70% | 900 | 630 | 4,000 | 2,800 | ||||
| TPU v8t | 2026 | Zebrafish | AST2700 | 70% | 500 | 350 | 3,000 | 2,100 | ||||
| TPU v9 | 2027 | Humufish | AST2700 | 70% | 150 | 105 | ||||||
| Meta | Santa Babara | 2026-2027 | MTIA 3 Iris &3.5 Arke | AST2700 | 100% | 150 | 150 | 550 | 550 | |||
| Total BMCandBICshipment(kunits) | Total BMCandBICshipment(kunits) | Total BMCandBICshipment(kunits) | Total BMCandBICshipment(kunits) | Total BMCandBICshipment(kunits) | Total BMCandBICshipment(kunits) | Total BMCandBICshipment(kunits) | Total BMCandBICshipment(kunits) | 2,311 | 7,312 | |||
| AST2700 | AST2700 | AST2700 | AST2700 | AST2700 | AST2700 | AST2700 | AST2700 | 2,311 | 7,312 | |||
| BIC | BIC | BIC | BIC | BIC | BIC | BIC | BIC | |||||
| BMCASP(US$) AST2700 | BMCASP(US$) AST2700 | BMCASP(US$) AST2700 | BMCASP(US$) AST2700 | BMCASP(US$) AST2700 | BMCASP(US$) AST2700 | BMCASP(US$) AST2700 | BMCASP(US$) AST2700 | 25 | 25 | |||
| BIC ASP (US$) Revenue | contribution from | ASIC (US$mn) | BIC ASP (US$) Revenue | BIC ASP (US$) Revenue | BIC ASP (US$) Revenue | BIC ASP (US$) Revenue | BIC ASP (US$) Revenue | 57,764 | 182,799 | |||
| Revenue contribution from ASIC (NT$bn) | Revenue contribution from ASIC (NT$bn) | Revenue contribution from ASIC (NT$bn) | Revenue contribution from ASIC (NT$bn) | Revenue contribution from ASIC (NT$bn) | Revenue contribution from ASIC (NT$bn) | Revenue contribution from ASIC (NT$bn) | Revenue contribution from ASIC (NT$bn) | 1,733 | 5,484 | |||
| Aspeed CYRevenue (NT$bn) | Aspeed CYRevenue (NT$bn) | Aspeed CYRevenue (NT$bn) | Aspeed CYRevenue (NT$bn) | Aspeed CYRevenue (NT$bn) | Aspeed CYRevenue (NT$bn) | Aspeed CYRevenue (NT$bn) | Aspeed CYRevenue (NT$bn) | 17,866 | 26,027 | |||
| %oftotal revenue | %oftotal revenue | %oftotal revenue | %oftotal revenue | %oftotal revenue | %oftotal revenue | %oftotal revenue | %oftotal revenue | 9.7% | 21.1% |
Source: Morgan Stanley Research (e) estimates
Exhibit 15: We estimate AWS's Trainium/Teton racks will contribute 5% and 5.1% of TAM revenue in 2026 and 2027, respectively
| 2026e | 2027e | |
|---|---|---|
| Total ASIC shipment | 1,700 | 2,530 |
| Trainium2 | - | - |
| Trainium3 | 1,700 | 2,380 |
| Trainium4 | 150 | |
| BMC to ASIC per rack ratio | 70.2% | 69.4% |
| AST2700 ASP (US$) | 25 | 25 |
| Revenue contribution from AWS (US$mn) | 29,846 | 43,924 |
| Revenue contribution from AWS (NT$bn) | 895 | 1,318 |
| Implied CY Revenue (%) | 5.0% | 5.1% |
Source: Morgan Stanley Research (e) estimates
camoll 1o.
M
Exhibit 16: AWS Trainium3 UltraServer
Amazon EC2 Trn3 UltraServer
Up to 144 Trainium Chips | 362 FP8 PFLOPS | 706 TB/s aggregate bandwidth
Gee. ALAIO
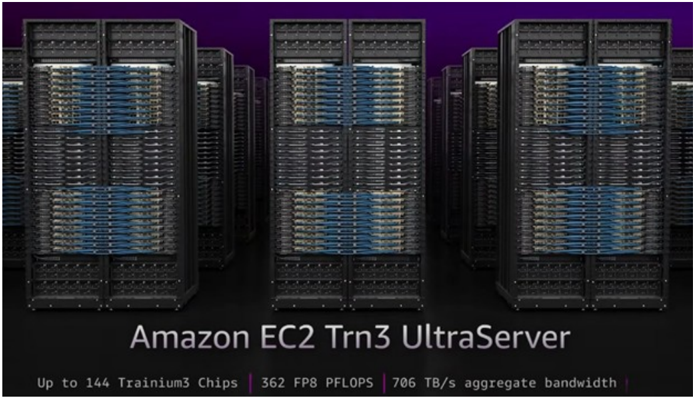
Source: AWS.
M
Trainium3 compute tray
Trainium3 compute tray
Trainium3 compute tray
Trainium3 compute tray
Trainium3 compute tray
Trainium3 compute tray
Trainium3 compute tray
Trainium3 compute tray
Trainium3 compute tray
NeuronLinkswitch tray
NeuronLinkswitchtray
NeuronLink switch tray
NeuronLink switch tray
NeuronLinkswitch tray
NeuronLink switch tray
NeuronLink switch tray
NeuronLink switchtray
NeuronLink switch tray
NeuronLink switch tray
Trainium3 compute tray
Trainium3 compute tray
Trainium3 compute tray
Trainium3 compute tray
Trainium3 compute tray
Trainium3 compute tray
Trainium3 compute tray
Trainium3 compute tray
Trainium3 compute tray
TOR switch
Power/BBU shelves
Exhibit 17: AWS Trainium3 UltraServer architecture
Trainium3 compute tray
Trainium3 compute tray
Trainium3 compute tray
Trainium3 compute tray
Trainium3 compute tray
Trainium3 compute tray
Trainium3 compute tray
Trainium3 compute tray
NeuronLink switch tray
NeuronLink switch tray
NeuronLink switch tray
NeuronLink switch tray
NeuronLink switchtray
NeuronLink switch tray
NeuronLink switch tray
NeuronLink switch tray
NeuronLink switch tray
NeuronLink switch tray
Trainium3 compute tray
Trainium3 compute tray
Trainium3 compute tray
Trainium3 compute tray
Trainium3 compute tray
Trainium3 compute tray
Trainium3 compute tray
Trainium3 compute tray
Trainium3 compute tray
TOR switch
••*
Power/BBU shelves
...
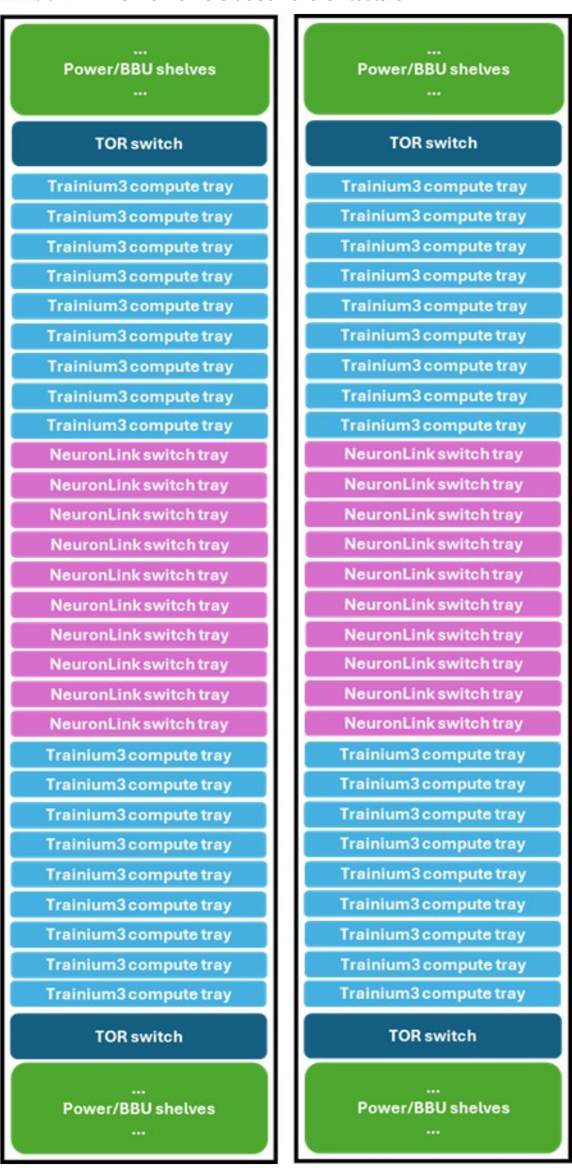
Source: AWS, Morgan Stanley Research.
M
Exhibit 18: We estimate Google TPU will contribute 4.1% and 14.4% of TAM total revenue in 2026 and 2027, respectively
| 2026e | 2027e | 2028e | |
|---|---|---|---|
| Total ASIC shipment | 1,400 | 7,150 | 6,500 |
| TPUv8i (3nm, Sunfish; by Broadcom) | 900 | 4,000 | 2,500 |
| TPUv8t (3nm, Zebrafish; by MediaTek) | 500 | 3,000 | 1,000 |
| TPUv9 (2nm, Humufish; by MediaTek) | - | 150 | 3,000 |
| BMC to ASIC per rack ratio | 70.0% | 70.0% | 70.0% |
| AST2700 ASP (US$) | 25 | 25 | 25 |
| Revenue contribution from Google (US$mn) | 24,500 | 125,125 | 113,750 |
| Revenue contribution from Google (NT$bn) | 735 | 3,754 | 3,413 |
| Implied CY Revenue (%) | 4.1% | 14.4% | 9.4% |
Source: Morgan Stanley Research estimates
Exhibit 19: We estimate Meta MTIA to contribute a respective 0.6% and 1.6% of TAM total revenue in 2026 and 2027, respectively
| 2025e | 2026e | 2027e | |
|---|---|---|---|
| Total ASIC shipment | 50 | 150 | 550 |
| MTIA 2 | 50 | ||
| MTIA 3 | 150 | 550 | |
| MTIA 3.5 | |||
| BMC to ASIC per rack ratio | 71.9% | 100.0% | 100.0% |
| AST2600 ASP (US$) | 15 | ||
| AST2700 ASP (US$) | 25 | 25 | |
| BIC to ASIC per rack ratio | 78.1% | ||
| BIC ASP (US$) | 6 | ||
| Revenue contribution from Meta (US$mn) | 234 | 3,750 | 13,750 |
| Revenue contribution from Meta (NT$bn) | 7 | 113 | 413 |
| Implied CY Revenue (%) | 0.1% | 0.6% | 1.6% |
Source: Morgan Stanley Research estimates
M
Aspeed: Estimate Revisions
We decrease our EPS estimates by 19% for 2026, 17% for 2027 and 15% for 2028: We
factor in the preliminary 2Q26 revenue, and increase our respective revenue projections by 3% for 2026 to factor in a slower ramp of AST2700 in 2026, for which we now expect a slightly slower pace of ASP climb vs our previous outlook. However, we do expect steeper ramp for AST2700 into 2027, as demand for next-generation CPU remains very strong amid greater ASIC server ramp. The decline in our EPS estimates mainly stems from share dividend payout.
Exhibit 20: Aspeed: Earnings estimate revisions
| NT$ mn | Current 2026E | Previous 2026E | Diff. | Current 2027E | Previous 2027E | Diff. | Current 2028E | Previous 2028E | Diff. |
|---|---|---|---|---|---|---|---|---|---|
| Net sales | 17,866 | 18,507 | -3% | 26,027 | 25,891 | 1% | 36,206 | 35,207 | 3% |
| COGS | 5,534 | 5,469 | 7,584 | 7,546 | 10,218 | 9,943 | |||
| Gross profit | 12,332 | 13,038 | -5% | 18,443 | 18,345 | 1% | 25,988 | 25,264 | 3% |
| Operating expenses | 2,255 | 2,265 | 2,978 | 2,975 | 3,545 | 3,525 | |||
| Operating profit | 10,077 | 10,773 | -6% | 15,464 | 15,370 | 1% | 22,443 | 21,738 | 3% |
| Non-op. income (exp.) | 196 | 196 | 116 | 116 | 116 | 116 | |||
| Pretax Income | 10,273 | 10,969 | -6% | 15,580 | 15,486 | 1% | 22,559 | 21,854 | 3% |
| Taxes | 2,056 | 2,195 | 3,118 | 3,099 | 4,515 | 4,374 | |||
| Net income | 8,217 | 8,774 | -6% | 12,462 | 12,386 | 1% | 18,044 | 17,481 | 3% |
| Reported EPS | 187.79 | 232.09 | -19% | 272.45 | 327.66 | -17% | 394.48 | 462.42 | -15% |
| Margins | |||||||||
| Gross margin | 69.0% | 70.4% | -1 ppt | 70.9% | 70.9% | 0 ppt | 71.8% | 71.8% | 0 ppt |
| Operating margin | 56.4% | 58.2% | -2 ppt | 59.4% | 59.4% | 0 ppt | 62.0% | 61.7% | 0 ppt |
| Pretax margin | 57.5% | 59.3% | -2 ppt | 59.9% | 59.8% | 0 ppt | 62.3% | 62.1% | 0 ppt |
| Net margin | 46.0% | 47.4% | -1 ppt | 47.9% | 47.8% | 0 ppt | 49.8% | 49.7% | 0 ppt |
Source: Company data, Morgan Stanley Research (E) estimates
Exhibit 21: Aspeed: Quarterly financials
| NT$ in million (YE DEC31) | 1Q26 | 2Q26E | 3Q25E | 4Q26E | 1Q27E | 2Q27E | 3Q27E | 4Q27E | 1Q28E | 2Q28E | 3Q28E | 4Q28E | 2024 | 2025 | 2026E | 2027E | 2028E |
|---|---|---|---|---|---|---|---|---|---|---|---|---|---|---|---|---|---|
| Total Revenues | 3,147 | 3,871 | 4,726 | 6,122 | 5,331 | 6,002 | 7,115 | 7,579 | 8,260 | 8,993 | 9,308 | 9,644 | 6,460 | 9,085 | 17,866 | 26,027 | 36,206 |
| Sequential Change | 28.8% | 23.0% | 22.1% | 29.5% | -12.9% | 12.6% | 18.6% | 6.5% | 9.0% | 8.9% | 3.5% | 3.6% | |||||
| Change vs Year Ago | 52.4% | 72.3% | 102.8% | 150.6% | 69.4% | 55.0% | 50.6% | 23.8% | 54.9% | 49.8% | 30.8% | 27.3% | 106.4% | 40.6% | 96.7% | 45.7% | 39.1% |
| Cost of Sales | 970 | 1,219 | 1,489 | 1,857 | 1,549 | 1,745 | 2,074 | 2,216 | 2,353 | 2,545 | 2,621 | 2,699 | 2,306 | 2,906 | 5,534 | 7,584 | 10,218 |
| Percent of Revenues | 31% | 31% | 32% | 30% | 29% | 29% | 29% | 29% | 28% | 28% | 28% | 28% | 36% | 32% | 31% | 29% | 28% |
| Gross Margin | 2,177 | 2,653 | 3,237 | 4,265 | 3,782 | 4,257 | 5,041 | 5,363 | 5,907 | 6,448 | 6,688 | 6,946 | 4,154 | 6,179 | 12,332 | 18,443 | 25,988 |
| Percent of Revenues | 69.2% | 68.5% | 68.5% | 69.7% | 70.9% | 70.9% | 70.8% | 70.8% | 71.5% | 71.7% | 71.8% | 72.0% | 64.3% | 68.0% | 69.0% | 70.9% | 71.8% |
| Incremental Margin | 72% | 66% | 68% | 74% | NM | 71% | 70% | 69% | 80% | 74% | 76% | 77% | 64% | 77% | 70% | 75% | 74% |
| Total Opex | 518 | 549 | 583 | 605 | 716 | 729 | 762 | 771 | 865 | 880 | 896 | 904 | 1,235 | 1,518 | 2,255 | 2,978 | 3,545 |
| Percent of Revenues | 16.5% | 14.2% | 12.3% | 9.9% | 13.4% | 12.2% | 10.7% | 10.2% | 10.5% | 9.8% | 9.6% | 9.4% | 19.1% | 16.7% | 12.6% | 11.4% | 9.8% |
| R&D | 350 | 370 | 390 | 390 | 450 | 450 | 460 | 460 | 500 | 500 | 510 | 510 | 829 | 1,042 | 1,501 | 1,820 | 2,020 |
| Percent of Revenues | 11.1% | 9.6% | 8.3% | 6.4% | 8.4% | 7.5% | 6.5% | 6.1% | 6.1% | 5.6% | 5.5% | 5.3% | 12.8% | 11.5% | 8.4% | 7.0% | 5.6% |
| General & administrative | 118 | 118 | 118 | 118 | 159 | 159 | 159 | 159 | 200 | 200 | 200 | 201 | 286 | 349 | 473 | 638 | 801 |
| Percent of Revenues | 3.8% | 3.1% | 2.5% | 1.9% | 3.0% | 2.7% | 2.2% | 2.1% | 2.4% | 2.2% | 2.1% | 2.1% | 4.4% | 3.8% | 2.6% | 2.4% | 2.2% |
| Selling & marketing | 49 | 61 | 74 | 96 | 107 | 120 | 142 | 152 | 165 | 180 | 186 | 193 | 120 | 128 | 281 | 521 | 724 |
| Percent of Revenues | 1.6% | 1.6% | 1.6% | 1.6% | 2.0% | 2.0% | 2.0% | 2.0% | 2.0% | 2.0% | 2.0% | 2.0% | 1.9% | 1.4% | 1.6% | 2.0% | 2.0% |
| Operating Income | 1,659 | 2,103 | 2,654 | 3,660 | 3,066 | 3,527 | 4,279 | 4,592 | 5,042 | 5,568 | 5,791 | 6,042 | 2,918 | 4,660 | 10,077 | 15,464 | 22,443 |
| Percent of Revenues | 52.7% | 54.3% | 56.2% | 59.8% | 57.5% | 58.8% | 60.1% | 60.6% | 61.0% | 61.9% | 62.2% | 62.6% | 45.2% | 51.3% | 56.4% | 59.4% | 62.0% |
| Change vs Year Ago | 61.5% | 77.6% | 115.5% | 200.6% | 84.8% | 67.7% | 61.2% | 25.5% | 64.5% | 57.8% | 35.3% | 31.6% | 170% | 60% | 116% | 53% | 45% |
| Total Non-operating Income(Loss) | 109 | 29 | 29 | 29 | 29 | 29 | 29 | 29 | 29 | 29 | 29 | 29 | 249 | 195 | 196 | 116 | 116 |
| Profit Before Taxes | 1,768 | 2,132 | 2,683 | 3,689 | 3,095 | 3,556 | 4,308 | 4,621 | 5,071 | 5,597 | 5,820 | 6,071 | 3,167 | 4,855 | 10,273 | 15,580 | 22,559 |
| Percent of Revenues | 56% 354 | 55% 427 | 57% 537 | 60% | 58% | 59% | 61% | 61% | 61% 1,015 | 62% | 63% | 63% | 49% | 53% | 58% 2,056 | 60% | 62% |
| Taxes Tax Rate | 20.0% | 20.0% | 20.0% | 738 20.0% | 619 20.0% | 712 20.0% | 862 20.0% | 925 20.0% | 20.0% | 1,120 20.0% | 1,165 20.0% | 1,215 | 596 | 928 19.1% | 20.0% | 3,118 20.0% | 4,515 20.0% |
| Net Income, | 1,414 | 3,446 | 4,477 | 20.0% | 18.8% | 3,928 | |||||||||||
| Cont Ops | 1,706 | 2,146 | 2,951 | 2,475 | 2,845 | 3,696 | 4,056 | 50% | 4,656 | 4,856 | 2,571 | 8,217 | 12,462 | 18,044 | |||
| Percent of Revenues | 45% | 44% | 45% | 48% | 46% | 47% | 48% | 49% | 49% | 50% | 50% | 40% | 43% | 46% | 48% | 50% | |
| Reported Income (TW GAAP) | 1,414 | 1,706 | 2,146 | 2,951 | 2,475 | 2,845 | 3,446 | 3,696 | 4,056 | 4,477 | 4,656 | 4,856 | 2,571 | 3,928 | 8,217 | 12,462 | 18,044 |
| Percent of Revenues | 45% | 44% | 45% | 48% | 46% | 47% | 48% | 49% | 49% | 50% | 50% | 50% | 40% | 43% | 46% | 48% | 50% |
| Change vs Year Ago | 0% | 0% | 0% | 0% | 0% | 0% | 0% | 0% | 0% | 0% | 0% | 0% | 155% | 53% | 109% | 52% | 45% |
| Change vs Year Ago | 46% | 104% | 45% | 62.19 | 75.34 | 80.81 | 88.67 | 106.16 | 155% | 81% | 272.45 | 394.48 | |||||
| Reported EPS (NT$, TW GAAP) | 37.41 60% | 37.29 124% | 46.92 | 64.51 | 54.11 | 67% | 61% | 25% | 64% | 97.87 57% | 101.78 35% | 31% | 68.05 | 103.94 53% | 187.79 | 45% | 45% |
Source: Company data, Morgan Stanley Research (E) estimates
M
Aspeed: Valuation Methodology
We cut our price target (base case scenario value) from NT$23,456 to NT$20,888: This reflects our EPS changes in 2026-2028e and shares outstanding changes from share dividend issuance.
Our key assumptions are unchanged, including:
- Medium-term growth rate of 21.4%
- Terminal growth rate of 5.5%
- Cash payout ratio of 85%
- Cost of equity of 9.8% (2% risk-free rate, 6% risk premium, 1.3 beta)
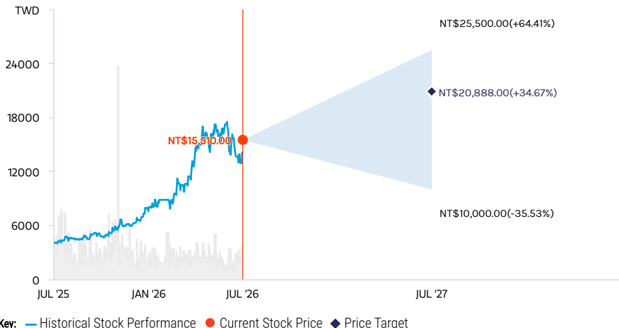
Our bull and bear case scenario values also decrease from NT$28,700 and NT$11,300, to NT$25,500 and NT$10,000, respectively, implying 94/65x and 37/25x our 2027e/2028e EPS estimates.
Exhibit 22: Aspeed: Residual income model
| NT$million | 2026E | 2027E | 2028E | 2029E | 2030E | 2031E | 2032E | 2033E | 2034E | 2035E | 2036E | 2037E |
|---|---|---|---|---|---|---|---|---|---|---|---|---|
| Total Equity | 12,509 | 18,079 | 25,655 | 30,804 | 37,056 | 44,647 | 53,865 | 65,059 | 78,650 | 95,153 | 115,193 | 139,525 |
| Net Profit | 8,217 | 12,462 | 18,044 | 21,910 | 26,605 | 32,305 | 39,226 | 47,631 | 57,836 | 70,227 | 85,274 | 103,544 |
| ROAE | 81.8% | 81.5% | 82.5% | 77.6% | 78.4% | 79.1% | 79.6% | 80.1% | 80.5% | 80.8% | 81.1% | 81.3% |
| Residual Income | 5,456 | 8,970 | 13,151 | 17,404 | 21,142 | 25,680 | 31,190 | 37,881 | 46,005 | 55,869 | 67,847 | 82,390 |
| Spread | 72.1% | 71.7% | 72.7% | 67.8% | 68.6% | 69.3% | 69.9% | 70.3% | 70.7% | 71.0% | 71.3% | 71.5% |
| Ending Equity Capital | 12,509 | |||||||||||
| PV of Forecast Period | 173,082 | |||||||||||
| PV of Continuing Value | 728,390 | |||||||||||
| Equity Value | 913,981 | |||||||||||
| No. of Shares | 44 | |||||||||||
| Projected Price | 20,888 |
Source: Company data, Morgan Stanley Research (E) estimates
Exhibit 23: Aspeed: Estimate revision breadth
Exhibit 24: Aspeed: Forward P/E ratio
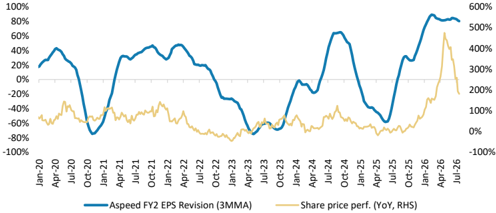
Source: Company data, Morgan Stanley Research estimates
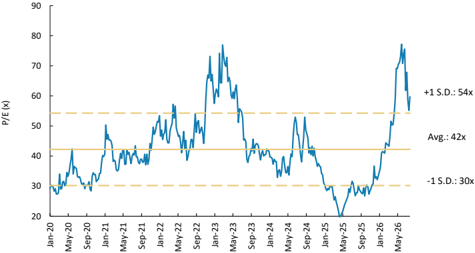
Source: Company data, Morgan Stanley Research estimates
M
Risk Reward - Aspeed Technology (5274.TWO) Risk Reward - Aspeed Technology (5274.TWO)
Agentic AI demand for general server driving further upside; OW
NT$20,888.00 PRICE TARGET
Base case, residual income model. Key assumptions:
- Cost of equity of 9.8% (2.0% risk-free rate, 6% risk premium, 1.3 beta)
- Medium-term growth rate of 21.4%
- Terminal growth rate of 5.5%
- Cash payout ratio of 85%
Consensus Price Target Distribution
Source: Refinitiv, Morgan Stanley Research
RISK REWARD CHART
Key:
Source: Refinitiv, Morgan Stanley Research
BULL CASE
NT$25,500.00
94x 2027e EPS
Booming data center demand with signi fi cant share gains; meaningful OPM expansion; new businesses take off faster than expected: Significant earnings growth from data center demand and market share gains in white brands and US server brands. Margins improve considerably. New business growth accelerates. We also assume AI servers fully ramp-up, and clients execute new server platform migration faster than expected.
NT$6,727.27
BASE CASE
NT$20,888.00
77x 2027e EPS
Cloud/traditional servers momentum resuming; remains a bene fi ciary of ASICs;
new business bears fruit: 1) Revenue growth of 97% Y/Y in 2026 after strong growth in 2025; 2) gross margin of 69% in 2026 vs. 68.1% in 2025, OPM improves to 56.4% in 2026 vs. 52.2% in 2025; 3) TPU gets more demand from Aspeed's BMC and agentic AI drives more general server demand.
NT$18,562.27
NT$22,727.27
MS PT
Morgan Stanley Estimates
Mean
OVERWEIGHT THESIS
- We see continual general server shipment upward revisions, likely to exceed 40% Y/Y in 2026.
- Aspeed's shipments are currently capped by T-glass shortage, but the company is now qualifying E-glass, which we believe can help expand its shipments to over 2mn units per month.
- Aspeed maintains the lion's share in ASIC racks. Google TPU has long adopted MCU, while we see it utilizing Aspeed's BMC in its next-generation TPU. We expect this to contribute 13% of revenue in each 2027 and 2028.
- Our price target implies 77x our 2027e and 53x our 2028e EPS, above the 42x average one-year forward P/E since 2020, which we find justified by improving demand and new market share expansion.
BEAR CASE
NT$10,000.00
37x 2027e EPS
Disappointing end-demand, with share loss; operating margin pressure; new businesses face challenges: Revenue growth decelerates amid slow data center demand and share loss amid a weakening macro environment. OPM pressure emerges amid intense competition. New businesses stay flattish as end-markets take off more slowly.
M
Risk Reward - Aspeed Technology (5274.TWO)
KEY EARNINGS INPUTS
| Drivers | Dec 2025 | Dec 2026e Dec | 2027e | Dec 2028e |
|---|---|---|---|---|
| BMC revenue (NT$, mn) | 8,024 | 16,433 | 23,621 | 32,204 |
| 360 degree SoC revenue (NT$, mn) | 62 | 67 | 95 | 154 |
| PC/AV extension IC revenue (NT$, mn) | 105 | 44 | 47 | 52 |
INVESTMENT DRIVERS
- Expanding share in baseboard management controller (BMC) market
- Cloud spending acceleration from customers
- Margin expansion
- New business progress
GLOBAL REVENUE EXPOSURE
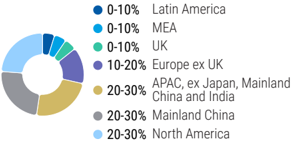
Source: Morgan Stanley Research Estimate View explanation of regional hierarchies here
RISKS TO PT/RATING
RISKS TO UPSIDE
- Stronger cloud demand
- Faster-than-expected spec migration
- Mild competition
RISKS TO DOWNSIDE
- Softening cloud demand
- Slower-than-expected spec migration
- Intensified competition
- Further policy tightening in China
OWNERSHIP POSITIONING
Inst. Owners, % Active
71.3%
Source: Refinitiv, Morgan Stanley Research
MS ESTIMATES VS. CONSENSUS
M
Aspeed: Financial Summary
Income Statement
| NT$mn (Years End Dec ) | 2024 | 2025 | 2026E | 2027E | 2028E |
|---|---|---|---|---|---|
| Net sales | 6,460 | 9,085 | 17,866 | 26,027 | 36,206 |
| COGS | (2,306) | (2,906) | (5,534) | (7,584) | (10,218) |
| Gross profit | 4,154 | 6,179 | 12,332 | 18,443 | 25,988 |
| Operating expenses | (1,235) | (1,518) | (2,255) | (2,978) | (3,545) |
| Operating income | 2,918 | 4,660 | 10,077 | 15,464 | 22,443 |
| Non-operating income | 249 | 195 | 196 | 116 | 116 |
| Pre-tax income | 3,167 | 4,855 | 10,273 | 15,580 | 22,559 |
| Income tax | 596 | 928 | 2,056 | 3,118 | 4,515 |
| Reported net Income | 2,571 | 3,928 | 8,217 | 12,462 | 18,044 |
| Adj.wtd.avg.shrs( m) | 38 | 38 | 41 | 42 | 42 |
| Reported EPS (NT$) | 68.05 | 103.94 | 187.79 | 272.45 | 394.48 |
Balance Sheet
| NT$mn (Years End Dec ) | 2024 | 2025 | 2026E | 2027E | 2028E |
|---|---|---|---|---|---|
| Cash | 3,659 | 5,788 | 9,359 | 13,675 | 19,699 |
| Mkt Securities | 352 | 510 | 510 | 510 | 510 |
| AR/NR | 1,437 | 1,606 | 2,993 | 4,359 | 6,064 |
| Inventory | 357 | 280 | 606 | 831 | 1,120 |
| Other | 181 | 224 | 224 | 224 | 224 |
| Current Assets | 5,987 | 8,408 | 13,693 | 19,600 | 27,618 |
| Long-term investments | 0 | 0 | 0 | 0 | 0 |
| Fixed assets | 355 | 409 | 439 | 469 | 499 |
| Deferred assets | 69 | 59 | 59 | 59 | 59 |
| Other assets | 1,316 | 1,457 | 1,457 | 1,457 | 1,457 |
| Total Assets | 7,726 | 10,334 | 15,648 | 21,585 | 29,633 |
| S/T borrowings | 0 | 0 | 0 | 0 | 0 |
| AP/NP | 426 | 616 | 992 | 1,359 | 1,831 |
| Other ST liabilities | 1,457 | 1,828 | 1,828 | 1,828 | 1,828 |
| LT debt | 0 | 0 | 0 | 0 | 0 |
| Other LT liabilities | 204 | 319 | 319 | 319 | 319 |
| Common shares | 378 | 378 | 378 | 378 | 378 |
| Total Liabilities | 2,087 | 2,763 | 3,139 | 3,506 | 3,978 |
| Additional capital | 2,440 | 2,665 | 2,665 | 2,665 | 2,665 |
| Retained earning | 2,851 | 4,529 | 9,468 | 15,037 | 22,613 |
| Other shareholders' equity | (31) | (2) | (2) | (2) | (2) |
| Total Equity | 5,639 | 7,571 | 12,509 | 18,079 | 25,655 |
| Total Liab. & Shrhldr's Equity | 7,726 | 10,334 | 15,648 | 21,585 | 29,633 |
E = Morgan Stanley Research Estimates
Source: Morgan Stanley Research, Company Data
Cash Flow Statement
| NT$mn (Years End Dec ) | 2024 | 2025 | 2026E | 2027E | 2028E |
|---|---|---|---|---|---|
| Cashflow from Operations | 3,145 | 4,496 | 6,880 | 11,238 | 16,523 |
| Net profits | 2,571 | 3,928 | 8,217 | 12,462 | 18,044 |
| Depreciation | 121 | 167 | 0 | 0 | 0 |
| Working Capital Change | (66) | 453 | (1,337) | (1,224) | (1,522) |
| Other adjustments | 519 | (52) | 0 | 0 | 0 |
| Cashflow from Investing | (345) | (395) | (30) | (30) | (30) |
| Capex | (25) | (274) | (30) | (30) | (30) |
| Change of LT Investment | 0 | 0 | 0 | 0 | 0 |
| Change of ST Investment | 43 | (128) | 0 | 0 | 0 |
| Other adjustments | (363) | 8 | 0 | 0 | 0 |
| Cashflow from financing | (781) | (1,991) | (3,279) | (6,893) | (10,468) |
| Increase in L/T debt | 0 | 0 | 0 | 0 | 0 |
| Increase in S/T debt | 0 | 0 | 0 | 0 | 0 |
| Cash Dividend Paid | (756) | (1,967) | (3,279) | (6,893) | (10,468) |
| Dir& Emp Bonus Paid | 0 | 0 | 0 | 0 | 0 |
| Issuance of stock | 0 | 0 | 0 | 0 | 0 |
| Other adjustments | (25) | (25) | 0 | 0 | 0 |
| Exchange rate adjustment | 30 | 19 | 0 | 0 | 0 |
| Net change in cash | 2,048 | 2,129 | 3,571 | 4,316 | 6,024 |
Financial Ratios
| 2024 | 2025 | 2026E | 2027E | 2028E | |
|---|---|---|---|---|---|
| Growth(%) | |||||
| Turnover | 106.4 | 40.6 | 96.7 | 45.7 | 39.1 |
| Operating profits | 170.3 | 59.7 | 116.2 | 53.5 | 45.1 |
| EPS | 155.2 | 52.7 | 80.7 | 45.1 | 44.8 |
| Margins (%) | |||||
| Gross Margin | 64.3 | 68.0 | 69.0 | 70.9 | 71.8 |
| Operating Margin | 45.2 | 51.3 | 56.4 | 59.4 | 62.0 |
| Pretax Margin | 49.0 | 53.4 | 57.5 | 59.9 | 62.3 |
| Net Margin | 39.8 | 43.2 | 46.0 | 47.9 | 49.8 |
| Return (%) | |||||
| ROAE | 54.3 | 59.5 | 81.8 | 81.5 | 82.5 |
| ROAA | 41.9 | 43.5 | 63.3 | 66.9 | 70.5 |
| Gearing (%) | |||||
| Net Debt/Equity | (64.9) | (76.5) | (74.8) | (75.6) | (76.8) |
| Liabilities/Equity | 37.0 | 36.5 | 25.1 | 19.4 | 15.5 |
| Ratios (X) | |||||
| Current ratio | 3.2 | 3.4 | 4.9 | 6.1 | 7.5 |
| Quick ratio | 2.7 | 3.0 | 4.4 | 5.7 | 7.0 |
| Others | |||||
| AR/NR Turnover (days) | 61 | 61 | 61 | 61 | 61 |
| Inventory Turnover (days) | 52 | 40 | 40 | 40 | 40 |
| AP Turnover (days) | 53 | 65 | 65 | 65 | 65 |
| Cash Conversion (days) | 60 | 36 | 36 | 36 | 36 |
M
Valuation Methodology and Risks
Montage Technology Co Ltd (688008.SS)
Base case, residual income model. Key assumptions:
- n 8.4% CoE (1.2 beta, 3.0% risk-free rate, and 4.5% risk premium)
- n 30% payout ratio
- n 19.3% medium-term growth rate
- n 4% terminal growth rate
We believe these assumptions are justified, given the cloud capex growth, DRAM interface technology migration, and Montage's strong position in China's datacenter semi localization.
Risks to Upside
- n Faster-than-expected phase-out of US peers
- n Faster-than-expected spec migration
Risks to Downside
- n Weaker-than-expected cloud demand
- n Slower-than-expected DRAM interface technology migration
- n Delay in new product launches
Idea
M
Risk Reward Reference links
- View explanation of Options Probabilities methodology -Options_Probabilities_Exhibit_Link.pdf
- View descriptions of Risk Rewards Themes - RR_Themes_Exhibit_Link.pdf
- View explanation of regional hierarchies - GEG_Exhibit_Link.pdf
- View explanation of Theme/Exposure methodology -ESG_Sustainable_Solutions_External_Link.pdf
- View explanation of HERS methodology - ESG_HERS_External_Link.pdf
M
Disclosure Section
The information and opinions in Morgan Stanley Research were prepared or are disseminated by Morgan Stanley Asia Limited (which accepts the responsibility for its contents) and/or Morgan Stanley Asia (Singapore) Pte. (Registration number 199206298Z) and/or Morgan Stanley Asia (Singapore) Securities Pte Ltd (Registration number 200008434H), regulated by the Monetary Authority of Singapore (which accepts legal responsibility for its contents and should be contacted with respect to any matters arising from, or in connection with, Morgan Stanley Research), and/or Morgan Stanley Taiwan Limited and/or Morgan Stanley & Co International plc, Seoul Branch, and/or Morgan Stanley Australia Limited (A.B.N. 67 003 734 576, holder of Australian financial services license No. 233742, which accepts responsibility for its contents), and/or Morgan Stanley Wealth Management Australia Pty Ltd (A.B.N. 19 009 145 555, holder of Australian financial services license No. 240813, which accepts responsibility for its contents), and/or Morgan Stanley India Company Private Limited having Corporate Identification No (CIN) U22990MH1998PTC115305, regulated by the Securities and Exchange Board of India ('SEBI') and holder of licenses as a Research Analyst (SEBI Registration No. INH000001105); Stock Broker (SEBI Stock Broker Registration No. INZ000244438), Merchant Banker (SEBI Registration No. INM000011203), and depository participant with National Securities Depository Limited (SEBI Registration No. IN-DP-NSDL-567-2021) having registered office at Altimus, Level 39 & 40, Pandurang Budhkar Marg, Worli, Mumbai 400018, India; Telephone no. +91-22-61181000; Compliance Officer Details: Mr. Tejarshi Hardas, Tel. No.: +91-22-61181000 or Email: tejarshi.hardas@morganstanley.com; Grievance officer details: Mr. Tejarshi Hardas, Tel. No.: +91-22-61181000 or Email: msic-compliance@morganstanley.com which accepts the responsibility for its contents and should be contacted with respect to any matters arising from, or in connection with, Morgan Stanley Research, and their affiliates (collectively, "Morgan Stanley"). Morgan Stanley India Company Private Limited (MSICPL) may use AI tools in providing research services. All recommendations contained herein are made by the duly qualified research analysts.
For important disclosures, stock price charts and equity rating histories regarding companies that are the subject of this report, please see the Morgan Stanley Research Disclosure Website at www.morganstanley.com/eqr/disclosures/webapp/generalresearch, or contact your investment representative or Morgan Stanley Research at 1585 Broadway, (Attention: Research Management), New York, NY, 10036 USA.
For valuation methodology and risks associated with any recommendation, rating or price target referenced in this research report, please contact the Client Support Team as follows: US/Canada +1 800 303-2495; Hong Kong +852 2848-5999; Latin America +1 718 754-5444 (U.S.); London +44 (0)20-7425-8169; Singapore +65 6834-6860; Sydney +61 (0)2-9770-1505; Tokyo +81 (0)3-6836-9000. Alternatively you may contact your investment representative or Morgan Stanley Research at 1585 Broadway, (Attention: Research Management), New York, NY 10036 USA.