PDF 原檔:報告_JPM_國巨AI被動元件_20260601_original.pdf
原始內容
YAGEO
AI story a bit different, but could be just as good
- MLCC UTR could rise fast in coming months. YAGEO does not have the leadership in the high capacitance/voltage MLCCs, which are used heavily in AI server systems. However, as much of its major peers' capacity is tied up with these fast-growing AI products, which can consume as much as 3-5x production resources vs regular MLCCs, we expect the overflow orders to lift YAGEO's IT MLCC UTR by 10ppt in 1H (YoY), and further increased to 15ppt YoY in 2H (hence we now expect 85-90% peak IT UTR for YAGEO to be reached in 2H; while auto/industrial MLCC UTR shall also improve on YoY basis). We also believe that, due to the AI-driven high UTR and B/B ratios of the industry, the potential consumer demand impact (if the segment weakens) should be manageable. As a rule of thumb, the key factor behind the pricing of passive component is the respective UTR of the product.
- General IT MLCC could see a bit of pricing surprise. On the pricing side, while the major AI MLCC suppliers in Japan and Korea have not finalized the price hike decisions, the JPM team expects an increasingly constructive pricing environment. It is crucial to understand that the price hike timing and momentum for general IT (non-AI) MLCCs could surprise on the upside, as hikes could take place earlier/rise in stronger magnitude vs the AI MLCCs. We believe many suppliers would leverage the industry supply tightness to improve the mix and/or the relatively low margins of these non-AI applications, where the pricing initiative could start with non-AI products. Please keep in mind we have seen this situation occurr for memory, PCB and CCL in the past few years, and this could result in strong incremental improvements in profitability for general IT MLCCs, a situation that we believe is favorable for YAGEO.
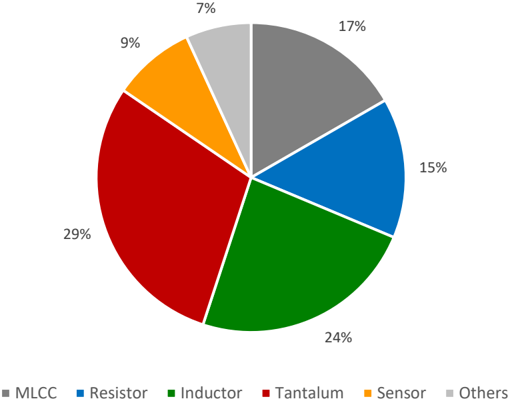
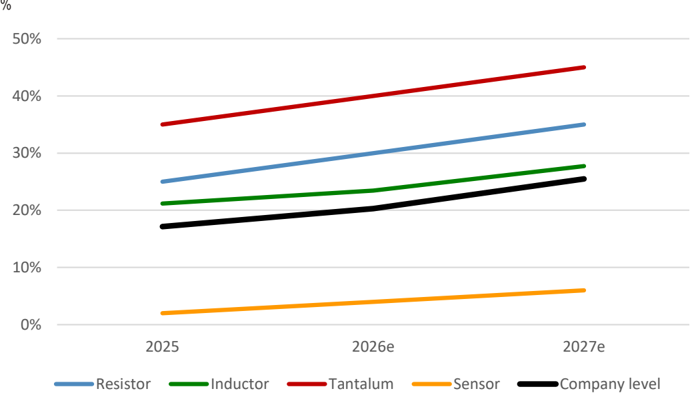
- AI story much beyond MLCC : Tantalum entering multi-year up-cycle. We believe YAGEO has a bit of a different AI story vs. its peers, which mainly produce MLCCs. YAGEO's revenue mix is largely filled with non-MLCC products such as Tantalum (No.1 product by rev mix for YAGEO at ~25/30% in 2026/27e), power inductors (25-30% of YAGEO's total inductors, which are its No.2 product by revenue) and resistors (14/15% of YAGEO revenue in 2026/27e). This could see a very rapid rise in AI mix, and/or see stronger pricing momentum as YAGEO can exert much more clout on pricing vs. MLCCs, which are largely determined by Japanese producers (which have a tendency to maintain stable pricing). We expect tantalum's double-digit ASP growth in recent years will likely accelerate as AI quickly becomes 35-40% of its mix (driven by the need for power management and data storage). Investors should realize that Tantalum market consists of several niche applications, hence AI could move the needle faster here vs. other passive component segments.
- AI story much beyond MLCC : Resistors could be the realsource of upside .
While YAGEO's strong positioning in tantalum is widely known by investors, we believe the chip resistors, which is the No.3/4 product of YAGEO in 2027e
Sources for: Style Exposure - J.P. Morgan Global Markets Strategy; all other tables are company data and J.P. Morgan estimates.
See page 10 for analyst certification and important disclosures, including non-US analyst disclosures.
Overweight
2327.TW, 2327 TT Price (01 Jun 26):NT$790.00
▲Price Target (Dec-26):NT$1,000.00
Prior (Dec-26):NT$406.00
Technology
Jerry Tsai AC
(886-2) 2725-9867 jerry.tsai@jpmorgan.com
J.P. Morgan Securities (Taiwan) Limited
Josie Yu
(886-2) 2725-9877 josie.yu@jpmorgan.com J.P. Morgan Securities (Taiwan) Limited
Gokul Hariharan
(852) 2800-8564 gokul.hariharan@jpmorgan.com J.P. Morgan Securities (Asia Pacific) Limited/ J.P.
Morgan Broking (Hong Kong) Limited
| Key Changes (FYE Dec) | Key Changes (FYE Dec) | Key Changes (FYE Dec) | Key Changes (FYE Dec) |
|---|---|---|---|
| Prev | Cur | Δ | |
| Adj. EPS - 27E (NT$) | 21.38 | 30.22 | 41.4% |
| Quarterly Forecasts (FYE Dec) | Quarterly Forecasts (FYE Dec) | Quarterly Forecasts (FYE Dec) | Quarterly Forecasts (FYE Dec) |
|---|---|---|---|
| 2025A | 2026E | 2027E | |
| Q1 | 10.77 | 3.90A | 6.55 |
| Q2 | 9.74 | 3.89 | 7.49 |
| Q3 | 3.10 | 4.51 | 8.09 |
| Q4 | 3.29 | 4.67 | 8.08 |
| FY | 11.40 | 16.98 | 30.22 |
Style Exposure
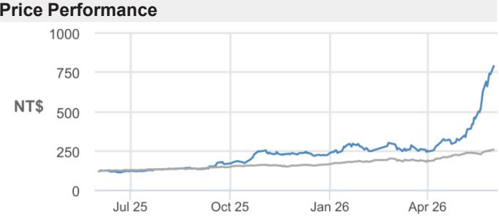
| YTD | 1m | 3m | 12m | |
|---|---|---|---|---|
| Abs | 242.0% | 149.2% | 165.1% | 544.9% |
| Rel | 185.5% | 132.7% | 137.1% | 429.0% |
| Company Data | |
|---|---|
| Shares O/S (mn) | 2,054 |
| 52-week range (NT$) | 811.00-111.75 |
| Market cap ($ mn) | 51,729 |
| Exchange rate | 31.36 |
| Free float (%) | 80.8% |
| 3M ADV (mn) | 40.99 |
| 3M ADV ($ mn) | 495.7 |
| Volatility (90 Day) | 72 |
| Index | TAIEX |
| BBG ANR (Buy | Hold | Sell) | 16|0|0 |
Key Metrics (FYE Dec)
| NT$ in millions | FY25A | FY26E | FY27E | FY28E |
|---|---|---|---|---|
| Financial Estimates | ||||
| Revenue | 132,930 | 171,165 | 240,511 | 312,892 |
| Adj. EBIT | 29,801 | 43,217 | 78,860 | 121,616 |
| Adj. EBITDA | 39,635 | 58,376 | 102,611 | 152,606 |
| Adj. net income | 23,634 | 35,106 | 62,646 | 97,111 |
| Adj. EPS | 11.40 | 16.98 | 30.22 | 46.85 |
| BBG EPS | 11.32 | 17.35 | 22.46 | 25.46 |
| Cashflow from operations | 49,937 | (1,422) | 41,668 | 73,763 |
| FCFF | 43,881 | (10,147) | 31,668 | 63,763 |
| Margins and Growth | ||||
| Revenue Growth Y/Y (%) | 9.3% | 28.8% | 40.5% | 30.1% |
| EBIT margin | 22.4% | 25.2% | 32.8% | 38.9% |
| EBIT Growth Y/Y (%) | 27.4% | 45.0% | 82.5% | 54.2% |
| EBITDA margin | 29.8% | 34.1% | 42.7% | 48.8% |
| EBITDA Growth Y/Y (%) | 20.1% | 47.3% | 75.8% | 48.7% |
| Net margin | 17.8% | 20.5% | 26.0% | 31.0% |
| Adj. EPS growth | (72.6%) | 48.9% | 78.0% | 55.0% |
| Ratios | ||||
| Adj. tax rate | 23.6% | 22.8% | 23.0% | 23.0% |
| Interest cover | NM | NM | NM | NM |
| Net debt/Equity | 0.4 | 0.5 | 0.3 | 0.1 |
| Net debt/EBITDA | 1.7 | 1.5 | 0.6 | 0.2 |
| ROE | 14.3% | 19.8% | 30.0% | 36.2% |
| Valuation | ||||
| FCFF yield | 2.7% | (0.6%) | 1.9% | 3.9% |
| Dividend yield | 0.6% | 0.4% | 0.6% | 1.1% |
| EV/Revenue | 2.0 | 1.7 | 1.1 | 0.7 |
| EV/EBITDA | 6.7 | 4.9 | 2.6 | 1.5 |
| Adj. P/E | 69.3 | 46.5 | 26.1 | 16.9 |
Summary Investment Thesis and Valuation
Investment Thesis
We are OW on YAGEO, given its leading position in tantalum capacitors after acquiring Kemet and its strong presence in MLCCs/R-Chips, a market that has consolidated over time with disciplined supply expansion. We believe less exposure to commodity-type products can help smooth the revenue fluctuations, while increasing demand for tantalum capacitors can support YAGEO's future top- and bottom-line growth.
Valuation
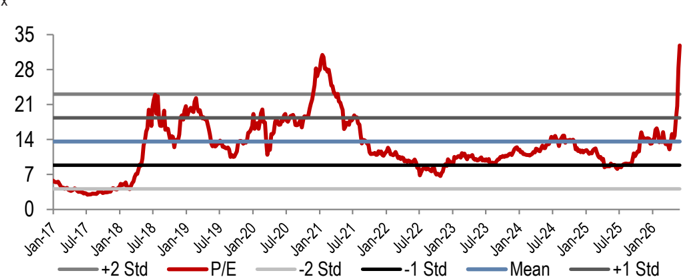
Our Dec-26 PT of NT$1,000 is based on 26x 2027/28E EPS. 26x is beyond 1.5-STD above average forward P/E at which the company has traded since 2021. We believe the multiple is justified as passive component enters demand-driven upcycle, which is more structural and healthy versus the previous cycle in 2018-19. We believe YAGEO is one of the key beneficiaries of this cycle with 1) dominance in high-end passives (global leader in Tantalum), and 2) MLCC price hike starting from the lower-end segment.
Performance Drivers
(behind Tantalum and inductor), has drew much less attention. We believe resistors, which have a high correlation in usage vs. MLCC, could be a major incremental OP contributor with comparable impact to Tantalum in the coming years, as we see healthy pricing upside. YAGEO has quite a dominating global share (40% by volume, which is a very high level in the world of passive components), while the product has gone through many years of modest pricing (hence it currently makes up a tiny small portion of the passive BOM despite its indispensable role), the growing demand now likely pushes YAGEO's resistor UTR to north of 90% in the upcoming peak season. Given these favorable conditions, we expect resistor pricing, which saw a successful hike in 1Q26, to increase by 15-20% CAGR in the coming years and further improve its already decent profitability.
- Lifting TP to NT$1,000 , based on 26x of average 2027/28e EPS. YAGEO is currently trading at 48/27x 2026/27e EPS, which is meaningfully below its Japanese and Korean peers, despite 1) comparably strong earnings growth (with potential upside if price adjustment becomes stronger vs. our assumptions of ASP showing a ~15% CAGR in the coming 2-3 years), and 2) similar exposure to AI/HPC (but with much more diverse product exposure). Our new target multiple, at 26x (was 19x which was above 1.5-STD above mean; previous TP based on 2027e), is slightly above the 23-24x forward earnings multiple YAGEO traded at during the 2018-19 peak cycle. While there are some similarities between the previous cycle vs the current one (EV/industrial caused supply tightness vs. AI) we believe such re-rating is deserving as this margin expansion cycle could last even longer as most of the major suppliers seem to have taken mix improvement as their long term goal, which leads more rational capacity expansions. We also believe the AI driven demand will moderate the pace of component size miniaturization, hence positive to the industry supply/demand balance.
Figure 1: YAGEO 2027e rev mix by product
%
Source: J.P. Morgan estimates.
Figure 2: YAGEO AI/HPC mix by product
All data is based on J.P.Morgan estimates. Source: J.P. Morgan estimates.
Table 1: YAGEO price hike scenario analysis
| 2026e | 2027e | 2028e | 2027e OP vs base case | 2028e OP vs base case | |
|---|---|---|---|---|---|
| Scen 1 | No price hike on MLCC; 65-70% of resistor sees 10% price hike; 35-40% of inductor sees 10% price hike; 85%+ of Tantalum sees 10% price hike | No price hike on MLCC; 65-70% of resistor sees 20% price hike; 45-50% of inductor sees 20% price hike; 85%+ of Tantalum sees 20% price hike | 25-30% of MLCC sees 10% price hike; 85%+ of resistor sees 10% price hike; 55-60% of inductor sees 10% price hike; 85%+ of Tantalum sees 20% price hike | -11% | -15% |
| Scen 2 (base case) | 35-40% of MLCC sees 10% price hike; 85%+ of resistor sees 10% price hike; 45-50% of inductor sees 10% price hike; 85%+ of Tantalum sees 10% price hike | 35-40% of MLCC sees 20% price hike; 85%+ of resistor sees 20% price hike; 45-50% of inductor sees 20% price hike; 85%+ of Tantalum sees 20% price hike | 85%+ of MLCC sees 15% price hike; 85%+ of resistor sees 15% price hike; 55-60% of inductor sees 15% price hike; 85%+ of Tantalum sees 25% price hike | 0% | 0% |
| Scen 3 | 85%+ of MLCC sees 10% price hike; 85%+ of resistor sees 10% price hike; 45-50% of inductor sees 10% price hike; 85%+ of Tantalum sees 10% price hike | 85%+ of MLCC sees 25% price hike; 85%+ of resistor sees 25% price hike; 45-50% of inductor sees 25% price hike; 85%+ of Tantalum sees 25% price hike | 85%+ of MLCC sees 15% price hike; 85%+ of resistor sees 20% price hike; 55-60% of inductor sees 20% price hike; 85%+ of Tantalum sees 30% price hike | +15% | +20% |
Source: J.P. Morgan estimates.
Figure 4: YAGEO P/E trend
x
Source: J.P. Morgan estimates, Company data.
Figure 3: Consumer MLCC size: Miniaturization has been a LT trend affecting MLCC supplies
% (vertical axis); year (omit the first two digits) (horizontal axis)
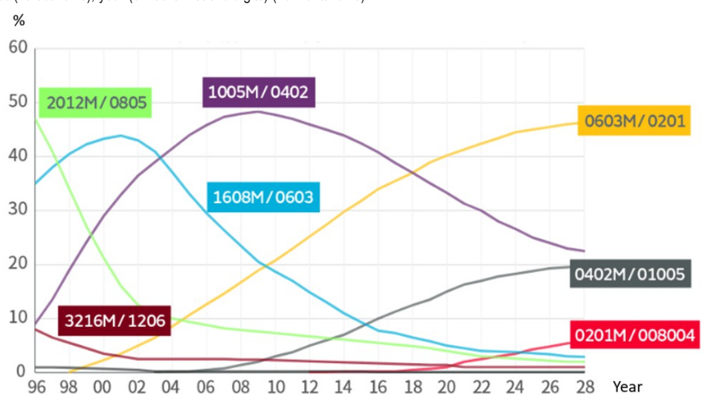
Source: Murata
Table 2: Peer valuation
| PE (x) | PE (x) | PE (x) | PB (x) | PB (x) | PB (x) | NI yoy (%) | NI yoy (%) | NI yoy (%) | ROE (%) | ROE (%) | ROE (%) | |||
|---|---|---|---|---|---|---|---|---|---|---|---|---|---|---|
| Company | Ticker | Price (LCY$) | 2026E | 2027E | 2028E | 2026E | 2027E | 2028E | 2026E | 2027E | 2028E | 2026E | 2027E | 2028E |
| Yageo | 2327 TT | 810 | 47.7 | 26.8 | 17.3 | 9.1 | 7.2 | 5.5 | 49% | 78% | 55% | 20% | 30% | 36% |
| Murata Mfg Co | 6981 JP | 10,955 | 67.3 | 45.9 | 34.9 | 7.2 | 6.5 | 5.7 | 27% | 47% | 31% | 11% | 15% | 17% |
| Taiyo Yuden Co | 6976 JP | 16,930 | 88.1 | 47.0 | 31.3 | 6.3 | 5.6 | 4.8 | 62% | 105% | 50% | 7% | 14% | 18% |
| Tdk Corp | 6762 JP | 4,104 | 31.6 | 26.5 | N.A. | 3.7 | 3.4 | N.A. | 26% | 19% | N.A. | 12% | 13% | N.A. |
| Samsung Electro | 009150 KS | 2,043,000 | 103.9 | 49.9 | 38.4 | 15.0 | 11.9 | 8.5 | 108% | 108% | 35% | 14% | 25% | 26% |
| Vishay Intertech | VSH US | 52 | 70.3 | 33.7 | N.A. | 3.7 | 3.5 | N.A. | N.A. | 140% | N.A. | 6% | N.A. | N.A. |
| Average | Average | 68.2 | 38.3 | 30.5 | 7.5 | 6.4 | 6.1 | 54% | 83% | 43% | 12% | 19% | 25% |
J.P.Morgan covers YAGEO (by Jerry Tsai), Murata (by Akinori Kanemoto), Taiyo Yuden (by Akinori Kanemoto), TDK (by Akinori Kanemoto), and Samsung Electro (by Jay Kwon) - whose financial data is based on J.P.Morgan estimates. All other data is based on Bloomberg Finance L.P. estimates. Stocks priced as of 1 June 2026, except Vishay, which is priced as of 29 May, Source: J.P. Morgan estimates, Bloomberg Finance L.P. estimates.
Table 3: I/S Highlights: Annual JPMe vs Consensus
NT$ mn except for EPS
| JPMe | JPMe | JPMe | Consensus | Consensus | Consensus | Difference | Difference | Difference | |
|---|---|---|---|---|---|---|---|---|---|
| FY26E | FY27E | FY28E | FY26E | FY27E | FY28E | FY26E | FY27E | FY28E | |
| Revenues | 171,165 | 240,511 | 312,892 | 167,455 | 199,548 | 224,690 | 2% | 21% | 39% |
| Gross profit | 65,630 | 110,009 | 160,650 | 65,566 | 81,587 | 92,143 | 0% | 35% | 74% |
| GM (%) | 38.3% | 45.7% | 51.3% | 39.2% | 40.9% | 41.0% | -81bps | 485bps | 1,033bps |
| Operating profit | 43,217 | 78,860 | 121,616 | 44,203 | 56,927 | 64,257 | -2% | 39% | 89% |
| OPM (%) | 25.2% | 32.8% | 38.9% | 26.4% | 28.5% | 28.6% | -115bps | 426bps | 1,027bps |
| Pre-Tax profit | 45,670 | 81,549 | 126,309 | 46,756 | 59,853 | 69,094 | -2% | 36% | 83% |
| Net profit | 35,106 | 62,646 | 97,111 | 35,690 | 45,525 | 52,335 | -2% | 38% | 86% |
| Net Margin | 20.5% | 26.0% | 31.0% | 21.3% | 22.8% | 23.3% | -80bps | 323bps | 774bps |
| EPS (NT$) | 16.98 | 30.22 | 46.85 | 17.35 | 22.46 | 25.46 | -2% | 35% | 84% |
Source: J.P. Morgan estimates, Bloomberg Finance L.P.
Table 4: I/S Highlights: Annual Revised vs Previous
NT$ mn except for EPS
| Revised | Revised | Revised | Previous | Previous | Difference | Difference | |
|---|---|---|---|---|---|---|---|
| FY26E | FY27E | FY28E | FY26E | FY27E | FY26E | FY27E | |
| Revenues | 171,165 | 240,511 | 312,892 | 162,554 | 191,190 | 5% | 26% |
| Gross profit | 65,630 | 110,009 | 160,650 | 64,028 | 78,907 | 3% | 39% |
| GM (%) | 38.3% | 45.7% | 51.3% | 39.4% | 41.3% | -105bps | 447bps |
| Operating profit | 43,217 | 78,860 | 121,616 | 43,139 | 54,812 | 0% | 44% |
| OPM (%) | 25.2% | 32.8% | 38.9% | 26.5% | 28.7% | -129bps | 412bps |
| Pre-Tax profit | 45,670 | 81,549 | 126,309 | 45,814 | 57,746 | 0% | 41% |
| Net profit | 35,106 | 62,646 | 97,111 | 35,217 | 44,317 | 0% | 41% |
| Net Margin | 20.5% | 26.0% | 31.0% | 21.7% | 23.2% | -115bps | 287bps |
| EPS (NT$) | 16.98 | 30.22 | 46.85 | 16.99 | 21.38 | 0% | 41% |
Source: J.P. Morgan estimates.
Table 5: JPM Quarterly and Annual Estimates
NT$mn, year-end December
| FY25 | FY25 | FY25 | FY25 | FY26E | FY26E | FY26E | FY26E | FY27E | FY27E | FY27E | FY27E | FY28E | FY28E | FY28E | FY28E | ||||||
|---|---|---|---|---|---|---|---|---|---|---|---|---|---|---|---|---|---|---|---|---|---|
| 1Q | 2Q | 3Q | 4Q | 1Q | 2QE | 3QE | 4QE | 1QE | 2QE | 3QE | 4QE | 1QE | 2QE | 3QE | 4QE | FY23 FY24 | FY25 | FY26E | FY27E | FY28E | |
| Sales | 31,104 | 32,771 | 33,087 | 35,968 | 38,166 | 40,809 | 45,517 | 46,673 | 53,649 | 60,921 | 63,625 | 62,316 | 72,717 | 77,675 | 80,898 | 81,601 | 107,609 121,667 | 132,930 | 171,165 | 240,511 | 312,892 |
| qoq (%) | 4% | 5% | 1% | 9% | 6% | 7% | 12% | 3% | 15% | 14% | 4% | -2% | 17% | 7% | 4% | 1% | 0% 0% | 0% | 0% | 0% | 0% |
| yoy (%) | 9% | 4% | 4% | 20% | 23% | 25% | 38% | 30% | 41% | 49% | 40% | 34% | 36% 28% | 27% | 31% | -11% | 13% | 9% | 29% | 41% | 30% |
| Gross profit | 11,086 | 11,652 | 11,974 | 13,417 | 14,542 | 15,141 | 17,666 | 18,281 | 24,175 | 27,455 | 29,262 | 29,117 | 37,226 39,762 | 41,453 | 42,209 | 36,026 41,803 | 48,130 | 65,630 | 110,009 | 160,650 | |
| Operating (EBIT) | 6,463 | 7,044 | 7,562 | 8,732 | 9,613 | 9,698 | 11,695 | 12,210 | 17,132 | 19,560 | 21,097 | 21,071 | 28,099 | 30,103 31,396 | 32,019 | 20,430 23,386 | 29,801 | 43,217 | 78,860 | 121,616 | |
| Net profit | 5,530 | 4,998 | 6,356 | 6,751 | 8,001 | 8,073 | 9,342 | 9,690 | 13,586 | 15,530 | 16,771 | 16,759 | 22,334 | 24,007 | 25,166 | 25,603 17,427 | 19,356 | 23,634 | 35,106 | 62,646 | 97,111 |
| Revenue breakdown by application | |||||||||||||||||||||
| YAGEO original | 33% | 33% | 34% | 32% | 31% | 31% | 32% | 32% | 32% | 32% | 32% | 31% | 30% | 30% | 29% | 29% | 40% 35% | 33% | 31% | 32% | 30% |
| R-chip | 14% | 14% | 15% | 14% | 14% | 13% | 14% | 14% | 15% | 15% | 15% | 14% | 14% | 14% | 14% | 14% 14% | 14% | 14% | 14% | 15% | 14% |
| MLCC | 7% | 7% | 7% | 6% | 6% | 6% | 7% | 7% | 8% | 8% | 7% | 7% | 7% | 6% 6% | 6% | 8% | 7% | 7% | 7% | 7% | 6% |
| Others | 3% | 4% | 3% | 4% | 4% | 4% | 3% | 3% | 3% | 3% | 3% | 3% | 2% | 2% | 2% | 2% 5% | 5% | 4% | 3% | 3% | 2% |
| Pulse | 8% | 8% | 10% | 9% | 8% | 8% | 7% | 7% | 7% | 7% | 7% | 7% | 7% | 7% | 7% | 7% | 13% 10% | 9% | 8% | 7% | 7% |
| Kemet contribution | 44% | 44% | 44% | 44% | 43% | 45% | 46% | 46% | 48% | 49% | 50% | 50% | 54% | 54% | 55% | 55% | 43% 41% | 44% | 45% | 36% | 31% |
| Tantalum | 22% | 22% | 23% | 22% | 24% | 24% | 25% | 26% | 30% | 28% | 29% | 30% | 34% | 35% | 36% | 36% 17% | 18% | 22% | 25% | 20% | 18% |
| Ceramic | 12% | 12% | 12% | 11% | 13% | 10% | 10% | 10% | 11% | 9% | 9% | 9% | 9% | 8% | 8% | 8% | 14% 11% | 12% | 11% | 8% | 7% |
| Chilisin | 13% | 13% | 13% | 12% | 13% | 13% | 11% | 11% | 10% | 10% | 10% | 10% | 9% | 9% | 9% | 9% | 15% 14% | 13% | 12% | 9% | 7% |
| Sensor business | 10% | 9% | 8% | 11% | 13% | 12% | 11% | 10% | 9% | 9% | 8% | 8% | 7% | 7% | 7% | 7% | 3% 10% | 10% | 12% | 8% | 6% |
| Margins (%) | |||||||||||||||||||||
| Gross | 35.6 | 35.6 | 36.2 | 37.3 | 38.1 | 37.1 | 38.8 | 39.2 | 45.1 | 45.1 | 46.0 | 46.7 | 51.2 | 51.2 | 51.2 | 51.7 | 33.5 34.4 | 36.2 | 38.3 | 45.7 | 51.3 |
| Operating | 20.8 | 21.5 | 22.9 | 24.3 | 25.2 | 23.8 | 25.7 | 26.2 | 31.9 | 32.1 | 33.2 | 33.8 | 38.6 | 38.8 | 38.8 | 39.2 19.0 | 19.2 | 22.4 | 25.2 | 32.8 | 38.9 |
| EBITDA | 28.7 | 28.7 | 30.1 | 31.6 | 32.2 | 32.9 | 35.2 | 35.7 | 41.8 | 42.0 | 43.1 | 43.6 | 48.6 | 48.6 | 48.7 | 49.1 27.1 | 27.1 | 29.8 | 34.1 | 42.7 | 48.8 |
| Net | 17.8 | 15.3 | 19.2 | 18.8 | 21.0 | 19.8 | 20.5 | 20.8 | 25.3 | 25.5 | 26.4 | 26.9 | 30.7 | 30.9 31.1 | 31.4 | 16.2 | 15.9 | 17.8 | 20.5 | 26.0 | 31.0 |
Source: J.P. Morgan estimates, Company data.
Investment Thesis, Valuation and Risks
YAGEO (Overweight; Price Target: NT$1,000.00)
Investment Thesis
We are OW on YAGEO, given its leading position in tantalum capacitors after acquiring Kemet and its strong presence in MLCCs/R-Chips, a market that has consolidated over time with disciplined supply expansion. We believe less exposure to commodity-type products can help smooth the revenue fluctuations, while increasing demand for tantalum capacitors can support YAGEO's future top- and bottom-line growth.
Valuation
Our Dec-26 PT of NT$1,000 is based on 26x 2027/28E EPS. 26x is beyond 1.5-STD above average forward P/E at which the company has traded since 2021. We believe the multiple is justified as passive component enters demand-driven upcycle, which is more structural and healthy versus the previous cycle in 2018-19. We believe YAGEO is one of the key beneficiaries of this cycle with 1) dominance in high-end passives (global leader in Tantalum), and 2) MLCC price hike starting from the lower-end segment.
Risks to Rating and Price Target
Downside risks include MLCC/R-Chip price reversals (which could be driven by a slower pace of auto electrification, inventory corrections, etc.) and execution issues during mergers.
YAGEO: Summary of Financials
| Income Statement - Annual | FY24A | FY25A | FY26E | FY27E | FY28E | Income Statement - Quarterly | 1Q26A | 2Q26E | 3Q26E | 4Q26E | |
|---|---|---|---|---|---|---|---|---|---|---|---|
| Revenue | 121,667 | 132,930 | 171,165 | 240,511 | 312,892 | Revenue | 38,166 | 40,809 | 45,517 | 46,673 | |
| COGS | (70,235) | (74,966) | (90,376)(106,752)(121,252) | COGS | (20,953) | (21,959) | (23,529) | (23,935) | |||
| Gross profit | 41,803 | 48,130 | 65,630 | 110,009 | 160,650 | Gross profit | 14,542 | 15,141 | 17,666 | 18,281 | |
| SG&A | (14,945) | (14,910) | (18,348) | (25,499) | (31,954) | SG&A | (4,035) | (4,455) | (4,888) | (4,970) | |
| Adj. EBITDA | 33,014 | 39,635 | 58,376 | 102,611 | 152,606 | Adj. EBITDA | 12,284 | 13,407 | 16,018 | 16,667 | |
| D&A | (9,629) | (9,834) | (15,159) | (23,750) | (30,990) | D&A | (2,671) | (3,709) | (4,322) | (4,457) | |
| Adj. EBIT | 23,386 | 29,801 | 43,217 | 78,860 | 121,616 | Adj. EBIT | 9,613 | 9,698 | 11,695 | 12,210 | |
| Net Interest | 2,190 | 1,571 | 2,044 | 2,689 | 5,293 | Net Interest | 303 | 834 | 485 | 422 | |
| Adj. PBT | 26,863 | 31,120 | 45,670 | 81,549 | 126,309 | Adj. PBT | 10,325 | 10,532 | 12,181 | 12,632 | |
| Tax | (7,377) | (7,343) | (10,417) | (18,756) | (29,051) | Tax | (2,287) | (2,422) | (2,802) | (2,905) | |
| Minority Interest | 130 | 143 | 147 | 147 | 147 | Minority Interest | 37 | 37 | 37 | 37 | |
| Adj. Net Income | 19,356 | 23,634 | 35,106 | 62,646 | 97,111 | Adj. Net Income | 8,001 | 8,073 | 9,342 | 9,690 | |
| Reported EPS | 41.68 | 11.40 | 16.98 | 30.22 | 46.85 | Reported EPS | 3.90 | 3.89 | 4.51 | 4.67 | |
| Adj. EPS | 41.68 | 11.40 | 16.98 | 30.22 | 46.85 | Adj. EPS | 3.90 | 3.89 | 4.51 | 4.67 | |
| DPS | 16.34 | 5.01 | 3.42 | 5.08 | 9.07 | DPS | 0.00 | 0.00 | 3.42 | 0.00 | |
| Payout ratio | 39.2% | 43.9% | 20.1% | 16.8% | 19.4% | Payout ratio | 0.0% | 0.0% | 75.9% | 0.0% | |
| Shares outstanding | 464 | 2,073 | 2,068 | 2,073 | 2,073 | Shares outstanding | 2,054 | 2,073 | 2,073 | 2,073 | |
| Balance Sheet & Cash Flow Statement | FY24A | FY25A | FY26E | FY27E | FY28E | Ratio Analysis | FY24A | FY25A | FY26E | FY27E | FY28E |
| Cash and cash equivalents | 61,118 | 81,473 | 76,295 | 109,807 | 161,309 | Gross margin | 34.4% | 36.2% | 38.3% | 45.7% | 51.3% |
| Accounts receivable | 25,032 | 30,510 | 46,034 | 61,462 | 80,484 | EBITDA margin | 27.1% | 29.8% | 34.1% | 42.7% | 48.8% |
| Inventories | 27,823 | 31,636 | 62,542 | 83,430 | 109,200 | EBIT margin | 19.2% | 22.4% | 25.2% | 32.8% | 38.9% |
| Other current assets | 44,315 | 21,727 | 30,319 | 41,186 | 54,094 | Net profit margin | 15.9% | 17.8% | 20.5% | 26.0% | 31.0% |
| Current assets | 158,288 | 165,346 | 215,191 | 295,885 | 405,086 | ||||||
| PP&E | 66,410 | 65,305 | 59,075 | 55,234 | 52,075 | ROE | 13.1% | 14.3% | 19.8% | 30.0% | 36.2% |
| LT investments | - | - | - | - | - | ROA | 5.5% | 6.2% | 8.5% | 13.2% | 17.1% |
| Other non current assets | 141,978 | 160,139 | 163,242 | 163,242 | 163,242 | ROCE | 5.9% | 7.3% | 10.0% | 16.1% | 20.9% |
| Total assets | 437,508 | SG&A/Sales | 12.3% | 11.2% | 10.7% | 10.6% | 10.2% | ||||
| 366,676 | 390,789 | 514,362 | 620,402 | Net debt/equity | 0.5 | 0.4 | 0.1 | ||||
| Short term borrowings | 70,633 | 86,196 | 100,882 | 110,305 | 121,554 | P/E (x) | 69.3 | 0.5 46.5 | 0.3 26.1 | 16.9 | |
| Payables Other short term liabilities | 15,003 28,342 | 18,031 31,852 | 21,220 46,853 | 23,528 63,084 | 26,742 82,524 | P/BV (x) | 19.0 2.3 | 9.6 | 8.9 | 7.0 | 5.4 |
| Current liabilities | 113,978 | 136,079 | 168,955 | 196,917 | 230,820 | EV/EBITDA (x) | 3.2 | 6.7 | 4.9 | 2.6 | 1.5 |
| Long-term debt | 70,578 | 62,088 | 62,812 | 62,812 | 62,812 | Dividend Yield | 2.1% | 0.6% | 0.4% | 0.6% | 1.1% |
| Other long term liabilities | 19,566 | 18,626 | 19,184 | 19,760 | 20,353 | 0.4 | |||||
| Total liabilities | 204,123 | 216,793 | 250,952 | 279,489 | 313,984 | Sales/Assets (x) | 0.3 | NM | 0.4 | 0.5 | 0.6 |
| Shareholders' equity | 160,461 | 170,878 | 184,328 | 232,644 | 304,190 | Interest cover (x) | NM | NM | NM | NM | |
| Minority interests | 2,092 | 3,119 | 2,228 | 2,228 | 2,228 | Operating leverage | 110.7% | 296.3% | 156.5% | 203.6% | 180.2% |
| Total liabilities & equity | 366,676 | 390,789 | 437,508 | 514,362 | 620,402 | 9.3% | 28.8% | 40.5% | 30.1% | ||
| BVPS | 345.51 | 82.43 | 89.13 | 112.23 | 146.74 | Revenue y/y Growth EBITDA y/y Growth | 13.1% 13.2% | 20.1% | 48.7% | ||
| y/y Growth | 6.6% | (76.1%) | 8.1% | 25.9% | 30.8% | Tax | 47.3% | 75.8% | |||
| Net debt/(cash) | 80,093 | 66,811 | 87,399 | 63,310 | rate | 27.5% | 23.6% | 22.8% | 23.0% | 23.0% | |
| Cash flow from operating | 10,823 | 23,058 | Adj. Net Income y/y Growth EPS y/y Growth | 11.1% (0.1%) | 22.1% (72.6%) | 48.5% 48.9% | 78.4% 78.0% | 55.0% 55.0% | |||
| activities | 49,937 | (1,422) | 41,668 | 73,763 | DPS y/y Growth | 133.0% | (69.4%) | (31.7%) | 78.4% | ||
| o/w Depreciation & amortization | 9,629 | 9,834 | 15,159 | 23,750 | 30,990 | 48.5% | |||||
| o/w Changes in working capital | (18,293) | 16,326 | (51,834) | (44,875) | (54,485) | ||||||
| Cash flow from investing activities | (10,814) | (18,419) | (9,423) | (10,000) | (10,000) | ||||||
| o/w Capital expenditure | (10,814) | (18,419) | (9,423) | (10,000) | (10,000) | ||||||
| as % of sales | 8.9% | 13.9% | 5.5% | 4.2% | 3.2% | ||||||
| Cash flow from financing activities | 1,868 | (4,158) | 8,879 | (534) | (6,969) | ||||||
| o/w Dividends paid | (8,385) | (10,284) | (7,090) | (10,532) | (18,794) | ||||||
| o/w Net debt issued/(repaid) | 5,904 | 7,073 | 15,410 | 9,423 | 11,249 56,794 | ||||||
| Net change in cash firm | 1,876 | 27,361 | (1,967) | 31,134 31,668 | 63,763 | ||||||
| Adj. Free cash flow to | 4,177 | 43,881 | (10,147) | ||||||||
| y/y Growth | (71.4%) | 950.6% | (123.1%) | (412.1%) | 101.3% |
Source: Company reports and J.P. Morgan estimates.
Note: NT$ in millions (except per-share data).Fiscal year ends Dec. o/w - out of which
Analyst Certification: The Research Analyst(s) denoted by an 'AC' on the cover of this report certifies (or, where multiple Research Analysts are primarily responsible for this report, the Research Analyst denoted by an 'AC' on the cover or within the document individually certifies, with respect to each security or issuer that the Research Analyst covers in this research) that: (1) all of the views expressed in this report accurately reflect the Research Analyst's personal views about any and all of the subject securities or issuers; and (2) no part of any of the Research Analyst's compensation was, is, or will be directly or indirectly related to the specific recommendations or views expressed by the Research Analyst(s) in this report. For all Korea-based Research Analysts listed on the front cover, if applicable, they also certify, as per KOFIA requirements, that the Research Analyst's analysis was made in good faith and that the views reflect the Research Analyst's own opinion, without undue influence or intervention.
All authors named within this report are Research Analysts who produce independent research unless otherwise specified. In Europe, Sector Specialists (Sales and Trading) may be shown on this report as contacts but are not authors of the report or part of the Research Department.