PDF 原檔:報告_GS_BBU電池備援產業_20260924_original.pdf
圖片清單(已驗證 2026-09-29)
| 檔名 | size | 分類 | 親眼所見內容 |
|---|---|---|---|
_001.png |
189KB | 裝飾·封面 | 抽象風格化伺服器機櫃插圖(藍紫色調拼接效果),無實際數據 |
_004.png |
199KB | 真資料圖 | Exhibit 7:BBU TAM 計算概念流程圖(GPU power demand by architecture × BBU adoption ratio × ASP) |
_006.png |
167KB | 真資料圖 | Exhibit 10:BBU 產業供應鏈表格——Battery maker/Module maker/Energy storage system maker 三欄,逐列列出主要廠商(Panasonic HD/Murata/TDK/Samsung SDI/LG Energy Solution/Ampace/Tenpower;Panasonic/AES-KY/Sysgration/Dynapack/STL/Celxpert;Panasonic/Delta Electronics/LITEON/Flex/XING Mobility/Lead Wealth/Megmeet)與各自角色說明 |
_007.png |
124KB | 真資料圖 | Exhibit 11:AI 伺服器電源供應鏈爆炸圖——BBU(Battery Cell/Module/System,含 Ampace/Tenpower、XING Mobility/Lead Wealth)、Power conversion(PSU/DC-DC Converter)、CBU(Aluminum Electrolytic Capacitor/Rubycon、Supercapacitor/Skeleton Technologies)、Enclosure/Rack Management Controller 元件分區 |
_014.png |
140KB | 真資料圖 | Exhibit 18:Panasonic BBU 開發路線圖——33kW/shelf(HPR v1,UR18650RX5 80W 電芯)→72kW/shelf(HPR v2,2025,NCR18650W 120W 電芯,output power 1.4x/shelf)→102kW/shelf(2027-28,High Power >200W 電芯) |
_018.png |
32KB | 真資料圖 | Exhibit 22:AI 伺服器機櫃電源拓樸圖——UPS(480VAC)→PDU(120/208VAC)→Power Shelf + BBU Shelf(12/48VDC)→DC Busbar→BMP/VRM→GPU(1VDC) |
_019.png |
310KB | 真資料圖 | Exhibit 23:機櫃內主要電源元件——① Power Modules(DC-DC Converters) ② Hybrid Super Capacitor(HSC,15-21kW) ③ Power Shelves(up to 66kW,增至90kW+) ④ Power Supplies(up to 5500W,增至7500W+)/Battery Backup Units(up to 5700W,增至8000W) |
_020.png |
92KB | 真資料圖 | Exhibit 24:BBU 模組結構爆炸圖(OCP 規格)——多層電池陣列板、固定支架與螺絲組裝結構 |
_021.png |
123KB | 真資料圖 | Exhibit 25:Panasonic BBU shelf 結構圖——Lithium-ion cell → Storage module(BBU) → Shelf(6 模組並列),圖片引用自 Panasonic HD 官網 |
_022.png |
48KB | 真資料圖 | Exhibit 26:ORV3 HPR v2 機櫃規格圖——190kW、50V busbar、BBU Shelf#2/#3+PSU Shelf#2/#3 內建於 IT rack |
_023.png |
78KB | 真資料圖 | Exhibit 27:ORV3 HPR v3 機櫃規格圖——300kW、OR3-HPR 5.5kW PSU/BBU、BBU/PSU shelf 獨立於 IT rack 外側(power sidecar 型態)、50V busbar liquid-cooled |
_024.png |
53KB | 真資料圖 | Exhibit 28:ORV3 HPR v4 機櫃規格圖——HDVC Cabinet 800kW,±400Vdc 800kW BBU 與 PSU 區塊,16×50kW HVDC cables,600mm 寬機櫃 |
其餘 ≥40KB 圖片(
_027–_034,Exhibit 29-43 區間)依 trimmed 內文標題判讀為 Panasonic Energy 營收/OPM 走勢圖、EV/EBITDA 與 EBITDA margin 相關性散布圖、DCF 情境模擬瀑布圖等財務/估值圖表,未逐張開啟 Read(財務類圖表依裁定不嵌入公司頁,非本次 lib 更新之嵌圖候選);如日後需嵌入需現場補驗。<40KB 圖片(_002/_003/_005/_008–_013/_015–_017/_025/_026)依規則免列。
原始內容
Goldman Research Sachs
GLOBAL TECHNOLOGY: HARDWARE
Framing the Battery Backup Unit Opportunity: $50bn by 2030 (CAGR +87%); Buy Panasonic HD
We are focusing on power supply-related products as a key theme of technological innovation in generative AI data centers (AI DCs). Among these, we see Battery Backup Units (BBUs), a new form of distributed power backup, as particularly critical. In addition to standard power backup functions, BBUs are experiencing increasing adoption rates as devices that handle the sharp power consumption fluctuations (peak shaving) unique to generative AI data centers. In the long term, they are also expected to be deployed in tandem with Capacitor Backup Units (CBUs).
At present, investor sentiment toward AI investment is not entirely favorable due to concerns over massive capital expenditure risks in generative AI, the impact of rising interest rates, power shortages, and the profitability and ROIC of LLMs. While no AIrelated products can be completely immune to these risks, the BBU remains one of the most promising areas, as it is poised to benefit from both secular AI growth and rising attach rates (increased unit volume per system). For BBUs, design-ins appear to be locked-in several years in advance. Indeed, Panasonic HD has stated that it has already secured 'Awards' (formal agreements on product development and future orders) for its combined BBU and CBU sales targets through FY3/29. Consequently, we believe there is minimal downside risk to BBU attach rates across successive GPU generations.
In this report, in collaboration with our Global Tech Team, we project the global BBU market size to expand 23x from $2.2 billion in 2025 to $50.2 billion in 2030. We also map out the competitive positioning of global players in this space. Based on this analysis, we raise our earnings estimates and target price for Panasonic Holdings (HD), one of the primary beneficiaries.
Ryo Harada
+81(3)4587-9865 ryo.harada@gs.com Goldman Sachs Japan Co., Ltd.
Nikhil Bhandari
+65-6889-2867 nikhil.bhandari@gs.com Goldman Sachs (Singapore) Pte
Michael Ng, CFA
+1(212)902-8618 michael.ng@gs.com Goldman Sachs & Co. LLC
Hao Chen
+86(21)2401-8812 hao.z.chen@goldmansachs.cn Goldman Sachs (China) Securities Company Limited
Daiki Takayama
+81(3)4587-9870 daiki.takayama@gs.com Goldman Sachs Japan Co., Ltd.
Chao Wang
+886(2)2730-4195 kuan-chao.wang@gs.com Goldman Sachs (Asia) L.L.C., Taipei Branch
Mark Delaney, CFA
+1(212)357-0535 mark.delaney@gs.com Goldman Sachs & Co. LLC
Hiroki Muramatsu
+81(3)4587-9872 hiroki.muramatsu@gs.com Goldman Sachs Japan Co., Ltd.
Goldman Sachs does and seeks to do business with companies covered in its research reports. As a result, investors should be aware that the firm may have a conflict of interest that could affect the objectivity of this report. Investors should consider this report as only a single factor in making their investment decision. For Reg AC certification and other important disclosures, see the Disclosure Appendix, or go to www.gs.com/research/hedge.html. Analysts employed by non-US affiliates are not registered/qualified as research analysts with FINRA in the U.S.
Allen Chang
+852-2978-2930 allen.k.chang@gs.com Goldman Sachs (Asia) L.L.C.
Nick Zheng, CFA +852-2978-1405 nick.zheng@gs.com Goldman Sachs (Asia) L.L.C.
Katherine Murphy
+1(212)902-1151 katherine.a.murphy@gs.com Goldman Sachs & Co. LLC
Table of Contents
| Overview of BBU TAM and related companies | 5 |
|---|---|
| Revision to our Panasonic HD earnings estimates | 7 |
| BBU TAM calculation framework | 10 |
| The BBU Industry Ecosystem | 12 |
| BBU TAM: Power Demand, Attach Rate & ASP | 14 |
| BBU Technology: Its Power Peak Shaving Role | 20 |
| BBU Players & Key Business Opportunities | 26 |
| Panasonic HD: BBU Leader; Reiterate Buy and Raise TP to ¥6,300; Scenario Analysis Shows Potential Valuation Up to ¥14,100 | 29 |
| Appendix | 33 |
| Disclosure Appendix | 45 |
The key takeaways we highlight for investors are as follows:
- The Technological Pivot: Generative AI servers are characterized by sharp n fluctuations in power consumption between active GPU execution and CPU processing. Direct connection of these servers to the power grid would impose severe grid instability. BBUs are deployed to mitigate these extreme power fluctuations, and their significance is growing rapidly as GPU power consumption rises. As GPU power demands increase with each successive generation, BBU adoption (attach rates) is climbing in tandem.
- Surging BBU Attach Rates: The BBU attach rate is set to climb alongside the n increasing power requirements of newer GPUs. We estimate attach rates at 40-50% for the Blackwell generation, rising to 55-65% for the Rubin generation (which entered mass production in 2026), and exceeding 90% for the Feynman generation slated for shipment in 2028. Consequently, the growth rate of the BBU market over the next few years is poised to substantially outpace that of typical AI-related hardware.
- Robust BBU Market Outlook (2025-2030): Driven by the dual tailwinds of surging n global GPU power consumption (CAGR of +62% from 2025-2030) and soaring average BBU attach rates (climbing from 38% in 2025 to 95% in 2030), we look for the BBU market to grow at a CAGR of +87%, expanding 23x from $2.2 billion in 2025 to $50.2 billion in 2030.
- Scenario Analysis: We also perform scenario analyses for cases where BBU o adoption accelerates faster than expected (Bull Case) or progresses more gradually (Bear Case). We estimate the 2025-2030 CAGR at +103% in our Bull Case and +73% in our Bear Case.
- Recommended Stocks (Buy Ratings): Panasonic HD, Murata Manufacturing, TDK, n MinebeaMitsumi, Delta Electronics, Flex, and LG Energy Solution.
- Primary Beneficiary (Panasonic HD): According to the company, Panasonic HD n currently holds 70-80% share of the global BBU market. Panasonic's key competitive advantages include:
- Deep-rooted, long-standing relationships with major hyperscalers in the BBU a. space.
- A unique vertically integrated business model spanning battery cells, modules, b. and full systems.
- World-class battery manufacturing capacity and scalability honed through its c. EV batteries business.
- A broad product portfolio capable of integrating future BBU-CBU co-designs d. (comprehensive group synergy).
We see no other peer possessing this combination of strengths, ensuring highly robust competitiveness. Reflecting this dominant positioning, we raise our adjusted operating profit estimates for Panasonic Energy's BBU business from this fiscal year onward by +9%/+20%/+14% (adjusted operating profit estimates for Panasonic Energy raised by +10%/+25%/+21%). Consequently, we revise up our consolidated adjusted operating profit estimates for Panasonic HD by +3%/+10% /+10% and our operating profit estimates by +3%/+11%/+11%, raise our target EV/EBITDA multiple from 9x to 10.5x, and raise our 12-month target price from ¥5,100 to ¥6,300.
- Panasonic HD: Key Monitoring Points and Potential Risks for the BBU Business : n While we currently rate Panasonic Holdings (HD) highly for its strong competitiveness and dominant market share, holding a high share in the early stages of a market does not guarantee that a company will remain the winner as the market scales. To track Panasonic HD's long-term competitive advantages, we believe the following key metrics and risks are crucial:
-
Revenue Growth vs. Market Growth: It is critical that the revenue growth o rate of Panasonic HD's BBU business matches or exceeds the expansion rate of the overall BBU market.
-
[ ] OP margin sustainability: Operating margins must remain at high levels. A o decline in profit margins could indicate downward pressure on ASPs driven by intensifying competition.
-
Technological Dynamics (NCA/NMC vs. LFP): There is a trend in the industry o toward adopting Lithium Iron Phosphate (LFP) chemistry alongside the NCA/NMC chemistry currently favored by Panasonic HD (NCA). At present, NCA/NMC are preferred due to high energy density, which delivers superior space efficiency in constrained server rack environments. However, if power sidecars are introduced, these space constraints will ease. This could accelerate the adoption of LFP, which offers distinct advantages in unit economics and cycle life, potentially boosting the market presence of LFP-centric competitors.
-
[ ] Capacity Expansion Execution: o
-
Battery Cells: Panasonic HD currently utilizes its domestic battery § factories in Japan for BBU production, but plans to leverage its Kansas plant in the future. Mass production of data center battery cells at the Kansas facility is scheduled to begin in FY3/2029. Any delay in this transition could lead to capacity constraints.
- Modules: Panasonic HD is expanding its module assembly footprint in § Mexico. Mass production at the second factory is scheduled to begin in Q2 of FY3/27, followed by the third factory in FY3/28. The successful ramp-up of these facilities is vital for securing adequate supply capacity.
- Decision-Making Agility: Panasonic HD is a large conglomerate, which o typically exhibit slower decision-making due to multi-layered corporate hierarchies. In a tech sector characterized by exceptionally rapid technological advancement and market scaling, the company's organizational agility and ability to keep pace with industry shifts will be a primary focus for investors.
Overview of BBU TAM and related companies
We expect the BBU TAM (Bull/Base/Bear) to grow rapidly at a CAGR of +103%/+87%/+73% from 2025 to 2030. We forecast the market size (Bull/Base/Bear) will expand from USD 2.2 bn in 2025 to USD 75.1 bn/USD 50.2 bn/USD 34.2 bn in 2030. This market expansion is set to be driven by the following three factors:
- Rising GPU power consumption: GPU power consumption is raised with each new 1. generation, requiring greater backup and peak shaving capacity.
- Increasing GPU shipment volume: Shipments of GPUs for data centers are 2. expanding in tandem with the acceleration of AI investments.
- Rising BBU adoption rates: BBU adoption rates are increasing alongside the 3. adoption of next-generation GPU architectures.
We assume BBU adoption rates are currently around 40% for Blackwell, 50% for Blackwell Ultra, and 55% for Rubin, and will be 60-65% for Rubin Ultra, and 90% or more for Feynman. As these new products gradually become mainstream, the overall average adoption rate should improve, and as a result, we expect the BBU market size to grow rapidly over the next few years.
BBU-related players
The BBU-related supply chain is divided into battery manufacturers, module manufacturers, and energy storage system manufacturers. The main companies are as follows. Panasonic HD can be described as a company with advanced vertical integration among these.
- Battery manufacturers: Panasonic HD, Murata Manufacturing, TDK, Samsung SDI, LG n Energy Solution, Ampace, Tenpower, etc.
- Module manufacturers: Panasonic HD, AES-KY, Sysgration, Dynapack, STL n Technology, Celxpert Energy, etc.
- Energy storage system manufacturers: Panasonic HD, Delta Electronics, LITEON n Technology, Flex, XING Mobility, Lead Wealth, Megmeet, etc.
In addition, MinebeaMitsumi, whose BBU protection module business is growing rapidly, can also be said to be a beneficiary stock.
Exhibit 1: BBU-related GS coverage stock highlights
| Company Name | Ticker | Rating | Analyst | Currency | Current Price | Target Price | Upside | FY26 P/E | FY27 P/E | FY28 P/E |
|---|---|---|---|---|---|---|---|---|---|---|
| Panasonic HD | 6752.T | Buy | Ryo Harada | JPY | 4,262 | 6,300 | 47.8% | 19.4x | 13.2x | 10.2x |
| Murata Manufacturing | 6981.T | Buy | Daiki Takayama | JPY | 7,431 | 12,900 | 73.6% | 33.8x | 22.6x | 17.0x |
| TDK | 6762.T | Buy | Daiki Takayama | JPY | 2,806 | 4,900 | 74.6% | 18.2x | 17.0x | 15.3x |
| MinebeaMitsumi | 6479.T | Buy | Daiki Takayama | JPY | 3,445 | 5,500 | 59.7% | 14.6x | 12.6x | 11.5x |
| Delta Electronics | 2308.TW | Buy | Chao Wang | TWD | 1,685 | 4,120 | 144.5% | 41.6x | 22.4x | 9.8x |
| Megmeet | 002851.SZ | Neutral | Hao Chen | RMB | 122 | 120 | -1.3% | 123.8x | 51.9x | 29.2x |
| Flex | FLEX | Buy | Mark Delaney | USD | 108 | 154 | 42.7% | 25.4x | 15.9x | 13.8x |
| Samsung SDI | 006400.KS | Neutral | Nikhil Bhandari | KRW | 544,000 | 695,000 | 27.8% | 104.1x | 23.1x | 15.3x |
| LG Energy Solution | 373220.KS | Buy | Nikhil Bhandari | KRW | 367,000 | 520,000 | 41.7% | NM | 43.5x | 19.0x |
Murata is on the APAC Conviction List. Target prices are on a 12-month basis. Share prices are based on September 17, 2026 closing prices.
Source: Company data, LSEG Data & Analytics, Goldman Sachs Global Investment Research
BBU components and technology trends
- Battery: A major component accounting for around 80-90% of the BOM cost of a n BBU module. As for the storage batteries used, ternary lithium-ion batteries are currently the mainstream, but there are also moves to adopt LFP for some applications.
- Module: Many players procure battery cells externally, integrate them with BMS and n interconnect components, and assemble them into BBU modules.
- Energy storage system: Integrates and optimizes the BBU with the entire data center n rack, server architecture, and overall power supply system.
Revision to our Panasonic HD earnings estimates
Based on the aforementioned BBU market forecast (base case), we revise our earnings estimates, centering on Energy, and revise up our operating profits estimates from this fiscal year onward by +3%/+11%/+11%. For valuation, we switch from a format that references the company's historical EV/EBITDA and EBITDA margins to a valuation based on the correlation between EV/EBITDA and EBITDA margins for global competitors, including BBU. As a result, we raise the applied EV/EBITDA from 9X to 10.5X. With this, we raise our target price for Panasonic HD from ¥5,100 to ¥6,300.
Exhibit 2: Panasonic Energy's financial performance is being driven by BBU-related business, resulting in a significant upward revision on a monetary basis
Panasonic Energy: Comparison of New vs Old forecasts for Sales and Adjusted OP by sub-segment
| Sales (mnJPY) | OLD - 3/2027E | OLD - 3/2028E | OLD - 3/2029E | NEW - 3/2027E | NEW - 3/2028E | NEW - 3/2029E | diff. - 3/2027E | diff. - 3/2028E | diff. - 3/2029E |
|---|---|---|---|---|---|---|---|---|---|
| Energy | |||||||||
| Automotive | 512,200 | 512,200 | 512,200 | 512,200 | 522,400 | 532,800 | 0 | 10,200 | 20,600 |
| BBU | 542,079 | 921,534 | 1,327,009 | 595,700 | 1,250,970 | 1,876,455 | 53,621 | 329,436 | 549,446 |
| Others | 213,200 | 218,400 | 223,700 | 262,300 | 262,300 | 262,300 | 49,100 | 43,900 | 38,600 |
| Total | 1,267,479 | 1,652,134 | 2,062,909 | 1,370,200 | 2,035,670 | 2,671,555 | 102,721 | 383,536 | 608,646 |
| YoY | |||||||||
| Energy | |||||||||
| Automotive | 18% | 0% | 0% | 18% | 2% | 2% | |||
| BBU | 68% | 70% | 44% | 85% | 110% | 50% | |||
| Others | -7% | 2% | 2% | 15% | 0% | 0% | |||
| Total | 29% | 30% | 25% | 39% | 49% | 31% | |||
| OLD | OLD | OLD | NEW | NEW | NEW | diff. | diff. | diff. | |
| AOP (mnJPY) | 3/2027E | 3/2028E | 3/2029E | 3/2027E | 3/2028E | 3/2029E | |||
| Energy | |||||||||
| Automotive | 39,475 | 58,830 | 69,074 | 40,975 | 87,480 | 113,600 | 1,500 | 28,650 | 44,526 |
| BBU | 136,198 | 287,980 | 450,170 | 147,886 | 344,467 | 513,348 | 11,688 | 56,487 | 63,178 |
| Others | 20,772 | 21,396 | 22,032 | 26,664 | 26,664 | 26,664 | 5,892 | 5,268 | 4,632 |
| Total | 196,445 | 368,206 | 541,276 | 215,525 | 458,611 | 653,612 | 19,080 | 90,405 | 112,336 |
| YoY | |||||||||
| Energy | |||||||||
| Automotive | NA | 49% | 17% | NA | 113% | 30% | |||
| BBU | 84% | 111% | 56% | 100% | 133% | 49% | |||
| Others | 107% | 3% | 3% | 166% | 0% | 0% | |||
| Total | 172% | 87% | 47% | 199% | 113% | 43% |
Source: Company data, Goldman Sachs Global Investment Research
Exhibit 3: In our long-term forecast, BBU's adjusted OP in FY3/30E is projected to be -26% compared to the base case in the bear scenario, and +91% in the bull scenario.
Panasonic Energy: Sales and Adjusted OP by Scenario for BBU business
BBU by scenario
| Sales (mnJPY) | 3/2027E | 3/2028E | 3/2029E | 3/2030E |
|---|---|---|---|---|
| Bull | 644,000 | 1,545,600 | 3,091,200 | 6,182,400 |
| Base | 595,700 | 1,250,970 | 1,876,455 | 3,246,267 |
| Bear | 579,600 | 1,188,180 | 1,722,861 | 2,412,005 |
| YoY Bull | 100% | 140% | 100% | 100% |
|---|---|---|---|---|
| Base | 85% | 110% | 50% | 73% |
| Bear | 80% | 105% | 45% | 40% |
| AOP (mnJPY) | 3/2027E | 3/2028E | 3/2029E | 3/2030E |
|---|---|---|---|---|
| Bull | 160,927 | 431,407 | 848,719 | 1,683,343 |
| Base | 147,886 | 344,467 | 513,348 | 883,197 |
| Bear | 143,539 | 326,113 | 470,477 | 656,546 |
| AOP margin | 3/2027E | 3/2028E | 3/2029E | 3/2030E |
|---|---|---|---|---|
| Bull | 25% | 28% | 27% | 27% |
| Base | 25% | 28% | 27% | 27% |
| Bear | 25% | 27% | 27% | 27% |
Source: Company data, Goldman Sachs Global Investment Research
Exhibit 4: Panasonic Energy: BBU revenue forecast by scenario, Old vs New (in mn JPY)
Exhibit 5: Panasonic Energy: BBU Adjusted OP forecast by scenario, Old vs New (in mn JPY)
Source: Goldman Sachs Global Investment Research
Source: Goldman Sachs Global Investment Research
| 3/2027E | 3/2028E % diff. vs | 3/2029E base case | 3/2030E |
|---|---|---|---|
| 8% | 24% | 65% | 90% |
| 0% | 0% | 0% | 0% |
| -3% | -5% | -8% | -26% |
| 3/2027E | 3/2028E % diff. vs | 3/2029E base case | 3/2030E |
|---|---|---|---|
| 9% | 25% | 65% | 91% |
| 0% | 0% | 0% | 0% |
| -3% | -5% | -8% | -26% |
Exhibit 6: Upward revision of +3%/+11%/+11% to company-wide operating profits estimates for FY3/27-FY3/29
Panasonic HD: Old vs. new earnings estimates by segment
| Sales - (mn JPY) | OLD - 3/2027E | OLD - 3/2028E | OLD - 3/2029E | NEW - 3/2027E | NEW - 3/2028E | NEW - 3/2029E | % Change - 3/2027E | % Change - 3/2028E | % Change - 3/2029E |
|---|---|---|---|---|---|---|---|---|---|
| Smart Life | 1,345,300 | 1,361,300 | 1,369,500 | 1,345,300 | 1,361,300 | 1,369,500 | 0% | 0% | 0% |
| HVAC &CC | 1,373,400 | 1,434,300 | 1,500,100 | 1,373,400 | 1,434,300 | 1,500,100 | 0% | 0% | 0% |
| Electric Works | 1,207,000 | 1,243,200 | 1,280,500 | 1,207,000 | 1,243,200 | 1,280,500 | 0% | 0% | 0% |
| Connect | 1,450,700 | 1,525,400 | 1,604,200 | 1,450,700 | 1,525,400 | 1,604,200 | 0% | 0% | 0% |
| Industry | 1,274,082 | 1,339,412 | 1,423,404 | 1,274,082 | 1,339,412 | 1,423,404 | 0% | 0% | 0% |
| Energy | 1,267,479 | 1,652,134 | 2,062,909 | 1,370,200 | 2,035,670 | 2,671,555 | 8% | 23% | 30% |
| Other/Elimination/Adjustment | -10,200 | -10,200 | -10,200 | -10,200 | -10,200 | -10,200 | 0% | 0% | 0% |
| Total | 7,907,761 | 8,545,545 | 9,230,413 | 8,010,482 | 8,929,082 | 9,839,059 | 1% | 4% | 7% |
| Adj. OP | OLD | OLD | OLD | NEW | NEW | NEW | Change | Change | Change |
| (mn JPY) | 3/2027E | 3/2028E | 3/2029E | 3/2027E | 3/2028E | 3/2029E | 3/2027E | 3/2028E | 3/2029E |
| Smart Life | 74,300 | 77,800 | 82,300 | 74,300 | 77,800 | 82,300 | 0% | 0% | 0% |
| HVAC &CC | 60,100 | 62,700 | 65,500 | 60,100 | 62,700 | 65,500 | 0% | 0% | 0% |
| Electric Works | 95,700 | 98,300 | 100,900 | 95,700 | 98,300 | 100,900 | 0% | 0% | 0% |
| Connect | 107,270 | 132,791 | 144,079 | 107,270 | 132,791 | 144,079 | 0% | 0% | 0% |
| Industry | 126,193 | 144,650 | 168,370 | 126,193 | 144,650 | 168,370 | 0% | 0% | 0% |
| Energy | 196,445 | 368,206 | 541,276 | 215,525 | 458,611 | 653,612 | 10% | 25% | 21% |
| Other/Elimination/Adjustment | -5,000 | -5,000 | -5,000 | -5,000 | -5,000 | -5,000 | 0% | 0% | 0% |
| Total | 655,009 | 879,447 | 1,097,426 | 674,088 | 969,851 | 1,209,761 | 3% | 10% | 10% |
| OP | OLD | OLD | OLD | NEW | NEW | NEW | % Change | % Change | % Change |
| (mn JPY) | 3/2027E | 3/2028E | 3/2029E | 3/2027E | 3/2028E | 3/2029E | 3/2027E | 3/2028E | 3/2029E |
| Smart Life | 67,300 | 70,800 | 75,300 | 67,300 | 70,800 | 75,300 | 0% | 0% | 0% |
| HVAC &CC | 59,100 | 61,700 | 64,500 | 59,100 | 61,700 | 64,500 | 0% | 0% | 0% |
| Electric Works | 85,700 | 88,300 | 90,900 | 85,700 | 88,300 | 90,900 | 0% | 0% | 0% |
| Connect | 103,270 | 128,791 | 140,079 | 103,270 | 128,791 | 140,079 | 0% | 0% | 0% |
| Industry | 116,193 | 134,650 | 158,370 | 116,193 | 134,650 | 158,370 | 0% | 0% | 0% |
| Energy | 196,445 | 368,206 | 541,276 | 215,525 | 458,611 | 653,612 | 10% | 25% | 21% |
| Other/Elimination/Adjustment | -21,000 | -21,000 | -21,000 | -21,000 | -21,000 | -21,000 | 0% | 0% | 0% |
| Total | 607,009 | 831,447 | 1,049,426 | 626,088 | 921,851 | 1,161,761 | 3% | 11% | 11% |
Source: Company data, Goldman Sachs Global Investment Research
BBU TAM calculation framework
Exhibit 7: Our TAM estimate is calculated by multiplying GPU power demand by architecture x BBU adoption ratio x ASP (USD/W)
Concept for calculating BBU TAM
Source: Goldman Sachs Global Investment Research
Exhibit 8: Forecast to reach USD 50.2 bn (CAGR +87%) by 2030 in the base case.
BBU TAM forecast
| BBU TAM - Bear/Base/Bull Scenarios - (USD, mn) | BBU TAM - Bear/Base/Bull Scenarios - 2025 | BBU TAM - Bear/Base/Bull Scenarios - 2026E | BBU TAM - Bear/Base/Bull Scenarios - 2027E | BBU TAM - Bear/Base/Bull Scenarios - 2028E | BBU TAM - Bear/Base/Bull Scenarios - 2029E | BBU TAM - Bear/Base/Bull Scenarios - 2030E | BBU TAM - Bear/Base/Bull Scenarios | BBU TAM - Bear/Base/Bull Scenarios - 25-30E |
|---|---|---|---|---|---|---|---|---|
| Bull | ||||||||
| TAM | 2,185 | 4,850 | 12,115 | 26,469 | 59,288 | 75,112 | ||
| YoY | 292% | 122% | 150% | 118% | 124% | 27% | CAGR: | 103% |
| 2025 | 2026E | 2027E | 2028E | 2029E | 2030E | |||
| Base | ||||||||
| TAM | 2,185 | 4,134 | 9,793 | 19,027 | 40,587 | 50,157 | ||
| YoY | 292% | 89% | 137% | 94% | 113% | 24% | CAGR: | 87% |
| 2025 | 2026E | 2027E | 2028E | 2029E | 2030E | |||
| Bear | ||||||||
| TAM | 2,185 | 3,924 | 9,011 | 16,364 | 29,098 | 34,226 | ||
| YoY | 292% | 80% | 130% | 82% | 78% | 18% | CAGR: | 73% |
Source: Company data, Goldman Sachs Global Investment Research
Exhibit 9: We expect the BBU TAM to expand from USD 2.2 bn in 2025 to USD 50.2 bn in 2030 (CAGR +87%).
BBU TAM forecast
Source: Company data, Goldman Sachs Global Investment Research
The BBU Industry Ecosystem
In this chapter, we provide an overview of major players in the BBU industry supply chain.
Major players in the BBU industry
In the BBU industry, there are mainly three categories of players: (1) battery manufacturers, (2) module manufacturers, and (3) energy storage system manufacturers.
- (1) Battery manufacturers: Manufacture battery cells and supply them to module/energy storage system manufacturers. Major players include Panasonic HD, Murata Manufacturing, TDK, Samsung SDI, LG Energy Solution, Ampace, Tenpower, etc.
- (2) Module manufacturers: Procure battery cells externally, integrate them with DC-DC converters, BMS, MCUs, etc., assemble them into BBU modules, and supply them to energy storage system manufacturers. Major players include Panasonic HD, AES-KY, Sysgration, Dynapack, STL Technology, Celxpert Energy, etc.
- (3) Energy storage system manufacturers: Procure BBU modules externally, or procure battery cells and components to assemble BBU modules themselves, integrate them with enclosures, busbars, cooling fans, capacitors, etc., and ultimately complete them as BBU systems. In some cases, they manufacture battery cells in-house and operate a vertically integrated business. Major players include Panasonic HD, Delta Electronics, LITEON Technology, Flex, XING Mobility, Lead Wealth, Megmeet, etc.
Source: Goldman Sachs Global Investment Research
Exhibit 11: AI server power supply chain
Source: Data compiled by Goldman Sachs Global Investment Research
BBU TAM: Power Demand, Attach Rate & ASP
In calculating the BBU market TAM, we focus on three elements: (1) power demand per GPU, (2) BBU adoption rate per GPU, and (3) BBU ASP per 1W. We calculate the TAM by multiplying these together. Note that because BBUs provide backup and peak shaving functions for GPUs, we assume that the system requires larger BBU capacity as GPU power output increases (assuming a proportional relationship between GPU power demand and BBU power demand).
(1) Calculating power demand per GPU: Total GPU power demand to grow at a CAGR (2025->2030) of +62%
We calculate total GPU power demand by generation by multiplying the GPU shipment volume forecast by GPU architecture generation (covered by Nvidia analyst James Schneider) by the GPU power consumption of each generation (referencing thermal design power (TDP) in spec sheets). For non-Nvidia ASICs, we use GS rack shipment data (covered by Taiwan Tech analyst Chao Wang) and assume a one-generation lag compared to mainstream Nvidia architectures, multiplying this by GPU power consumption per rack to calculate the total power demand for ASICs.
Exhibit 12: Expected to increase from 13,510MW in 2025 to 150,081MW in 2030 at a CAGR of +62%,... GPU power demand for global data centers
Exhibit 13: ...with the release of high power consumption products like Rubin and Feynman expected to push up GPU power demand.
GPU power demand for global data centers by architecture generation
Source: Company data, Goldman Sachs Global Investment Research
Source: Company data, Goldman Sachs Global Investment Research
Exhibit 14: Power consumption (TDP) for each GPU chip increases in power output with each passing generation.
Source: Company data, Goldman Sachs Global Investment Research
(2) BBU attach rate: Expected to rise rapidly by 2030, with 95% of servers using Nvidia chips projected to be equipped with BBUs by 2030 BBU attach rates are fundamentally driven by GPU power consumption. BBUs, which are connected to the DC busbar of the rack and supply backup power to the GPUs, are expected to see higher attach rates as high-end AI servers adopt new GPU architectures and GPU power output increases. We assume an attach rate of 0% for legacy models (A100, H100/200), and believe a certain level (40-50%) of adoption is progressing from the Blackwell generation onward, as NVIDIA has begun recommending BBUs as an option for reference designs. Furthermore, with power consumption increasing to 1,800W for Rubin and 3,600W for Rubin Ultra, combined with the emergence of architectures adopting side racks and thereby expanding installation space, attach rates are expected to increase further. In addition, for Feynman, which is expected to launch in 2028 or later, we believe it is highly likely that BBUs will become a nearly standard feature, as power consumption will increase further and side racks may be adopted in almost all servers alongside the transition to 800VDC architectures.
The BBU attach rate is expected to be a key driver influencing the BBU TAM. As shown in Exhibit 15, we calculate estimates in three scenarios: bull case, base case, and bear case.
Exhibit 15: BBU attach rates are expected to increase at an accelerating pace due to rising GPU power consumption and increased adoption of side racks, reaching 95% in the base case in 2030.
BBU attach rate (Nvidia)
A weighted average of the BBU attach rate for each NVIDIA GPU generation based on the shipment volume of each generation.
Source: Company data, Goldman Sachs Global Investment Research
(1) x (2): Total BBU power demand to grow at a CAGR (2025->2030) of
+90%
Exhibit 16: Expected to increase from 4,603MW in 2025 to 113,029MW in 2030 in the base case (CAGR +90%).
Global BBU power demand by case
rapidly from the Rubin generation onward in tandem with BBU power demand by architecture (base case)
Exhibit 17: BBU power demand expected to increase improving attach rates
Source: Company data, Goldman Sachs Global Investment Research
Source: Company data, Goldman Sachs Global Investment Research
(3) BBU ASP: ASP per shelf increases from USD 15,589 in 2025 to USD 26,271 in 2030; ASP per kW is assumed to moderately decline as battery cell output improves
Calculation of BBU shelf ASP (a)
In calculating ASP, we first calculated the BOM cost of a BBU shelf based on the Open Compute Project (OCP) BBU Configuration (Link). The basic configuration consists of six BBU modules per BBU shelf, with each module featuring a 6x11 lithium-ion battery array (although in reality, various configuration patterns exist). We assume the cost of lithium-ion batteries is the largest BOM component, accounting for 80-90% of the total. We calculate ASP by assuming a profit margin of around 25% on this BOM (based on GS estimates for Panasonic's BBU margin). Since the profit margin assumption is also expected to change due to shifts in the market's competitive environment, we vary the assumption for each of the bull, base, and bear cases.
Calculation of power output per shelf (b)
To estimate power output per shelf, we base our calculation on Panasonic's development roadmap, using a weighted average that applies attach rates to three BBU shelf configurations: (1) 33kW/shelf (using 80W battery cells), (2) 72kW/shelf (using 120W battery cells), and (3) 102kW/shelf (using 200W battery cells). Currently, 33kW/shelf is the mainstream, but shipments of 72kW/shelf have recently begun, and commercialization of 102kW/shelf is expected to start around 2027-28.
Exhibit 18: Development of next-generation 102kW/shelf is currently underway
Panasonic HD's BBU development roadmap
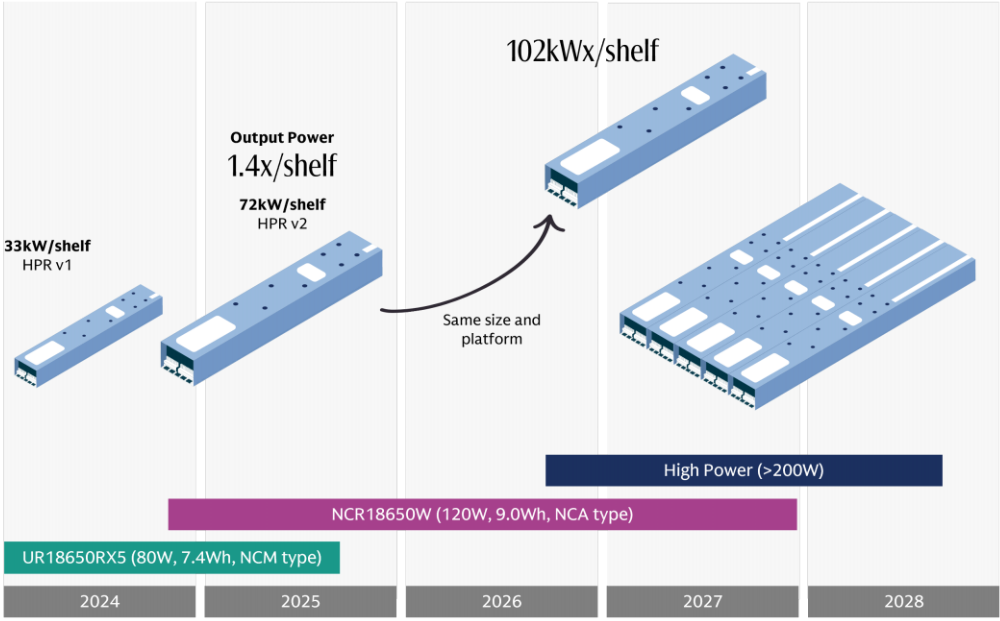
This is a development roadmap and differs from actual commercialization timing.
Source: Company data, Data compiled by Goldman Sachs Global Investment Research
ASP per kW (c)
Calculated by dividing BBU shelf BOM cost calculation (a) by power output per shelf calculation (b). We assume ASP per kW will moderately decline in line with improved battery cell output (Exhibit 20).
Exhibit 19: ASP of BBU shelf (USD)
The ASP of BBU shelves is expected to rise alongside enhanced battery cell performance and accelerating adoption of next-generation products.
Exhibit 20: ASP of BBU shelf (USD/kW)
We view ASP per kW as being on a downward trend, outpaced by the rate of increase in power output.
Source: Company data, Goldman Sachs Global Investment Research
Source: Company data, Goldman Sachs Global Investment Research
(1) x (2) x (3 (c)) BBU TAM (Bull/Base/Bear): CAGR (25-30) is +103%/+87%/+73% Bull case (CAGR 103%)
- When BBU attach rates increase in non-generative AI data centers, in addition to the n attach rates in generative AI data centers.
- And when BBUs are widely used in data centers adopting ASICs. n
- When a supply-demand tightness emerges in response to growing BBU demand, n causing prices to rise.
Bear case (CAGR 73%)
- When BBU attach rates generally fall below assumptions. n
- When competition in BBU products intensifies due to new entrants and other n factors, causing prices to fall.
See Appendix for detailed assumptions under each scenario
Exhibit 21: Expected to expand from USD 2.2 bn in 2025 to USD 50.2 bn in 2030 (CAGR +87%). BBU TAM forecast
Source: Company data, Goldman Sachs Global Investment Research
BBU Technology: Its Power Peak Shaving Role
Role of BBUs in data centers
A Battery Backup Unit (BBU) is a distributed energy storage system installed within server racks in a data center. It supports efficient power operation of the data center by supplying backup power to GPUs during momentary outages or voltage drops, and providing a peak shaving function to compensate for shortfalls during peak power consumption. Recent AI servers consume massive amounts of power in short periods to maintain parallel processing by multiple GPUs. As a result, power peaks rise sharply and voltage tends to become unstable, making highly reliable and stable power supply indispensable for AI data centers. Against the backdrop of this demand environment, the importance of BBUs as a rack-level distributed power supply solution is growing.
BBUs consist of energy storage modules containing lithium-ion battery cells and shelves to house them, connected to the DC busbar of the server rack.
Exhibit 22: BBUs are connected to the DC busbar, handling backup during power outages and power stabilization, ensuring continuity of power supply
AI server rack power configuration
Al Server Rack - Power Topology Diagram
Source: Company data, Data compiled by Goldman Sachs Global Investment Research
Exhibit 23: In addition to voltage conversion by DC-DC converters, rapid charging/discharging by HSCs, and power aggregation by power shelves, BBUs handle backup during power outages.
Major power components within an AI server rack
Source: Company data, Data compiled by Goldman Sachs Global Investment Research
Standard BBU configuration
Standard BBU configurations are primarily determined by the Open Compute Project (OCP), a non-profit organization dedicated to standardizing configurations and specifications for data center hardware equipment. OCP was established by Meta (formerly Facebook) in 2011, and currently involves around 400 companies including Intel, Microsoft, and NVIDIA, having thus far set specifications for equipment such as servers, storage, and network switches.
For BBUs, a backplane voltage of 12V was standard under the initial Open Compute Project Open Rack Version 2 (OCP ORV2) specifications, but with improvements in power density, ORV3 was established, making 48V the standard (Link).
The following specifications were primarily set for standard BBU configurations under ORV3:
- BBU module: Backup output of 3kW, backup time of 4 minutes or more, design life of n 4 years, battery cell type is lithium-ion 18650, battery pack configuration is 11S6P (11 in series, 6 in parallel for a total of 66 cells).
- BBU shelf: 6 modules per shelf (5+1 redundant configuration). n
Exhibit 24: Consists of 66 lithium-ion cells (6 x 11), a main power board, MCU, BMS, etc.
BBU module structure based on OCP specifications
Source: OCP
Exhibit 25: Consists of six BBU modules, connectors, etc. BBU shelf structure
Image quoted from Panasonic HD's website.
Source: Company data
BBU specifications for high power
In response to the trend toward even higher power server racks, OCP has also established the HPR (High Power Rack) specifications, a high-power version of ORV3 (LINK). There are major changes mainly in terms of power capacity/voltage and power sidecars, and currently there is a gradual transition from the mainstream HPR v2 to HPR v3, with development also progressing toward the launch of HPR v4, which corresponds to 800VDC architectures.
The main specifications for HPR are as follows:
- HPR v1: Maximum power capacity of 92kW (scalable up to 140kW depending on n specifications), voltage of 50VDC. BBU shelf is built into the IT rack.
-
HPR v2: Maximum power capacity of 190kW, voltage of 50VDC. BBU shelf is built n into the IT rack. BBU shelf transitions from 33kW/shelf to 72kW/shelf. Adopts a capacitor tray for power fluctuation smoothing.
-
HPR v3: Maximum power capacity of 300kW, voltage of 50VDC. BBU shelves and n capacitor trays are housed in a power sidecar independent from the IT rack.
- HPR v4: Maximum power capacity of 800kW (scalable up to 1MW depending on n specifications), voltage of ±400VDC (800VDC). Supports 800VDC architecture, adopting a high-voltage DC system power sidecar.
Exhibit 26: Format where the BBU shelf is built into the IT rack
ORV3 HPR V2 rack specifications
Source: OCP, Data compiled by Goldman Sachs Global Investment Research
Exhibit 27: BBU shelves are built into a power sidecar
independent from the IT rack ORV3 HPR V3 rack specifications
Source: OCP, Data compiled by Goldman Sachs Global Investment Research
Exhibit 28: Adopts an independent high-voltage DC system power rack supporting 800VDC architecture
ORV3 HPR V4 rack specifications
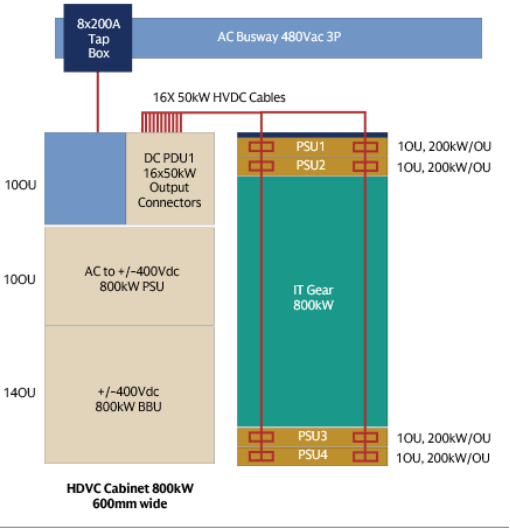
Source: OCP, Data compiled by Goldman Sachs Global Investment Research
BBU battery chemicals and formats
The chemistry (chemical composition) and format of battery cells are currently dominated by cylindrical ternary (NCA/NMC) battery cells, but they could diversify in the future to include prismatic LFP and others. The strength of ternary batteries lies in their high energy density, enabling them to achieve high space efficiency even in limited installation spaces. LFP has strengths in terms of cost and lifespan, and in addition, the prismatic format offers the advantage of allowing cells to be stacked together without any gaps.
Power supply systems in 800VDC architecture
Current data center backup power systems feature a coexistence of centralized UPS units installed in dedicated power rooms (grey space) and distributed BBUs built into server racks or power sidecars. On the other hand, for future 800VDC architectures, discussions are underway to transition to DC-direct systems combining SST (solid-state transformers) + ESS + BBU, eliminating traditional UPS units which suffer from power loss due to AC -> DC -> AC conversion. In this next-generation system, high-voltage AC transmitted from the grid is converted directly to high-voltage DC (800VDC) using SST and fed directly to ESS and BBUs, which is said to enable reductions in power conversion loss and the shrinking of grey space used for UPS installation.
That said, as SST has not yet achieved technological maturity in terms of cost and reliability, hurdles remain for immediate adoption on a GW scale. As such, in the current transition period, inquiries for MV UPS (medium-voltage UPS), which improve power efficiency by eliminating step-up/step-down transformers, are surging, particularly among major Western electrical equipment manufacturers (LINK). As a result, we expect
- the coexistence of UPS and BBUs to continue for the time being until the transition to 800VDC architecture.
BBU Players & Key Business Opportunities
Panasonic HD
Panasonic HD is the largest player, and according to the company it is holding an approximate 70-80% share in distributed power supply systems (BBU) for data centers.
It is the only company that comprehensively handles everything from battery cell development to module design and system integration in-house, and its strengths lie in the high reliability of its battery cells and modules and its ability to propose total solutions to customers. In the data center energy storage system business, the company aims for sales on the scale of ¥1 tn in FY3/29 and ¥1.5 tn in FY3/31, and management has commented that its award acquisition ratio (projects for which product development has been promoted or orders agreed upon) has reached almost 100% regarding its sales guidance for FY3/29.
Furthermore, in addition to Panasonic Energy, which handles BBUs, Panasonic Industry said that it is developing CBUs (Capacitor Backup Units) and supercapacitors, with plans to begin mass production of first-generation products during FY3/27. We believe that if these devices, which absorb power load fluctuations, are launched, combining them with BBUs will lead to further value-add enhancements.
Murata Manufacturing
We expect BBU-bound sales to account for more than 30% of Murata Manufacturing's battery business sales in FY3/27. With structural reforms completed and profitability having improved to a break-even level for the battery business as a whole, the increase in BBU-bound sales is expected to make a positive contribution in terms of enhancing profitability depth. The company is heading toward expanding its business for BBUs in the form of LFP cell supply, and its stated strategy is to advance business expansion by leveraging LFP's high safety and its status as the only domestic Japanese cell manufacturer (making it easy to differentiate itself geopolitically for Western customers). While we believe its number of customers is currently likely to be limited and its industry position is low, we believe it will grow into a more material business scale amid robust demand and changing technologies.
TDK
TDK's medium-sized batteries have up to now been used mainly for household ESS/e-bikes/drones, but per the company, it is expected to make a full-scale push for UPS applications from 1HFY3/27 and BBU applications from 2HFY3/27. We see it as a major growth driver for the next medium-term plan (FY3/28-FY3/30), drawing on strengths in LFP materials and design structure. Aside from supply via its JV with CATL, Linergy (Malaysia), which it acquired in May 2026, could play an important role. Linergy is currently mainly focused on UPS and power tools, but is moving to handle BBU applications as well. We believe medium-sized batteries for AI/data centers, which contributed almost nothing to sales through FY3/26, have the potential to expand to nearly ¥300 bn by FY3/31, and management said that it is aiming for major expansion in line with GPU technological evolution, especially in the latter half of the next medium-term plan.
MinebeaMitsumi
MinebeaMitsumi's BBU protection modules are beginning to grow rapidly. The former Mitsumi Electric originally had strengths in protection modules/semiconductors that efficiently control mobile phone battery consumption, and the company is beginning to secure business opportunities for BBUs as an applied development of this. On our estimates, the company holds a share of around 80% with its largest customer, and we believe there is potential for substantial sales growth in tandem with the growth of its supply destinations. These products are included in the MLS division, where a cluster of new growth products, such as BBU protection modules and humanoid sensors, are beginning to develop alongside the mainstay motors.
Delta Electronics
Delta Electronics is the global top power supply supplier (by sales) in the AI server power supply market, per the company. The company procures BBU modules from major Taiwan battery module manufacturer AES-KY and others, combines them with BMS and cooling devices to build BBU systems, and ships them to its hyperscaler customers. The company's strength lies in its ability to offer power supply units (PSU), power shelves, BBUs, and cooling systems all together as a single package, which provides customers with the benefit of reducing verification costs for individual components. The company is jointly advancing the development of 800VDC architecture with NVIDIA, and plans for a full-scale rollout in 2027.
LITEON Technology
LITEON Technology is one of the global leading players among energy storage system manufacturers alongside Delta Electronics. The company has introduced BBU modules compatible with NVIDIA's Blackwell (GB200/GB300) and next-generation Vera Rubin platforms to the market. Per disclosures, the company strength lies not only in the supply of BBU modules but also in its system integration capabilities combining PSU and BBUs. Furthermore, the company said that it is advancing the development of high-voltage compatible architecture, such as exhibiting a BBU integrated into a next-generation 800VDC liquid-cooled power rack at COMPUTEX 2026. Thanks to this product portfolio, sales in its Cloud & AIoT division posted a high yoy growth rate of +60% in 1HFY26, per mgmt.
AES-KY
AES-KY falls under the umbrella of Simplo Technology, the world's largest notebook PC battery pack manufacturer, and is a company that provides high-output lithium-ion battery modules. The company mainly supplies modules for electric-assisted bicycles and data centers, and is one of the global leading companies particularly in data center BBU modules. Per mgmt, the company's biggest strength lies in its solid relationships with US hyperscalers and it has currently made inroads into the supply chains of three of the four major US CSPs, establishing a position as a joint development partner participating from the initial customer design stages. Additionally, the company's BBU modules are also integrated into the power shelves of major power supply manufacturer Delta Electronics.
Megmeet
Megmeet is a major Chinese power supply solutions provider that has rapidly expanded its BBU and integrated power supply system businesses for AI data centers in recent years. The company said that it is participating in NVIDIA's Blackwell and Vera Rubin ecosystem as a power supply partner, and serves as a designated supplier for components such as BBUs, PSUs, and capacitors. Alongside Delta Electronics and LITEON Technology, Megmeet is one of three major power supply suppliers participating in NVIDIA's Blackwell supply chain. Moreover, beyond providing individual components, Megmeet offers integrated power solutions, such as an 800VDC sidecar power rack that integrates BBUs, PSUs, capacitors, and other items into a single rack.
Flex
Flex offers custom power supply solutions that cover everything from grid to chip for AI data centers, supplying BBU systems as one of its backup power products to US hyperscalers and others. In addition, to address the sharp power fluctuations characteristic of AI data centers, the company has aimed to roll out power supply systems equipped with a capacitor-based energy storage system (CESS) centered on Musashi Seimitsu's hybrid supercapacitors (HSC) in addition to BBUs.
Samsung SDI
Samsung SDI is one of the global leading players alongside Panasonic HD in the BBU battery cell market. According to the company, it holds an approximate 50% share in BBU cells, supplying high-output cylindrical lithium-ion battery cells to BBU module integrators and suppliers. The company's strength is its tabless structure battery cells, possessing technology that dramatically reduces the internal resistance of the cell by eliminating tabs from traditional electrodes and using the entire end face of the electrode as a conductive path. The company is currently promoting a transition from conventional 18650 cells to higher capacity, higher output 21700 cells, and in July 2026, it began mass production of its new '40V3' 21700 cylindrical lithium-ion battery cells for AI data centers at its Malaysia plant.
LG Energy Solution
Against the backdrop of slowing growth in the EV market, LG Energy Solution has recently been strengthening its focus on AI data centers and robotics as new growth drivers. The company is developing high-output 2170 cylindrical lithium-ion battery cells that adopt a tabless structure, pursuing space efficiency, high output, and safety. The company plans to begin mass production at its Ochang plant in South Korea during 2026, intending to expand supply for AI data center BBUs and robotics.
Panasonic HD: BBU Leader; Reiterate Buy and Raise TP to ¥6,300; Scenario Analysis Shows Potential Valuation Up to ¥14,100
Earnings estimates
Based on the aforementioned BBU market forecast (base case), we revise our earnings estimates primarily for the Energy segment, raising our adjusted operating profit estimates for this fiscal year onward by 3%/10%/10% and similarly raising our operating profit estimates by 3%/11%/11%. These estimates are 3%/25%/33% above consensus (Bloomberg), respectively (although it should be noted that the consensus estimates may contain a mix of adjusted operating profits and operating profits). BBUs feature both high sales growth and profit growth.
Exhibit 29: BBU business shows high sales growth and OP
growth
Panasonic HD: Sales and Adjusted OPM of Panasonic Energy Exhibit 30: We expect Panasonic Energy to comprise c.60% of company-wide operating profits in FY3/29 Ratio of Energy business to company-wide operating profits
Source: Company data, Goldman Sachs Global Investment Research
Target price and valuation
We switch our valuation methodology from the previous approach of referencing the company's historical EV/EBITDA and EBITDA margins to a valuation based on the correlation between EV/EBITDA and EBITDA margins of global peers, including those in BBUs. As a result, we raise our applied EV/EBITDA from 9X to 10.5X. Accordingly, we revise up our target price for Panasonic HD from ¥5,100 to ¥6,300.
Source: Company data, Goldman Sachs Global Investment Research
Exhibit 31: Applied multiple is EV/EBITDA of 10.5X
Correlation between EBITDA margin and EV/EBITDA for global peers
Source: LSEG Data & Analytics, Goldman Sachs Global Investment Research
Simulation of value per share using DCF: ¥6,000 in the lowest case (+41%), and up to ¥14,100 in the maximum case (+231%).
Given that we expect the BBU market to grow significantly through 2030, for illustrative purposes only we calculated the per-share valuation for Panasonic HD when factoring in BBU business growth up to FY3/29 and FY3/31 using the DCF method, respectively. In conclusion, compared to our 12-month target price of ¥6,300 (+48% implied upside) based on applying an EV/EBITDA of 10.5X to our FY3/28 estimated EBITDA, the lowest valuation comes out to ¥6,000 (+41%). Furthermore, the highest valuation, calculated on the assumption that the BBU growth story through FY3/31 is fully factored in and the competitive environment does not deteriorate, this analysis implies a per share valuation of ¥14,100 (+231%), all else equal.
Exhibit 32: Per-share valuation of PHD implied under each valuation methodology/scenario
per share Valuation (yen)
| Our valuation method EV/EBITDA 10.5x * EBITDA in FY3/28 | DCF (~FY3/29) | DCF (~FY3/31) | |
|---|---|---|---|
| Bull | 6,700 | 8,200 | 14,100 |
| Base | 6,300 | 6,300 | 8,300 |
| Bear | 6,200 | 6,000 | 6,700 |
Upside/Downside
| Our valuation method EV/EBITDA 10.5x * EBITDA in FY3/28 | DCF (~FY3/29) | DCF (~FY3/31) | |
|---|---|---|---|
| Bull | 56% | 91% | 229% |
| Base | 47% | 47% | 94% |
| Bear | 45% | 40% | 56% |
Implied EV/EBITDA based in FY3/28
| Our valuation method EV/EBITDA 10.5x * EBITDA in FY3/28 | DCF (~FY3/29) | DCF (~FY3/31) | |
|---|---|---|---|
| Bull | 10.5 | 13.0 | 24.0 |
| Base | 10.5 | 10.5 | 14.1 |
| Bear | 10.5 | 10.4 | 11.5 |
The stock price is based on the closing price on September 17, 2026.
Source: Company data, Goldman Sachs Global Investment Research
Valuation details when factoring in estimates up to FY3/29 using DCF
We believe that products and orders for BBUs and CBUs are largely confirmed for the next two to three years. In fact, Panasonic HD has published its sales guidance for BBUs and CBUs up to FY3/29, and it states that this guidance is based on Awards already acquired (projects for which product development promotion and order agreements have been reached). When factoring in the outlook up to FY3/29 using DCF, the value per share is calculated at ¥6,300 in the base case (in line with our target price; +48% implied upside), ¥6,000 in the bear case (+41%), and potentially ¥8,200 in a bull case (+92%).
The assumptions for the calculation are as follows.
- Energy business: We forecast BBU sales in the Energy business based on our BBU n TAM growth scenario. We forecast operating profits assuming a marginal profit ratio of around 30%. We calculate the earnings estimates for the Energy business by combining this with automotive batteries, dry batteries, etc. We calculate the NPV by DCF based on the following assumptions.
- Cost of equity: The risk-free rate is the current 10-year JGB yield. The market o risk premium is a figure based on calculations by our strategy team. Adjusted Beta is the figure for Panasonic HD over the past two years.
- Cost of debt: Calculated by dividing the company's interest paid (FY3/26 o actual) by interest-bearing debt (after adjusting for the equity credit of subordinated bonds).
- D/E ratio: For equity, we reference the market capitalization as of September o 17; for debt, we reference our FY3/27 estimate for interest-bearing debt (after adjusting for the equity credit of subordinated bonds).
-
Tax rate: We assume an effective tax rate of 20% based on historical average. o
-
Perpetual growth rate: We assume 0% as a conservative premise. o
- Non-Energy businesses: We calculate the EV of non-Energy businesses by applying n the average forward EV/EBITDA of domestic and overseas peers in each business to our FY3/28 estimated EBITDA for Panasonic HD's Smart Life, HVAC & CC, Electric Works, Connect, and Industry businesses.
Exhibit 33: Calculation of per-share valuation when factoring in BBU/CBU growth up to FY3/29
(mn yen)
| (mn JPY) | Bear Case | Base Case | Bull Case | Assumption | |
|---|---|---|---|---|---|
| NPV for Energy business | 8,380,247 | 8,970,342 | 13,352,099 | CoE | 7% |
| EV for other businesses | 5,443,550 | 5,443,550 | 5,443,550 | Risk free rate | 3% |
| Total EV | 13,823,797 | 14,413,892 | 18,795,649 | Market risk premium | 3% |
| Net debt | 158,740 | 158,740 | 158,740 | Adjusted Beta | 1.2 |
| Full value | 13,665,056 | 14,255,152 | 18,636,909 | ||
| Shares outstanding (mn units) | 2,290 | 2,290 | 2,290 | CoD | 3% |
| Implied per-share value (JPY) | 6,000 | 6,300 | 8,200 | Interest-bearing debt | 1,404,310 |
| Upside | 41% | 48% | 92% | Interest paid | 41,998 |
| Total EBITDA (3/28E) | 1,324,867 | 1,342,271 | 1,449,722 | Equity (Market Value) | 10,462,090 |
| Implied EV/EBITDA | 10.4 | 10.7 | 13.0 | Debt (Interest-bearing debt) | 1,404,310 |
| WACC | 7% | ||||
| Stock price (JPY) | 4,262 yen | tax rate | 20% | ||
| Terminal g | 0% |
The stock price is based on the closing price on September 17, 2026. See the Appendix for details on the NPV calculation for the Energy business.
Source: Company data, LSEG Data & Analytics, Bloomberg, Goldman Sachs Global Investment Research
Valuation details when factoring in estimates up to FY3/31 using DCF
Meanwhile, the BBU and CBU markets are actually expected to grow rapidly through 2030. Assuming that the certainty of this market growth increases and the stock market prices it in, we ran calculations factoring in our earnings estimates up to FY3/31 using DCF. In this case, the value per share is calculated at ¥8,300 in the base case (+95% implied upside), ¥6,700 the bear case (+57%), and ¥14,100 in the bull case (+231%). The calculation assumptions are the same as those for when factoring in earnings up to FY3/29, as described above. Additionally, this simulation assumes that Panasonic HD will maintain its competitiveness even as the BBU and CBU markets grow.
Exhibit 34: Calculation of per-share valuation when factoring in BBU/CBU growth up to FY3/31
| (mn JPY) | (mn yen) - Bear Case | (mn yen) - Base Case | (mn yen) - Bull Case | (mn yen) - Assumption | (mn yen) |
|---|---|---|---|---|---|
| NPV for Energy business | 10,002,734 | 13,538,384 | 26,782,322 | CoE | 7% |
| EV for other businesses | 5,443,550 | 5,443,550 | 5,443,550 | Risk free rate | 3% |
| Total EV | 15,446,284 | 18,981,933 | 32,225,872 | Market risk premium | 3% |
| Net debt | 158,740 | 158,740 | 158,740 | Adjusted Beta | 1.2 |
| Full value | 15,287,543 | 18,823,193 | 32,067,131 | ||
| Shares outstanding (mn units) | 2,290 | 2,290 | 2,290 | CoD | 3% |
| Implied per-share value (JPY) | 6,700 | 8,300 | 14,100 | Interest-bearing debt | 1,404,310 |
| Upside | 57% | 95% | 231% | Interest paid | 41,998 |
| Total EBITDA (3/28E) | 1,342,271 | 1,342,271 | 1,342,271 | Equity (Market Value) | 10,462,090 |
| Implied EV/EBITDA | 11.5 | 14.1 | 24.0 | Debt (Interest-bearing debt) | 1,404,310 |
| WACC | 7% | ||||
| Stock price (JPY) | 4,262 yen | tax rate | 20% | ||
| Terminal g | 0% |
The stock price is based on the closing price on September 17, 2026. See the Appendix for details on the NPV calculation for the Energy business.
Source: Company data, LSEG Data & Analytics, Bloomberg, Goldman Sachs Global Investment Research
Appendix
Exhibit 35: Details of BBU TAM forecast (Bull case)
| BBU TAM | 2025 | 2026E | 2027E | 2028E | 2029E | 2030E | |
|---|---|---|---|---|---|---|---|
| Global Data Center GPU Power Demand | MW | ||||||
| Legacy Models | 504 | 18 | - | - | - | - | |
| Blackwell / Blackwell Ultra | 4,494 | 8,017 | 1,897 | - | - | - | |
| Rubin / Rubin Ultra | - | 2,175 | 22,652 | 40,470 | 10,280 | - | |
| Feynman + Future model | - | - | - | 8,320 | 68,750 | 96,357 | |
| Other ASICS | 8,511 | 11,443 | 21,319 | 25,583 | 53,723 | 53,723 | |
| Total | 13,510 | 21,653 | 45,868 | 74,373 | 132,753 | 150,081 | |
| YoY | 72% | 60% | 112% | 62% | 78% | 13% | |
| BBU Attach Rate - Bull Case | % | ||||||
| A100 | - | - | - | - | - | - | |
| H100 | 0% | - | - | - | - | - | |
| H200 | 0% | 0% | - | - | - | - | |
| Blackwell | 40% | 40% | - | - | - | - | |
| Blackwell Ultra | 50% | 55% | 60% | - | - | - | |
| Rubin | - | 55% | 55% | 55% | - | - | |
| Rubin Ultra | - | - | 65% | 75% | 85% | - | |
| Feynman + Future model | - | - | - | 100% | 100% | 100% | |
| - | - | - | - | - | - | ||
| Other ASICS | 30% | 40% | 50% | 60% | 80% | 100% | |
| Weighted BBU Attach Rate (Nvidia) | % | 38% | 54% | 58% | 75% | 97% | 100% |
| BBU Power Demand | MW | ||||||
| A100 | - | - | - | - | - | - | |
| H100 | - | - | - | - | - | - | |
| H200 | - | - | - | - | - | - | |
| Blackwell | 791 | 200 | - | - | - | - | |
| Blackwell Ultra | 1,259 | 4,135 | 1,138 | - | - | - | |
| Rubin | - | 1,196 | 6,937 | 1,997 | - | - | |
| Rubin Ultra | - | - | 6,525 | 27,629 | 8,738 | - | |
| Feynman + Future model | - | - | - | 8,320 | 68,750 | 96,357 | |
| - | - | - | - | - | - | ||
| Other ASICS | 2,553 | 4,577 | 10,659 | 15,350 | 42,979 | 53,723 | |
| Total | 4,603 | 10,108 | 25,260 | 53,296 | 120,466 | 150,081 | |
| YoY | 301% | 120% | 150% | 111% | 126% | 25% | |
| BBU ASP | |||||||
| BBU ASP | |||||||
| Shelf ASP per kW | USD / kW | 475 | 480 | 480 | 497 | 492 | 500 |
| YoY | % | -2% | 1% | 0% | 4% | -1% | 2% |
| BBU TAM | |||||||
| BBU Demand | USD, mn | 2,185 | 4,850 | 12,115 | 26,469 | 59,288 | 75,112 |
| YoY | % | 292% | 122% | 150% | 118% | 124% | 27% |
| JPY/USD | 148 | 160 | 160 | 160 | 160 | 160 | |
| BBU Demand | JPY, mn | 322,994 | 775,961 | 1,938,350 | 4,235,001 | 9,486,142 | 12,017,866 |
| YoY | % | 301% | 140% | 150% | 118% | 124% | 27% |
Source: Company data, Goldman Sachs Global Investment Research
Exhibit 36: Details of BBU TAM forecast (Base case)
| BBU TAM | 2025 | 2026E | 2027E | 2028E | 2029E | 2030E | |
|---|---|---|---|---|---|---|---|
| Global Data Center GPU Power Demand | MW | ||||||
| Legacy Models | 504 | 18 | - | - | - | - | |
| Blackwell / Blackwell Ultra | 4,494 | 8,017 | 1,897 | - | - | - | |
| Rubin / Rubin Ultra | - | 2,175 | 22,652 | 40,470 | 10,280 | - | |
| Feynman + Future model | - | - | - | 8,320 | 68,750 | 96,357 | |
| Other ASICS | 8,511 | 11,443 | 21,319 | 25,583 | 53,723 | 53,723 | |
| Total | 13,510 | 21,653 | 45,868 | 74,373 | 132,753 | 150,081 | |
| YoY | 72% | 60% | 112% | 62% | 78% | 13% | |
| BBU Attach Rate - Base Case | % | ||||||
| A100 | - | - | - | - | - | - | |
| H100 | 0% | - | - | - | - | - | |
| H200 | 0% | 0% | - | - | - | - | |
| Blackwell | 40% | 40% | - | - | - | - | |
| Blackwell Ultra | 50% | 50% | 50% | - | - | - | |
| Rubin | - | 55% | 55% | 55% | - | - | |
| Rubin Ultra | - | - | 60% | 63% | 65% | - | |
| Feynman + Future model | - | - | - | 90% | 93% | 95% | |
| Other ASICS | 30% | 32% | 34% | 36% | 38% | 40% | |
| BBU Attach Rate (Nvidia) | % | 38% | 50% | 56% | 65% | 88% | 95% |
| BBU Power Demand | MW | ||||||
| A100 | - | - | - | - | - | - | |
| H100 | - | - | - | - | - | - | |
| H200 | - | - | - | - | - | - | |
| Blackwell | 791 | 200 | - | - | - | - | |
| Blackwell Ultra | 1,259 | 3,759 | 949 | - | - | - | |
| Rubin | - | 1,196 | 6,937 | 1,997 | - | - | |
| Rubin Ultra | - | - | 6,023 | 23,024 | 6,682 | - | |
| Feynman + Future model | - | - | - | 7,488 | 63,593 | 91,540 | |
| Other ASICS | 2,553 | 3,662 | 7,248 | 9,210 | 20,415 | 21,489 | |
| Total | 4,603 | 8,816 | 21,157 | 41,719 | 90,690 | 113,029 | |
| YoY | 301% | 92% | 140% | 97% | 117% | 25% | |
| BBU ASP | |||||||
| BBU ASP Shelf ASP per kW | USD / kW | 475 | 469 | 463 | 456 | 448 | 444 |
| YoY | % | -2% | -1% | -1% | -1% | -2% | -1% |
| BBU TAM | |||||||
| BBU Demand | USD, mn | 2,185 | 4,134 | 9,793 | 19,027 | 40,587 | 50,157 |
| YoY | % | 292% | 89% | 137% | 94% | 113% | 24% |
| JPY/USD | 148 | 160 | 160 | 160 | 160 | 160 | |
| BBU Demand | JPY, mn | 322,994 | 661,486 | 1,566,890 | 3,044,362 | 6,493,933 | 8,025,132 |
| YoY | % | 301% | 105% | 137% | 94% | 113% | 24% |
Source: Company data, Goldman Sachs Global Investment Research
Exhibit 37: Details of BBU TAM forecast (Bear case)
| BBU TAM | 2025 | 2026E | 2027E | 2028E | 2029E | 2030E | |
|---|---|---|---|---|---|---|---|
| Global Data Center GPU Power Demand | MW | ||||||
| Legacy Models | 504 | 18 | - | - | - | - | |
| Blackwell / Blackwell Ultra | 4,494 | 8,017 | 1,897 | - | - | - | |
| Rubin / Rubin Ultra | - | 2,175 | 22,652 | 40,470 | 10,280 | - | |
| Feynman + Future model | - | - | - | 8,320 | 68,750 | 96,357 | |
| Other ASICS | 8,511 | 11,443 | 21,319 | 25,583 | 53,723 | 53,723 | |
| Total | 13,510 | 21,653 | 45,868 | 74,373 | 132,753 | 150,081 | |
| YoY | 72% | 60% | 112% | 62% | 78% | 13% | |
| BBU Attach Rate - Bear Case | % | ||||||
| A100 | - | - | - | - | - | - | |
| H100 | 0% | - | - | - | - | - | |
| H200 | 0% | 0% | - | - | - | - | |
| Blackwell | 40% | 40% | - | - | - | - | |
| Blackwell Ultra | 50% | 50% | 50% | - | - | - | |
| Rubin | - | 55% | 55% | 55% | - | - | |
| Rubin Ultra | - | - | 60% | 62% | 64% | - | |
| Feynman + Future model | - | - | - | 64% | 66% | 68% | |
| Other ASICS | 30% | 31% | 32% | 33% | 34% | 35% | |
| Weighted BBU Attach Rate (Nvidia) | % | 38% | 50% | 56% | 61% | 66% | 68% |
| BBU Power Demand | MW | ||||||
| A100 | - | - | - | - | - | - | |
| H100 | - | - | - | - | - | - | |
| H200 | - | - | - | - | - | - | |
| Blackwell | 791 | 200 | - | - | - | - | |
| Blackwell Ultra | 1,259 | 3,759 | 949 | - | - | - | |
| Rubin | - | 1,196 | 6,937 | 1,997 | - | - | |
| Rubin Ultra | - | - | 6,023 | 22,840 | 6,579 | - | |
| Feynman + Future model | - | - | - | 5,325 | 45,375 | 65,523 | |
| Other ASICS | 2,553 | 3,547 | 6,822 | 8,442 | 18,266 | 18,803 | |
| Total | 4,603 | 8,702 | 20,731 | 38,604 | 70,220 | 84,326 | |
| YoY | 301% | 89% | 138% | 86% | 82% | 20% | |
| BBU ASP | |||||||
| BBU ASP Shelf ASP per kW | USD / kW | 475 | 451 | 435 | 424 | 414 | 406 |
| YoY | % | -2% | -5% | -4% | -2% | -2% | -2% |
| BBU TAM | |||||||
| BBU Demand | USD, mn | 2,185 | 3,924 | 9,011 | 16,364 | 29,098 | 34,226 |
| YoY | % | 292% | 80% | 130% | 82% | 78% | 18% |
| JPY/USD | 148 | 160 | 160 | 160 | 160 | 160 | |
| BBU Demand | JPY, mn | 322,994 | 627,790 | 1,441,798 | 2,618,167 | 4,655,684 | 5,476,118 |
| YoY | % | 301% | 94% | 130% | 82% | 78% | 18% |
Source: Company data, Goldman Sachs Global Investment Research
Simulation of Energy business NPV using DCF and EV of other businesses through FY3/29 (details)
Exhibit 38: DCF simulation through FY3/29 (bull case)
Value per share estimated at ¥8,200 (+92% implied upside)
| Panasonic HD (Bull case) | Panasonic HD (Bull case) | Panasonic HD (Bull case) | Panasonic HD (Bull case) | Panasonic HD (Bull case) | Panasonic HD (Bull case) | (JPYmn) |
| 3/2027E | 3/2028E | 3/2029E | Terminal | |||
| Energy | Energy | Energy | 0 | 1 | 2 | Value |
| OP | OP | OP | 228,566 | 545,551 | 988,983 | |
| OP*(1-tax) | OP*(1-tax) | OP*(1-tax) | 182,853 | 436,441 | 791,186 | |
| +) Depreciation | +) Depreciation | +) Depreciation | 102,027 | 114,520 | 357,354 | |
| -) Capex | -) Capex | -) Capex | 251,588 | 217,072 | 294,352 | |
| FCF | FCF | FCF | 33,291 | 333,889 | 854,189 | 13,808,798 |
| PV of FCF | PV of FCF | PV of FCF | 33,291 | 314,438 | 757,566 | 12,246,803 |
| DCF Valuation | ||||||
| NPV for Energy (a) | 13,352,099 | 13,352,099 | ||||
| Other business | ||||||
| Total EBITDA | Total EBITDA | Total EBITDA | 1,062,951 | 1,449,722 | 2,394,087 | |
| Energy EBITDA | Energy EBITDA | Energy EBITDA | 354,488 | 680,582 | 1,568,638 | |
| Other EBITDA | Other EBITDA | Other EBITDA | 708,463 | 769,140 | 825,449 | |
| Smart Life | Smart Life | Smart Life | 110,400 | 113,900 | 118,400 | |
| HVAC &CC | HVAC &CC | HVAC &CC | 106,800 | 109,400 | 112,200 | |
| Electric Works | Electric Works | Electric Works | 122,600 | 125,200 | 127,800 | |
| Connect | Connect | Connect | 180,270 | 206,791 | 219,879 | |
| Industry | Industry | Industry | 188,393 | 213,850 | 247,170 | |
| EV/EBITDA | ||||||
| Smart Life | Smart Life | Smart Life | 6 | |||
| HVAC &CC | HVAC &CC | HVAC &CC | 9 | |||
| Electric Works | Electric Works | Electric Works | 9 | |||
| Connect | Connect | Connect | 6 | |||
| Industry | Industry | Industry | 9 | |||
| Other EV (b) | Other EV (b) | Other EV (b) | 5,443,550 | |||
| Energy + Other | ||||||
| EV (a+b) | 18,795,649 | |||||
| -)Net debt | 158,740 | |||||
| Full value | 18,636,909 | |||||
| S/O | 2,290 | |||||
| Implied per-share value | 8,200 yen | Implied EV/EBITDA | 17.7 | 13.0 | 7.9 | |
| Share price as of Sep 17. | 4,262 | |||||
| Upside/downside | 92% |
Share prices are based on September 17, 2026 closing prices.
Source: Company data, LSEG Data & Analytics, Bloomberg, Goldman Sachs Global Investment Research
| Assumption | |
|---|---|
| CoE | 7% |
| Risk free rate | 3% |
| Market risk premium | 3% |
| Adjusted Beta | 1.2 |
| CoD | 3% |
| Interest-bearing debt | 1,404,310 |
| Interest Paid | 41,998 |
| Equity (Market Value) | 10,462,090 |
| Debt (Interest-bearing debt) | 1,404,310 |
| WACC | 6% |
| tax rate | 20% |
| Terminal g | 0% |
Exhibit 39: DCF simulation through FY3/29 (base case)
Value per share estimated at ¥6,300 (+48% implied upside)
| Panasonic HD (Base case) | Panasonic HD (Base case) | Panasonic HD (Base case) | Panasonic HD (Base case) | Panasonic HD (Base case) | Panasonic HD (Base case) | (JPYmn) |
|---|---|---|---|---|---|---|
| 3/2027E | 3/2028E | 3/2029E | Terminal | |||
| Energy | Energy | Energy | 0 | 1 | 2 | Value |
| OP | OP | OP | 215,525 | 458,611 | 653,612 | |
| OP*(1-tax) | OP*(1-tax) | OP*(1-tax) | 172,420 | 366,889 | 522,890 | |
| +) Depreciation | +) Depreciation | +) Depreciation | 102,027 | 114,520 | 272,354 | |
| -) Capex | -) Capex | -) Capex | 248,345 | 202,340 | 233,614 | |
| FCF | FCF | FCF | 26,102 | 279,068 | 561,629 | 9,210,562 |
| PV of FCF | PV of FCF | PV of FCF | 26,102 | 263,030 | 498,928 | 8,182,283 |
| DCF Valuation | ||||||
| NPV for Energy (a) | 8,970,342 | 8,970,342 | ||||
| Other business | ||||||
| Total EBITDA | Total EBITDA | Total EBITDA | 1,026,015 | 1,342,271 | 1,751,415 | |
| Energy EBITDA | Energy EBITDA | Energy EBITDA | 317,552 | 573,131 | 925,966 | |
| Other EBITDA | Other EBITDA | Other EBITDA | 708,463 | 769,140 | 825,449 | |
| Smart Life | Smart Life | Smart Life | 110,400 | 113,900 | 118,400 | |
| HVAC &CC | HVAC &CC | HVAC &CC | 106,800 | 109,400 | 112,200 | |
| Electric Works | Electric Works | Electric Works | 122,600 | 125,200 | 127,800 | |
| Connect | Connect | Connect | 180,270 | 206,791 | 219,879 | |
| Industry | Industry | Industry | 188,393 | 213,850 | 247,170 | |
| EV/EBITDA | ||||||
| Smart Life | Smart Life | Smart Life | 6 | |||
| HVAC &CC | HVAC &CC | HVAC &CC | 9 | |||
| Electric Works | Electric Works | Electric Works | 9 | |||
| Connect | Connect | Connect | 6 | |||
| Industry | Industry | Industry | 9 | |||
| Other EV (b) | Other EV (b) | Other EV (b) | 5,443,550 | |||
| Energy + Other | ||||||
| EV (a+b) | 14,413,892 | |||||
| -)Net debt | 158,740 | |||||
| Full value | 14,255,152 | |||||
| S/O | 2,290 | |||||
| Implied per-share value | 6,300 yen | Implied EV/EBITDA | 14.0 | 10.7 | 8.2 | |
| Share price as of Sep 15. | 4,262 | |||||
| Upside/downside | 48% |
Share prices are based on September 17, 2026 closing prices.
Source: Company data, LSEG Data & Analytics, Bloomberg, Goldman Sachs Global Investment Research
| Assumption | |
|---|---|
| CoE | 7% |
| Risk free rate | 3% |
| Market risk premium | 3% |
| Adjusted Beta | 1.2 |
| CoD | 3% |
| Interest-bearing debt | 1,404,310 |
| Interest Paid | 41,998 |
| Equity (Market Value) | 10,462,090 |
| Debt (Interest-bearing debt) | 1,404,310 |
| WACC | 6% |
| tax rate | 20% |
| Terminal g | 0% |
Exhibit 40: DCF simulation through FY3/29 (bear case)
Value per share estimated at ¥6,000 (+41% implied upside)
Share prices are based on September 17, 2026 closing prices.
Source: Company data, LSEG Data & Analytics, Bloomberg, Goldman Sachs Global Investment Research
| Assumption | |
|---|---|
| CoE | 7% |
| Risk free rate | 3% |
| Market risk premium | 3% |
| Adjusted Beta | 1.2 |
| CoD | 3% |
| Interest-bearing debt | 1,404,310 |
| Interest Paid | 41,998 |
| Equity (Market Value) | 10,462,090 |
| Debt (Interest-bearing debt) | 1,404,310 |
| WACC | 6% |
| tax rate | 20% |
| Terminal g | 0% |
Simulation of Energy business NPV using DCF and EV of other businesses through FY3/31 (details)
Exhibit 41: DCF simulation through FY3/31 (bull case)
Value per share estimated at ¥14,100 (+231% implied upside)
Share prices are based on September 17, 2026 closing prices.
Source: Company data, LSEG Data & Analytics, Bloomberg, Goldman Sachs Global Investment Research
Exhibit 42: DCF simulation through FY3/31 (base case)
Value per share estimated at ¥8,300 (+95% upside)
Share prices are based on September 17, 2026 closing prices.
Source: Company data, LSEG Data & Analytics, Bloomberg, Goldman Sachs Global Investment Research
| Assumption | |
|---|---|
| CoE | 7% |
| Risk free rate | 3% |
| Market risk premium | 3% |
| Adjusted Beta | 1.2 |
| CoD | 3% |
| Interest-bearing debt Interest Paid | 1,404,310 41,998 |
| Equity (Market Value) | 10,462,090 |
| Debt (Interest-bearing debt) | 1,404,310 |
| WACC | 6% |
| tax rate | 20% |
| Terminal g | 0% |
| Assumption | |
|---|---|
| CoE | 7% |
| Risk free rate | 3% |
| Market risk premium | 3% |
| Adjusted Beta | 1.2 |
| CoD | 3% |
| Interest-bearing debt | 1,404,310 |
| Interest Paid | 41,998 |
| Equity (Market Value) | 10,462,090 |
| Debt (Interest-bearing debt) | 1,404,310 |
| WACC | 6% |
| tax rate | 20% |
| Terminal g | 0% |
Exhibit 43: DCF simulation through FY3/31 (bear case)
Value per share estimated at ¥6,700 (+57% upside)
Share prices are based on September 17, 2026 closing prices.
Source: Company data, LSEG Data & Analytics, Bloomberg, Goldman Sachs Global Investment Research
Investment Thesis - Panasonic Holdings
Panasonic Holdings has a broad range of businesses, including home appliances, automotive batteries, industrial equipment, automotive equipment, and e-components. While its traditional core businesses have been home appliances (accounting for 30-40% of sales and profits), automotive batteries supplied mainly to Tesla, and Blue Yonder, which became a wholly owned subsidiary in 2021, attention has recently shifted to products for data centers, such as BBUs, CCLs, and high-performance capacitors. In addition, with benefits from structural reforms and a peak in investment in automotive batteries and Blue Yonder, we believe strong cash flow will be generated, potentially resulting in large-scale share buybacks. We are Buy rated.
Price Target Risks and Methodology - Panasonic Holdings
We are Buy rated. Our 12-month target price is ¥6,300. We apply an EV/EBITDA multiple of 10.5X (FY3/28E basis, derived from the correlation between EV/EBITDA and EBITDA margin for global competitors / historical correlation between EV/EBITDA and EBITDA margin). Risks: Companywide: (1) Weaker-than-expected progress with fixed-cost reductions or insufficiently realized benefits from business reforms across the company as a whole, (2) weaker growth prospects due to the loss of key personnel during the fixed-cost reduction process, (3) slower-than-expected progress in revamping the business portfolio as a result of delays selecting buyers, (4) additional investment and depreciation burdens arising due to increased demand for cylindrical batteries, and (5) forex trends (we estimate that every ¥1 appreciation vs. the USD/EUR/CNY impacts annual adjusted operating profits by -¥0.9 bn/-¥1.0 bn/+¥4.7 bn, respectively). Lifestyle updates business: Weaker demand for residential/commercial air conditioners due to a downturn in the global economy, or the loss of market share to more popular or cheaper products at competitors. Panasonic Connect: (1) A slump in the company's aircraft services business if the 'bring your own devices' trend were to become more common for in-flight entertainment on commercial aircraft, (2) weaker-than-expected sales growth at acquired company Blue Yonder (standalone basis), (3) major impairment losses on Blue Yonder if the calculation of its present value were to require a higher WACC due to rising interest rates, softer demand or other factors (indication of impairment is checked every quarter), and (4) a longer-than-anticipated decline in demand for various mounting systems used in process automation, such as the manufacture of PCs and smartphones. Panasonic Energy: Tesla opting to increase its use of batteries made by other companies, leading to stronger pricing pressures, a further slowdown in the EV market, or increased competition in the generative AI-related battery backup unit (BBU) business. Panasonic Industry: Weaker-than-expected factory automation-related demand, stiffer competition in the generative AI-related hybrid capacitor and circuit board material businesses, or a longer-than-expected downturn in demand for smartphones and other consumer electronics.
| Assumption | |
|---|---|
| CoE | 7% |
| Risk free rate | 3% |
| Market risk premium | 3% |
| Adjusted Beta | 1.2 |
| CoD | 3% |
| Interest-bearing debt | 1,404,310 |
| Interest Paid | 41,998 |
| Equity (Market Value) | 10,462,090 |
| Debt (Interest-bearing debt) | 1,404,310 |
| WACC | 6% |
| tax rate | 20% |
| Terminal g | 0% |
Investment Thesis - Murata Mfg.
Murata Mfg.'s main business is the manufacture of MLCCs, which account for about 50% of sales, as well as RF modules and MetroCirc. Demand for small, high-capacity MLCCs for AI/DC has expanded rapidly from 2025 onwards, tightening overall MLCC supply/demand. MLCCs for AI/DC are characterized by high technical requirements from customers to cope with surging power consumption within limited baseboard areas, resulting in higher ASPs compared to those for other products (they are also more likely to benefit from increased content per device due to technological changes). In April 2026, the company decided on an ¥80.0 bn capacity expansion investment specializing in AI/DC, and as the global market share leader (estimated at over 50% for AI/DC alone), we think it will continue to strongly benefit from AI demand. We believe this cycle will be prolonged due to factors such as further supply/demand tightening from a recovery in consumer electronics, an increase in long-term agreements (LTAs) for FY3/28, and further penetration into edge devices. We are Buy rated on Murata.
Price Target Risks and Methodology - Murata Mfg.
Valuation methodology: We are Buy rated on Murata Mfg. with a 12-month price target of ¥12,900. Our target price is based on a FY3/29E EV/GCI vs. CROCI/WACC, applying an 80% premium to our sector multiple of 10X (implies FY3/29E P/E of 30X).
Key risks: Decline in smartphone production volume, deterioration in MLCC supply/demand, and yen appreciation.
Investment Thesis - TDK
TDK is a Japan-based company that operates a passive components business, which manufactures ceramic capacitors, aluminum electrolytic capacitors, and piezo materials/components; a sensor application products business, which supplies temperature/pressure, magnetic, and MEMS sensors; a magnetic application products business, which produces HDD heads/suspensions and magnets; and an energy application products business, which manufactures secondary electron and power supply products. We are Buy rated on TDK, as we expect balanced earnings contributions from growth in batteries, sensors, passive components, and magnetic applications. We see gradual revenue and profit growth in batteries, assuming no changes in material costs and selling prices. We forecast continued improvement in the sensor business, with signs that the business will remain consistently in the black. In passive components, we see automotive/industrial MLCCs driving growth, and in magnetic applications, we see nearline HDDs driving growth. We believe valuations are attractive considering the company's well-balanced business drivers and growth potential of the battery business.
Price Target Risks and Methodology - TDK
Valuation methodology: We are Buy rated on TDK with a 12-month price target of ¥4,900. Our target price is based on a FY3/29E EV/GCI vs. CROCI/WACC, applying a 10% premium to our sector average EV/DACF multiple of 10X (implies FY3/28E P/E of 27X).
Key risks: Decline in smartphone production volume, higher input costs, and yen appreciation.
Investment Thesis - MinebeaMitsumi
MinebeaMitsumi mainly manufactures bearings (miniature bearings of 30 mm or less), analog semiconductors, motors, and products for optical image stabilization (OIS actuators). It has a share of over 60% of the global ball bearing market (miniature/small-diameter ball bearings). The four core businesses are affected by the cycle to some extent, but we think all these businesses will contribute to longer-term growth. We are Buy-rated on MinebeaMitsumi.
Price Target Risks and Methodology - MinebeaMitsumi
We are Buy-rated. Our 12-month price target is ¥5,500, based on FY3/29E EV/GCI vs. CROCI/WACC, applying the sector average EV/DACF multiple of 10X. Our target price implies FY3/28E P/E of 20X. Key risks include sharper-than-expected rises in input costs, a decline in auto production, and forex swings.
Delta Electronics is the largest vendor of power supply components globally (in terms of sales) and a key servo motor/inverter/PLC supplier in mainland China. It is also a key supplier for the EV/server power industry, holding one of the largest market shares in both markets. We are positive on Delta's long-term growth opportunity driven by multiple factors (EV/EV charger/5G infrastructure/Datacenter power/ESS etc.) in the coming years. We also expect demand for its AI server power and cooling systems to deliver solid growth given the increasing demand for high computing performance AI servers, which will require higher efficiency power components and better cooling systems to improve the overall performance. Trading at a 1-year forward P/E multiple that is below our target multiple, we believe the stock is undervalued, given the company's strong revenue outlook (50%+ 2025-28E CAGR) for its growth sectors (including EV & EV charging / green capex & renewable energy / cloud computing / smart manufacturing / satellite communication & smart connectivity), and its leadership in the power component industry. We are Buy rated. Key downside risks include: (1) slower-than-expected AI server power consumption growth momentum, (2) potential market share loss risk in AI server DC-DC power system or the potential design change on AI server DC-DC system, and (3) slower than expected of future products deployment, including power rack, SST and SOFC.
Valuation methodology: We are Buy rated on Delta. Our 12m TP of NT$4,120 is based on a target P/E multiple of 26.5x (1.6x s.d. higher than Delta's past 15-year average valuation) applied to our 2028E EPS and discounted back to 2027 at a CoE of 11%.
Key downside risks: (1) slower-than-expected AI server power consumption growth momentum, (2) potential market share loss risk in AI server DC-DC power system or the potential design change on AI server DC-DC system, and (3) slower than expected of future products deployment, including power rack, SST and SOFC.
Megmeet is undergoing a structural transformation from an automation & control specialist to a global AI server power supply contender. The company has secured volume orders for 5.5kW PSUs (GB200/GB300) with new orders and shipments to continue through 2026. While its entry into the NVIDIA MGX ecosystem validates its R&D capabilities, a gap remains in its high-efficiency product portfolio compared to tier-1 peers such as Delta Electronics. Moreover, the blurring of supply chain boundaries - with increasing new entrants could intensify competition for next-gen 800 VDC products and potentially higher uncertainties with the adoption of solid-state transformers (SST). At current valuations, we see a balanced risk-reward profile, with upside potential contingent on faster GPU/ASIC order wins or accelerated 800V product validation. Going forward, we will continue to monitor its execution on mass production yields and R&D progress of next-generation products. We are Neutral rated on a sector-relative basis considering earnings growth rate, return profile and P/E valuation.
Price Target Risks and Methodology - Megmeet
Valuation methodology: Our 12-month TP of Rmb120.0 is based on 32x 2028E P/E discounted back to 2027E with 11% CoE.
Key up/downside risks: (1) Faster/slower AI server PSU market share gain within NVIDIA ecosystem; (2) Faster/slower product validation progress with ASIC hardware supply chains; (3) Better/worse-than-expected execution on mass production; (4) Shorter/longer R&D cycles on 800VDC power products; (5) Faster/slower industry adoption on 800V DC power distribution architecture; (6) Global AI capex growth sustainability and AIDC supply/demand dynamics.
Investment Thesis - Samsung SDI
Samsung SDI (SDI) is a battery and electronic materials manufacturer maintaining industry-leading profitability levels in the large-sized battery business while becoming more of a pure-play battery company. We expect Samsung SDI battery margins to be more resilient than that of peers given long-term contracts with premium customers. Meanwhile, SDI is making good progress on technology leadership (alongside LGES) with strong know-how and a diversified new product offering (mass production of prismatic P6 with Ni >90%, cylindrical 46-pi, and solid state batteries). We also see potential for further cell order momentum in the US market as OEMs look for battery suppliers and form factor diversification.
While we remain positive on SDI's fundamentals, the stock is now already pricing in our base case xEV long-term market share and core xEV EBITDA margin growth; as well as our base case ESS assumptions. The stock is also trading above its long-term average 12m forward P/B multiple. We are Neutral rated on the stock.
Price Target Risks and Methodology - Samsung SDI Co.
We are Neutral rated on Samsung SDI with a 2027E/28E SOTP-based 12m TP of W695,000 (xEV Battery: DCF; Small-size Battery/ESS/EM: 11x/14x/8x 27E/28E EBITDA multiple; Listed/unlisted subsidiaries: market/book value).
Key upside/downside risks:
(1) Higher/lower-than-expected global EV penetration rate growth; (2) faster/slower-than-expected EV/ESS shipment and market share growth in battery-related business; (3) higher/lower-than-expected battery business margins, higher/lower-than-expected EM business margins and; (4) weaker/stronger-than-expected KRW:USD.
Investment Thesis - LG Energy Solution
LGES is the largest battery manufacturer outside China, with leadership in high nickel battery chemistries. We remain positive on LGES' fundamentals given its widening global technology leadership in batteries with upcoming commercial production of new technology battery products such as large size cylindrical 4680 batteries, cell-to-pack LFP batteries (from 2025) and dry electrode process (from 2028). Meanwhile, we see market share growth in the US, driven by rapidly expanding capacities where we expect the company's US market share growth to be margins and returns accretive (GSe 2026E-28E EBITDA CAGR of 51% and 6.5% CROCI expansion during this period).
While the market is anchored on near-term EV battery weakness, we believe it is underestimating the emerging clearer path to utilization rate recovery which we estimate to rise from ~42% in FY26E to ~67% in 2028E. We also see improving visibility in medium-term earnings (doubling of EBITDA between FY26E-28E), supported by ESS demand and strong order momentum for new products. We are Buy rated on LGES.
Price Target Risks and Methodology - LG Energy Solution
We are Buy rated on LGES with a 12m TP of W520,000 derived using a 50%/50% blend of DCF (WACC: 8.4%, TGR: 3.3%) and 2027E/28E EV/EBITDA. We apply a mid-cycle 20x multiple to adjusted (ex-JV share) 2027E/28E EBITDA.
Key downside risks: (1) Lower-than-expected market share; (2) Slower-than-expected ramp-up of new EV/ESS battery plant lines; (3) Lower global EV penetration rate
Price Target Risks and Methodology - Flex
We are Buy rated on Flex shares. Our 12-month price target of $154 is based on 21X Q5-Q8 EPS including SBC. Our estimates do not include the proposed transaction of EPC Power.
Key risks to our view relate to macroeconomic demand, supply/demand dynamics, Flex's ability to expand margins, tariff impacts and geopolitical uncertainty, and FCF.