PDF 原檔:報告_BofA_ABF載板_20260625_original.pdf
圖片清單(已驗證 2026-06-30)
| 檔名 | size | 分類 | 親眼所見內容 |
|---|---|---|---|
報告_BofA_ABF載板_20260625_001.png |
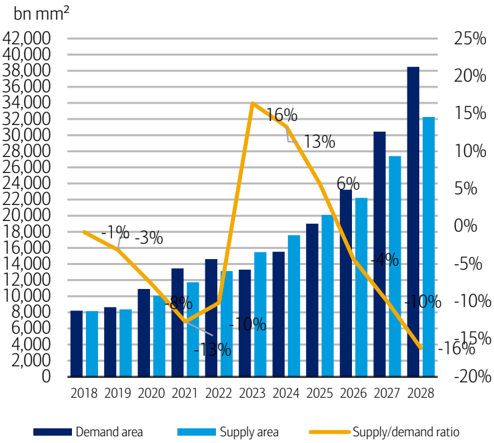
76KB | 真資料圖 | ABF 載板供需模型(新):Demand area / Supply area 長條 + 供需比折線,2018–2028,2028 缺口擴大至 −16% |
報告_BofA_ABF載板_20260625_002.png |
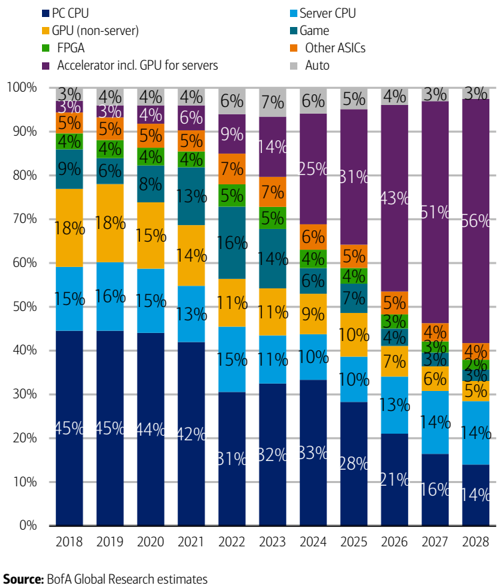
119KB | 真資料圖 | ABF 需求結構(新):堆疊長條按應用別,Accelerator(含伺服器 GPU) 2028 升至 56%、PC CPU 降至 14%、Server CPU 持平 |
報告_BofA_ABF載板_20260625_003.png |
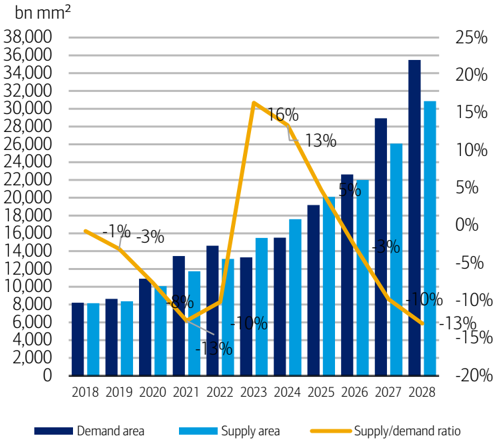
77KB | 真資料圖 | ABF 載板供需模型(舊):同型圖,2028 缺口 −13%(前次估計) |
報告_BofA_ABF載板_20260625_004.png |
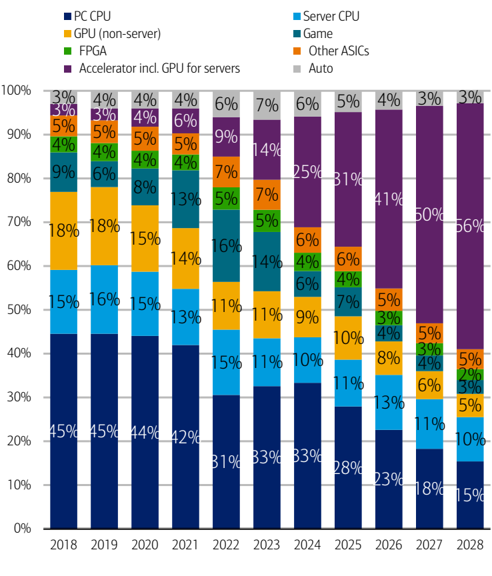
115KB | 真資料圖 | ABF 需求結構(舊):Accelerator 2028 升至 56%(前次版本) |
報告_BofA_ABF載板_20260625_005.png |
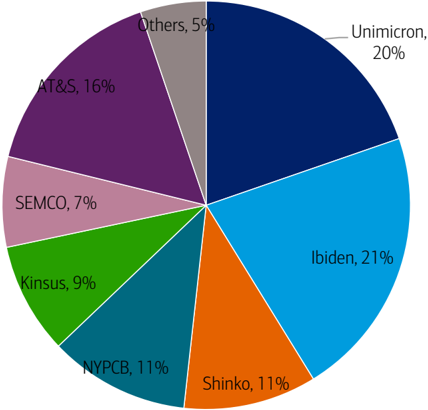
49KB | 真資料圖 | 2026E 產能市佔圓餅:Ibiden 21%、Unimicron 20%、AT&S 16%、NYPCB 11%、Shinko 11%、Kinsus 9%、SEMCO 7%、Others 5% |
報告_BofA_ABF載板_20260625_006.png |
76KB | 真資料圖 | Ibiden(IBIDF) 股價+目標價沿革圖,最新 PO ¥29,800 |
報告_BofA_ABF載板_20260625_007.png |
65KB | 真資料圖 | Kinsus(KNSUF) 股價+目標價沿革圖,最新 PO NT$900 |
報告_BofA_ABF載板_20260625_008.png |
72KB | 真資料圖 | NYPCB(NANYF) 股價+目標價沿革圖,最新 PO NT$1,200 |
報告_BofA_ABF載板_20260625_009.png |
96KB | 真資料圖 | Unimicron(UMCRF) 股價+目標價沿革圖,最新 PO NT$1,400 |
lib 技術頁嵌入產業圖 _001 / _002 / _005;個股股價+PO 沿革圖(_006–_009)為低資訊量貼圖,不嵌。
原始內容
Technology Hardware - Asia-Pacific
ABF substrate: further tightened S&D, led by CPU strength; lift POs of three names
Price Objective Change
Further widening of S/D gap amid strength in server CPUs
We update the ABF substrate industry S/D (supply/demand) model in this report, and we now expect an undersupply of 4%/10%/16% (was 3%/10%/13%) across 2026/27/28E. While AI server continues to be the biggest demand contributor/driver with an expected 43%/51%/56% in 2026/27/28, we reflect the boost from (see our report) a further expanded TAM by server CPUs, which now accounts for 13%/14%/14% (was 13%/11%/10%) of the total expected demand in 2026/27/28E. On the supply side, the changes primarily reflect the latest comments by NYPCB, Kinsus and AT&S regarding capacity expansion, and we now forecast an overall 11%/23%/18% (was 9%/19%/18%) increase across 2026/27/28 by industry participants.
Positive read-across for margins & S/D from Ibiden/AT&S
At the industry level, we see positive read-across from the recent updates shared by Ibiden and AT&S. For the former, we note that 1) it targets 30% OpM in FY30 (vs ~15% in FY25), or 35% for the electronics business; and 2) it stated that a lead time of four years is required from planning to mass production, should there be an additional new building beyond the ¥ 500bn investment announced earlier this year. As for the latter, we note that it raised its revenue growth guidance to 45-55% (was 30-35%) for FY26/27, while expecting EBITDA margins to reach 32-37% (was 25-29%) over the same period.
Upstream sourcing continues to favor industry leaders
Regarding upstream raw material (T-glass cloth) sourcing, we see a more contained implied risk for Unimicron than for NYPCB/Kinsus, considering 1) differences in industry positioning and customer profile; and 2) recent commentary from industry peers, including Ibiden, AT&S and Toppan. That said, we believe all major suppliers (Ibiden, Unimicron, NYPCB, and Kinsus) with more significant revenue/earnings contribution from ABF substrates should benefit from the structural S/D tightness. As such, we reiterate our Buy ratings on these four names.
Raise estimates; raise POs on higher P/E multiples
We revise 2026-28E EPS for Unimicron/NYPCB/Kinsus by 0-1%/1-7%/2-9%, reflecting the updated business outlook and FX assumptions. We raise our POs on Unimicron/NYPCB/Kinsus are NT$1,400/NT$1,200/NT$900 (from NT$1,300/NT$1,170/NT$820), and are based on 33x/30x/30x (30.5x/28.5x/28.5x previously) 2H27-1H28E P/E multiples, reflecting a further widening of the S-D gap through 2027-28 and reiterate our Buy ratings. For Ibiden, our analyst Masashi Kubota has also (see our report) raised the PO and estimates earlier this week, reflecting 1) the benefits of an improved demand outlook for the CPU market; and 2) contributions from silicon bridge package substrates.
This research report provides general information only. No part of this report may be used or reproduced or quoted in any manner whatsoever in Taiwan by the press or other persons without the express written consent of BofA Securities.
>> Employed by a non-US affiliate of BofAS and is not registered/qualified as a research analyst under the FINRA rules.
Refer to "Other Important Disclosures" for information on certain BofA Securities entities that take responsibility for the information herein in particular jurisdictions.
BofA Securities does and seeks to do business with issuers covered in its research reports. As a result, investors should be aware that the firm may have a conflict of interest that could affect the objectivity of this report. Investors should consider this report as only a single factor in making their investment decision.
Refer to important disclosures on page 13 to 17. Analyst Certification on page 9. Price Objective Basis/Risk on page 8. 12986579
Timestamp: 25 June 2026 02:04AM EDT
25 June 2026
Equity Asia-Pacific Tech Hardware
Mike Yang >> Research Analyst Merrill Lynch (Taiwan) +886 2 2376 3729 mike.c.yang@bofa.com
Masashi Kubota >> Research Analyst BofAS Japan +81 3 6225 7138 masashi.kubota@bofa.com
ABF - Ajinomoto build-up film
AI - artificial intelligence
CPU - central processing unit
NYPCB - Nan Ya Printed Circuit Board
OpM - operating margin
TAM- total addressable market
Exhibit 1: Summary of PO change
We raise PO on three stocks
| PO (local currency) | PO (local currency) | ||
|---|---|---|---|
| Company | Ticker | New | Old |
| Unimicron | 3037 TT | 140 0 | 1300 |
| Kinsus | 3189 TT | 120 0 | 1170 |
| NYPCB | 8046 TT | 900 | 820 |
Source:
BofA Global Research
BofA GLOBAL RESEARCH
Exhibit 2: ABF substrate supply/demand (new)
We expect an undersupply of 4%/10%/16% in 2026/27/28
Source: BofA Global Research estimates
BofA GLOBAL RESEARCH
Exhibit 4: Demand mix of ABF substrate (new)
We expect continued strength of demand growth from AI accelerators, while the demand from server CPU also turns stronger
Source: BofA Global Research estimates
BofA GLOBAL RESEARCH
Exhibit 3: ABF substrate supply/demand (old)
Previously, we expected an undersupply of 3%/10%/13% in 2026/27/28
Source: BofA Global Research estimates
BofA GLOBAL RESEARCH
Exhibit 5: Demand mix of ABF substrate (old)
Previously, we already expected AI accelerators to account for 40+% demand in 2026
Source: BofA Global Research estimates
BofA GLOBAL RESEARCH
Exhibit 6: Supply (capacity) breakdown by suppliers, 2026E
Ibiden and Unimicron are the leaders in terms of capacity scale
Source: BofA Global Research estimates, company data
BofA GLOBAL RESEARCH
Exhibit 7: Summary of changes in PO and valuation method
We raise P/E multiples on Unimicron, Kinsus and NYPCB to derive the new POs
| PO (local currency) | PO (local currency) | Valuation method | Valuation method | ||
|---|---|---|---|---|---|
| Company | Ticker | New | Old | New | Old |
| Unimicron | 3037 TT | 1400 | 1300 | 33x 2H27-1H28E P/E | 30.5x 2H27-1H28E P/E |
| Kinsus | 3189 TT | 1200 | 1170 | 30x 2H27-1H28E P/E | 28.5x 2H27-1H28E P/E |
| NYPCB | 8046 TT | 900 | 820 | 30x 2H27-1H28E P/E | 28.5x 2H27-1H28E P/E |
Source:
BofA Global Research
Exhibit 8: Table of recommendations
Stocks mentioned with ratings in this report
| BofA ticker | Ticker | Company name | Price (LC) | Rating |
|---|---|---|---|---|
| UMCRF | 3037 TT | Unimicron | NT$ 931 | C-1-7 |
| KNSUF | 3189 TT | Kinsus | NT$ 739 | C-1-7 |
| NANYF | 8046 TT | NYPCB | NT$ 955 | C-1-7 |
| IBIDF | 4062 JP | Ibiden | JPY 24785 | C-1-7 |
Source:
BofA Global Research, company data
BofA GLOBAL RESEARCH
BofA GLOBAL RESEARCH
Exhibit 9: Earnings estimate change - Unimicron
We slightly nudge EPS by 0-1% after baking in the updated FX assumption
| (NT$mn) | BofA 26 (E) | BofA 26 (E) | BofA 26 (E) | BofA 27 (E) | BofA 27 (E) | BofA 27 (E) | BofA 28 (E) | BofA 28 (E) | BofA 28 (E) |
|---|---|---|---|---|---|---|---|---|---|
| New | Old | Diff (%) | New | Old | Diff (%) | New | Old | Diff (%) | |
| Total sales | 181,361 | 180,483 | 0.5 | 254,419 | 254,662 | -0.1 | 320,669 | 320,976 | -0.1 |
| Gross profit | 41,990 | 41,956 | 0.1 | 79,411 | 79,487 | -0.1 | 117,478 | 117,590 | -0.1 |
| Gross margin | 23.2% | 23.2% | -0.1 ppt | 31.2% | 31.2% | 0.0 ppt | 36.6% | 36.6% | 0.0 ppt |
| Operating profit | 26,819 | 26,795 | 0.1 | 63,164 | 63,237 | -0.1 | 99,369 | 99,479 | -0.1 |
| Operating margin | 14.8% | 14.8% | -0.1 ppt | 24.8% | 24.8% | 0.0 ppt | 31.0% | 31.0% | 0.0 ppt |
| Pretax income | 32,736 | 32,712 | 0.1 | 68,531 | 68,604 | -0.1 | 104,736 | 104,846 | -0.1 |
| Pretax margin | 18.1% | 18.1% | -0.1 ppt | 26.9% | 26.9% | 0.0 ppt | 32.7% | 32.7% | 0.0 ppt |
| Net income | 23,639 | 23,622 | 0.1 | 48,018 | 48,070 | -0.1 | 73,981 | 74,059 | -0.1 |
| Net margin | 13.0% | 13.1% | -0.1 ppt | 18.9% | 18.9% | 0.0 ppt | 23.1% | 23.1% | 0.0 ppt |
| EPS (NT$) | 15.52 | 15.51 | 0.1 | 31.52 | 31.56 | -0.1 | 48.57 | 48.62 | -0.1 |
Source: BofA Global Research estimates
Exhibit 10: BofAe vs consensus - Unimicron
We are 2-14% ahead of consensus for 2026-28E given the assumption of stronger operating leverage
| (NT$mn) | 2026E | 2026E | 2026E | 2027E | 2027E | 2027E | 2028E | 2028E | 2028E |
|---|---|---|---|---|---|---|---|---|---|
| BofAe | Consensus | Diff (%) | BofAe | Consensus | Diff (%) | BofAe | Consensus | Diff (%) | |
| Total sales | 181,361 | 183,139 | -1.0 | 254,419 | 263,824 | -3.6 | 320,669 | 318,007 | 0.8 |
| Gross profit | 41,990 | 41,807 | 0.4 | 79,411 | 81,445 | -2.5 | 117,478 | 111,229 | 5.6 |
| Gross margin | 23.2% | 22.8% | 0.3 ppt | 31.2% | 30.9% | 0.3 ppt | 36.6% | 35.0% | 1.7 ppt |
| Operating profit | 26,819 | 23,032 | 16.4 | 63,164 | 53,609 | 17.8 | 99,369 | 81,046 | 22.6 |
| Operating margin | 14.8% | 12.6% | 2.2 ppt | 24.8% | 20.3% | 4.5 ppt | 31.0% | 25.5% | 5.5 ppt |
| Pretax income | 32,736 | 29,070 | 12.6 | 68,531 | 54,799 | 25.1 | 104,736 | 83,010 | 26.2 |
| Pretax margin | 18.1% | 15.9% | 2.2 ppt | 26.9% | 20.8% | 6.2 ppt | 32.7% | 26.1% | 6.6 ppt |
| Net income | 23,639 | 23,088 | 2.4 | 48,018 | 44,352 | 8.3 | 73,981 | 64,721 | 14.3 |
| Net margin | 13.0% | 12.6% | 0.4 ppt | 18.9% | 16.8% | 2.1 ppt | 23.1% | 20.4% | 2.7 ppt |
| EPS (NT$) | 15.52 | 15.16 | 2.4 | 31.52 | 29.12 | 8.3 | 48.57 | 42.49 | 14.3 |
Source: BofA Global Research estimates, Bloomberg
BofA GLOBAL RESEARCH
BofA GLOBAL RESEARCH
Exhibit 11: Income statement - Unimicron
We expect the company's gross margin to reach 30+%/35+% level in 2027/28
| (NT$mn) | 1Q26 | 2Q26E | 3Q26E | 4Q26E | 1Q27E | 2Q27E | 3Q27E | 4Q27E | 2025 | 2026E | 2027E | 2028E |
|---|---|---|---|---|---|---|---|---|---|---|---|---|
| Revenue | 37,446 | 41,524 | 47,840 | 54,550 | 56,862 | 59,462 | 66,151 | 71,945 | 131,241 | 181,361 | 254,419 | 320,669 |
| COGS | -30,721 | -32,749 | -36,222 | -39,679 | -41,163 | -42,022 | -44,858 | -46,966 | -112,949 | -139,371 | -175,008 | -203,191 |
| Gross Profit | 6,726 | 8,775 | 11,618 | 14,871 | 15,699 | 17,440 | 21,293 | 24,979 | 18,292 | 41,990 | 79,411 | 117,478 |
| Operating | -3,969 | -3,621 | -3,740 | -3,841 | -3,780 | -3,980 | -4,116 | -4,372 | -11,618 | -15,171 | -16,247 | -18,108 |
| expenses | ||||||||||||
| SG&A | -2,547 | -2,133 | -2,198 | -2,265 | -2,251 | -2,380 | -2,458 | -2,599 | -6,619 | -9,143 | -9,688 | -10,640 |
| R&D | -1,422 | -1,488 | -1,542 | -1,576 | -1,529 | -1,600 | -1,657 | -1,773 | -4,999 | -6,028 | -6,559 | -7,469 |
| Operating income | 2,757 | 5,154 | 7,878 | 11,030 | 11,919 | 13,460 | 17,177 | 20,607 | 6,674 | 26,819 | 63,164 | 99,369 |
| Non-operating income | 3,542 | 792 | 792 | 792 | 1,342 | 1,342 | 1,342 | 1,342 | 2,153 | 5,917 | 5,367 | 5,367 |
| Interest income | -327 | -327 | -327 | -327 | -327 | -327 | -327 | -327 | -1,287 | -1,309 | -1,309 | -1,309 |
| Investment | 600 | 150 | 150 | 150 | 150 | 150 | 150 | 150 | -50 | 1,050 | 600 | 600 |
| Others | 3,269 | 969 | 969 | 969 | 1,519 | 1,519 | 1,519 | 1,519 | 3,489 | 6,176 | 6,076 | 6,076 |
| Pre-tax profit | 6,299 | 5,946 | 8,670 | 11,822 | 13,260 | 14,802 | 18,519 | 21,949 | 8,827 | 32,736 | 68,531 | 104,736 |
| Tax | -881 | -1,546 | -1,734 | -2,364 | -2,917 | -3,553 | -3,704 | -4,390 | -1,277 | -6,525 | -14,563 | -21,709 |
| Net income | 5,042 | 4,045 | 6,181 | 8,371 | 9,247 | 10,026 | 13,203 | 15,542 | 6,673 | 23,639 | 48,018 | 73,981 |
| EPS (NT$) | 3.31 | 2.66 | 4.06 | 5.50 | 6.07 | 6.58 | 8.67 | 10.20 | 4.38 | 15.52 | 31.52 | 48.57 |
| Margin | ||||||||||||
| Gross margin | 18.0% | 21.1% | 24.3% | 27.3% | 27.6% | 29.3% | 32.2% | 34.7% | 13.9% | 23.2% | 31.2% | 36.6% |
| Operating margin | 7.4% | 12.4% | 16.5% | 20.2% | 21.0% | 22.6% | 26.0% | 28.6% | 5.1% | 14.8% | 24.8% | 31.0% |
| Pre-tax margin | 16.8% | 14.3% | 18.1% | 21.7% | 23.3% | 24.9% | 28.0% | 30.5% | 6.7% | 18.1% | 26.9% | 32.7% |
| Net margin | 13.5% | 9.7% | 12.9% | 15.3% | 16.3% | 16.9% | 20.0% | 21.6% | 5.1% | 13.0% | 18.9% | 23.1% |
| QoQ growth | ||||||||||||
| Revenue | 7.9% | 10.9% | 15.2% | 14.0% | 4.2% | 4.6% | 11.2% | 8.8% | ||||
| Gross profit | 22.9% | 30.5% | 32.4% | 28.0% | 5.6% | 11.1% | 22.1% | 17.3% | ||||
| Operating profit | 16.5% | 86.9% | 52.8% | 40.0% | 8.1% | 12.9% | 27.6% | 20.0% | ||||
| Pre-tax profit | 51.8% | -5.6% | 45.8% | 36.4% | 12.2% | 11.6% | 25.1% | 18.5% | ||||
| Net profit | 42.7% | -19.8% | 52.8% | 35.4% | 10.5% | 8.4% | 31.7% | 17.7% | ||||
| YoY growth | ||||||||||||
| Revenue | 24.4% | 27.9% | 40.7% | 57.2% | 51.8% | 43.2% | 38.3% | 31.9% | 13.8% | 38.2% | 40.3% | 26.0% |
| Gross profit | 67.1% | 106.7% | 155.4% | 171.8% | 133.4% | 98.7% | 83.3% | 68.0% | 12.1% | 129.6% | 89.1% | 47.9% |
| Operating profit | 117.6% | 241.5% | 414.0% | 366.3% | 332.3% | 161.2% | 118.0% | 86.8% | 30.4% | 301.8% | 135.5% | 57.3% |
| Pre-tax profit | 358.6% | 1566.7% | 194.2% | 184.8% | 110.5% | 148.9% | 113.6% | 85.7% | 20.6% | 270.8% | 109.3% | 52.8% |
| Net profit | 451.3% | 13561.8% | 181.7% | 136.8% | 83.4% | 147.9% | 113.6% | 85.7% | 31.3% | 254.2% | 103.1% | 54.1% |
Source: BofA Global Research estimates, company data
Exhibit 12: Earnings estimate change - NYPCB
We increase GM forecasts by 20-170bps during 2026-28, reflecting the stronger benefits from price hike in substrate business
| (NT$mn) | BofA 26 (E) | BofA 26 (E) | BofA 26 (E) | BofA 27 (E) | BofA 27 (E) | BofA 27 (E) | BofA 28 (E) | BofA 28 (E) | BofA 28 (E) |
|---|---|---|---|---|---|---|---|---|---|
| New | Old | Diff (%) | New | Old | Diff (%) | New | Old | Diff (%) | |
| Total sales | 58,138 | 59,380 | -2.1 | 83,698 | 84,861 | -1.4 | 112,230 | 113,729 | -1.3 |
| Gross profit | 13,379 | 12,628 | 5.9 | 24,573 | 24,732 | -0.6 | 37,917 | 38,113 | -0.5 |
| Gross margin | 23.0% | 21.3% | 1.7 ppt | 29.4% | 29.1% | 0.2 ppt | 33.8% | 33.5% | 0.3 ppt |
| Operating profit | 11,638 | 10,879 | 7.0 | 22,708 | 22,859 | -0.7 | 35,937 | 36,125 | -0.5 |
| Operating margin | 20.0% | 18.3% | 1.7 ppt | 27.1% | 26.9% | 0.2 ppt | 32.0% | 31.8% | 0.3 ppt |
| Pretax income | 12,573 | 11,813 | 6.4 | 24,478 | 24,829 | -1.4 | 37,893 | 38,082 | -0.5 |
| Pretax margin | 21.6% | 19.9% | 1.7 ppt | 29.2% | 29.3% | 0.0 ppt | 33.8% | 33.5% | 0.3 ppt |
| Net income | 10,334 | 9,707 | 6.5 | 20,532 | 21,133 | -2.8 | 31,809 | 31,967 | -0.5 |
| Net margin | 17.8% | 16.3% | 1.4 ppt | 24.5% | 24.9% | -0.4 ppt | 28.3% | 28.1% | 0.2 ppt |
| EPS (NT$) | 15.99 | 15.02 | 6.5 | 31.77 | 32.71 | -2.8 | 49.23 | 49.47 | -0.5 |
Source: BofA Global Research estimates
BofA GLOBAL RESEARCH
BofA GLOBAL RESEARCH
Exhibit 13: BofAe vs consensus - NYPCB
We are 5%/19% lower vs consensus for 2027/28E EPS, given a more conservative assumption on operating leverage
| (NT$mn) | 2026E | 2026E | 2026E | 2027E | 2027E | 2027E | 2028E | 2028E | 2028E |
|---|---|---|---|---|---|---|---|---|---|
| BofAe | Consensus | Diff (%) | BofAe | Consensus | Diff (%) | BofAe | Consensus | Diff (%) | |
| Total sales | 58,138 | 58,158 | 0.0 | 83,698 | 86,913 | -3.7 | 112,230 | 131,198 | -14.5 |
| Gross profit | 13,379 | 11,844 | 13.0 | 24,573 | 25,577 | -3.9 | 37,917 | 40,671 | -6.8 |
| Gross margin | 23.0% | 20.4% | 2.6 ppt | 29.4% | 29.4% | -0.1 ppt | 33.8% | 31.0% | 2.8 ppt |
| Operating profit | 11,638 | 10,770 | 8.1 | 22,708 | 25,808 | -12.0 | 35,937 | 45,199 | -20.5 |
| Operating margin | 20.0% | 18.5% | 1.5 ppt | 27.1% | 29.7% | -2.6 ppt | 32.0% | 34.5% | -2.4 ppt |
| Pretax income | 12,573 | 11,415 | 10.1 | 24,478 | 26,527 | -7.7 | 37,893 | 48,117 | -21.2 |
| Pretax margin | 21.6% | 19.6% | 2.0 ppt | 29.2% | 30.5% | -1.3 ppt | 33.8% | 36.7% | -2.9 ppt |
| Net income | 10,334 | 9,253 | 11.7 | 20,532 | 21,607 | -5.0 | 31,809 | 39,186 | -18.8 |
| Net margin | 17.8% | 15.9% | 1.9 ppt | 24.5% | 24.9% | -0.3 ppt | 28.3% | 29.9% | -1.5 ppt |
| EPS (NT$) | 15.99 | 14.32 | 11.7 | 31.77 | 33.44 | -5.0 | 49.23 | 60.64 | -18.8 |
Source: BofA Global Research estimates, Bloomberg
Exhibit 14: Income statement - NYPCB
We expect the company to record 35+% revenue CAGR during 2026-28
| (NT$mn) | 1Q26 | 2Q26E | 3Q26E | 4Q26E | 1Q27E | 2Q27E | 3Q27E | 4Q27E | 2025 | 2026E | 2027E | 2028E |
|---|---|---|---|---|---|---|---|---|---|---|---|---|
| Revenue | 11,177 | 13,461 | 16,114 | 17,386 | 17,769 | 20,066 | 22,084 | 23,779 | 40,173 | 58,138 | 83,698 | 112,230 |
| COGS | -9,405 | -10,576 | -12,065 | -12,713 | -13,119 | -14,420 | -15,427 | -16,159 | -36,526 | -44,759 | -59,125 | -74,313 |
| Gross Profit | 1,771 | 2,885 | 4,049 | 4,673 | 4,651 | 5,646 | 6,656 | 7,620 | 3,647 | 13,379 | 24,573 | 37,917 |
| Operating expenses | -419 | -419 | -441 | -461 | -447 | -462 | -470 | -487 | -1,665 | -1,740 | -1,865 | -1,980 |
| SG&A | -419 | -419 | -441 | -461 | -447 | -462 | -470 | -487 | -1,665 | -1,740 | -1,865 | -1,980 |
| R&D | 0 | 0 | 0 | 0 | 0 | 0 | 0 | 0 | 0 | 0 | 0 | 0 |
| Operating income | 1,352 | 2,466 | 3,609 | 4,212 | 4,204 | 5,184 | 6,187 | 7,133 | 1,982 | 11,638 | 22,708 | 35,937 |
| Non-operating | 246 | 296 | 196 | 196 | 343 | 542 | 442 | 442 | 363 | 934 | 1,770 | 1,956 |
| income | ||||||||||||
| Interest income | 33 | 32 | 32 | 32 | 29 | 28 | 29 | 29 | 158 | 130 | 115 | 101 |
| Investment income | 12 | 12 | 12 | 12 | 12 | 12 | 12 | 12 | 18 | 48 | 48 | 48 |
| Others | 201 | 252 | 152 | 152 | 302 | 502 | 402 | 402 | 187 | 756 | 1,607 | 1,807 |
| Pre-tax profit | 1,598 | 2,762 | 3,805 | 4,408 | 4,547 | 5,726 | 6,629 | 7,576 | 2,346 | 12,573 | 24,478 | 37,893 |
| Tax | -290 | -552 | -647 | -749 | -682 | -830 | -994 | -1,439 | -399 | -2,239 | -3,946 | -6,084 |
| Net income | 1,308 | 2,209 | 3,158 | 3,659 | 3,865 | 4,896 | 5,635 | 6,136 | 1,947 | 10,334 | 20,532 | 31,809 |
| EPS (NT$) | 2.02 | 3.42 | 4.89 | 5.66 | 5.98 | 7.58 | 8.72 | 9.50 | 3.01 | 15.99 | 31.77 | 49.23 |
| Margin | ||||||||||||
| Gross margin | 15.8% | 21.4% | 25.1% | 26.9% | 26.2% | 28.1% | 30.1% | 32.0% | 9.1% | 23.0% | 29.4% | 33.8% |
| Operating margin | 12.1% | 18.3% | 22.4% | 24.2% | 23.7% | 25.8% | 28.0% | 30.0% | 4.9% | 20.0% | 27.1% | 32.0% |
| Pre-tax margin | 14.3% | 20.5% | 23.6% | 25.4% | 25.6% | 28.5% | 30.0% | 31.9% | 5.8% | 21.6% | 29.2% | 33.8% |
| Net margin | 11.7% | 16.4% | 19.6% | 21.0% | 21.8% | 24.4% | 25.5% | 25.8% | 4.8% | 17.8% | 24.5% | 28.3% |
| QoQ growth | ||||||||||||
| Revenue | 0.1% | 20.4% | 19.7% | 7.9% | 2.2% | 12.9% | 10.1% | 7.7% | ||||
| Gross profit | 26.7% | 62.9% | 40.4% | 15.4% | -0.5% | 21.4% | 17.9% | 14.5% | ||||
| Operating profit | 40.4% | 82.4% | 46.4% | 16.7% | -0.2% | 23.3% | 19.3% | 15.3% | ||||
| Pre-tax profit | 13.4% | 72.8% | 37.8% | 15.8% | 3.2% | 25.9% | 15.8% | 14.3% | ||||
| Net profit | 8.8% | 68.9% | 43.0% | 15.8% | 5.6% | 26.7% | 15.1% | 8.9% | ||||
| YoY growth | ||||||||||||
| Revenue | 32.1% | 40.5% | 46.9% | 55.7% | 59.0% | 49.1% | 37.0% | 36.8% | 24.4% | 44.7% | 44.0% | 34.1% |
| Gross profit | 311.6% | 275.2% | 285.7% | 234.2% | 162.6% | 95.7% | 64.4% | 63.1% | 919.6% | 266.8% | 83.7% | 54.3% |
| Operating profit | 3985.8% | 573.5% | 481.8% | 337.4% | 211.0% | 110.2% | 71.4% | 69.4% | n.a. | 487.1% | 95.1% | 58.3% |
| Pre-tax profit | 523.9% | n.a. | 319.5% | 212.9% | 184.6% | 107.3% | 74.2% | 71.9% | 1338.4% | 436.0% | 94.7% | 54.8% |
| Net profit | 530.4% | n.a. | 335.7% | 204.4% | 195.5% | 121.6% | 78.4% | 67.7% | 855.6% | 430.8% | 98.7% | 54.9% |
Source: BofA Global Research estimates, company data
BofA GLOBAL RESEARCH
BofA GLOBAL RESEARCH
Exhibit 15: Earnings estimate change - Kinsus
We raise 2026-28E EPS by 2-9% after baking in the assumption of stronger revenue growth and gross margin
| (NT$mn) | BofA 26 (E) | BofA 26 (E) | BofA 26 (E) | BofA 27 (E) | BofA 27 (E) | BofA 27 (E) | BofA 28 (E) | BofA 28 (E) | BofA 28 (E) |
|---|---|---|---|---|---|---|---|---|---|
| New | Old | Diff (%) | New | Old | Diff (%) | New | Old | Diff (%) | |
| Total sales | 53,787 | 53,718 | 0.1 | 71,285 | 70,220 | 1.5 | 89,539 | 84,650 | 5.8 |
| Gross profit | 13,802 | 13,068 | 5.6 | 21,628 | 21,164 | 2.2 | 29,623 | 28,110 | 5.4 |
| Gross margin | 25.7% | 24.3% | 1.3 ppt | 30.3% | 30.1% | 0.2 ppt | 33.1% | 33.2% | -0.1 ppt |
| Operating profit | 7,277 | 6,751 | 7.8 | 14,452 | 14,220 | 1.6 | 21,929 | 20,734 | 5.8 |
| Operating margin | 13.5% | 12.6% | 1.0 ppt | 20.3% | 20.3% | 0.0 ppt | 24.5% | 24.5% | 0.0 ppt |
| Pretax income | 7,751 | 7,225 | 7.3 | 14,959 | 14,728 | 1.6 | 22,437 | 21,241 | 5.6 |
| Pretax margin | 14.4% | 13.5% | 1.0 ppt | 21.0% | 21.0% | 0.0 ppt | 25.1% | 25.1% | 0.0 ppt |
| Net income | 5,165 | 4,727 | 9.3 | 11,700 | 11,500 | 1.7 | 17,951 | 16,918 | 6.1 |
| Net margin | 9.6% | 8.8% | 0.8 ppt | 16.4% | 16.4% | 0.0 ppt | 20.0% | 20.0% | 0.1 ppt |
| EPS (NT$) | 9.83 | 9.00 | 9.3 | 22.27 | 21.89 | 1.7 | 34.17 | 32.21 | 6.1 |
Source: BofA Global Research estimates
Exhibit 16: BofAe vs consensus - Kinsus
We are 50-200bps behind consensus for the gross margin estimates across 2026-28
| (NT$mn) | 2026E | 2026E | 2026E | 2027E | 2027E | 2027E | 2028E | 2028E | 2028E |
|---|---|---|---|---|---|---|---|---|---|
| BofAe | Consensus | Diff (%) | BofAe | Consensus | Diff (%) | BofAe | Consensus | Diff (%) | |
| Total sales | 53,787 | 53,687 | 0.2 | 71,285 | 74,021 | -3.7 | 89,539 | 102,138 | -12.3 |
| Gross profit | 13,802 | 14,034 | -1.7 | 21,628 | 23,801 | -9.1 | 29,623 | 35,786 | -17.2 |
| Gross margin | 25.7% | 26.1% | -0.5 ppt | 30.3% | 32.2% | -1.8 ppt | 33.1% | 35.0% | -2.0 ppt |
| Operating profit | 7,277 | 7,077 | 2.8 | 14,452 | 15,004 | -3.7 | 21,929 | 20,791 | 5.5 |
| Operating margin | 13.5% | 13.2% | 0.3 ppt | 20.3% | 20.3% | 0.0 ppt | 24.5% | 20.4% | 4.1 ppt |
| Pretax income | 7,751 | 7,488 | 3.5 | 14,959 | 15,143 | -1.2 | 22,437 | 22,419 | 0.1 |
| Pretax margin | 14.4% | 13.9% | 0.5 ppt | 21.0% | 20.5% | 0.5 ppt | 25.1% | 21.9% | 3.1 ppt |
| Net income | 5,165 | 5,250 | -1.6 | 11,700 | 11,702 | 0.0 | 17,951 | 17,504 | 2.6 |
| Net margin | 9.6% | 9.8% | -0.2 ppt | 16.4% | 15.8% | 0.6 ppt | 20.0% | 17.1% | 2.9 ppt |
| EPS (NT$) | 9.83 | 9.99 | -1.6 | 22.27 | 22.28 | 0.0 | 34.17 | 33.32 | 2.6 |
Source: BofA Global Research estimates, Bloomberg
BofA GLOBAL RESEARCH
BofA GLOBAL RESEARCH
Exhibit 17: Income statement - Kinsus
We expect the firm to record 25-30% revenue CAGR during 2026-28
| (NT$mn) | 1Q26 | 2Q26E | 3Q26E | 4Q26E | 1Q27E | 2Q27E | 3Q27E | 4Q27E | 2025 | 2026E | 2027E | 2028E |
|---|---|---|---|---|---|---|---|---|---|---|---|---|
| Revenue | 11,105 | 12,616 | 14,240 | 15,826 | 15,903 | 17,207 | 18,535 | 19,640 | 39,351 | 53,787 | 71,285 | 89,539 |
| COGS | -8,756 | -9,599 | -10,413 | -11,218 | -11,276 | -12,035 | -12,828 | -13,519 | -31,037 | -39,986 | -49,657 | -59,916 |
| Gross Profit | 2,349 | 3,017 | 3,827 | 4,608 | 4,627 | 5,173 | 5,707 | 6,122 | 8,314 | 13,802 | 21,628 | 29,623 |
| Operating expenses | -1,459 | -1,546 | -1,683 | -1,837 | -1,710 | -1,728 | -1,804 | -1,935 | -5,645 | -6,525 | -7,176 | -7,694 |
| SG&A | -831 | -897 | -948 | -997 | -1,019 | -1,030 | -1,069 | -1,070 | -3,035 | -3,674 | -4,188 | -4,588 |
| R&D | -628 | -649 | -735 | -839 | -690 | -697 | -735 | -865 | -2,610 | -2,851 | -2,988 | -3,106 |
| Operating income | 891 | 1,471 | 2,144 | 2,771 | 2,917 | 3,445 | 3,903 | 4,187 | 2,670 | 7,277 | 14,452 | 21,929 |
| Non-operating income | 73 | 47 | 177 | 177 | 47 | 47 | 207 | 207 | 417 | 474 | 508 | 508 |
| Interest income | -7 | -7 | -7 | -7 | -7 | -7 | -7 | -7 | -4 | -26 | -26 | -26 |
| Investment income | 5 | 5 | 5 | 5 | 5 | 5 | 5 | 5 | 18 | 18 | 18 | 18 |
| Others | 75 | 49 | 179 | 179 | 49 | 49 | 209 | 209 | 404 | 482 | 516 | 516 |
| Pre-tax profit | 964 | 1,518 | 2,321 | 2,948 | 2,964 | 3,492 | 4,110 | 4,394 | 3,087 | 7,751 | 14,959 | 22,437 |
| Tax | -142 | -273 | -371 | -472 | -445 | -559 | -452 | -483 | -370 | -1,258 | -1,939 | -3,063 |
| Net income | 1,118 | 2,366 | 2,222 | 2,808 | 2,871 | 3,306 | 4,985 | 4,215 | 1,596 | 5,165 | 11,700 | 17,951 |
| EPS (NT$) | 1.05 | 1.74 | 3.04 | 4.01 | 4.22 | 4.96 | 6.31 | 6.78 | 3.51 | 9.83 | 22.27 | 34.17 |
| Margin | ||||||||||||
| Gross margin | 21.2% | 23.9% | 26.9% | 29.1% | 29.1% | 30.1% | 30.8% | 31.2% | 21.1% | 25.7% | 30.3% | 33.1% |
| Operating margin | 8.0% | 11.7% | 15.1% | 17.5% | 18.3% | 20.0% | 21.1% | 21.3% | 6.8% | 13.5% | 20.3% | 24.5% |
| Pre-tax margin | 8.7% | 12.0% | 16.3% | 18.6% | 18.6% | 20.3% | 22.2% | 22.4% | 7.8% | 14.4% | 21.0% | 25.1% |
| Net margin | 10.1% | 18.8% | 15.6% | 17.7% | 18.1% | 19.2% | 26.9% | 21.5% | 4.1% | 9.6% | 16.4% | 20.0% |
| QoQ growth | ||||||||||||
| Revenue | 2.7% | 13.6% | 12.9% | 11.1% | 0.5% | 8.2% | 7.7% | 6.0% | ||||
| Gross profit | -1.8% | 28.4% | 26.9% | 20.4% | 0.4% | 11.8% | 10.3% | 7.3% | ||||
| Operating profit | -3.3% | 65.2% | 45.7% | 29.3% | 5.3% | 18.1% | 13.3% | 7.3% | ||||
| Pre-tax profit | -8.7% | 57.5% | 52.9% | 27.0% | 0.5% | 17.8% | 17.7% | 6.9% | ||||
| Net profit | -7.7% | 111.7% | -6.1% | 26.4% | 2.2% | 15.2% | 50.8% | -15.4% | ||||
| YoY growth | ||||||||||||
| Revenue | 28.8% | 31.9% | 37.5% | 46.4% | 43.2% | 36.4% | 30.2% | 24.1% | 28.9% | 36.7% | 32.5% | 25.6% |
| Gross profit | 21.0% | 49.7% | 94.9% | 92.5% | 96.9% | 71.5% | 49.1% | 32.8% | -4.1% | 66.0% | 56.7% | 37.0% |
| Operating profit | 77.7% | 137.3% | 241.4% | 201.0% | 227.5% | 134.2% | 82.0% | 51.1% | 143.7% | 172.6% | 98.6% | 51.7% |
| Pre-tax profit | 37.7% | 145.1% | 225.6% | 179.3% | 207.6% | 130.0% | 77.1% | 49.0% | 92.6% | 151.1% | 93.0% | 50.0% |
| Net profit | -41.0% | 165.7% | 168.0% | 131.8% | 156.9% | 39.7% | 124.3% | 50.1% | 3164.4% | 223.6% | 126.5% | 53.4% |
Source: BofA Global Research estimates, company data
Price objective basis & risk
Ibiden (4062 / IBIDF)
Our PO for Ibiden is ¥ 29,800. The PO is based on a P/E of 50x our FY3/29 estimate, a level well above the historical peak of 34x during previous earnings expansion phases. However, we believe such a premium multiple is justified in the near term, as the share price already appears to be discounting the company's medium-term profit target for FY3/31. We forecast EPS CAGR of 48% over the next five years (excluding one-off factors). Profitability in the CPU package business for a major North American semiconductor maker is also improving, and the earnings trend is becoming increasingly stable. While growth in GPU package substrates remains the core investment theme, we also expect future growth from package substrates for ASIC and the ramp up of the Gama plant for leading-edge substrates. Downside risks to our PO include (1) a largerthan-expected decline in IC package demand due to data center market weakness or contraction in the PC market, and (2) intensified price competition in the GPU package substrate market.
Kinsus (KNSUF)
We set our PO at NT$900 based on 30x 2H27-1H28E P/E, which is at mid-to-high-end level in its historical trading range (8-40x) since 2013. In our view, the multiple is backed by ROE and operating margin recovery to 29% and 22% in 2027-28E.
BofA GLOBAL RESEARCH
Upside risks to our PO are (1) tighter ABF supply, (2) increasing adoption of SiP and AiP, (3) lower competition pressure and (4) slow development of alternative technology.
Downside risks are (1) greater ABF expansion from peers, (2) muted SiP/AiP adoption, (3) more severe competition, and (4) unfavorable technology development.
NYPCB (NANYF)
Our PO of NT$1,200 is based on 30x 2H27-1H28E P/E, which in our view, the multiple backed by ROE and operating margin expansion to 37% and 30% in 2027-28E, as well as a net cash (to equity) position of 21%.
Upside risks to our PO are (1) tighter ABF supply, (2) higher SiP/AiP adoption, and (3) less intensified competition pressure in PCB business.
Downside risks are (1) greater ABF expansion from peers, (2) muted SiP/AiP adoption, and (3) more severe competition in PCB business.
Unimicron (UMCRF)
Our PO of NT$1,400 is based on 33x 2H27-1H28E, which is roughly 1x standard deviation above the historical average of 20x since 2017. In our view, the multiple is appropriate as we expect Unimicron earnings to be supported by its high-end technology offerings, where end market demand seems more resilient.
Upside risks are (1) tighter ABF supply, (2) greater PC and regular server demand, and (3) lower competition pressure.
Downside risks are (1) greater ABF expansion from peers, (2) lower ASP content increase at AI server, and (3) bigger drop in the demand of consumer electronic products.