260717_gs_CCL
PDF 原檔:報告_高盛_CCL產業_20260717_original.pdf
圖片清單(已驗證 2026-07-20)
14 張抽圖全數 ≥14KB,逐張 Read 確認皆為報告內 Exhibit 圖表(非 logo/banner),故全數列入。
| 檔名 | size | 分類 | 親眼所見內容 |
|---|---|---|---|
260717_gs_CCL_001.png |
27KB | 真資料圖 | Exhibit 1:CCL TAM 2018-2028E 堆疊長條圖(依終端應用分類),標註 2025-28E CAGR 53% |
260717_gs_CCL_002.png |
18KB | 真資料圖 | Exhibit 2:CCL 供給 vs 需求 YoY 成長率對照長條圖(2020-2028E),顯示需求持續超過供給 |
260717_gs_CCL_003.png |
40KB | 真資料圖 | Exhibit 3:CCL TAM 依應用別堆疊長條圖 + 高階 CCL 占比折線(2018-2028E),標註 96% 2025-28E CAGR |
260717_gs_CCL_004.png |
55KB | 真資料圖 | Exhibit 4:整體 CCL TAM vs 高階 CCL TAM 長條圖 + 高階占比折線(2018-2028E) |
260717_gs_CCL_005.png |
33KB | 真資料圖 | Exhibit 5:高階 CCL 需求成長 vs 產能擴張 YoY 對照長條圖(2022-2028E) |
260717_gs_CCL_006.png |
44KB | 真資料圖 | Exhibit 6:低階 CCL 需求成長 vs 產能擴張 YoY 對照長條圖(2022-2028E),標題「We continue to see weak demand in low-end CCL market」 |
260717_gs_CCL_007.png |
33KB | 真資料圖 | Exhibit 7:與 Exhibit 5 相同的高階 CCL 需求 vs 產能擴張長條圖(報告內重複引用同圖) |
260717_gs_CCL_008.png |
18KB | 真資料圖 | Exhibit 9:AI server CCL 市場份額堆疊長條圖(EMC/TUC/Others,2025-2028E) |
260717_gs_CCL_009.png |
14KB | 真資料圖 | Exhibit 8:EMC 與 TUC AI 曝險占比長條圖(2025-2028E) |
260717_gs_CCL_010.png |
14KB | 真資料圖 | Exhibit 10:EMC 與 TUC M7+ CCL 曝險占比長條圖(2025-2028E) |
260717_gs_CCL_011.png |
39KB | 真資料圖 | Exhibit 11:各材料/CCL 等級 2026E 漲價幅度散點+長條混合圖(M7+/Low DK/HVLP3+/M6以下/E-glass/RTF銅箔),標註占 COGS 比重 |
260717_gs_CCL_012.png |
88KB | 真資料圖 | Exhibit 12:EMC 與 TUC 毛利率季度趨勢折線圖(1Q20-4Q28E),標題「We believe EMC & TUC will continue to see GM uptrend through 2025-28E」 |
260717_gs_CCL_013.png |
87KB | 真資料圖 | 台燿(6274.TWO)Goldman Sachs 評等與目標價沿革圖(2023-2026),最新目標價 900 |
260717_gs_CCL_014.png |
86KB | 真資料圖 | 台光電(Elite Material, 2383.TW)Goldman Sachs 評等與目標價沿革圖(2023-2026),最新目標價 6,000(本次報告上調前) |
原始內容
For the exclusive use of KEVINLU@LENOVO.COM
TAIWAN CCL
High-end players' pro fi tability uptrend restart, with better pricing and product mix outlook; Buy EMC and TUC with new TP of NT$9,500/2,860
After our update on the 1st round of the high-end CCL pricing hike in April (here), we now expect key AI/high-end CCL players to enjoy a solid GM expansion from 2Q26 (2-4ppt+ QoQ in 2Q26-4Q26), which could further expand in the 2H26, as we believe the product mix improvement (Exhibit 8; we believe more high-end AI projects volume shipment will start from 2H26) and the 2nd round of high-CCL pricing hike will start in 2H26 (we expect M7+ grade CCL pricing will further go up by 10-15% QoQ), without any push-back from customers, as the AI PCB customers generally can pass through the additional cost to end customers.
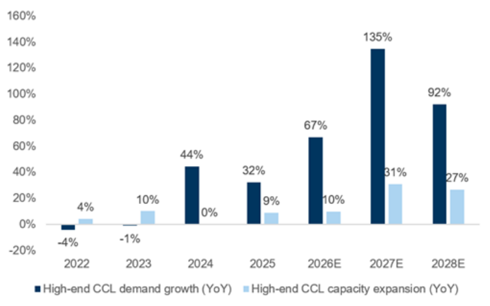
Based on our most recent industry check and our AI CCL industry S/D calculation, we believe the key high-end CCL players could raise pricing by 10-15% in end of 3Q26 or early 4Q26, as we expect not only the high-end/high-quality CCL will continue to be the bottleneck of the AI PCB supply chain (Exhibit 5; high-end CCL demand to go up by 96% 2025-28E CAGR vs. high-end CCL supply to only go up by 22% 2025-28E CAGR), alongside the potential higher cost on HVLP4 copper foil and Low DK 2 glass fi ber (see here / here), with potentially more pricing upside in coming years, as we continue to see AI customers' even stronger demand and eagerness on getting more high-quality CCL supply.
For 2Q26 preview, we expect EMC 2Q26 GM could grow by +4.7ppt QoQ (to 34.1%) while TUC could grow by +4.8ppt QoQ (to 29.9%) , with (1) a much better product mix (we estimate both EMC and TUC raised the M6 and below grade CCL pricing by 40%+ QoQ in 2Q26 to accelerate the product mix improvement process, while TUC also guided that it would stop supplying some low end CCL products started from 2Q26), and (2) the better high-end product pricing (both EMC and TUC raised the M7+ grade CCL pricing by 10-15% from April). We estimate EMC/TUC's 2Q26 OPM to be +2.4ppt/+2.0ppt higher than the street estimate, suggesting a 21%/13% higher than BBG consensus' EPS in 2Q26.
Going into 3Q26, we expect EMC/TUC's GM to grow by +2.4/+2.4ppt QoQ (to 36.5%/32.3%) , thanks to the solid growth from new high-end AI projects (we expect AWS Trainium 3 CCL shipment will grow by 50%+ QoQ, NVDA Vera Rubin CCL mass volume production will start from August, and GOOGL TPU CCL will start the shipment from September), which would lead to GM +3.1/+3.3ppt higher than BBG consensus and EPS 34/21% higher in 3Q26.
Goldman Sachs does and seeks to do business with companies covered in its research reports. As a result, investors should be aware that the fi rm may have a con fl ict of interest that could a ff ect the objectivity of this report. Investors should consider this report as only a single factor in making their investment decision. For Reg AC certi fi cation and other important disclosures, see the Disclosure Appendix, or go to www.gs.com/research/hedge.html. Analysts employed by non-US a ffi liates are not registered/quali fi ed as research analysts with FINRA in the U.S.
Chao Wang
+886(2)2730-4195 | kuanchao.wang@gs.com Goldman Sachs (Asia) L.L.C., Taipei Branch
Allen Chang
+852-2978-2930 | allen.k.chang@gs.com Goldman Sachs (Asia) L.L.C.
Al Wang
+886(2)2730-4081 | al.wang@gs.com Goldman Sachs (Asia) L.L.C., Taipei Branch e92c7a75ab8b4efbba794e6b187208c8
For the exclusive use of KEVINLU@LENOVO.COM
Overall, we raise our TPs for EMC & TUC to NT$9,500/2,860 from NT$6,000/1,888 with 9-13%/12-27% upward earnings revisions in 2027/28. Maintain Buy on EMC & TUC.
High-end CCL demand at 96% 2025-28E CAGR, outpacing overall CCL market
High-end CCL market demand remains strong over 2026-28E, while supply constraints likely to persist
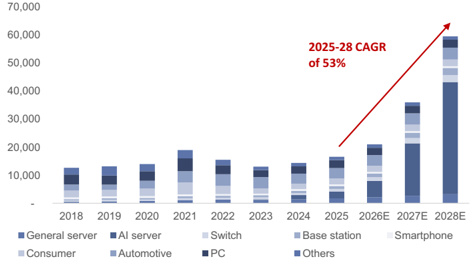
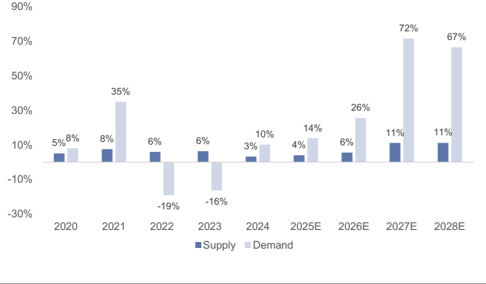
We update our CCL industry model and introduce our 2028E CCL TAM estimates at US$57.0bn, implying 53% 2025-28E CAGR (Exhibit 1; we now expect 2026/27 CCL TAM to reach US$20.0/34.1bn). Within overall CCL TAM, we expect high-end CCL TAM tracking faster at 96% 2025-28E CAGR, outpacing mid-to-low-end CCL TAM at 1% 2025-28E CAGR. The strong high-end CCL demand is mainly driven by (1) AI servers and switches (with 155%/36% 2025-28E CAGR), and (2) general servers (with 23% 2025-28E CAGR). We continue to expect high-end CCL suppliers to operate at full utilization, while high-end capacity expansion going forward is unlikely to ramp up quickly enough (at 16% 2025-28E CAGR) to keep pace with the strong demand. As a result, we expect the high-end CCL market to remain undersupplied throughout 2026-28E (Exhibit 2), supporting better pricing and continued margin expansion for high-end CCL suppliers.
Exhibit 1: We expect the overall CCL market to grow by an 53% 2025-28E CAGR
US$ mn
Source: Company data, Goldman Sachs Global Investment Research
Exhibit 2: We expect the overall CCL market to remain in undersupply in 2026-28E
Source: Company data, Goldman Sachs Global Investment Research
Demand update: increasing CCL dollar content per system from CCL spec upgrade is the key driver for AI CCL demand
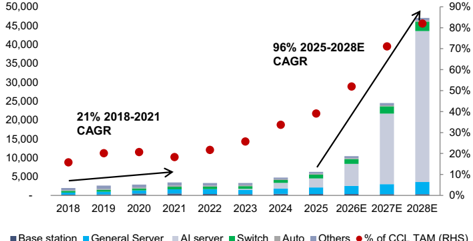
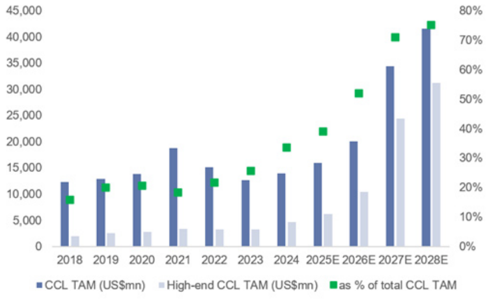
We continue to see strong high-end CCL demand from AI servers, followed by switches and general servers, and we expect the high-end CCL demand to reach 96% 2025-28E CAGR (Exhibit 3), outpacing the 1% 2025-28E CAGR from mid-to-low-end CCL demand. ASP for high-end CCL is generally 2x-8x higher than the mid-to-low-end products, and we estimate this will further accelerate high-end CCL TAM expansion to account for 52%/71%/82% of the global CCL market in 2026/27/28E (Exhibit 4; vs. <40% before and during 2025).
Within the high-end CCL market, we expect AI server CCL demand to grow at a 155%
e92c7a75ab8b4efbba794e6b187208c8
45,000
40,000
35,000
30,000
25,000
20,000
15,000
10,000
5,000
0
• CCL TAM (USSmn) |
For the exclusive use of KEVINLU@LENOVO.COM
80%
70%
60%
2025-28E CAGR, outpacing the rest of the sector and accounting for 70% of total CCL demand by 2028, up from 15% in 2025. Nvidia's CCL demand is the strongest within the AI server segment with 192% 2025-28E CAGR. On top of its stable GPU shipment growth of 14% 2025-28E CAGR, we expect a sharp increase in CCL dollar content per system (we expect VR200 to see 3.5x+ more CCL dollar content vs. GB300), with the sharp increase driven by (1) the migration from M7+ to M8+ grade CCL, with ASP expansion of 50%+, and (2) additional CCL content per system (additional midplane board in VR200).
We expect ASIC CCL demand to grow at 96% 2025-28E CAGR, driven by strong shipment growth (40%+ CAGR over 2025-28E) and CCL spec upgrade that is slightly lagging Nvidia's roadmap. Moreover, we expect switches CCL demand to grow at a 36% 2025-28E CAGR, as strong AI server demand should also boost demand for switches to support higher-speed connectivity.
We expect general server CCL demand to increase at 22% CAGR over 2025-28E, supported by the solid general server shipment (8% 2025-28E CAGR) driven by growing adoption of agentic AI, for which we believe demand could last for another 3-5 years. We also expect CCL dollar content to per system to increase as next gen CPUs (including AMD's Venice and Intel's Oak Stream) will migrate from M6 to M7 grade CCL (80%+ increase in ASP) and the CCL usage per system will see a slight increase (~10% increase due to PCB with higher layer count).
Exhibit 3: We expect the high-end CCL market to continue to outgrow the overall market in the coming years, and reach 50%+ of the total market size in 2026-28E
US$ mn
Base station General Server AI server Switch Auto Others % of CCL TAM (RHS)
2024-28E based on GSe
Source: Company data, Goldman Sachs Global Investment Research
Supply update: high-end CCL supply expansion remains insu ffi cient to meet strong AI demand
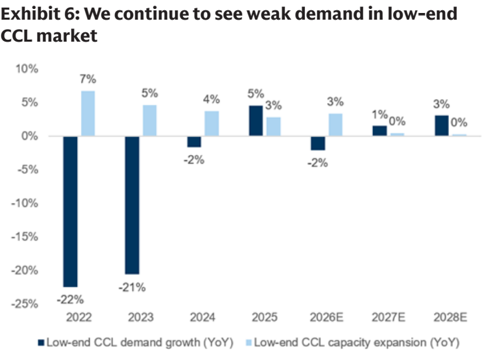
We expect overall CCL supply to grow at a 9% 2025-2028E CAGR, with the expansion primarily focused on the high-end CCL side, which we expected to grow at 22% CAGR over the period (Exhibit 5). High-end suppliers are more proactive with capacity expansion, supported by already full utilization rates and strong AI demand outlook. Meanwhile, we expect low-end CCL capacity to remain largely the same in 2025-28E (Exhibit 6), as utilization rates for low-end CCL are not full yet as it is currently constrained by E-glass shortage and the demand outlook remains weak
Exhibit 4: We expect high-end CCL to account for an increasing share of the total CCL TAM over 2025-28E
Source: Company data, Goldman Sachs Global Investment Research e92c7a75ab8b4efbba794e6b187208c8
supply shortage throughout 4020-405
160%
140%
120%
100%
80%
60%
40%
20%
0%
-20%
For the exclusive use of KEVINLU@LENOVO.COM
4%
-4%
2022
1% 0%
3%
10%.
(consumer-related application accounts for 50%+ of total low-end CCL demand).
-5%
-2%
Despite the solid high-end CCL capacity expansion pace, we believe supply growth will still fall short of the strong demand driven by AI (with 96% 2025-28E CAGR). As a result, we expect the high-end CCL market to remain in undersupply throughout 2026-28E, which would further support better pricing for high-end CCL suppliers in coming quarters/years. -25% -22%
10%
-1%
2023
44%
10%
2024
32%
2025
Exhibit 5: We expect high-end CCL industry will face supply shortage throughout 2026-28E
Source: Company data, Goldman Sachs Global Investment Research
2022
2023
2024
2025
2026E
2027E
2028E
Source: Company data, Goldman Sachs Global Investment Research
High-end CCL pricing is supported by AI demand, more sustainable than cost-driven pricing for low-end CCL
High-end CCL pricing to be supported by strong AI demand, driving revenue and margin expansion for EMC and TUC
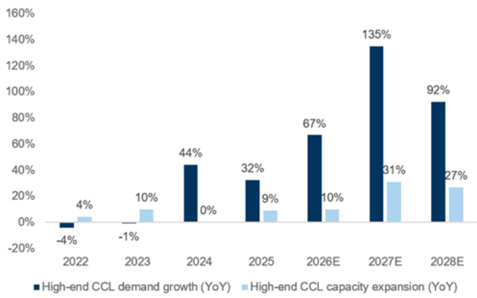
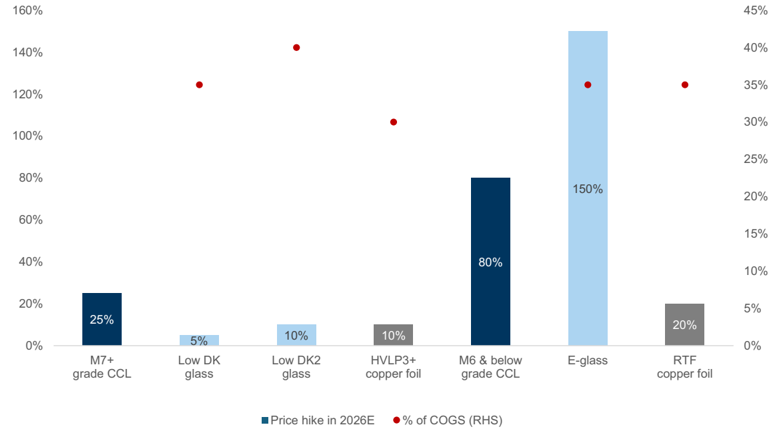
As discussed above, we expect the high-end CCL market to be driven by AI demand, and we expect the seasonality to be limited going forward. We believe the pricing dynamics for high-end CCL will di ff er fundamentally from those of mid-to-low-end CCL. Unlike mid-to-low-end CCL, where price increases are largely driven by rising material costs (including E-glass and RTF copper foil), high-end CCL price increases are likely to be more than raw material cost pass-through, with pricing primarily driven by strong demand amid a supply-constrained environment (Exhibit 7).
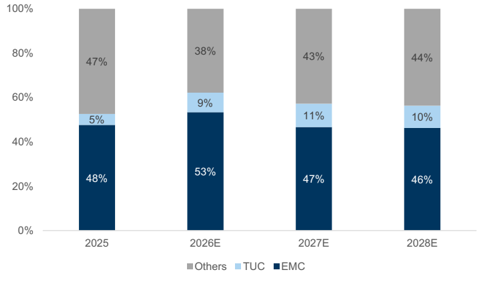
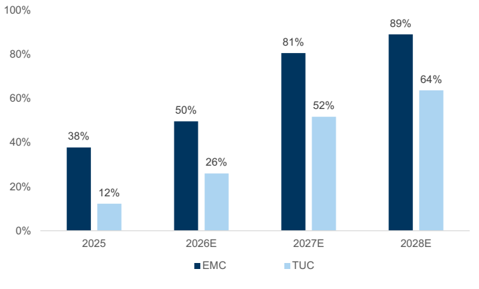
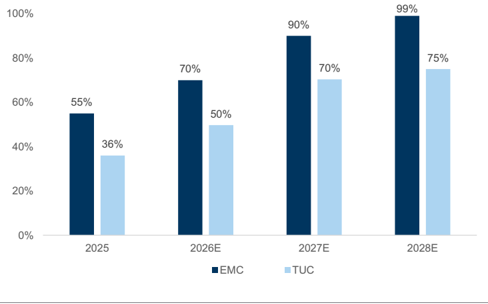
While the AI CCL market continues to expand, we expect AI exposure for both EMC and TUC to continue trending higher through 2026-28 (Exhibit 8). Moreover, we believe M7+ exposure will outpace AI exposure, further supported by rising high-end CCL demand from switches (Exhibit 10). Overall, we expect the two companies to maintain a combined market share of 50%+ in the AI CCL market throughout 2026-28E (Exhibit 9). Strong AI demand should continue to improve the product mix of both companies, coupled with further pricing upside in coming years, and we expect to see a pro fi tability uptrend for EMC & TUC.
135%
CeL markel
10%
7%
5%
5%
4%
5%
3%
e92c7a75ab8b4efbba794e6b187208c8
supply 114049-405
160%
140%
120%
100%
80%
60%
40%
20%
0%
-20%
For the exclusive use of KEVINLU@LENOVO.COM
4%
-
-4%
2022
92%
Exhibit 7: We expect demand to continue to outpace supply in 2025-28E
44%
Source: Company data, Goldman Sachs Global Investment Research
Exhibit 9: AI server CCL market share - EMC and TUC to account for 50%+ market share in coming years
Source: Company data, Goldman Sachs Global Investment Research
Exhibit 8: AI exposure to continue to increase for both EMC and TUC in coming years
Source: Company data, Goldman Sachs Global Investment Research
Exhibit 10: M7+ CCL exposure to continue to increase for both EMC and TUC to meet with strong AI demand
Source: Company data, Goldman Sachs Global Investment Research
Low-end CCL pricing hike likely to decelerate amid weak demand outlook
We saw low-end CCL pricing increase at a faster pace than high-end CCL in 1H26, supported by rising raw material costs and tightening low-end CCL supply (Exhibit 11). Speci fi cally, E-glass prices have surged 80%+ in 1H26 due to supply tightness as suppliers reallocate capacity toward higher-value Low Dk glass, creating a signi fi cant shortage of E-glass. Meanwhile, some CCL suppliers continue to shift production capacity from low-end to high-end products, further tightening low-end CCL supply and supporting price increases.
We expect low-end CCL pricing to continue to increase in 3Q26, driven by ongoing shortages of E-glass and the ongoing tight low-end CCL supply. However, we expect the pace of price increase to decelerate in 4Q26 as the E-glass shortage gradually eases, supported by suppliers shifting capacity back to E-glass production. In addition, demand is likely to soften as consumer electronics demand typically exhibits weak seasonality going into 4Q and 1Q. The demand outlook for low-end CCL is expected to remain weak going forward, as consumer-related applications account for 50%+ of total low-end CCL demand: we expect smartphone to see -10%/3%/1% YoY growth (see here) and PC to see -14%/-5%/0% YoY growth (see here) throughout 2026-28E.
135%
e92c7a75ab8b4efbba794e6b187208c8
For the exclusive use of KEVINLU@LENOVO.COM
Exhibit 11: High-end CCL price increases are supported by strong AI demand, while low-end CCL prices increases are driven by sharp cost in fl ation
Source: Company data, Goldman Sachs Global Investment Research
2Q26 preview & 3Q26 outlook: EMC & TUC start seeing the new round of GM/OPM uptrend
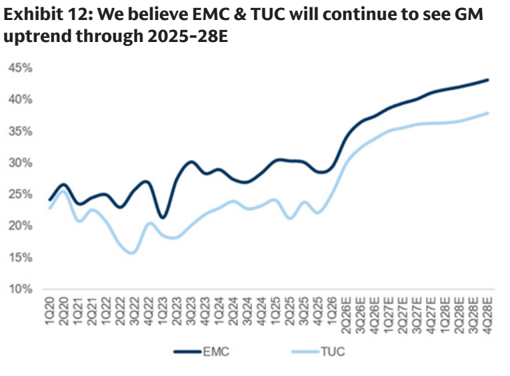
We started to see EMC/TUC's GM expand from ~26%/21% before the AI era (2020-2023 average) to ~29%/23% in 2024 & 2025 average, but the GM expansion started to slowdown from 2H25-1Q26 due mainly to the acceleration in material costs due to shortage issues (here). However, we started to see EMC and TUC raise both high-end and low-end product pricing by 10-15%/40-60% from April, which makes us believe a new round of margin expansion will start from 2Q26 (we expect EMC/TUC's GM will expand from 29.4%/25.1% in 1Q26 to 37.4%/33.8% in 4Q26 (Exhibit 12), which could further expand in 2027/28), as the pricing hike this time is driven by CCL players' increasing importance in the AI supply chain (key bottleneck components', including glass fi ber and copper foil etc., allocations are mostly controlled by high-end CCL players today) as well as customers' eagerness on getting more high-quality CCL products without much pushback on pricing hikes from PCB customers (our check suggests most PCB customers are able to pass through the additional cost to end customers, and are willing to accept pricing hikes if they can get su ffi cient high-quality CCL supply).
For 2Q26, we expect both EMC and TUC will deliver a good pro fi tability growth (EMC 2Q26 GM could grow by +4.7ppt QoQ while TUC could grow by +4.8ppt QoQ), with (1) a much better product mix (we estimate both EMC and TUC raise the M6 and below grade CCL pricing by 40%+ QoQ in 2Q26 to accelerate the product mix improvement process, while TUC also guided that it would stop supplying some low end CCL products started from 2Q26), and (2) the better high-end product pricing (both EMC and TUC raised the M7+ grade CCL pricing by 10-15% from April). We estimate EMC/TUC's 2Q26 OPM to be +2.4ppt/+2.0ppt higher than the street estimate, suggesting a 21%/13% higher than BBG consensus' EPS in 2Q26.
e92c7a75ab8b4efbba794e6b187208c8
%St
NTS mn; GSe
%0}
Sales
%98
Gross Profit
%08
EBIT
Net Income
%9Z
EPS (NT$)
GM (%)
%02
%SL
OPM (%)
%OL
For the exclusive use of KEVINLU@LENOVO.COM
47,275
16,110
12,990
10,132
28.27
34.1%
27.5%
OW]—
EMC
3Q26
56,692
QoQ
20%
2Q26
14,300
TUC
3Q26
17,230
QoQ
20%
Going into 3Q26, we expect EMC/TUC's GM to grow by +2.4/+2.4ppt QoQ, thanks to the solid growth from new high-end AI projects (we expect AWS Trainium 3 CCL shipment will grow by 50%+ QoQ, NVDA Vera Rubin CCL mass volume production will start from August, and GOOGL TPU CCL will start the shipment from September), which would lead GM to be +3.1/+3.3ppt higher than BBG consensus GM and EPS 34/21% higher in 3Q26.
Source: Company data, Goldman Sachs Global Investment Research
Exhibit 13: EMC & TUC 3Q26 vs. 2Q26 earnings estimates, we continue to expect margin expansion
Source: Company data, Goldman Sachs Global Investment Research
e92c7a75ab8b4efbba794e6b187208c8
Canull 14: 4240 a 9240 doe ve bou consensus comp lavre
EMC P&L (NTS mn)
NT$ mn
Sales
Gross Profit
GSe
Sales
Gross Profit
EBIT
Net Income
EPS (NTS)
EBIT
Net Income
Gross margin
Ratio analysis
EPS (NT$)
GM (%)
EBIT margin
OPM (%)
Net margin
BBG consensus
Sales
Gross Profit
EBIT
Net Income
EPS (NT$)
GM (%)
OPM (%)
Differences (GSe vs. BBG)
Sales
Gross Profit
EBIT
Net Income
EPS (NT$)
GM (%)
For the exclusive use of KEVINLU@LENOVO.COM
2026 New
2026 Old
193,449
EMC
47.275
67,613
54.710
TUC
14,300
4,277
2027 New
2027 Old
335,881
305,044
134,357
EMC
27%
56,692
20,665
TUC
17,230
5,569
116,201
3Q26E
121,646
102,879
Exhibit 14: 2Q26 & 3Q26 GSe vs. BBG consensus comp table
35.0%
21.9%
| 10.132 2,651 34.2% | 3.473 42.4% | 3.473 42.4% | ||
|---|---|---|---|---|
| 28.27 9.18 26.5% 0.7pp | 12.03 39.9% 33.7% 0.1pp | 42.2% 36.7% | 0.2pp | |
| 34.1% 29.9% 1.8pp | 32.3% 26.0% | 0.9pp 0.7pp 38.2% 29.4% | 28.3% | 1.5pp 1.1p.p |
| 27.5% 23.9% 20.4% 1.4pp | 26.5% | |||
| EMC TUC | TUC | |||
| 42.314 14,174 | 16,451 | |||
| 13.174 3.950 | 4,782 | |||
| 10,619 3,111 | 3,752 | |||
| 8,284 2,397 | 2,892 | |||
| 23.30 8.13 27.9% | 9.98 | |||
| 32.4% | 29.1% | |||
| 25.1% 21.9% | 22.8% | |||
| EMC TUC | TUC | |||
| 12% 1% | 5% | |||
| 17% 8% | 16% | |||
| 22% 10% | 22% | |||
| 22% 11% | 20% | |||
| 21% 13% 2.0ppt | 21% | |||
| 1.7ppt | 3.3ppt | |||
| 2.4ppt 2.0ppt | 3.7ppt |
28.3%
Source: Company data, Goldman Sachs Global Investment Research
Earnings estimate changes
Earnings revisions EMC
We revise up our 2026/27/28E EPS estimates by 27/13/27% to factor in the higher-than-expected price hike across low-end to high-end CCL. The price hike re fl ects more than cost pass-through and is driven by strong demand, which could not only drive the overall revenue and pro fi tability but also accelerate the product mix improvement. Overall, we revise up 2026/27/28E revenue estimates by 18/10/22% and revise up our GM estimates by 0.7/0.1/0.2ppt to factor in the better than our original expectation pricing conditions in coming years.
Exhibit 15: EMC earnings revision table
Source: Company data, Goldman Sachs Global Investment Research
2Q26E
2028 New e92c7a75ab8b4efbba794e6b187208c8
cxmoll 1/. cMe roL labie camore to. foe earls, revision table
NTSmn
1Q25
Revenue
TUC P&L (NTS mn)
Sales
Gross Profit
Gross profit
Operating expense
Operating income
EBIT
Pretax income wwwwwwwww
Net Income
Taxes expense
Net income
EPS (NTS)
EPS, NT$
Ratio analysis
(2,051)
4,540
4.667
(1,200)
3.469
10.01
Gross margin
Ratio analysis and assumption
As % of sales
EBIT margin
Gross margin
Net margin
Operating expense ratio
Operating margin
Net margin
QoQ growth (%)
Revenue
Gross profit
2Q25
(2,186)
4,644
4,467
(989)
3,478
10.02
30.3%
9.7%
20.6%
15.5%
3.8%
3.6%
3Q25
2026E New
25,146
4Q25
24,927
7,576
61,207
(2,586)
4,990
5,122
(1,157)
3,965
11.19
30.1%
10.3%
19.8%
15.8%
11.7%
30.4%
9.5%
20.9%
16.0%
16.8%
24.8%
7,124
(2,190)
18.998
2026E Old
1Q26
2Q26E
33,067
47,275
9,729
62.252
19,001
16,110
(2,601)
4,935
(3,120)
7,128
TUC
(884)
14,814
12,990
12,990
(1,855)
(2,858)
3Q26E
4Q26E
56,692
Diff.
-2%
2027E New
1Q27E
56,414
20,665
63,454
21,108
118,814
0%
4%
(3,515)
.....
(3,667)
17.150
17,442
17,150
4%
17,442
(3,945)
Diff.
2028E
(23,423)
212,947
12%
212,947
(48,978)
12%
10,787
37.36
38.75
42,526
24,534
(4,156)
20,378
36,915
20,378
(4,687)
26,996
93.50
2027E
3Q27E
78,151
2027E Old
90,726
30,853
115,123
40.195
36,404
(4,416)
(4,718)
26,437
33,960
31,686
26,437
31,686
(6,081)
24,780
85.82
(3,837)
(7,288)
4Q27E
103,550
Diff.
3%
6%
42,566
(4,867)
37.699
9%
37,699
9%
(8,671)
2028E New
2024
2025
64,377
94,261
17,970
195,722.
72,475
28,120
(5,818)
2028E Old
2026E
2027E
193,449
335,881
67,613
187,066
(9,012)
12,152
65,017
19,108
12,133
18,876
(2,564)
(4,231)
67,527
134,357
(12,903)
(18,156)
54,710
58,064
116,201
54,776
116,201
(12,495)
(26,726)
We revise down 2026 revenue estimates by 2% to re fl ect weaker-than-expected shipments due to capacity constraints but revise up our 2027/28E revenue estimates by 3/5% to factor in the higher-than-expected price hike across all grades of CCL and improving product mix, and revise up our 2026/27/28 GM estimate by 0.5/0.9/0.9ppt to factor in the better margin improvement driven by higher pricing. For earnings, we revise up 2026/27/28E net income estimates by 4%/9%/12%. 13.604 15.691 29.029 163.969
10.9%
Operating income
Net income
-6.0%
65.6%
82.2%
36.6%
Exhibit 16: TUC earnings revision table 28.8% 2.3% 7.5% -1.1% 44.5%
YoY growth (%)
Revenue
Gross profit
Operating income
Net income
For the exclusive use of KEVINLU@LENOVO.COM
4%
28.3%
32.0%
30.3%
2.1%
1.7%
3.0%
16.2%
16.8%
15.3%
25.8%
18.0%
29.7%
29.7%
19.9%
19.9%
9%
16.9%
19.0%
19.0%
| 68.0% 45.7% | 52.5% 110.0% 125.5% 126.3% | 52.5% 110.0% 125.5% 126.3% | 91.9% | 65.3% 60.0% 83.6% | 65.3% 60.0% 83.6% | 46% | 105% 74% 66% | 105% 74% 66% |
|---|---|---|---|---|---|---|---|---|
| 76.3% 61.3% | 47.6% 135.9% | 172.8% 196.3% | 152.2% | 91.5% 76.2% | 101.7% | 56% | 140% | 99% 76% |
| 79.0% 75.3% 58.8% | 57.0% 179.7% | 243.7% 253.5% | 185.9% | 103.5% 84.8% | 116.1% | 57% | 186% | 112% 83% |
| 42.8% | 53.9% 191.3% | 233.0% 264.1% | 193.8% | 100.9% 84.8% | 113.4% | 53% | 189% | 112% 83% |
Source: Company data, Goldman Sachs Global Investment Research
Valuation EMC
Maintain Buy on EMC, with a new TP of NT$9,500 from NT$6,000, based on the same 27x P/E (in line with the peak P/E multiple for AI component suppliers in past 3 years) but we rollover our valuation period from 2027 to 2H27-1H28, and factoring in our earnings revisions.
43,495
150.64
48,710
168.70
12%
Exhibit 17: EMC P&L table
Source: Company data, Goldman Sachs Global Investment Research
TUC
We maintain Buy on TUC, with new TP of NT$2,860 from NT$1,888, which is based on an unchanged 22x on 2H27-1H28E P/E (rolled over from 2027E), which is +2x STDV higher than the past 3-year industry average P/E multiple, and factoring in our earnings e92c7a75ab8b4efbba794e6b187208c8
Calvil lo. lUcraL lavic
NT$mn
1Q25
Revenue
Gross profit
Operating expense
Operating income
Pretax income
Taxes expense
Net income
2Q25
(583)
853
840
(188)
2Q26E
14.300
4,277
(858)
1Q26
10,054
2,529
(701)
4Q25
9,125
2,015
(725)
1,290
1,828
3,419
revisions.
(344)
(597)
936
935
(263)
3Q25
8,063
1,915
(649)
1,266
1,318
(315)
672
1,003
652
EPS, NTS
(614)
1,082
Exhibit 18: TUC P&L table
Ratio analysis and assumption
As % of sales
Gross margin
Operating expense ratio
Operating margin
Net margin
QoQ growth (%)
Revenue
Gross profit
3Q26E
17.230
5,569
(999)
4.569
4.569
(1,097))
3,473
12.03
(748)
2,651
9.18
3.76
1,260
4.36
4Q26E
19,623
6,624
(1,099)
5,525
5,005
(1,201))
3,804
13.17
1Q27E
21,530
7,533
(1,173)
6,360
5,840
(1,460)
4,380
15.17
2Q27E
25,320
8,990
(1,355)
7,635
7,235
(1,809)
5,426
18.79
4Q27E
38,825
14.060
(1,592)
12.468
12,468
(3,117)
9.351
32.39
2024
23,070
5,342
(2,010)
3,332
3,378
(773)
2.604
9.56
2025
30,340
6.898
(2,554)
4,344
4,519
(1,109)
3,409
12.13
2026E
61,207
18,998
(3,657)
15,340
14.847
(3,659)
11,187
38.75
2027E
118,814
42,526
(5,611)
36,915
35,995
(8,999)
26,996
93.50
2028E
195,722
(7,458)
65,017
64,946
(16,237)
48,710
168.70
| 24.1% | 21.2% 23.7% | 22.1% 25.1% | 29.9% | 32.3% | 33.8% | 35.0% | 35.5% | 36.2% | 23.2% | 22.7% 31.0% | 35.8% | 37.0% | ||
|---|---|---|---|---|---|---|---|---|---|---|---|---|---|---|
| 9.4% | 8.6% 8.1% | 7.9% 7.0% | 6.0% | 5.8% | 5.6% 5.5% | 5.4% | 4.1% | 8.7% | 8.4% | 6.0% | 4.7% | 3.8% | ||
| 14.7% | 12.6% 15.7% | 14.1% 18.2% | 23.9% | 26.5% | 28.2% | 29.5% | 30.2% | 39161 | 32.1% | 14.4% | 14.3% 25.1% | 31.1% | 33.2% | |
| 10.6% | 9.6% 12.4% | 11.9% 12.5% | 18.5% | 20.2% | 19.4% | 20.3% | 21.4% | 24.1% | 11.3% | 11.2% 18.3% | 22.7% | 24.9% | ||
| 1.0% | 6.4% 18.9% | 13.2% 10.2% | 42.2% | 20.5% | 13.9% | 9.7% | 17.6% | 30.9% | 17.2% | |||||
| 4.7% | -6.4% 33 4% | 5.2% 25.5% | 69.2% | 30.2% | 18.9% | 13.7% | 19.3% | 32.9% | 17.7% |
Operating income
Net income
Yor growth (%)
Revenue
Gross profit
Operating income
Net income
For the exclusive use of KEVINLU@LENOVO.COM
| -4.6% -3.1% 53.8% 8.0% 16.4% 110.4% 31.0% 9.5% 15.2% 23.9% 44.5% 19.3% | -4.6% -3.1% 53.8% 8.0% 16.4% 110.4% 31.0% 9.5% 15.2% 23.9% 44.5% 19.3% | -4.6% -3.1% 53.8% 8.0% 16.4% 110.4% 31.0% 9.5% 15.2% 23.9% 44.5% 19.3% | -4.6% -3.1% 53.8% 8.0% 16.4% 110.4% 31.0% 9.5% 15.2% 23.9% 44.5% 19.3% | -4.6% -3.1% 53.8% 8.0% 16.4% 110.4% 31.0% 9.5% 15.2% 23.9% 44.5% 19.3% | -4.6% -3.1% 53.8% 8.0% 16.4% 110.4% 31.0% 9.5% 15.2% 23.9% 44.5% 19.3% | -4.6% -3.1% 53.8% 8.0% 16.4% 110.4% 31.0% 9.5% 15.2% 23.9% 44.5% 19.3% | -4.6% -3.1% 53.8% 8.0% 16.4% 110.4% 31.0% 9.5% 15.2% 23.9% 44.5% 19.3% | -4.6% -3.1% 53.8% 8.0% 16.4% 110.4% 31.0% 9.5% 15.2% 23.9% 44.5% 19.3% | -4.6% -3.1% 53.8% 8.0% 16.4% 110.4% 31.0% 9.5% 15.2% 23.9% 44.5% 19.3% | -4.6% -3.1% 53.8% 8.0% 16.4% 110.4% 31.0% 9.5% 15.2% 23.9% 44.5% 19.3% | -4.6% -3.1% 53.8% 8.0% 16.4% 110.4% 31.0% 9.5% 15.2% 23.9% 44.5% 19.3% | -4.6% -3.1% 53.8% 8.0% 16.4% 110.4% 31.0% 9.5% 15.2% 23.9% 44.5% 19.3% | -4.6% -3.1% 53.8% 8.0% 16.4% 110.4% 31.0% 9.5% 15.2% 23.9% 44.5% 19.3% | -4.6% -3.1% 53.8% 8.0% 16.4% 110.4% 31.0% 9.5% 15.2% 23.9% 44.5% 19.3% | -4.6% -3.1% 53.8% 8.0% 16.4% 110.4% 31.0% 9.5% 15.2% 23.9% 44.5% 19.3% | -4.6% -3.1% 53.8% 8.0% 16.4% 110.4% 31.0% 9.5% 15.2% 23.9% 44.5% 19.3% | -4.6% -3.1% 53.8% 8.0% 16.4% 110.4% 31.0% 9.5% 15.2% 23.9% 44.5% 19.3% |
|---|---|---|---|---|---|---|---|---|---|---|---|---|---|---|---|---|---|
| 43.7% | 18.9% 21.8% | 44.6% | 57.8% | 110.9% | 113.7% | 115.1% | 114.1% | 77.1% | 92.3% | 97.9% | 44% | 32% 102% | 94% | 65% | |||
| 51.5% 5.3% | 27.4% | 37.7% | 64.9% | 198.0% | 190.8% | 228.8% | 197.9% | 110.2% | 114.5% | 112.3% | 69% | 29% 175% | 124% | 70% | |||
| 65.8% | -1 6% 30.6% | 38.4% | 95.3% | 301.0% | 261.1% | 328.4% | 248 0% | 123.3% | 125.7% | 134% | 30% 253% | 141% | 76% | ||||
| 48.8% | -6.0% 33.0% | 53.6% | 87.4% | 306.8% | 246.4% | 251.4% | 247.6% | 104.7% | 12872 | 145.8% | 216% | 31% | 228% | 141% | 80% |
Source: Company data, Goldman Sachs Global Investment Research
Investment Thesis & PT methodology and risks
EMC, a key supplier of high-end HDI material (70%+ market share) and SLP material (90%+ market share), has been focusing on the high-speed switch/server CCL market for 3-5+ years. We are positive on its market share trajectory in the server industry and expect EMC to increase its share from <10% in the Purley generation to 15-20%/20+% in the Whitley/Eagle Stream platforms. EMC is also proactively expanding its share in the switch market (40%/30%+ in 2024/23 vs. <5% before 2019), with an expanding AI customer base (only one 400G customer in 3Q20, to being one of the largest suppliers in 2023), which should continue to bene fi t the company's top/bottom line growth over time. We believe EMC's leading position in the AI server CCL market should drive strong revenue growth and GM/OPM expansion in the long term, given that it is the major supplier for all Nvidia/Google/AWS AI server projects, and we expect it to maintain its leadership position. Considering its leading position in the high-end CCL industry, solid production skills and earnings growth outlook, we are Buy rated on the stock. With the shares trading at a 2026E P/E below AI server component suppliers and supported by a solid growth outlook, we view valuation as attractive.
Key downside risks include: (1) RCC to replace all high-end smartphone HDI design; (2) rising trade tensions, which could lead to weaker smartphone and server shipments; and (3) rising competition from mainland China peers.
Valuation methodology: Our 12m TP of NT$9,500 is based on 27x 2H27-1H28E P/E (in line with the peak P/E multiple for AI component suppliers in the past 3 years).
Key downside risks: (1) RCC to replace all high-end smartphone HDI design; (2) rising trade tensions, which could lead to weaker smartphone and server shipments; and (3)
0.4%
-8.9%
48.4%
1.9%
41.7%
87.1%
33.6%
20.9%
15.1%
20.0%
36.9%
19.3%
e92c7a75ab8b4efbba794e6b187208c8
For the exclusive use of KEVINLU@LENOVO.COM
rising competition from mainland China peers.
TUC is a key high-end global CCL supplier that focuses on M7+ grade high-speed CCL (key applications include high-end switches (100G+) and AI server materials), with 20%+ market share in the past two years. The company continues to expect its unit market share in the server industry to increase from 15% in Whitley and Purley processors to higher in the Eagle Stream generation, and plans to launch two types of p roducts for low-end and high-end customers (T2A and T2C) to gain market share. Also, strong growth in 400G/800G switch shipments and new 800G switch shipments, scheduled for launch in 2025-27, should continue to be a key demand driver for TUC, in our view. Additionally, the company is working on high-end AI projects with CSP and enterprise players, which we believe should drive revenue momentum in the long term. We view the stock as undervalued vs. Taiwan CCL peers on a P/E basis and rate it Buy.
Key downside risks include: (1) slower-than-expected share gains in the low-loss CCL segment; (2) rising trade tensions, which could lead to weaker server and switch shipments globally; and (3) rising competition from mainland China peers.
Valuation methodology: Our 12m TP of NT$2,860 is based on a 22x 2027E P/E (+2x STDV higher than the past 3-year industry average P/E multiple).
Key downside risks: (1) slower-than-expected share gains in the low-loss CCL segment; (2) rising trade tensions, which could lead to weaker server and switch shipments globally; and (3) rising competition from mainland China peers.
e92c7a75ab8b4efbba794e6b187208c8
For the exclusive use of KEVINLU@LENOVO.COM