PDF 原檔:報告_廣發香港_欣興3037_Initiation_20261026_original.pdf
圖片清單(已驗證 2026-10-27)
依 ingest_steps Step 2.5 建立;<40KB 者(封面評等卡、各市場/供需預測圖等)預設小圖,未逐張列。
| 檔名 | size | 分類 | 親眼所見內容 |
|---|---|---|---|
報告_廣發香港_欣興3037_Initiation_20261026_002.png |
80KB | 真資料圖 | 折線圖:2010/3/1 至 2026/3/1 季度「Total Operating Income」(淺紫)與「Total Capex」(深藍)走勢,兩軸 -200~1200 與 0~1200;2022 年底 capex 達高峰約 1,100 以上,2026 年營業利益升至約 800。屬財務/產業週期圖,不嵌 lib |
報告_廣發香港_欣興3037_Initiation_20261026_008.png |
558KB | 真資料圖 | Ibiden 簡報頁「Capital Investments for the growth of the electronics business」:總投資 JPY 500 billion;Gama Plant(Cell6)投資約 JPY 220 billion、FY2027 起陸續開始運轉並量產、產品為 AI ASIC 用高性能 IC 載板;Ono Plant(Cell8)投資約 JPY 280 billion(Cell8 的 1/2)、FY2027 起陸續開始運轉並量產、產品為 AI GPU 用高性能 IC 載板;兩廠鳥瞰照各標示 Cell6/Cell8 與 Prospective site。可嵌 Ibiden 頁 |
報告_廣發香港_欣興3037_Initiation_20261026_011.png |
45KB | 真資料圖 | 長條圖:PC DDR4/DDR5、Server DDR4/DDR5、Blended Server/PC/industry ASP 之 QoQ 價格預測(1Q24–4Q27F),1Q26 單季約 +80~110%,2Q26 約 +40~70%,3Q26E 起降至約 +15%,2027 年約 +5~12%。屬記憶體價格圖,不嵌 |
報告_廣發香港_欣興3037_Initiation_20261026_014.png |
257KB | 文字卡 | 欣興公司沿革時間軸:1990 Formation(Taoyuan 重組更名 Unimicron)、1998 OTC listing、1999 South China entry(收購香港 Plato Electronics)、2001 Substrate scale-up(整合 QunCe 與 Hengye)、2002 TWSE listing、2009 Global expansion(投資德國 RUWEL、併 PPT)、2016–21 ESG recognition、2023 Subtron merger、2024 Overseas footprint(泰國廠封頂、蘇州群策 A 股上市規劃)、2024–26 AI substrate upgrade。屬沿革文字卡,不嵌 |
報告_廣發香港_欣興3037_Initiation_20261026_017.png |
43KB | 真資料圖 | 折線圖:欣興 Forward P/E(2021/1/4–2026 年底),AI 行情前(2023 起算)平均約 17x、AI 後平均約 33x,2023 年高點約 60x、2025 年中低點約 8x,2026 年回升至約 45–48x。屬股價評價圖,不嵌 |
原始內容
Unimicron (3037 TT)
77% EPS CAGR Amid AI ABF Supercycle
Initiate with Buy, TP of NT$1,820: We initiate Unimicron with a Buy on the back of: 1) rapid expansion of the AI ABF substrate market, with TAM of US$13bn/US$18bn in 2027E/28E, driven by sustained price hike momentum, and Unimicron is poised to capture >30% share; 2) aggressive high-end ABF capacity expansion to capitalize demand; 3) improving product mix across ABF, BT, and PCB to optimize margins. We forecast revenue of NT$191bn/303bn/402bn and EPS of NT$28.6/60.8/89.3 in 2026E/27E/28E, respectively (vs. consensus of NT$25/55/80). Our target price of NT$1820 is based on 30x 2027E P/E.
Robust ABF market expansion with supply tightness to persist into 2029: We forecast the global AI ABF substrate market to reach US$13bn/$18bn in 2027E/28E, +100/41% YoY. Our AI accelerator model suggests strong volume growth, while server CPU shipments are expected grow at 49% CAGR over 2026E-30E. Beyond volume growth, spec upgrades toward more layer counts and larger substrate sizes are driving content value (e.g. up ~100% from Blackwell to Rubin, ~50% from TPU v7 to v8). Meanwhile, long equipment lead times and shortages of ABF film and T-glass are likely to constrain supply well into 2029. We estimate the supply shortage will reach 18%/16% in 2027E/28E.
Aggressive Capacity Expansion to Capture AI Demand: We expect Unimicron's ABF capacity to grow by 18%/35% in 2026E/2027E, driving ABF revenue growth of 66%/90% YoY to NT$105bn/199bn. Guangfu Plant 1 Phase 3 commenced production in 3Q26, while incremental capacity at Guangfu Plant 2, Yangmei Plant 2, and Yangmei Plant 3 is expected to come online in 2Q27, 2028, and end-28, respectively. Most of this incremental capacity has already been booked, providing strong revenue visibility as AI demand scales.
Product Mix Optimization to Drive Margin Expansion: Unimicron is shifting its portfolio to improve profitability: 1) ABF: it is increasing the mix of high-end products with >50% GPM; 2) BT: reducing capacity by ~15% YoY by end-26 and reallocating resources toward higher-value smartphone LPDDR and ABF substrates. 3) PCB: upgrading existing capacity toward mSAP production, with mSAP capacity expected to grow 50%/40% YoY in 2026E/27E. We believe these initiatives will structurally improve its product mix and lift GPM. Overall, we forecast its GPM to be 28.8%/41.7%/44.6% in 2026E/27E/28E.
Risks: 1) AI demand deceleration; 2) Geo-political uncertainties; 3) Competition.
Profit forecast
| (mn TWD) | FY2024 | FY2025 | FY2026E | FY2027E | FY2028E |
|---|---|---|---|---|---|
| Revenue | 115,373 | 131,241 | 191,157 | 303,369 | 402,242 |
| Revenue YoY (%) | 10.9% | 13.8% | 45.7% | 58.7% | 32.6% |
| Net profit | 5,082 | 6,673 | 43,932 | 94,280 | 138,669 |
| Net profit YoY (%) | -57.6% | 31.3% | 558.4% | 114.6% | 47.1% |
| EPS ($) | 3.30 | 4.37 | 28.58 | 60.75 | 89.34 |
| P/E | 332.9 | 252.0 | 38.5 | 18.1 | 12.3 |
| ROE (%) | 5.1% | 6.2% | 18.9% | 22.0% | 20.6% |
Source: Company data, GF Securities (Hong Kong) Brokerage.
Please be sure to read the disclosures at the end of this report carefully.
数据来源:公司财务报表,广发证券发展研究中心
Michelle Jing
SFC CE No. BUK594 michellejing@gfgroup.com.hk
Jeff Pu, CFA SFC CE No. BNO719 jeffpu@gfgroup.com.hk
Table of Contents
| IC Substrate: ABF Leading the Upcycle ................................................................................................................................ | IC Substrate: ABF Leading the Upcycle ................................................................................................................................ |
|---|---|
| 3 ABF Substrate Cycle Overview: From a downturn to a new AI-driven upcycle ................................................................. 4 | |
| ABF Substrate Demand: Structural Shift Toward AI .......................................................................................................... 6 | |
| GPU and ASIC: Rising Substrate Content and Manufacturing Intensity ................................................................... 6 | |
| Server CPU: Rising Layer Counts and Volume Upside ............................................................................................ 7 | |
| AI ABF Substrate TAM to Double in 2027 ................................................................................................................ 9 | |
| ABF Substrate Supply: Near-Term Capacity Expansion Remains Constrained ............................................................. 10 | ABF Substrate Supply: Near-Term Capacity Expansion Remains Constrained ............................................................. 10 |
| ABF film: Ajinomoto's Dominance Limits Supply Flexibility ..................................................................................... 10 | |
| T-glass: Tight Supply Likely to Persist Through 2027 ............................................................................................. 10 | |
| Ibiden: JPY500bn Three-Year Capex Plan, with Ono and Gama as Key Expansion Hubs .................................... 12 | |
| Unimicron: Significant Capex Increase to Drive Continued High-End ABF Expansion .......................................... 13 | |
| Nan Ya PCB: the Next Expansion Cycle Starting in 2028 ...................................................................................... 14 | |
| Kinsus: Three Consecutive Years of Higher Capex, ABF Capacity Set to Grow 25-30% YoY .............................. 14 | |
| 18% ABF Substrate Supply Deficit in 2027E:Tight Supply to Drive Earnings Growth at Leaders, with Spillover | 18% ABF Substrate Supply Deficit in 2027E:Tight Supply to Drive Earnings Growth at Leaders, with Spillover |
| Opportunities for Tier-2 Players ....................................................................................................................................... 15 | |
| BT Substrate: Memory Demand Supports a Tighter Supply-Demand Balance ............................................................... 17 | BT Substrate: Memory Demand Supports a Tighter Supply-Demand Balance ............................................................... 17 |
| BT Substrate Demand: Memory Remains the Primary Growth Driver ............................................................................ 17 | |
| BT Substrate Supply:Limited Capacity Expansion by Leaders Creates Opportunities for Second-Tier Suppliers ....... 20 | BT Substrate Supply:Limited Capacity Expansion by Leaders Creates Opportunities for Second-Tier Suppliers ....... 20 |
| Company Overview ................................................................................................................................................................ 21 | Company Overview ................................................................................................................................................................ 21 |
| Business Segment ........................................................................................................................................................... 21 | |
| 2026 Capex of NT$53.7bn to Drive High-End ABF Capacity Expansion ........................................................................ 23 | 2026 Capex of NT$53.7bn to Drive High-End ABF Capacity Expansion ........................................................................ 23 |
| Earnings Review ..................................................................................................................................................................... 24 2Q26 results review ......................................................................................................................................................... | |
| 24 | |
| We forecast revenue of NT$191bn/303bn/402bn in 2026/2027/2028 ............................................................................. 24 Valuation and Recommendation .......................................................................................................................................... 25 | We forecast revenue of NT$191bn/303bn/402bn in 2026/2027/2028 ............................................................................. 24 Valuation and Recommendation .......................................................................................................................................... 25 |
| Initiate with Buy with TP of NT$1,820 .............................................................................................................................. 26 |
IC Substrate: ABF Leading the Upcycle
IC substrates, also known as package substrates, are critical materials in semiconductor packaging, serving as the interface between dies and PCB. Their primary functions include die support, electrical interconnection, heat dissipation, and physical protection. Specifically, IC substrates route dense, micron-pitch I/O connections at the die level to solder balls, enabling signal transmission, power delivery, and thermal management between the chip and the system board. By substrate material, IC substrates are primarily classified into ABF substrates, BT substrates, and other types, including ceramic substrates. By package type, IC substrates can be broadly categorized into the following segments:
- l FC-BGA: With large package sizes, high I/O counts, and high layer counts, FC-BGA is the standard packaging solution for HPC chips, including AI accelerators, GPUs, and CPUs. These packages predominantly use ABF substrates.
- l FC-CSP: Primarily used in mid- to high-end DRAM, mobile and tablet application processors (APs), baseband, and RF chips. These packages predominantly use BT substrates.
- l WB-CSP/PBGA: Primarily used in NAND flash and other memory chips, as well as cost-sensitive applications like MCUs, power PMICs, RF modules, and communications chips. BT substrates are commonly used.
Figure 1: ABF & BT Substrate Comparison
| Comparison | ABF Substrate | BT Substrate |
|---|---|---|
| Core Material | Ajinomoto Build-up Film (ABF) | BT (bismaleimide triazine) resin |
| Layer | Typically 8-14 layers; 20+ for advanced applications | Typically 2-8 layers; 10+ for select high-end designs |
| Line / Space | Below 20 µm; ≤10 µm with advanced processes | Typically 30-40 µm; down to 25 µm with advanced SAP |
| Electrical Properties | Dk ~3.4 and low Df; better for high-speed/high- frequency signals | Dk ~4.3-4.8; suitable for moderate- to high-speed uses |
| Mechanical | Lower CTE and better silicon-chip compatibility; warpage control is challenging at high layer counts | Strong mechanical integrity, heat/moisture resistance and dimensional stability |
| Typical Dimensions | ~25×25 mm; AI/HPC may exceed 110×120 mm | ~15×15 to 55×55 mm |
| Packaging | FC-BGA; CPUs, GPUs, AI ASICs, FPGAs, servers/HPC | CSP, PBGA; memory, mobile SoCs, RF and IoT |
| Cost / Lead Time | Higher material/process costs; longer prototyping and qualification cycles | Lower relative cost, mature processes and more flexible lead times |
| Key Takeaway | High density, high performance and high value- add | Mature, stable, cost-effective and widely used |
| Core Material Suppliers | Ajinomoto holds over 90% of the global market share, resulting in a highly concentrated supply base | Multiple suppliers, including Mitsubishi Gas Chemical, Sumitomo, Doosan, and LG, compete in a more diversified and flexible market |
| Substrate Suppliers | Ibiden, Unimicron, Nanya PCB, Kinsus, SEMCO, AT&S | SEMCO, LG Innotek, Kinsus, Unimicron, Nanya PCB, SCC, Fastprint |
Sources: Company data, GF Securities (Hong Kong) Brokerage
ABF Substrate Cycle Overview: From a downturn to a new AI-driven upcycle
The ABF substrate industry experienced a prolonged downturn from 2011 to 2017, as the rise of smartphones and tablets weighed on the TAM for PCs. Amid weak demand and persistent oversupply, substrate manufacturers struggled to remain profitable and competed aggressively on price to utilize idle capacity. Consequently, capacity expansion was minimal, with leading ABF substrate suppliers keeping capex at depressed levels.
From 2020, a recovery in general server demand lifted ABF substrate UTRs. However, given continued caution over the industry's long-term growth outlook, substrate makers remained disciplined in their capital spending.
The COVID-19 pandemic subsequently accelerated demand for work-from-home applications, online
entertainment, and consumer electronics, including PCs, driving a recovery in ABF substrate demand. This demand rebound, coupled with limited capacity additions in the preceding years, resulted in supply shortages and price increases. Substrate makers responded by initiating multiple capacity expansion projects, with industry annual capex rising from US$2.1bn in 2020 to US$3.8bn in 2022.
Following the pandemic, capex remained elevated in the near term, reaching US$2.9bn in 2024. However, as pandemic-driven demand normalized, consumer electronics demand weakened significantly, pushing the ABF substrate market back into oversupply and triggering another downturn that lasted approximately two years.
AI is driving the next upcycle starting 2025, with a structurally different demand profile: As AI demand accelerates and AI server deployments ramp up, ABF substrate demand has returned to an upcycle since 2025. Unlike previous cycles driven primarily by PC and general server unit volumes, this cycle is increasingly driven by the combination of higher AI accelerator volumes, greater substrate content per chip, and rising manufacturing complexity.
Figure 2: Capex and Operating Income of Major Substrate Manufacturers (Million USD)
Sources: Prismark, GF Securities (Hong Kong) Brokerage
Please be sure to read the disclosures at the end of this report carefully.
Figure 3: Substrate Sales Value and Volume Overview
Sources: Prismark, GF Securities (Hong Kong) Brokerage
Figure 4: Package Substrate Market
Sources: Prismark, GF Securities (Hong Kong) Brokerage
ABF Substrate Demand: Structural Shift Toward AI
Back in 2015, PCs accounted for the largest share of global ABF substrate demand, representing ~70% of total market value, primarily driven by demand for PC CPUs and GPUs. This mix has shifted significantly: by 2025, PCs accounted for only 33% of ABF substrate demand, while AI GPUs, ASICs, and server CPUs collectively contributed ~46%. We expect this structural shift to continue, with the PC share declining further to 11% by 2028, while AI-related applications are projected to account for ~80% of total ABF substrate demand.
Figure 5: Our ABF Substrate Demand Forecast by End Applications (mn USD)
Sources: GF Securities (Hong Kong) Brokerage
GPU and ASIC: Rising Substrate Content and Manufacturing Intensity
AI accelerator demand does not translate into ABF substrate consumption on a one-for-one basis with chip shipments alone. As GPU and ASIC package body sizes increase and substrate layer counts rise, the SAP (semi-additive process) manufacturing capacity required per chip increases disproportionately. According to Ibiden, using 2024 as the baseline, the SAP production load per AI server substrate is expected to increase to approximately 1.8x by 2026 and 2.5x by 2028. Ibiden also explicitly expects aggregate SAP demand to exceed industry supply capacity, highlighting the growing structural constraints on high-end ABF substrate production.
Figure 6: GPU and ASIC ABF Substrate Content Value and Area Growth
| Company | Product / Platform | Content Value (US$) | Area Growth (%) |
|---|---|---|---|
| NVIDIA | GB200 GB300 VR200 VR300 | $140-150 $200-220 $300 $400 | +120% +75% |
| Google V7 / Ironwood V8t / Sunfish V8i / Zebrafish V9 / | $200+ $280-300 Humufish | $250-280 ~$500 | - +20% +20% +160% |
Sources: Company Data, GF Securities (Hong Kong) Brokerage
Figure 7: Our GPU and ASIC Shipment Estimates (mn units)
| 2025E | 2026E | 2027E | 2028E | |
|---|---|---|---|---|
| GPU | ||||
| NVIDIA | 5.8 | 8.1 | 11.3 | 12.6 |
| AMD | 0.5 | 0.8 | 1.1 | 1.3 |
| Others | 1.2 | 1.5 | 3.0 | 4.0 |
| Total | 7.5 | 10.4 | 15.4 | 17.9 |
| YoY | 54% | 38% | 47% | 16% |
| ASIC | ||||
| Google TPU | 2.8 | 4.5 | 8.9 | 9.9 |
| AWS | 1.6 | 2.3 | 2.7 | 1.8 |
| Other ASICs | 1.0 | 1.5 | 2.4 | 3.2 |
| Total | 5.4 | 8.3 | 14.1 | 14.9 |
| YoY | 29% | 52% | 69% | 6% |
Sources: Company Data, GF Securities (Hong Kong) Brokerage
Server CPU: Rising Layer Counts and Volume Upside
Agentic AI materially increases CPU demand: As AI workloads evolve toward agentic AI, the GPUto-CPU ratio could decline from approximately 8:1 toward 1:1 or potentially lower, creating significant upside to server CPU shipments. Given the close to 1:1 relationship between server CPU shipments and ABF substrates, higher CPU volumes should translate almost directly into incremental ABF substrate demand.
At the same time, rising performance requirements for server CPUs in the agentic AI era are likely to drive continued substrate specification upgrades. Higher layer counts and larger substrate sizes increase material consumption, manufacturing complexity, and production cycle times, thereby raising unit costs and supporting ASP growth. The pricing differential also highlights the attractive economics of server CPU substrates: conventional PC CPU ABF substrates typically sell for approximately US$8-10 per unit, compared with US$30-50 for server CPU substrates.
Figure 8: Intel Server CPU Substrate Size Evolution
| Chip | Launch Time | Size (cm²) | Size Growth (%) |
|---|---|---|---|
| Skylake | Jun-17 | 43 | - |
| Cooper Lake | Jun-20 | 44 | +2% |
| Ice Lake | Apr-21 | 44 | 0% |
| Sapphire Rapids | Jan-23 | 49 | +13% |
| Emerald Rapids | Dec-23 | 49 | 0% |
| Sierra Forest | Jun-24 | 61 | +24% |
| Granite Rapids | Sep-24 | 61 | 0% |
| Clearwater Forest | Jun-26 | 61 | 0% |
| Diamond Rapids | Mid-27 | 83 | +36% |
Sources: Company data, GF Securities (Hong Kong) Brokerage
Figure 9: AMD Server CPU Substrate Size Evolution
| Chip | Launch Time | Size (cm²) | Size Growth (%) |
|---|---|---|---|
| Naples | Jun-17 | 44 | - |
| Rome | Aug-19 | 44 | 0% |
| Milan | Mar-21 | 44 | 0% |
| Genoa | Nov-22 | 54 | +23% |
| Bergamo | Jun-23 | 54 | 0% |
| Siena | Sep-23 | 44 | -19% |
| Turin | Oct-24 | 54 | +23% |
| Venice | Jul-26 | 61 | +12% |
Sources: Company data, GF Securities (Hong Kong) Brokerage
Figure 10: Our Server CPU Shipment Forecast (mn units)
| 2024 | 2025 | 2026E | 2027E | 2028E | |
|---|---|---|---|---|---|
| Intel | 16 | 17 | 18 | 21 | 23 |
| AMD | 9 | 9 | 14 | 17 | 22 |
| NVIDIA | 0.4 | 2.2 | 3.1 | 5.5 | 6.8 |
| AWS | 1.1 | 1.4 | 1.6 | 4 | 4.5 |
| 0 | 0.1 | 1 | 4.5 | 6 | |
| Others | -3.9 | -5 | -2.6 | -5.1 | -2.9 |
| Total | 22.6 | 24.7 | 34.4 | 46.9 | 59.5 |
| YoY | - | +9.3% | +39.3% | +36.3% | +26.9% |
Sources: Company data, GF Securities (Hong Kong) Brokerage
Please be sure to read the disclosures at the end of this report carefully.
AI ABF Substrate TAM to Double in 2027
Based on our shipment and content value forecasts for AI accelerators and server CPUs, we project the global AI ABF substrate market TAM to reach US$6.3bn/12.5bn/17.7bn in 2026/2027/2028, representing YoY growth of 78%/100%/41%, respectively. Despite weakening demand from traditional end-markets such as PC and auto, structural AI demand is expected to remain the key growth driver for the ABF substrate industry. We forecast the overall global ABF substrate market TAM to reach US$10.1bn/16.5bn/21.7bn in 2026/2027/2028, representing YoY growth of 31%/62%/32%, respectively, with AI-related demand accounting for an increasing share of industry growth.
Figure 11: ABF Substrate TAM Growth (mn USD)
Sources: Company Data, GF Securities (Hong Kong) Brokerage.
ABF Substrate Supply: Near-Term Capacity Expansion Remains Constrained
The more demanding specifications of AI accelerators make the current expansion cycle substantially more complex than conventional capacity additions. We see three key bottlenecks for capacity expansion:1)ABF film: Ajinomoto is already operating at high utilization in 2026, with significant price increases emerging across the market;2)T-glass:We estimate supply deficits of approximately 35% in 2026 and 41% in 2027, with meaningful relief unlikely before 2028;3) Equipment lead times and qualification: most of the ABF substrate equipment lead times have extended to approximately 12-14 months, some specific machines are seeing lead time extend to 30 months. Equipment installation, trial production, customer qualification, and yield ramp-up add further delays. Consequently, even if manufacturers accelerate capex immediately, a meaningful portion of the resulting effective capacity is unlikely to become available until 2028 or later.
ABF film: Ajinomoto's Dominance Limits Supply Flexibility
Ajinomoto commands approximately 95% of the ABF film market, making its capacity and pricing decisions critical to the industry's supply-demand balance. Our channel checks indicate that high-end ABF film prices have reached approximately RMB1,200-1,300/sqm.
Ajinomoto has several options to increase output before committing to major new capacity investments. These include moving from one to two shifts per day and adding weekend overtime if required. The company could also accelerate the planned commissioning of its Gifu facility from 2032 to 2030 if market conditions warrant.
However, structural demand growth remains a challenge. Larger substrate areas, more complex designs, and lower yields for advanced ABF substrates will all increase ABF film consumption per unit, amplifying demand growth beyond substrate shipment volumes alone.
Sekisui Chemical is another supplier of high-end ABF film, serving customers including Broadcom and AMD. However, its ability to expand capacity is limited, constraining its potential to alleviate the supply shortage. Other potential entrants, including Taiwan-based Jinghua and mainland China's Founder Technology, have also explored the market, but remain unable to provide a viable alternative for high-end applications.
Against this backdrop, Taiwanese and Korean substrate manufacturers are increasingly seeking supply allocations, with suppliers prioritizing volume commitments over price stability. This suggests that supply security, rather than price alone, is becoming a key consideration for substrate makers.
T-glass: Tight Supply Likely to Persist Through 2027
Nittobo accounted for approximately 90% of the T-glass market for high-end ABF substrates in 2025 Its T-glass products currently command quoted prices of approximately US$10-15/sqm. While second-tier suppliers, including Grace Fabric, Taishan, Taiwan Glass, and Kingboard, are expanding capacity rapidly, their relatively low yields limit effective output and prevent them from offering a clear pricing advantage over Nittobo.
Nittobo is expected to expand monthly capacity to more than 1mn sqm by 2027. Meanwhile, we estimate that combined T-glass capacity in mainland China and Taiwan could reach approximately 4mn sqm/month in 2027. These additions should gradually ease the supply-demand imbalance, with a more meaningful improvement in T-glass availability expected from 2028 onward.
Figure 12: T-Glass Demand & Supply (ton/m)
Sources: Company Data, GF Securities (Hong Kong) Brokerage.
Figure 13: Major ABF Substrate Players Capacity Expansion Plan Overview
| Company | Expansion Plans and Production Timeline | Capex | Capacity Expansion |
|---|---|---|---|
| Unimicron | Guangfu Plant 2: 2027; Yangmei Plant 2 (Intel-dedicated): 2028; Yangmei Plants 3-4: 2029/30. Construction could take less than one year. | 2026: NT$53.7bn, with 80-85% for ABF. Additional long-lead equipment orders: NT$17.6bn. | ~30-40% annual expansion, mainly high-end ABF; some BT equipment converted to ABF. ~7,000 panels/plant on a build-up layer basis. |
| Nan Ya PCB | New Chiayi plant for large-format, high- layer-count substrates: late 2028-2029 market expectation. Kunshan/Broadcom expansion: output from 2028. | Chiayi: NT$46.8bn. | Existing capacity: ~50m units/month, based on 27 × 27 mm equivalents. Kunshan expansion: ~60%. |
| Kinsus | High-end ABF expansion at Youshi / Plant 6, targeting ASICs, server CPUs and high- end switches. Plans extend to 2029. | 2026/27/28: NT$14bn/16bn/18- 20bn. 2026: equipment 6bn, buildings 6bn, maintenance 2bn. 2027 mainly supports Youshi ABF expansion. | ABF capacity: ~40m units/month at end-2026 → 50m in 2027 → 65m in 2028 → 80m in 2029. Youshi: 10m → 20m/month in 2027. |
| Ibiden | Ono Cell 8: AI GPU substrates. Gama Cell 6: AI ASIC substrates. Phased production from FY2027; Gama starts in late FY2027, contributing from FY2028. | FY2026-28: JPY500bn; Ono and related facilities JPY280bn, Gama and related facilities JPY220bn. | ~20% annual growth, based on the company's ASIC/AI server capacity index. |
| Shinko Electric Industries | Chikuma: approved in 2023; shipments from July 2029. Mobara: JDI acquisition signed in September 2026; handover by March 2027, production in FY2028. | Chikuma: JPY53.3bn, including up to JPY17.8bn in government subsidies. Mobara's full investment budget is undisclosed. | Chikuma: ~6% increase versus the application-date baseline, covering the approved project only. Mobara: undisclosed. |
| SEMCO | High-end FC-BGA expansion for AI/HPC. Sejong: mass production in September 2028. Vietnam: completion and production in June 2030. | Multi-year investment: KRW6,780bn; Sejong KRW4,270bn, Vietnam KRW2,510bn. | - |
| AT&S | Kulim: Plant 1 ramp-up completed; Plant 2 fit-out and new substrate-core/advanced PCB facilities underway. Capacity added over the coming years. Chongqing also expanding. | Kulim: EUR1.5-2.0bn; Chongqing: tens of millions of euros. Separately, FY2026/27 group capex: EUR1.0- 1.2bn. | - |
Sources: Company data, GF Securities (Hong Kong) Brokerage
Ibiden: JPY500bn Three-Year Capex Plan, with Ono and Gama as Key Expansion Hubs
Ibiden is a global leader in high-end ABF substrates, primarily serving AI GPUs, server CPUs, and other high-performance computing applications. Its major high-end substrate production facilities are located at Ogaki Central, Ono, and Gama in Japan, as well as in the Philippines. The company currently has total capacity of approximately 500,000 sqm/month, with ABF utilization exceeding 90%, indicating that its production network is operating at a high load. The Philippines facility primarily produces PC and lower-end substrates, which generate gross margins of approximately 10-20%. Ibiden has largely discontinued production of these products at its domestic Japanese facilities, prioritizing more advanced applications in Japan.
Capex and expansion plans: In February 2026, Ibiden announced plans to invest approximately JPY500bn over FY2026-FY2028, primarily to expand advanced IC packaging substrate capacity. Based on the investment plan, approximately JPY280bn is allocated to Ono and related existing facilities, while the remaining JPY220bn is earmarked for Gama Cell 6 and other production facilities. The latter projects are expected to begin mass production progressively from FY2027. By application, we expect incremental capacity at Ono to primarily serve high-performance GPU and AI server customers, while Gama is likely to focus on advanced packaging applications such as EMIB-T. Both projects target high-end substrates, with product specifications and value per unit expected to exceed those of conventional products.
Ibiden's Japanese facilities currently operate around the clock with two-shift handovers to maximize equipment utilization and ensure timely order fulfillment. Lead times for standard 10-layer substrates are currently approximately 8-9 weeks, while large-format AI substrates with more than 20 layers can require 12-14 weeks. Given that demand from some customers exceeds available production capacity, Ibiden is actively screening orders and gradually reducing its exposure to lower-margin products, prioritizing limited capacity for higher-value-added applications.
In May 2026, Ibiden further indicated that FY2026 capex would reach approximately JPY210bn, equivalent to 42% of its three-year JPY500bn investment plan. We believe this front-loaded investment reflects management's positive outlook for AI server and high-performance computing demand. Nevertheless, new high-end substrate lines involve complex manufacturing processes and long equipment delivery lead times, followed by customer qualification and yield-ramp requirements. We therefore expect incremental effective capacity to contribute progressively from 2027 onward, rather than immediately easing the current supply constraints.
Figure 14: Ibiden's Expansion Plan
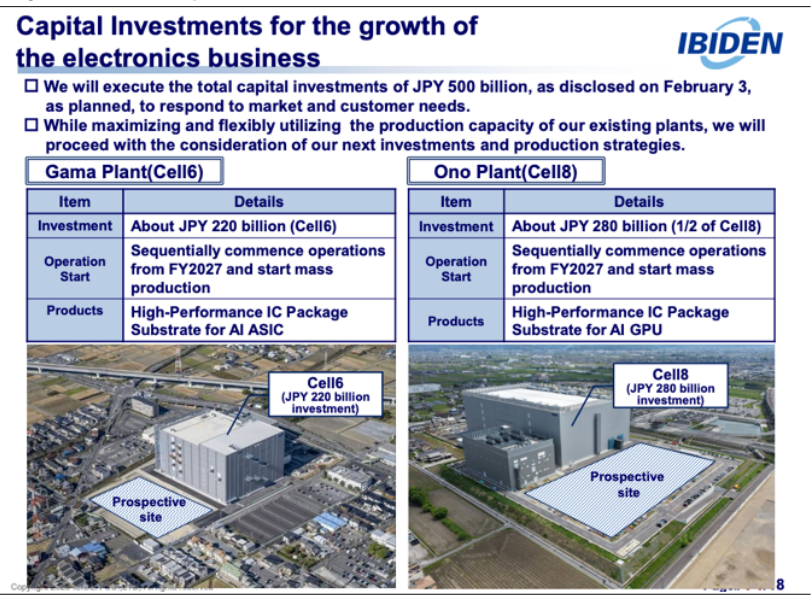
Sources: Company Data, GF Securities (Hong Kong) Brokerage.
Unimicron: Significant Capex Increase to Drive Continued High-End ABF Expansion
Unimicron's ABF capacity is primarily concentrated at its Taiwan facilities in Guangfu and Yangmei, with additional production lines in mainland China. Utilization rates across its Taiwan and mainland China ABF facilities both exceed 90%. Measured on a 16-layer high-end ABF substrate-equivalent basis, the company currently has approximately 150,000 sqm/month of capacity, including ~8,000 sqm/month at its Qunce facility in mainland China. Taiwan accounts for the majority of Unimicron's ABF revenue.
Capex and expansion plans: Unimicron has raised its 2026 capex budget from the original NT$34bn to NT$53.7bn, with approximately 80-85% allocated to ABF-related businesses. Its long-term equipment procurement budget has also increased to NT$31.6bn. Expansion is primarily focused on Guangfu Plant 2 and the Yangmei facilities. Incremental capacity at Guangfu Plant 2 is expected to ramp up progressively in 2026-27, while Yangmei Plant 2, a dedicated facility for Intel, is expected to commence production in 2028. Yangmei Plants 3 and 4 are scheduled to come online in 2029 and 2030, respectively.
According to company's guidance, Unimicron plans to expand nominal high-end ABF capacity by approximately 30-40% annually. The company also plans to reduce BT capacity by approximately 15% and repurpose selected equipment for ABF production, further increasing its effective ABF capacity. However, given that yields at newly commissioned production lines typically start at approximately 50-60%, compared with ~90% at mature lines, we believe the conversion of nominal capacity additions into effective high-end output will require a meaningful ramp-up period.
Nan Ya PCB: the Next Expansion Cycle Starting in 2028
Nan Ya PCB's ABF substrate business primarily serves networking, server CPU, and ASIC applications, with Broadcom as its largest customer, accounting for approximately 30% of related revenue. The company currently has total monthly capacity of approximately 50mn units (27 × 27mm size-equivalent). As demand for high-end networking and ASIC substrates continues to grow, management expects ABF utilization to exceed 80% in 3Q26 and reach full utilization in 4Q26, indicating increasingly tight availability of existing high-end capacity.
Capex and expansion plans: In the near term, Nan Ya PCB plans to increase effective ABF output through debottlenecking, equipment upgrades, and product-mix optimization. Over the medium to long term, the company intends to invest its own funds in additional high-end substrate capacity, with new production lines expected to begin ramping up as early as late 2028 to 2029. In parallel, the company is discussing a potential capacity expansion partnership with its key customer Broadcom. Subject to board approval, capacity at its Kunshan facility could increase by approximately 60%, with incremental output expected from 2028. Given Nan Ya PCB's established customer relationships and technical capabilities in networking substrates, we believe its planned expansion should further strengthen its supply position in high-end networking and ASIC applications.
Kinsus: Three Consecutive Years of Higher Capex, ABF Capacity Set to Grow 25-30% YoY
Kinsus' production capacity is primarily located at its Youshi and Xinfeng facilities, with products serving high-end applications including server CPUs, GPUs, and ASICs. The company expects its monthly ABF capacity to reach approximately 40mn units by end-2026.
Capex and expansion plans: Kinsus plans to spend approximately NT$14bn on capex in 2026, increasing to NT$16bn in 2027, primarily to expand high-end ABF production at its Youshi facility. Capex is expected to rise further to NT$18-20bn in 2028, marking three consecutive years of investment increases. In terms of capacity, Kinsus expects monthly ABF output capacity to increase from 40mn units at end-2026 to 50mn units in 2027, representing approximately 25% growth. Capacity at the Youshi facility is expected to double from 10mn to 20mn units/month over the same period. Total monthly capacity is then projected to reach 65mn units in 2028 and 80mn units in 2029. Based on these plans, we expect Kinsus' ABF capacity to grow at approximately 25-30% annually over 2027-29. Despite the planned 25% capacity increase in 2027, we believe the ramp-up of new production lines will take time. Consequently, nominal capacity additions are unlikely to immediately alleviate the shortage of qualified high-end ABF supply.
18% ABF Substrate Supply Deficit in 2027E:Tight Supply to Drive Earnings Growth at Leaders, with Spillover Opportunities for Tier-2 Players
High-end ABF substrates are entering a structural shortage, with the supply-demand imbalance set to widen in 2027. Supported by robust AI demand, we expect the high-end ABF substrate market to move into undersupply in 2026, with the imbalance widening progressively through 2027-28. Importantly, the bottleneck in this cycle is not aggregate ABF substrate capacity, but the availability of qualified high-end production capacity capable of meeting the requirements of AI GPUs and ASICs, particularly in terms of large package sizes, high layer counts, fine-line circuitry, and high manufacturing yields.
This explains why industry supply-demand conditions could tighten further despite ongoing capacity expansion. Recent industry checks indicate that ABF substrate lead times have lengthened from approximately 3-4 months at the beginning of the year to more than 12 months, while some AI customers have already begun securing capacity for 2029.
We expect the combination of generational migration, tight supply, and rising upstream material costs to drive 30%+ YoY price increases for high-end ABF substrates in 2026, with further acceleration in 2027. Our supply-chain checks suggest that downstream customers remain receptive to cost pass-through and further price hikes, reflecting the strategic importance of securing substrate supply for AI accelerator production.
We estimate an industry-wide ABF substrate supply shortfall of ~8% in 2026, widening to ~18%/~16% in 2027/2028. The widening gap in 2027 reflects the time required for new capacity to ramp up, alongside rising SAP (semi-additive process) capacity requirements per chip as AI package complexity increases. Based on our current demand forecasts, we expect supply-demand conditions to ease modestly in 2028, although further technology transitions could introduce additional upside risks to demand.
Importantly, these estimates cover the entire ABF substrate market across all applications. Given the higher value and margin profile of AI-oriented ABF substrates, the ramp-up in AI production is likely to further crowd out traditional ABF applications, such as PC-related substrates. Leading high-end ABF substrate makers, including Ibiden, Unimicron, and Samsung Electro-Mechanics (SEMCO), are planning to upgrade existing mid- to low-end ABF capacity for high-end applications to improve product mix and enhance profitability.
Beyond earnings upside at leading suppliers, capacity reallocation should create spillover opportunities for Tier-2 ABF substrate makers. We are also seeing mainland Chinese suppliers, including Shennan (with ~15k sqm/month of ABF capacity) and Xingsen (with ~7k sqm/month), actively pursuing opportunities in this cycle. Building on their existing BT substrate businesses, both companies are stepping up sample submissions and customer development efforts to penetrate the GPU and ASIC ABF substrate markets. We believe these suppliers could benefit as leading manufacturers prioritize high-end AI applications and withdraw capacity from traditional ABF segments, creating opportunities for qualified second-tier players to capture incremental orders.
Figure 15: Our ABF Substrate Supply and Demand Forecast (mn USD)
Sources: Company data, GF Securities (Hong Kong) Brokerage
BT Substrate: Memory Demand Supports a Tighter Supply-Demand Balance
BT Substrate Demand: Memory Remains the Primary Growth Driver
Memory remains the primary demand driver for BT substrates, while demand from other consumer electronics applications continues to face oversupply. Driven by a sharp increase in memory demand, the supply-demand balance for memory-related BT substrates began tightening in 2Q25. Prices subsequently doubled in 2025, reflecting both the low starting price base of BT substrates and a neardoubling in gold prices, which increased input costs.
BT substrate price increases have moderated, mainly due to: 1) a pullback in gold prices; 2) slower memory price increases; and 3) a substantial ramp-up in China mainland capacity. Nevertheless, despite some near-term easing in memory-related BT substrate demand, we expect supply-demand conditions to remain relatively tight. This is because leading substrate manufacturers are reallocating capacity toward ABF substrates, limiting the effective supply available for BT substrates. In our view, this capacity shift should help underpin the BT substrate market even as the pace of price increases moderates.
Figure 16: Memory BT Substrate Demand (mn USD)
Sources: Company Data, GF Securities (Hong Kong) Brokerage.
Figure 17: DRAM Price Forecast QoQ (%)
Sources: Company Data, GF Securities (Hong Kong) Brokerage.
Figure 18: NAND Price Forecast QoQ (%)
Sources: Company Data, GF Securities (Hong Kong) Brokerage.
Figure 19: Memory BT Substrate Content Value (RMB/m²)
| Category | Application | Substrate Structure / Process | ASP (RMB/m²) |
|---|---|---|---|
| NAND | NAND Flash | 2/4-layer, tenting process | 3,500-6,000 |
| LPDDR (Mobile) | 3-layer coreless substrate, use ultra-thin T-glass | ~10,000 | |
| DDR5 | 2-layer, tenting process | 3,500 | |
| DRAM | DDR5 | 2-layer, mSAP process | 4,500 |
| DDR4 | 2-layer substrate | 2,000-3,000 |
Sources: GF Securities (Hong Kong) Brokerage.
Please be sure to read the disclosures at the end of this report carefully.
Beyond memory, BT substrate demand primarily comes from non-memory applications in mobile devices and tablets, including application processors (APs), RF chips, baseband processors, and PMICs; automotive applications, such as MCUs, ADAS, cameras, sensors, and PMICs; as well as other consumer electronics and industrial applications. However, amid broadly subdued near-term demand for consumer electronics and automotive products, BT substrate demand across nonmemory applications is contracting. As a result, we expect memory demand to be the sole driver of the BT substrate market's recovery in 2026-27.
Figure 20: BT Substrate (FCCSP/WBPBGA/WBCSP) Demand by End Market (mn USD)
Sources: Company Data, GF Securities (Hong Kong) Brokerage.
BT Substrate Supply:Limited Capacity Expansion by Leaders Creates Opportunities for Second-Tier Suppliers
Leading BT substrate manufacturers, including Unimicron, Kinsus, and SEMCO, are gradually scaling back low-end BT substrate production and converting existing capacity to ABF substrates. Other major players, including Ibiden, Nan Ya PCB, and AT&S, also have no plans to expand BT substrate capacity. This industry-wide shift in capital allocation is creating opportunities for second-tier suppliers to gain market share. Key beneficiaries include LG Innotek, Zhen Ding Tech, Xingsen, and Shennan, all of which plan to expand BT substrate capacity. We expect most of this incremental capacity to ramp up in 2027-28.
Figure 21: Major BT Substrate Players Capacity Expansion Plan Overview
| Company | Expansion Plans and Production Timeline | Capex | Capacity Expansion |
|---|---|---|---|
| New substrate plant in Hai Phong, Vietnam; trial production in 3Q27, mass production in 3Q28 | ~US$1bn (BT/ABF combined) | - | LG Innotek |
| BT debottlenecking expansion at Qinhuangdao Plants 1 & 2 in 2H26; current UTR remains high | Undisclosed | ~20% BT capacity expansion | Zhen Ding |
| Phase III expansion at Zhuhai, targeting 4Q26 production; current UTR ~95%, with memory accounting for ~60% | ~RMB1.2bn | +25,000 m²/month (+50%), from 50,000 to 75,000 m²/month | Xingsen |
| Guangzhou Phase II memory BT substrate expansion, targeting 4Q26 production; current UTR >95% | ~RMB2.0bn | ~RMB1.6-1.7bn incremental annual output value at full capacity | Shennan |
Sources: Company data, GF Securities (Hong Kong) Brokerage
Company Overview
Founded in 1990 and headquartered in Taoyuan, Taiwan, Unimicron is a leading global manufacturer of IC substrates and printed circuit boards. Its product portfolio covers ABF and BT substrates, HDI, high-layer-count PCBs, flexible and rigid-flex boards, as well as IC testing and burn-in services. The Company operates manufacturing facilities across Taiwan, mainland China, Thailand, Germany and Japan, serving applications including AI data centers, PCs, smartphones, networking equipment, optical modules and automotive electronics.
Unimicron has progressively evolved from a conventional PCB manufacturer into an AI interconnect platform. Following its expansion into mobile HDI and BT substrates, the company strengthened its IC-substrate capabilities through acquisitions and sustained investment, including its merger with Phoenix Precision Technology (PPT) and Subtron Technology. Since 2020, investment has increasingly shifted towards large-body, high-layer-count substrates and advanced AI-server PCBs.
Figure 22: Company Development
Sources: Company IR material, GF Securities (Hong Kong) Brokerage.
Business Segment
- IC Substrates (58% of FY25 revenue): Unimicron manufactures advanced IC package substrates, primarily including ABF and BT substrates. ABF substrates serve high-performance computing (HPC), AI GPUs, server CPUs and ASICs, while BT substrates are mainly used in mobile devices, memory and other consumer electronics. Driven by strong AI and HPC demand, ABF substrates remain the company's key growth engine.
-
HDI (27% of FY25 revenue): Unimicron provides high-density interconnect (HDI) PCBs for applications including smartphones, AI servers, optical communication and other highperformance electronic devices. The company continues to optimize its product mix towards higher-value applications.
-
PCB (11% of FY25 revenue): Unimicron manufactures conventional multilayer PCBs for computing, networking, automotive and industrial applications. The company is increasingly focusing on high-layer-count and high-speed PCBs to capture growing demand from AI infrastructure.
- FPC & Others (4% of FY25 revenue): Unimicron also supplies flexible printed circuits (FPCs) and other electronic components for mobile, consumer electronics and industrial applications.
Figure 23: Segment Breakdown
Sources: GF Securities (Hong Kong) Brokerage
Figure 24: Revenue Mix Shifts Towards AI Data Centers
Sources: GF Securities (Hong Kong) Brokerage
2026 Capex of NT$53.7bn to Drive High-End ABF Capacity Expansion
Unimicron is accelerating its strategic shift toward substrate manufacturing, with substrates increasing from 47% of total revenue in 2023 to 61% in 2Q26. Going forward, the company plans to prioritize high-end ABF substrates, which offer higher technological barriers and stronger pricing power, while scaling back PCB operations amid intense competition from mainland Chinese manufacturers and relatively lower technological barriers. Reflecting this strategic shift, Unimicron has progressively raised its 2026 capex budget from an initial NT$20bn to NT$53.7bn, with the bulk of the investment allocated to expanding domestic high-end ABF substrate capacity in Taiwan.
- l ABF Substrates: Unimicron currently has approximately 150k sqm/month of high-end ABF substrate capacity, measured on a 16-layer high-end product-equivalent basis, ranking among the world's largest suppliers. Capacity is primarily concentrated at its Taiwan facilities in Guangfu and Yangmei. Its Suzhou Plant 2 in mainland China contributes an additional ~8k sqm/month. Utilization rates across both Taiwan and mainland China ABF production lines exceed 90%. Going forward, the company plans to expand high-end ABF capacity by approximately 30-40% annually. Incremental capacity at Guangfu Plant 2 is expected to ramp up progressively in 2026-27, followed by Yangmei Plant 2 in 2028, Yangmei Plant 3 in 2029, and Yangmei Plant 4 in 2030. These investments are aimed at capturing growing demand from AI GPUs, ASICs, and high-performance servers.
- l BT Substrates: Unimicron's BT substrate capacity is primarily located in Taiwan and mainland China. Its Taiwan facilities in Xinfeng, Shulin, and Taoyuan collectively account for approximately 150k sqm/month, or ~80% of total BT capacity, while Suzhou Plant 1 in mainland China contributes ~35k sqm/month (two-layer-equivalent). The company plans to reduce BT capacity by approximately 15% this year, repurposing selected older Taiwan facilities and equipment for ABF production. It is also optimizing its BT product mix and gradually exiting lower-value-added businesses to improve capacity allocation efficiency and profitability.
- l PCB / HDI / SLP: Unimicron is gradually restructuring its traditional PCB, HDI, and SLP businesses. Their combined revenue contribution has declined from over 65% in 2019 to approximately 50% in 2023 and currently stands below 40%. We expect this share to fall further to approximately 25% by 2028. Through production-line consolidation, equipment upgrades, and product-mix optimization, the company plans to divest or scale back lower-end production capacity and reallocate capital and manufacturing resources toward high-end substrates and higher-value-added applications.
- l mSAP: Unimicron has established a presence in mSAP products for 1.6T high-speed optical modules and is currently among the leading suppliers in this segment. Unlike high-end ABF substrates, mSAP expansion relies primarily on repurposing existing smartphone-related production equipment and utilizing idle factory space, limiting incremental capex to approximately NT$2-3bn. We expect mSAP capacity expected to grow 50%/40% YoY in 2026/27, respectively. However, competition is expected to intensify as suppliers such as Pengding and Shennan Circuits accelerate their investments, while potential competitors including Kinwong, Suntak, Wus Printed Circuit, and Dongshan Precision also expand their presence. We expect Unimicron to focus on technology upgrades and optimization of existing capacity to sustain its competitive edge.
Earnings Review
2Q26 results review
Unimicron reported 2Q26 revenue of NT$42.9bn, +14% QoQ and +32% YoY. Gross profit margin improved to 25%, up 7ppt QoQ, while operating profit margin reached 16%, up 9ppt QoQ. Net profit reached NT$13.1bn, with basic EPS of NT$8.45, +158% QoQ.
We forecast revenue of NT$191bn/303bn/402bn in 2026/2027/2028
Unimicron's revenue for 2026 and 2027 is projected to reach NT$191.2bn and NT$303.4bn, reflecting YoY growth of +46% and +59%, respectively. Operating Profit is forecast at NT$37.1bn and NT$100.3bn, while net profit is expected to reach NT$43.9bn and NT$94.3bn. EPS is anticipated to be NT$28.58 and NT$60.75, supported by improving profitability, with gross profit margin expanding from 29% in 2026E to 42% in 2027E.
Figure 25: Unimicron's P&L
| (NTD m) | FY25 | 1Q26 | 2Q26 | 3Q26E | 4Q26E | FY26E | 1Q27E | 2Q27E | 3Q27E | 4Q27E | FY27E |
|---|---|---|---|---|---|---|---|---|---|---|---|
| Sales | 131,240 | 37,446 | 42,890 | 52,650 | 58,171 | 191,157 | 63,788 | 71,965 | 79,684 | 87,932 | 303,369 |
| COGS | 112,949 | 30,720 | 32,252 | 35,629 | 37,458 | 136,058 | 39,096 | 42,178 | 45,829 | 49,773 | 176,877 |
| Gross profit | 18,292 | 6,726 | 10,638 | 17,021 | 20,713 | 55,099 | 24,692 | 29,787 | 33,855 | 38,158 | 126,492 |
| Opex | 11,782 | 4,017 | 4,025 | 4,838 | 5,258 | 18,096 | 5,670 | 6,289 | 6,884 | 7,509 | 26,353 |
| Operating profit | 6,674 | 2,757 | 6,651 | 12,218 | 15,486 | 37,112 | 19,056 | 23,536 | 27,001 | 30,681 | 100,275 |
| Non-op profit | 2,153 | 3,542 | 8,925 | 921 | 2,146 | 15,534 | 2,365 | 2,616 | 2,922 | 3,253 | 11,156 |
| Pre-tax profit | 8,827 | 6,299 | 15,576 | 13,138 | 17,633 | 52,646 | 21,421 | 26,152 | 29,923 | 33,934 | 111,430 |
| Minority interest | 877 | 338 | 227 | 287 | 298 | 1,150 | 306 | 291 | 282 | 293 | 1,172 |
| Income tax | 1,277 | 918 | 2,233 | 1,884 | 2,528 | 7,564 | 3,072 | 3,750 | 4,291 | 4,866 | 15,978 |
| Net income | 6,673 | 5,043 | 13,115 | 10,968 | 14,806 | 43,932 | 18,043 | 22,111 | 25,351 | 28,775 | 94,280 |
| EPS | 4.37 | 3.28 | 8.45 | 7.06 | 9.52 | 28.58 | 11.60 | 14.22 | 16.30 | 18.50 | 60.75 |
| Margin analysis | |||||||||||
| Gross margin | 14% | 18% | 25% | 32% | 36% | 29% | 39% | 41% | 42% | 43% | 42% |
| Operating margin | 5% | 7% | 16% | 23% | 27% | 19% | 30% | 33% | 34% | 35% | 33% |
| Pre-tax margin | 7% | 17% | 36% | 25% | 30% | 28% | 34% | 36% | 38% | 39% | 37% |
| Effective tax rate | -14% | -15% | -14% | -14% | -14% | -14% | -14% | -14% | -14% | -14% | -14% |
| Growth (YoY%) | |||||||||||
| Sales | 14% | 24% | 32% | 55% | 68% | 46% | -51% | 92% | 86% | 67% | 59% |
| Operating profit | 30% | 118% | 341% | 697% | 555% | 456% | 185% | 754% | 306% | 151% | 170% |
| Net income | 31% | 451% | 44197% | 400% | 319% | 558% | 170% | 338% | 93% | 162% | 115% |
| EPS | 32% | 450% | 43679% | 393% | 539% | 555% | 166% | 333% | 93% | 162% | 113% |
Sources: GF Securities (Hong Kong) Brokerage
Valuation and Recommendation
Before the AI boom, Unimicron's ABF substrate demand was primarily driven by consumer electronics, including smartphones, tablets, and PCs, with the stock trading at a historical forward P/E of ~17x. From 2023, accelerating AI demand drove the forward P/E multiple to approximately 33x as the market priced in stronger structural growth.
The valuation multiple began to contract in mid-2024, reflecting a combination of earnings pressure and downward earnings revisions. 1) Weaker utilization and intensified price competition weighed on profitability: capacity utilization fell to the low-60% range, while earnings declined to their lowest level since 2020. 2) Earnings expectations deteriorated as supply additions outpaced demand: capacity from the previous ABF expansion cycle came online in a concentrated manner, creating oversupply, while the ramp-up in AI-related substrate revenue lagged initial expectations. Together, these factors triggered a double hit from earnings downgrades and valuation multiple compression.
Since mid-2025, capacity utilization has recovered to above 80%, supported by continued AI accelerator platform upgrades and a rebound in memory demand. Meanwhile, tightening upstream material supplies, particularly T-glass, initially added cost pressure and prompted substrate price adjustments. As supply-demand conditions for high-end ABF substrates tightened further, pricing momentum strengthened, with suppliers increasingly able to implement price hikes. Since 2026, the market has again recognized Unimicron as a core AI substrate supplier, driving its forward P/E back above 30x.
We believe the current upcycle is structurally different from previous recoveries. Demand for AI GPUs, ASICs, and server CPUs is expected to expand structurally through 2030, rather than being driven primarily by short-term inventory replenishment. Apart from volume growth, ongoing upgrades toward larger substrate sizes, higher layer counts, and greater interconnect density are increasing substrate content value. As a leading ABF substrate supplier, Unimicron is well positioned to capture these opportunities, supported by its aggressive capacity expansion strategy and continued share gains among major AI customers.
We apply a 30x 2027E P/E multiple, broadly in line with valuation levels since the AI boom. Our target price of NT$1,820 implies 66% upside from the current share price.
Figure 26: Unimicron's Historical Forward P/E
Sources: Bloomberg, GF Securities (Hong Kong) Brokerage
Figure 27: Compare Table
| Company | Currency | EPS - 2025 | EPS - 2026 | EPS - 2027 | EPS - 2028 | 25-28 - CAGR | ROE - 2025 | ROE - 2026 | ROE - 2027 | ROE - 2028 | PE - 2026 | PE - 2027 | PE - 2028 |
|---|---|---|---|---|---|---|---|---|---|---|---|---|---|
| Unimicron | NTD | 3 | 22 | 42 | 72 | 178% | 7% | 28% | 41% | 47% | 52 | 28 | 16 |
| Nan Ya PCB | NTD | 3 | 18 | 52 | 90 | 210% | 4% | 24% | 51% | 55% | 73 | 26 | 15 |
| Kinsus | NTD | 3 | 12 | 31 | 59 | 157% | 5% | 15% | 30% | 35% | 83 | 33 | 18 |
| Zhen Ding | NTD | 7 | 14 | 28 | 45 | 88% | 6% | 10% | 15% | 24% | 43 | 21 | 13 |
| Ibiden | JPY | 52 | 96 | 147 | 215 | 60% | 7% | 10% | 15% | 19% | 93 | 61 | 42 |
| SEMCO | JPY | 9443 | 21215 | 45228 | 70790 | 96% | 8% | 16% | 27% | 32% | 55 | 26 | 17 |
Sources: Bloomberg, GF Securities (Hong Kong) Brokerage Bloomberg, GF Securities (Hong Kong) Brokerage
Risks
1) AI demand deceleration; 2) Geo-political uncertainties; 3) Competition.
Initiate with Buy with TP of NT$1,820
We initiate Unimicron with a Buy on the back of: 1) rapid expansion of the AI ABF substrate market, with TAM of US$13bn/US$18bn in 2027E/28E, driven by sustained price hike momentum, and Unimicron is poised to capture >30% share; 2) aggressive high-end ABF capacity expansion to capitalize demand; 3) improving product mix across ABF, BT, and PCB to optimize margins. We forecast revenue of NT$191bn/303bn/402bn and EPS of NT$28.6/60.8/89.3 in 2026E/27E/28E, respectively (vs. consensus of NT$25/55/80). Our target price of NT$1820 is based on 30x 2027E P/E.
| Balance Sheet | FY24 | FY25 | [Table_FinanceDetail] - FY26E | NTD mn - FY27E | NTD mn - FY28E |
|---|---|---|---|---|---|
| Current assets | 86869 | 105298 | 210639 | 364855 | 551785 |
| Cash and cash equivalents | 43753 | 54872 | 134251 | 258452 | 421604 |
| Inventory | 14863 | 17802 | 23877 | 31728 | 38547 |
| Accounts Receivable | 23617 | 27570 | 43321 | 65484 | 82443 |
| Other current assets | 4636 | 5054 | 9190 | 9190 | 9190 |
| Non-current assets | 143978 | 150494 | 169323 | 214829 | 275165 |
| Long-term equity investment | 0 | 0 | 0 | 0 | 0 |
| Fixed assets | 120536 | 125866 | 141984 | 187490 | 247826 |
| Other long-term assets | 23442 | 24628 | 27339 | 27339 | 27339 |
| Total assets | 230847 | 255792 | 379963 | 579683 | 826949 |
| Current liabilities | 58382 | 75455 | 86830 | 95221 | 101481 |
| Accounts Payable | 15112 | 17493 | 20765 | 27592 | 33522 |
| Short-term borrowings | 7188 | 10845 | 7585 | 9149 | 9478 |
| Other current liabilities | 36081 | 47117 | 58480 | 58480 | 58480 |
| Non-current liabilities | 72878 | 73330 | 60201 | 56272 | 53084 |
| Long-term Debt | 32905 | 34873 | 20809 | 16879 | 13692 |
| Other non-current liabilities | 39973 | 38457 | 39392 | 39392 | 39392 |
| Total liabilities | 131260 | 148785 | 147031 | 151493 | 154565 |
| Total Equity | 93265 | 100569 | 232931 | 428191 | 672385 |
| Common stock | 15746 | 16271 | 24089 | 24411 | 16271 |
| Capital Reserves | 15300 | 17003 | 15913 | 15913 | 15913 |
| Retained earnings | 61917 | 66377 | 107161 | 201441 | 340110 |
| Other equities | 6624 | 7356 | 85768 | 186425 | 300090 |
| Total Liabilities & Equity | 230847 | 255792 | 379963 | 579683 | 826949 |
| Cash Flow Statement | FY24 | FY25 | FY26E | NTD mn - FY27E | NTD mn - FY28E |
|---|---|---|---|---|---|
| Operating cash flow | 10294 | 14967 | 62101 | 144908 | 192913 |
| Profit for the year | 5082 | 6674 | 43932 | 94280 | 138669 |
| Depreciation & amortization | 17205 | 18751 | 21328 | 27441 | 36397 |
| Change in working capital | (5232) | (4446) | 4260 | 23187 | 17848 |
| Others | (6761) | (6011) | (7420) | 0 | 0 |
| Investing cash flow | (29230) | (23018) | (21227) | (45505) | (60336) |
| Capex | (26128) | (25617) | (27732) | (45505) | (60336) |
| Change in investment | 0 | 0 | 0 | 0 | 0 |
| Others | (3102) | 2600 | 6505 | 0 | 0 |
| Free cash flow | (15834) | (10650) | 34312 | 99283 | 132454 |
| Financing cash flow | 8336 | 19073 | 38149 | 24798 | 30575 |
| Change in Capital | 0 | 0 | 0 | 0 | 0 |
| Net Change in Debt | (2675) | (5312) | 4527 | 3569 | (1957) |
| Others | 11011 | 24385 | 33622 | 21229 | 32532 |
| Exchange influence | 1494 | 96 | 1233 | 0 | 0 |
| Net increase in cash | (10600) | 11022 | 79023 | 124201 | 163152 |
230847 255792 379963 579683 826949 Key Financial Ratios
| Income Statement | FY24 | FY25 | FY26E | NTD mn - FY27E | NTD mn - FY28E |
|---|---|---|---|---|---|
| Revenue | 115373 | 131240 | 191157 | 303369 | 402242 |
| Cost of sales | (99058) | (112949) | (136058) | (176877) | (222908) |
| Gross profit | 16315 | 18292 | 55099 | 126492 | 179334 |
| Operating Expense | (11265) | (11782) | (18096) | (26353) | (32823) |
| Operating profit | 5051 | 6674 | 37112 | 100275 | 146511 |
| Interest Income | 494 | 183 | 989 | 4549 | 10126 |
| Interest Expense | 0 | 0 | 0 | 0 | 0 |
| Net other Non-op. Income/(Loss) | 2204 | 2153 | 15534 | 11156 | 16733 |
| Pre-tax profit | 7321 | 8827 | 52646 | 111430 | 163245 |
| Income tax | 1765 | 1277 | 7564 | 15978 | 23408 |
| Profit for the year | 5556 | 7550 | 45082 | 95452 | 139837 |
| Minority interest | 474 | 877 | 1150 | 1172 | 1168 |
| Net profit to ord. equity | 5082 | 6673 | 43932 | 94280 | 138669 |
| EPS (NT$) | 3.30 | 4.37 | 28.58 | 60.75 | 89.34 |
| Key Financial Ratios | |||||
|---|---|---|---|---|---|
| Growth | FY24 | FY25 | FY26E | FY27E | FY28E |
| Revenue growth | 11% | 14% | 46% | 59% | 33% |
| Operating profit growth | -43% | 30% | 456% | 170% | 46% |
| Net profit growth | -58% | 31% | 558% | 115% | 47% |
| Profitability | |||||
| Gross profit margin | 14% | 14% | 29% | 42% | 45% |
| Operating Profit Margin | 4% | 5% | 19% | 33% | 36% |
| Net profit margin | 4% | 5% | 23% | 31% | 34% |
| Key Ratio | |||||
| ROA | 2% | 3% | 14% | 20% | 20% |
| ROE | 5% | 6% | 19% | 22% | 21% |
| Stability | |||||
| Gross debt/equity | 13180% | 13904% | 6312% | 3538% | 2299% |
| Interest Coverage | -- | -- | -- | -- | -- |
| Current Ratio | 149% | 140% | 243% | 383% | 544% |
| Quick Ratio | 123% | 116% | 215% | 350% | 506% |
| Net debt/equity | Net Cash | Net Cash | Net Cash | Net Cash | Net Cash |
Rating definitions Benchmark: Hang Seng Index (Hong Kong)
Company ratings Buy
Hold Stock expected to outperform benchmark by more than 10%
Expected stock relative performance ranges between -10% and 10%
Underperform Stock expected to underperform benchmark by more than 10%
Sector ratings Positive
Neutral Sector expected to outperform benchmark by more than 10%
Expected sector relative performance ranges between -10% and 10%
Cautious Sector expected to underperform benchmark by more than 10%
Hong Kong Company
Address GF Securities (Hong Kong) Brokerage Limited
27/F, GF Tower, 81 Lockhart Road, Wan Chai, Hong Kong
Telephone
(852) 37191111
Email jasminebai@gfgroup.com.hk
Disclaimer
This report has been prepared by GF Securities (Hong Kong) Brokerage Limited ('GF Securities (Hong Kong) Brokerage'). According to the laws, regulations and regulatory requirements in different countries and regions, this report is distributed by GF Securities (Hong Kong) Brokerage with relevant legal and compliant operation qualifications in these countries and regions.
GF Securities (Hong Kong) Brokerage is licensed by the Securities and Futures Commission of Hong Kong ('SFC') to conduct Type 4 Regulated Activity 'Advising on Securities'. It is regulated by the SFC, and is responsible for the distribution of this report in Hong Kong. Information about the qualifications of the research analyst(s) who is(are) the author(s) of this report as licensed by the SFC are disclosed in the section where research analyst names are shown.
The research analyst(s) primarily responsible for the content of this report, in whole or in part, certifies that with respect to the company or relevant securities that the analyst(s) covered in this report: 1) all of the views expressed accurately reflect his or her personal views on the company or relevant securities mentioned herein; and 2) no part of his or her remuneration was, is, or will be, directly or indirectly, in connection with his or her specific recommendations or views expressed in this report.
This report is published solely for information purpose and does not constitute an offer to buy or sell any securities or a solicitation of an offer to buy, or recommendation for investment in, any securities.
The securities mentioned in this report may not be allowed to be sold in certain jurisdictions. No action has been taken to permit the distribution of the research report to any person in any jurisdiction that the circulation or distribution of such research report is unlawful. This report is distributed solely to clients or designated institutions authorized by GF Securities (Hong Kong) Brokerage, and is not distributed publicly. It is distributed to certain clients based on the conclusion that they are able to assess investment risks independently, execute investment decisions independently and assume corresponding risks independently.
This report has been issued and based on information obtained from sources generally available to the public and believed by the research analyst(s) to be reliable but which has not been independently verified. No representation or warranty, either express or implied, is made by GF Securities (Hong Kong) Brokerage as to their accuracy and completeness of the information contained in this report. GF Securities (Hong Kong) Brokerage accepts no liability for all loss arising from the use of the materials presented in this report, unless is excluded by applicable laws or regulations. Please be aware of the fact that investments involve risks and the price of securities may be fluctuated and therefore return may be varied, past results do not guarantee future performance. Any recommendation contained in this report does not have regard to the specific investment objectives, financial situation and the particular needs of any individuals. This report is not to be taken in substitution for the exercise of judgment by respective recipients of this report, where necessary, recipients should obtain professional advice before making investment decisions.
GF Securities (Hong Kong) Brokerage may have issued, and may in the future issue, other communications that are inconsistent with, and reach different conclusions from, the information presented in the research report. The points of view, opinions and analytical methods adopted in the research report are solely expressed by the analysts but not that of GF Securities (Hong Kong) Brokerage or its affiliates. The information, opinions and forecasts presented in the research report are the current opinions of the analysts as of the date appearing on this material only which may subject to change at any time without notice. The salesperson, dealer or other professionals of GF Securities (Hong Kong) Brokerage may deliver opposite points of view to their clients and the proprietary trading division with respect to market commentary or dealing strategy either in writing or verbally. The proprietary trading division of GF Securities (Hong Kong) Brokerage may have different investment decision which may be contrary to the opinions expressed in the research report. GF Securities (Hong Kong) Brokerage or its affiliates or respective directors, officers, analysts and employees related to research report business may have rights and interests in securities mentioned in the research report. Recipients should be aware of relevant disclosure of interest (if any) when reading this report.
GF Securities (Hong Kong) Brokerage and its affiliates may be seeking or building business relationships with company(ies) mentioned in this report. Therefore, investors should consider the impact on the independence of this report by GF Securities (Hong Kong) Brokerage and its affiliates due to potential conflicts of interests. Investors should not make any investment decisions based solely on the contents of this report. Investors should make their own investment decisions and bear their own risk. No written or verbal commitment of sharing gains or losses from securities investments in any form shall be effective.
This report may contain and/or describe/present factual historical information on prices of Futures contracts (the 'information'). Please note that this information is solely for the purpose of forming part of the argument/grounds/evidence in our research methodology/analysis to support our conclusion on our view of the relevant industry/company mentioned. It does not, by any means (express or implied) to be associated with or constituted as SFC Type 5 Regulated Activity (Advising on futures contracts).
Disclosure of Interests
- 1) The research analyst(s) and his/her associate has not served as an officer of the company(ies) mentioned in this report, and does not have any financial interests in the company(ies) mentioned in this report.
- 2) GF Securities (Hong Kong) Brokerage and/or its affiliates does not have any financial interests and has not invested in interests aggregate to an amount equal to or more than (i) 1% of the market capitalization; or (ii) 1% of the issued share capital, or issued units, in the company(ies) mentioned in this report.
- 3) GF Securities (Hong Kong) Brokerage and/or its affiliates does not have any market making activities, and has not employed any individual(s) serving as officer(s) of the company(ies) mentioned in this report.
- 4) GF Securities (Hong Kong) Brokerage and/or its affiliates does not have any investment banking relationship in Hong Kong with the company(ies) mentioned in this report in the past 12 months.
Copyright © GF Securities (Hong Kong) Brokerage
Without the prior written consent obtained from GF Securities (Hong Kong) Brokerage, any part of the materials contained herein should not (i) in any forms be copied or reproduced or (ii) be re-disseminated.