PDF 原檔:報告_MS_舊世代記憶體_20260727_original.pdf
圖片清單(已驗證 2026-07-28)
Step 2.5 眼見為憑索引,是 lib/ 嵌圖的唯一真相來源。只挑分類為「真資料圖」且已逐張 Read 者嵌入,圖說照抄「親眼所見內容」。
| 檔名 | size | 分類 | 親眼所見內容 |
|---|---|---|---|
報告_MS_舊世代記憶體_20260727_004.png |
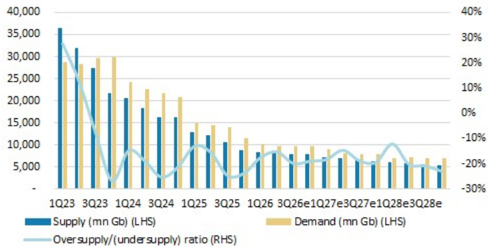
102KB | 真資料圖 | Exhibit 4:DDR4 quarterly supply and demand summary——1Q23~4Q28e 柱狀圖,深藍 Supply (mn Gb)/米黃 Demand (mn Gb) 為左軸,淺藍折線為 Oversupply/(undersupply) ratio 右軸;1Q23 供給約 36,000 明顯高於需求,2025 後供需柱體收斂至 5,000-10,000 區間、比率折線落在 -20% 附近 |
報告_MS_舊世代記憶體_20260727_002.png |
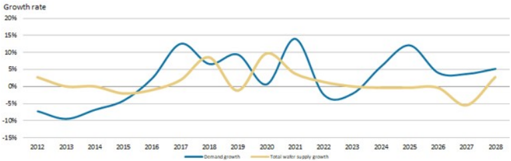
51KB | 真資料圖 | Exhibit 2:NOR flash demand and supply growth rates——2012-2028 雙折線圖,深藍 Demand growth/黃色 Total wafer supply growth,需求成長於 2017、2021、2025 出現高峰(約 +10~13%),供給成長多數年份維持 0~5% |
報告_MS_舊世代記憶體_20260727_003.png |
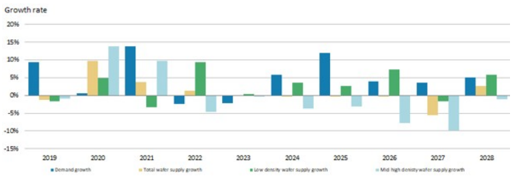
43KB | 真資料圖(未逐張 Read) | Exhibit 3:NOR flash demand growth and supply growth by density |
報告_MS_舊世代記憶體_20260727_005.png |
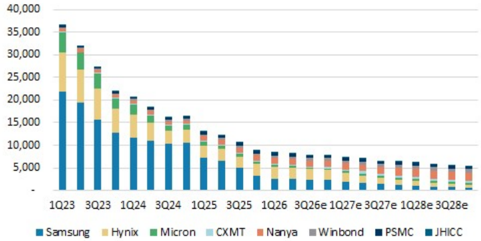
85KB | 真資料圖(未逐張 Read) | Exhibit 6:Quarterly supply breakdown (mn Gb) |
報告_MS_舊世代記憶體_20260727_006.png |
71KB | 真資料圖(未逐張 Read) | Exhibit 8:DDR4 8Gb (1Gx8) pricing chart(DRAMeXchange,資料至 2026 年 6 月) |
報告_MS_舊世代記憶體_20260727_007.png |
116KB | 真資料圖(未逐張 Read) | Exhibit 5:Quarterly oversupply/undersupply ratio vs. Nanya and Winbond pricing Q/Q change |
報告_MS_舊世代記憶體_20260727_008.png |
91KB | 真資料圖(未逐張 Read) | Exhibit 7:Quarterly demand breakdown by product (mn Gb) |
報告_MS_舊世代記憶體_20260727_009.png |
98KB | 真資料圖(未逐張 Read) | Exhibit 9:DDR5 16Gb (2Gx8) pricing chart(DRAMeXchange,資料至 2026 年 6 月) |
報告_MS_舊世代記憶體_20260727_001.png |
64KB | 裝飾·logo·banner | MS 報告「Asia Summer School 2026」泳池 banner(同款已於貿聯報告逐張 Read 確認) |
逐張 Read 驗證 2 張(_002/_004);其餘 Exhibit 依標題做範圍性驗證。
原始內容
M July 27, 2026 09:00 PM GMT
Greater China Semiconductors | Asia Pacific
Old Memory: Divergent Trends in the Near Term
Recent memory cycle debate + CSP FCF concern + China memory position offload have caused a derating of old memory stocks, but we see stronger DDR4 pricing hikes and unprecedented legacy flash pricing power into 3Q. We think 1.0x 2028E BVPS offers good downside support.
Changing tide on mainstream memory: According to Trendforce ( Exhibit 1 ), 3Q26 conventional DRAM mixed pricing is expected to increase by 13-18% Q/Q. Specifically, PC DDR5 pricing is seen rising by 15-20% Q/Q, server DDR5 pricing by 13-18% Q/Q, mobile LPDDR5(X) by 8-13% Q/Q, and NAND pricing by 10-15% Q/Q. Further, for 4Q26, Trendforce estimates price hikes of 3-8% Q/Q for conventional DRAM and 0-5% Q/Q for NAND. These estimated growth rates seem lower than some investors previously expected.
Yet, recently, we've seen stronger legacy memory pricing: Similar to our prior note (link), we believe DDR4 could enjoy continued monthly pricing hikes in 3Q. Compared to our pricing expectations one month ago, we believe CSPs are willing to offer higher pricing on DDR4 and may even try to sign a 1-2 year LTA (volume only) with suppliers. As a result, we believe monthly pricing could rise by 20%+ in 3Q, suggesting the Q/Q pricing hike could be 30% at least. We also continue to expect a 50-60% Q/Q price hike for SLC/MLC NAND in 3Q, and a 30-40% Q/Q price hike for NOR flash in 3Q.
Position offload in A share likely to see some stabilization: GigaDevice issued an announcement (link) that the company's niche memory products may see substantial price declines in the future. We see this warning as a potential longer term trend, rather than a near-term possibility, as we continue to see a structural supply gap across DDR4, SLC/MLC NAND, and NOR flash, supporting continued strong price hikes.
What is the downside support? GigaDevice (603986.SS): as a design house, it is hard to gauge the P/E floor, but the stock has already corrected 45.6% from its peak of Rmb840 as of Jun 29, providing some valuation support. Macronix/Nanya/ Winbond trade at 1.5x/1.2x/1.2x 2028E BVPS, respectively; 1.0x historically has been a strong downside support level for greater China IDM companies.
Idea
| Morgan Stanley Taiwan Limited+ Daniel Yen, CFA Equity Analyst Daniel.Yen@morganstanley.com | +886 2 2730-2863 |
|---|---|
| Charlie Chan Equity Analyst Charlie.Chan@morganstanley.com Morgan Stanley Asia Limited+ | +886 2 2730-1725 |
| Daisy Dai, CFA Equity Analyst Daisy.Dai@morganstanley.com | +852 2848-7310 |
| Tiffany Yeh Equity Analyst Tiffany.Yeh@morganstanley.com | +886 2 7712-3032 |
| Ethan Jia Research Associate Ethan.Jia@morganstanley.com | +852 3963-2287 |

Greater China Technology Semiconductors
Asia Pacific
Industry View
Attractive
Morgan Stanley does and seeks to do business with companies covered in Morgan Stanley Research. As a result, investors should be aware that the firm may have a conflict of interest that could affect the objectivity of Morgan Stanley Research. Investors should consider Morgan Stanley Research as only a single factor in making their investment decision.
For analyst certification and other important disclosures, refer to the Disclosure Section, located at the end of this report.
+= Analysts employed by non-U.S. affiliates are not registered with FINRA, may not be associated persons of the member and may not be subject to FINRA restrictions on communications with a subject company, public appearances and trading securities held by a research analyst account.
Growth rate
20%
15%
10%
5%
0%
-5%
-10%
-15%
density
Growth rate
20%
M
2012 2013
2014 2015 2016 2017|
2018
2019 2020
2021 2022 2023 2024
2025
2026
2027
Total water sudely growth
Key Charts and Exhibits
Exhibit 1: Latest pricing forecast for DRAM and NAND
| 1Q26 | 2Q26 | 3Q26E - Old | 3Q26E - New | 4Q26E - Old | 4Q26E - New | |
|---|---|---|---|---|---|---|
| PC DRAM | DDR4: up 120-125% DDR5: up 110-115% Blended ASP: up 110-115% | DDR4: up 35-40% DDR5: up 45-50% Blended ASP: up 45-50% | up 3-8% | DDR4: up 15-20% DDR5: up 15-20% Blended ASP: up 15-20% | up 0-5% | up 3-8% |
| Server DRAM | DDR4: up 95-100% DDR5: up 93-98% Blended ASP: up 93-98% | DDR4: up 50-55% DDR5: up 53-58% Blended ASP: up 53-58% | up 10-15% | DDR4: up 13-18% DDR5: up 13-18% Blended ASP: up 13-18% | up 3-8% | up 3-8% |
| Mobile DRAM | LPDDR4X: up 58-63% LPDDR5(x): up 58-63% | LPDDR4X: up 73-78% LPDDR5(x): up 80-85% | up 3-8% | LPDDR4X: up 8-13% LPDDR5(x): up 8-13% | up 0-5% | up 0-5% |
| Graphics DRAM | GDDR6: up 95-100% GDDR7: up 95-100% | GDDR6: up 30-35% GDDR7: up 40-45% | GDDR6: up 3-8% GDDR7: up 10-15% | GDDR6: up 15-20% GDDR7: up 15-20% | GDDR6: up 0-5% GDDR7: up 3-8% | GDDR6: up 0-5% GDDR7: up 3-8% |
| Consumer DRAM | DDR3: up 75-80% DDR4: up 75-80% | DDR3: up 55-60% DDR4: up 55-60% | up 10-15% | DDR3: up 35-40% DDR4: up 28-33% | up 3-8% | up 3-8% |
| Total DRAM | Conventional DRAM: up 93- 98% HBM Blended: up 83-88% | Conventional DRAM: up 58- 63% HBM Blended: 53-58% | Conventional DRAM: up 8-13% | Conventional DRAM: up 13- 18% HBM Blended: 8-13% | Conventional DRAM: up 3-8% | Conventional DRAM: up 3-8% |
| 1Q26 | 2Q26 | 3Q26E - Old | 3Q26E - New | 4Q26E - Old | 4Q26E - New | |
| eMMC UFS | up 95-100% | up 75-80% | up 5-10% | up 5-10% | mostly flat | mostly flat |
| Enterprise SSD | up 75-80% | up 48-53% | up 13-18% | up 18-23% | up 3-8% | up 3-8% |
| Client SSD | up 105-110% | up 70-75% | up 5-10% | up 13-18% | mostly flat | mostly flat |
| 3D NAND Wafers (TLC & QLC) | up 75-80% | up 28-33% | up 5-10% | up 5-10% | mostly flat | mostly flat |
| Total NAND Flash | up 85-90% | up 55-60% | up 8-13% | up 10-15% | up 0- 5% | up 0- 5% |
Source: Trendforce, Morgan Stanley Research estimates
Exhibit 2: NOR flash demand and supply growth rates
Source: Company data, Morgan Stanley Research
2028
-10%
-15%
un nast uclanu growul anu supply growulky
2028
Exhibit 3: NOR flash demand growth and supply growth by density
Source: Company data, Morgan Stanley Research
LAmbit.
allu villbone plicly are chlanye
USS
40,000
40,000
30,000
35
80%
35,000
35,000
60%
25,000
30,000
30,000
30
20,000
40%
25,000
25,000
20,000
20%
25
20,000
15,000
0%
10,000
15,000
15,000
20
-20%
15
10,000
10,000
5,000
5,000
-40%
5,000
10
-60%
5
• Smartphone
Chas. Camnonu dota MAneaon (tanlou Descorch (al antimatad
Jan-19
CAIrAA. NDAMAVAhAnAA MlArMAn CtAnlAN DAGnArAh MAtA do Af luI OAnEI
quartelly dellallu vicanuowilly product (row)
Junt yuartetly supply allu vellanu summlaly quartelly supply vi canuown (lar o)
Junt oul (luxo) plicity Chall
DDR4 8Gb - 1Gx8 2666Mbps
29.08
40%
30%
M
20,00
Exhibit 4: DDR4 quarterly supply and demand summary
-30%
Source: Company data, IDC, Morgan Stanley Research (e) estimates
Exhibit 6: Quarterly supply breakdown (mn Gb)
Source: Company data, Morgan Stanley Research (e) estimates
Exhibit 8: DDR4 8Gb (1Gx8) pricing chart
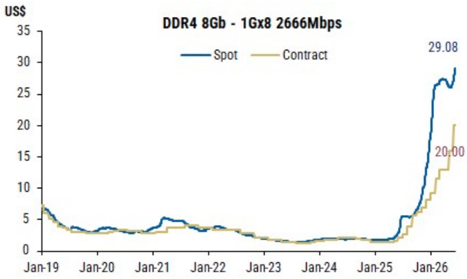
Source: DRAMeXchange, Morgan Stanley Research. Data as of Jun 2026.
USS
48.0
43.0
38.0 -
33.0 -
28.0
23.0
18.0 -
13.0 -
8.0 1
3.0 +
Juno loul <uxo, plichly Chlalt
DDR5 16G (2Gx8) 4800/5600
- Spot
Contract
45.00
37.50
Exhibit 5: Quarterly oversupply/undersupply ratio vs. Nanya and Winbond pricing Q/Q change
Mar-23
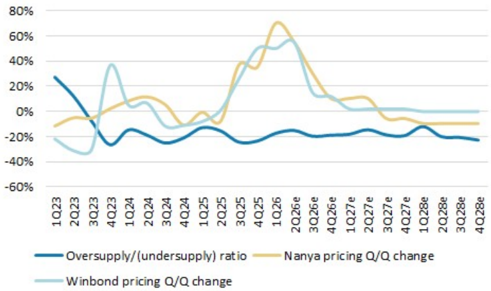
Source: Company data, IDC, Morgan Stanley Research (e) estimates
Exhibit 7: Quarterly demand breakdown by product (mn Gb)
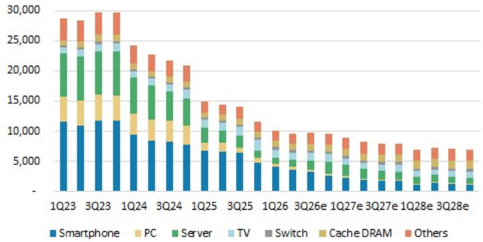
Source: IDC, Morgan Stanley Research (e) estimates
Exhibit 9: DDR5 16Gb (2Gx8) pricing chart
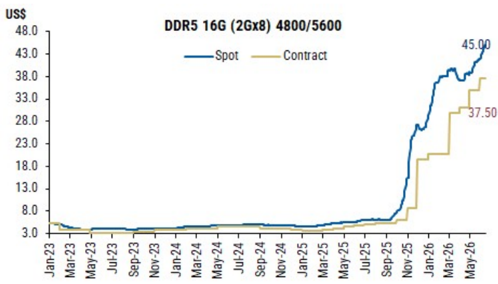
Source: DRAMeXchange, Morgan Stanley Research. Data as of Jun 2026.
Idea
M
Disclosure Section
The information and opinions in Morgan Stanley Research were prepared or are disseminated by Morgan Stanley Asia Limited (which accepts the responsibility for its contents) and/or Morgan Stanley Asia (Singapore) Pte. (Registration number 199206298Z) and/or Morgan Stanley Asia (Singapore) Securities Pte Ltd (Registration number 200008434H), regulated by the Monetary Authority of Singapore (which accepts legal responsibility for its contents and should be contacted with respect to any matters arising from, or in connection with, Morgan Stanley Research), and/or Morgan Stanley Taiwan Limited and/or Morgan Stanley & Co International plc, Seoul Branch, and/or Morgan Stanley Australia Limited (A.B.N. 67 003 734 576, holder of Australian financial services license No. 233742, which accepts responsibility for its contents), and/or Morgan Stanley Wealth Management Australia Pty Ltd (A.B.N. 19 009 145 555, holder of Australian financial services license No. 240813, which accepts responsibility for its contents), and/or Morgan Stanley India Company Private Limited having Corporate Identification No (CIN) U22990MH1998PTC115305, regulated by the Securities and Exchange Board of India ('SEBI') and holder of licenses as a Research Analyst (SEBI Registration No. INH000001105); Stock Broker (SEBI Stock Broker Registration No. INZ000244438), Merchant Banker (SEBI Registration No. INM000011203), and depository participant with National Securities Depository Limited (SEBI Registration No. IN-DP-NSDL-567-2021) having registered office at Altimus, Level 39 & 40, Pandurang Budhkar Marg, Worli, Mumbai 400018, India; Telephone no. +91-22-61181000; Compliance Officer Details: Mr. Tejarshi Hardas, Tel. No.: +91-22-61181000 or Email: tejarshi.hardas@morganstanley.com; Grievance officer details: Mr. Tejarshi Hardas, Tel. No.: +91-22-61181000 or Email: msic-compliance@morganstanley.com which accepts the responsibility for its contents and should be contacted with respect to any matters arising from, or in connection with, Morgan Stanley Research, and their affiliates (collectively, "Morgan Stanley"). Morgan Stanley India Company Private Limited (MSICPL) may use AI tools in providing research services. All recommendations contained herein are made by the duly qualified research analysts.
For important disclosures, stock price charts and equity rating histories regarding companies that are the subject of this report, please see the Morgan Stanley Research Disclosure Website at www.morganstanley.com/eqr/disclosures/webapp/generalresearch, or contact your investment representative or Morgan Stanley Research at 1585 Broadway, (Attention: Research Management), New York, NY, 10036 USA.
For valuation methodology and risks associated with any recommendation, rating or price target referenced in this research report, please contact the Client Support Team as follows: US/Canada +1 800 303-2495; Hong Kong +852 2848-5999; Latin America +1 718 754-5444 (U.S.); London +44 (0)20-7425-8169; Singapore +65 6834-6860; Sydney +61 (0)2-9770-1505; Tokyo +81 (0)3-6836-9000. Alternatively you may contact your investment representative or Morgan Stanley Research at 1585 Broadway, (Attention: Research Management), New York, NY 10036 USA.