PDF 原檔:報告_MS_聯發科2454_3Q26前瞻_20261028_original.pdf
原始內容
M Idea October 28, 2026 08:50 AM GMT
MediaTek | Asia Pacific
3Q26 results preview - all eyes on AI ASIC development
MediaTek remains competitive in the AI ASIC service industry iven stron execution and desi n capability. We look forward to 3Q26 updates.
We expect US$2bn revenue of AI ASIC in 4Q26: MediaTek will host its 3Q26 earnings call on 10/30 Friday. It posted 10% Q/Q growth in preli inary 3Q26 revenue. Into 4Q26, given weak s artphone and consu er (eg. TV) de and, we expect non-AI revenue to decline 10%-20% Q/Q. That said, thanks to US$2bn of TPU v8t (ZebraFish) ass production, we expect 4Q26 revenue to grow 30%-40% Q/Q. For gross argin, we expect 4Q26 to decline to 44-45%, as AI ASIC will likely dilute the corporate argin. Please see Exhibit 1 for our earnings preview.
Key focu for the call - all about AI ASIC ( ee next ection for 2028 AI ASIC):
- 2027 AI ASIC TAM and MediaTek' market hare: We expect MediaTek to odestly raise its 2027 AI ASIC TAM or arket share outlook, given better visibility on TPU v8t (ZebraFish) CoWoS and substrate supply. Our Asia supply chain checks suggest 180k of CoWoS capacity could be allocated to TPU v8t, supporting production of 3.6 n units, of which we assu e 3 n units will be recognized as MediaTek revenue in 2027. If substrate availability i proves, we believe TSMC's CoWoS allocation to the TPU v8t could increase to 200k-220k units.
- Google TPU v9 tatu (covered by Brian Nowak): This project is MediaTek's ajor 2028 revenue driver, and where investors appeared concerned, given uncertainty around Intel (covered by Joe Moore) EMIB-T substrate supply. We expect Mediatek to share that the TPU v9 (Hu uFish) project is roughly on schedule for early 2027 tape-out, with high-volu e production starting in early 2028, as previously guided. We previously discussed the possibility of MediaTek using TSMC's CoWoS to help with any 2028 TPU production concerns, and TSMC anage ent indicated they would be willing to help custo ers to s ooth production if they were struggling with EMIB-T supply. If MediaTek did want to tape out another CoWoS packaging version of TPU v9, we believe it could take around a year based on existing nor s. Whether MediaTek adopts CoWoS for TPU v9, or waits for the next generation (IceFish, or TPU v10) as a back-up, it currently is only using EMIB-T.
- Google TPU v10 competition: As we described in Google ASIC, who gets what for design services?, we see GUC and Alchip as partners for MediaTek coordinating around the TPU v10 IceFish design service.
- Second cu tomer win? In our Nvidia partnership note, we saw a higher chance of MediaTek winning a second or even third CSP custo er (MediaTek had indicated it was engaging with so e custo ers, Aug. 31 interview). MediaTek ay also consider China CSP projects if its 3n wafer allocation is sufficient for 2027-28, and projects co ply with US design and TSMC production guidelines.
| Morgan Stanley Taiwan Limited+ Charlie Chan Equity Analyst C arlie.C an@morganstanley.com | +886 2 2730-1725 |
|---|---|
| Daniel Yen, CFA Equity Analyst Daniel.Yen@morganstanley.com Morgan Stanley Asia Limited+ | +886 2 2730-2863 |
| Daisy Dai, CFA Equity Analyst Daisy.Dai@morganstanley.com | +852 2848-7310 |
| Morgan Stanley Taiwan Limited+ Lucas Wang Equity Analyst Lucas.Wang@morganstanley.com | +886 2 2730-2875 |
| Morgan Stanley Asia Limited+ Henry Zhao Equity Analyst Henry.Z ao@morganstanley.com | +852 2239-7731 |
| Ethan Jia Researc Associate Et an.Jia@morganstanley.com | +852 3963-2287 |
Morgan Stanley appreciates your support in the 2027 Extel Asia Research Survey. Voting opens 10 Novem er 2026.
MediaTek(2454.TW, 2454 TT)
Top Pick
Greater China Technology Semiconductors | Taiwan
| Stock Rating - Industry View | Overweight | Overweight - ttractive | ||
|---|---|---|---|---|
| Price target | NT$6,188.00 | |||
| Up/downside to price target | (%) | 46 | ||
| hr price, close (Oct 28, 2026) | NT$4,235.00 | |||
| 52-Week Range | NT$5,480.00- | |||
| 1,130.00 | ||||
| h out, dil, curr (mn) | 1,565 | |||
| Mkt cap, curr (mn) | NT$6,628,557 | |||
| EV, curr (mn) | NT$6,413,028 | |||
| Avg daily trading value (mn) | NT$29,582 | |||
| Fiscal Year Ending | 12/25 | 12/26e | 12/27e | 12/28e |
| EP (NT$)** | 66.17 | 73.35 | 146.97 | 342.37 |
| Prior EP (NT$)** | - | - | - | - |
| EP (NT$)§ | 66.05 | 69.29 | 148.34 | 283.61 |
| Revenue, net (NT$ bn) | 596.0 | 671.91,095.62,315.2 | ||
| ModelWare net inc (NT | 105.3 | 116.8 | 233.8 | 545.3 |
| $ bn) |
Morgan Stanley does and seeks to do business with companies covered in Morgan Stanley Research. As a result, investors should be aware that the firm may have a conflict of interest that could affect the objectivity of Morgan Stanley Research. Investors should consider Morgan Stanley Research as only a single factor in making their investment decision.
For analyst certification and other important disclosures, refer to the Disclosure Section, located at the end of this report.
= Analysts employed by non-U.S. affiliates are not registered with FINRA, may not be associated persons of the member and may not be subject to FINRA restrictions on communications with a subject company, public appearances and trading securities held by a research analyst account.
M Idea
| ROE (%) | 26.0 | 28.5 | 48.8 | 78.6 |
|---|---|---|---|---|
| Div yld (%) | 5.3 | 1.4 | 2.8 | 6.5 |
Unless otherwise noted, all metrics are based on Morgan tanley ModelWare framework
** = Based on consensus methodology
§ = Consensus data is provided by Refinitiv Estimates
e = Morgan tanley Research estimates M Idea
lphaSignals Earnings Preview
| Focus KPI | Focus KPI urprise | Likely impact to consensus EP * |
|---|---|---|
| MediaTek 2454.TW | ||
| 4Q26/2027 TPU Revenue Contribution Guidance | In-line | Largely unchanged |
M Idea
MediaTek still sees stron 2027/28 TPU production
- Introduction of 2028 AI ASIC TAM and market hare? The co pany ay leave this guidance to next ti e, once it has better visibility into its TPU v9 volu e in 2028, which could be highly dependent on Intel EMIB-T substrate yield i prove ent. The co pany ay also have better visibility on the possibility of a second custo er win at that ti e.
Keep OW and ector Top Pick: Over the past onth, we haven't see funda ental changes to our invest ent thesis or 2027/2028 earnings assu ptions. The stock trades at only 27x our 2028e EPS, which is attractive. Our target price of NT$6,188 still i plies 54% upside. We don't expect the co pany to announce a second custo er or introduce its 2028 AI ASIC guidance this ti e, but if it does, it could be a ajor catalyst.
MTK 3Q26 earning and 4Q26 guidance preview - revenue pull forward into 3Q26: 3Q26 preli inary revenue beat MSe, Visible Alpha consensus, and its guidance, given the s artphone de and pull forward fro 4Q26 to 3Q26 as the co pany has been reflecting its new pricing fro Septe ber. We expect TPU to be the ain growth driver for 4Q26 revenue while non-TPU revenue could see a QoQ decline into 4Q26, given the de and pull forward and consu er de and weakness.
Exhibit 1: MTK: 3Q26 earnings and 4Q26 guidance preview
| (NT$ bn) | 3Q26 - Guidance | 3Q26 - Preliminary | 3Q26 - MS Est. | 3Q26 - Consensus | 4Q26 - Guidance | 4Q26 - MS Est. | 4Q26 - Consensus |
|---|---|---|---|---|---|---|---|
| Revenue | NT$152.2bn to NT159.8bn (flat to up 5% Q/Q) | 168.1 | 154.6 | 162.2 | 215.9 | 211.2 | |
| Q/Q | 6.6% | 39.7% | 30.2% | ||||
| Y/Y | 14.1% | 43.8% | 40.6% | ||||
| GM (%) | 44.5% - 47.5% | 46.0% | 46.1% | 43.9% | 45.0% | ||
| OPEX ratio | 29.0% - 33.0% | 30.2% | 30.3% | 22.4% | 27.0% | ||
| OPM | 15.8% | 15.8% | 21.5% | 18.1% | |||
| EPS (NT$) | 15.60 | 16.16 | 27.26 | 23.19 |
Source: Company Data, Visible Alp a, Morgan Stanley Researc estimates
1. Substrate supply is the key, not demand, for MediaTek production for Google TP s
TSMC CoWoS could upport 2nm (Humufi h) MediaTek' production for TPU in 2028:
In our earlier report, MediaTek: 2Q26 results preview: S artphone weak, but Cloud AI taking off; OW (26 Jul 2026), we noted that, in our view, MediaTek ight secure a portion of CoWoS capacity for 2n TPUs to ensure ini u volu e production. However, we believe, in-line with MediaTek's intention, it will use EMIB-T fro Intel as the pri ary solution to reduce costs and scale volu e in 2028, if execution proceeds well.
During TSMC's earlier earnings call, TSMC anage ent shared that it was willing to help custo ers that ay be struggling with Intel EMIB-T supply to s ooth production, which suggested to us that it would be willing to offer support even if CoWoS were the back-up/ second source. However, our recent industry checks suggest that MediaTek ay not need to adopt TSMC CoWoS for its TPU v9 as the EMIB-T substrate (for v9) output is tracking its plan. If MediaTek did decide to use CoWoS, we believe the tape-out of the CoWoS version of TPU v9 could take a year, based on previous nor s.
CoWoS con traint ea ed, but ABF ub trate upply till the gating factor for TPU production bull ca e: In our recent AI supply chain tracker, we noted that MediaTek's 180k CoWoS-S bookings i ply ~3.6 units of TPU 8t (ZebraFish) in 2027, above our original M Idea
3 n ship ent assu ption. However, we continue to bake in so e conservatis as we had assu ed ABF substrate shortages. So, we still forecast 3 n units in 2027.
Exhibit 2: Our MediaTek production volume forecasts (v8t, v9, and v10) for Google TPUs, based on our Asia supply c ain c ecks
| k Units | 2023 | 2024 | 2025e | 2026e | 2027e | 2028e |
|---|---|---|---|---|---|---|
| v5 | 500 | 2,400 | 250 | |||
| v6 (Trillium) | 1,200 | |||||
| v8t (Zebrafish; 3nm, by MediaTek) | 500 | 3,000 | 2,000 | |||
| v9 (Humufish; 2nm EMIB-T, by MediaTek) | 3,000 | |||||
| v10 (Icefish; 1.4nm, by MediaTek) | unknown | |||||
| Total | 500 | 2,400 | 1,750 | 3,300 | 7,500 | >9000 |
Source: Morgan Stanley Asia-Pacific Researc estimates
2. Could MediaTek add second and third AI ASIC customers?
Through the NVLink Fusion platfor , MediaTek's XPU custo ers can leverage NVIDIA's (covered by Joe Moore) scale-up and scale-out networking technologies to build AI server syste s. Our Asia supply chain checks suggest MediaTek ay target subsyste builds for a second CSP custo er rather than supplying the XPU itself. To account for the i pact of the NVLink Fusion platfor , we now assu e an initial revenue contribution in 2028, based on approxi ately 100k subsyste units at an ASP of US$25k, which is a rough esti ate based on aterials needed, including HBM.
We therefore assu e a US$2.5bn revenue contribution in 2028, based on 100k units and an ASP of US$25k, including HBM chip consign ent, known-good dies (KGDs) for co pute chips, and chiplets.
On argin trends, anage ent highlighted continued value creation for custo ers across both silicon and packaging design. As a result, we expect ASICs to re ain accretive to operating argins. At the gross argin level, anage ent indicated that argins vary by project, potentially reflecting support for full-rack syste s. We odel 2n TPU gross argins for MediaTek at c.35% (vs. c.40% for 3n TPUs) given the larger revenue scale. We continue to expect operating argins of ~20-25%, above the s artphone business unit's 15-20%.
Exhibit 3: NVLink Fusion to support connection wit custom ASIC
Source: Nvidia M Idea
Exhibit 4: MediaTek AI ASIC/subsystem revenue projections
| 2027e | 2028e | 2029e | ||
|---|---|---|---|---|
| TPU v8t (Zebrafish) | 3 | 2 | ||
| Volume (mn) | TPU v9 (Humufish; EMIB-T) | 3 | 4 | |
| TPU v10 (Icefish) | 1 | |||
| 2nd Customer Subsystem | 0.1 | 0.5 | ||
| TPU v8t | 4.5 | 4.5 | ||
| Chip ASP Recognized by | TPU v9; EMIB-T | 13 | 13 | |
| MediaTek (US$k) | TPU v10 | 18 | ||
| 2nd Customer Subsystem | 25 | 25 | ||
| TPU v8t | 13.5 | 9 | ||
| TPU v9; EMIB-T | 39 | 52 | ||
| Revenue (US$bn) | TPU v10 | 18 | ||
| Total TPU Revenue | 13.5 | 48 | 70 | |
| 2nd Customer Subsystem | 2.5 | 12.5 | ||
| Total MediaTek Revenue (US$bn) | Total MediaTek Revenue (US$bn) | 35 | 75 | NA |
| AI ASIC Revenue % | AI ASIC Revenue % | 38% | 68% | NA |
Source: Morgan Stanley Researc estimates
3. Why could TSMC be motivated to support MediaTek and Google?
TSMC's CoWoS-L solution carries a structurally higher cost vs. EMIB due to its larger reticle size, as we discussed in The Foundry Floorplan: TSMC preview update; CoWoS vs. EMIB co petition (14 Apr 2026). We think TSMC ay want to address the growing co petition fro Intel's EMIB-T, for which we esti ate 40-45k wafer equivalent capacity in 2028 based on our Asia supply chain checks, i plying a 10-15% share of the 2.5D packaging arket.
For MediaTek to adopt TSMC's CoWoS-L as a second source alongside EMIB-T, the RDL (redistribution layer) connection to the interposer requires tape-out of three additional photo ask layers. However, our Asia channel checks suggest that Google ay be willing to absorb the incre ental costs associated with dual sourcing, which could allow MediaTek to sustain its gross argin.
Exhibit 5: Total 2.5D packaging production capacity from 2026-28 (excluding EMIB-M, w ic is mainly for CPU production), based on Asia supply c ain c ecks
Total 2.5D Packaging Capacity (Average)
Source: Morgan Stanley Asia-Pacific Researc (e) estimates
M Idea
Exhibit 6: TSMC's roadmap for interposer size
Source: Winway, TSMC
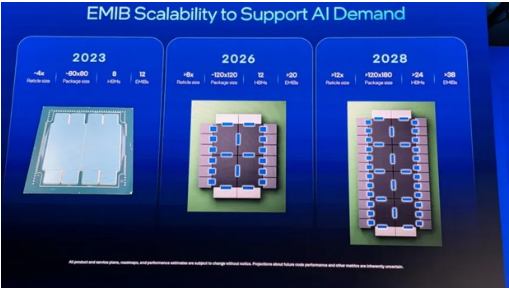
We think MediaTek may produce 3mn units for TP v9 shipments in 2028 with support from Intel's EMIB-T
Based on Asia supply chain checks, average EMIB-T capacity is around 5kwp in 2026, which we expect to further scale to 15-20kwp in 2027 and 40-45kwp in 2028. All of the capacity entioned above is converted for 12-inch wafer equivalent for custo ers' easier understanding co pared with TSMC's CoWoS capacity.
Although so e s all projects are ongoing, we still see MediaTek/Google Hu ufish consu ing ost of the capacities during 2027-28. We now expect MediaTek to produce 3 n units of TPUv9 (Hu ufish) with support fro Intel's EMIB-T fro late 2027-2028.
We see the current average EMIB-M capacity at 110kwp , based on supply chain checks, which could slightly decrease to 95kwp in 2027 as Intel is converting so e capacities into EMIB-T.
M Idea
Exhibit 7: Intel's EMIB could support larger c ips wit more reticles (>12x) if its supply c ain execution proceeds well
Source: Intel
M Idea
Quarterly financials
Exhibit 8: MediaTek: Quarterly financials
| (NT$ mn) | 1Q26 | 2Q26 | 3Q26e | 4Q26e | 1Q27e | 2Q27e | 3Q27e | 4Q27e | 2024 | 2025 | 2026e | 2027e | 2028e |
|---|---|---|---|---|---|---|---|---|---|---|---|---|---|
| Total revenues | 149,151 | 152,183 | 154,613 | 215,935 | 221,504 | 242,352 | 292,895 | 338,804 | 530,586 | 595,966 | 671,881 | 1,095,554 | 2,315,233 |
| Q/Q Change | -0.7% | 2.0% | 1.6% | 39.7% | 2.6% | 9.4% | 20.9% | 15.7% | |||||
| Y/Y Change | -2.7% | 1.2% | 8.8% | 43.8% | 48.5% | 59.3% | 89.4% | 56.9% | 22.4% | 12.3% | 12.7% | 63.1% | 111.3% |
| Cost of Sales | 80,095 | 81,875 | 83,500 | 121,100 | 126,907 | 139,384 | 170,328 | 197,427 | 267,200 | 312,886 | 366,570 | 634,046 | 1,432,931 |
| Percent of Revenues | 53.7% | 53.8% | 54.0% | 56.1% | 57.3% | 57.5% | 58.2% | 58.3% | 50.4% | 52.5% | 54.6% | 57.9% | 61.9% |
| Gross Profit | 69,055 | 70,308 | 71,113 | 94,835 | 94,596 | 102,968 | 122,566 | 141,378 | 263,386 | 283,080 | 305,311 | 461,508 | 882,302 |
| Gross Margin | 46.3% | 46.2% | 46.0% | 43.9% | 42.7% | 42.5% | 41.8% | 41.7% | 49.6% | 47.5% | 45.4% | 42.1% | 38.1% |
| Incremental Margin | NM | 41% | 33% | 39% | -4% | 40% | 39% | 41% | 58% | 30% | 29% | 37% | 35% |
| Total Opex | 46,165 | 47,440 | 46,723 | 48,456 | 47,988 | 48,809 | 50,572 | 52,120 | 160,974 | 179,610 | 188,783 | 199,489 | 251,991 |
| Percent of Revenues | 31.0% | 31.2% | 30.2% | 22.4% | 21.7% | 20.1% | 17.3% | 15.4% | 30.3% | 30.1% | 28.1% | 18.2% | 10.9% |
| R&D | 38,345 | 39,361 | 39,411 | 39,511 | 39,550 | 39,750 | 39,950 | 40,150 | 131,993 | 148,306 | 156,627 | 159,400 | 178,210 |
| Percent of Revenues | 25.7% | 25.9% | 25.5% | 18.3% | 17.9% | 16.4% | 13.6% | 11.9% | 24.9% | 24.9% | 23.3% | 14.5% | 7.7% |
| General & Adm Exp. | 2,805 | 3,397 | 3,447 | 3,547 | 2,900 | 3,000 | 3,300 | 3,500 | 11,891 | 10,856 | 13,195 | 12,700 | 15,900 |
| Percent of Revenues | 1.9% | 2.2% | 2.2% | 1.6% | 1.3% | 1.2% | 1.1% | 1.0% | 2.2% | 1.8% | 2.0% | 1.2% | 0.7% |
| Selling Expenses | 5,015 | 4,682 | 3,865 | 5,398 | 5,538 | 6,059 | 7,322 | 8,470 | 17,090 | 20,448 | 18,961 | 27,389 | 57,881 |
| Percent of Revenues | 3.4% | 3.1% | 2.5% | 2.5% | 2.5% | 2.5% | 2.5% | 2.5% | 3.2% | 3.4% | 2.8% | 2.5% | 2.5% |
| Operating Income | 22,891 | 22,868 | 24,390 | 46,379 | 46,609 | 54,159 | 71,994 | 89,257 | 102,412 | 103,470 | 116,528 | 262,019 | 630,311 |
| Operating Margin | 15.3% | 15.0% | 15.8% | 21.5% | 21.0% | 22.3% | 24.6% | 26.3% | 19.3% | 17.4% | 17.3% | 23.9% | 27.2% |
| Total Non-operating Income (loss) | 4,129 | 5,094 | 5,050 | 5,050 | 3,750 | 3,750 | 3,750 | 3,750 | 17,107 | 21,418 | 19,322 | 15,000 | 15,000 |
| Profit Before Taxes | 27,019 | 27,962 | 29,440 | 51,429 | 50,359 | 57,909 | 75,744 | 93,007 | 119,519 | 124,888 | 135,851 | 277,019 | 645,311 |
| Percent of Revenues | 18.1% | 18.4% | 19.0% | 23.8% | 22.7% | 23.9% | 25.9% | 27.5% | 22.5% | 21.0% | 20.2% | 25.3% | 27.9% |
| Change vs Year Ago | -22% | -16% | -2% | 89% | 86% | 107% | 157% | 81% | 37.7% | 4.5% | 8.8% | 103.9% | 132.9% |
| Taxes | 2,643 | 3,357 | 4,563 | 7,972 | 7,806 | 8,976 | 11,740 | 14,416 | 12,378 | 18,770 | 18,534 | 42,938 | 100,023 |
| Tax Rate | 9.8% | 12.0% | 15.5% | 15.5% | 15.5% | 15.5% | 15.5% | 15.5% | 10.4% | 15.0% | 13.6% | 15.5% | 15.5% |
| Minor interest | 222 | 270 | 0 | 0 | 0 | 0 | 0 | 0 | 754 | 798 | 493 | 270 | 0 |
| Total Net Income to Parent | 24,154 | 24,335 | 24,877 | 43,458 | 42,553 | 48,933 | 64,004 | 78,591 | 106,387 | 105,319 | 116,823 | 233,811 | 545,288 |
| Percent of Revenues | 16.2% | 16.0% | 16.1% | 20.1% | 19.2% | 20.2% | 21.9% | 23.2% | 20.1% | 17.7% | 17.4% | 21.3% | 23.6% |
| Change vs Year Ago | -17.6% | -12.6% | -1.4% | 89.6% | 76.2% | 101.1% | 157.3% | 80.8% | 38.2% | -1.0% | 10.9% | 100.1% | 133.2% |
| Reported Basic EPS (NT$, TW GAAP) | 15.17 | 15.28 | 15.62 | 27.29 | 26.72 | 30.72 | 40.19 | 49.34 | 66.93 | 66.17 | 73.35 | 146.97 | 342.37 |
| Reported Diluted EPS (NT$, TW GAAP) | 15.15 | 15.26 | 15.60 | 27.26 | 26.69 | 30.69 | 40.14 | 49.29 | 66.81 | 66.07 | 73.27 | 146.81 | 341.99 |
Source: Company data, Morgan Stanley Researc estimates M Idea
Price tar et remains at NT$6,188
We continue to derive our price target (our base-case scenario value) fro a residual inco e odel. All of our key valuation assu ptions re ain unchanged: cost of equity at 9.2% (beta of 1.2, risk-free rate of 2%, and risk pre iu of 6%), inter ediate growth rate of 12%, and ter inal growth rate of 3.0%.
Our bull- and bear-case scenario values also re ain at NT$8,500 and NT$3,150, respectively.
Exhibit 9: MediaTek: Residual income model
| (NT$ mn) | 2026e | 2027e | 2028e | 2029e | 2030e | 2031e | 2032e | 2033e | 2034e | 2035e | 2036e | 2037e |
|---|---|---|---|---|---|---|---|---|---|---|---|---|
| Total Equity | 478,709 | 693,702 | 1,127,416 | 1,414,944 | 1,736,975 | 2,097,651 | 2,501,607 | 2,954,038 | 3,460,761 | 4,028,290 | 4,663,923 | 5,375,832 |
| Net Profit | 116,823 | 233,811 | 545,288 | 610,722 | 684,009 | 766,090 | 858,021 | 960,984 | 1,076,302 | 1,205,458 | 1,350,113 | 1,512,126 |
| ROAE | 26.3% | 39.9% | 59.9% | 48.0% | 43.4% | 40.0% | 37.3% | 35.2% | 33.6% | 32.2% | 31.1% | 30.1% |
| Residual Income | 70,031 | 146,894 | 351,603 | 437,931 | 483,949 | 534,232 | 589,677 | 651,142 | 719,510 | 795,717 | 880,781 | 975,822 |
| Spread | 17.1% | 30.7% | 50.7% | 38.8% | 34.2% | 30.8% | 28.1% | 26.0% | 24.4% | 23.0% | 21.9% | 20.9% |
| Ending Equity Capital | 478,709 | |||||||||||
| PV of Forecast Period | 3,230,987 | |||||||||||
| PV of Continuing Value | 6,156,971 | |||||||||||
| Equity Value | 9,866,666 | |||||||||||
| No. of Shares | 1,594 | |||||||||||
| Projected Price (NT$) | 6,188 |
Source: Company data, Morgan Stanley Researc estimates M Idea
Relative valuation
We view the P/E as relatively attractive - even after the share price rally - given strong AI de and. Although MediaTek faces s artphone headwinds in 2026, we believe it is ti e to look beyond 2026. We think this argin pressure is fully priced in, while TPU upside is not. We believe the stock should trade ore than +1SD above its historical average, supported by strong TPU de and. Our price target of NT$6,188 i plies 42x 2027 EPS, on our esti ates.
Exhibit 10: MediaTek: One-year forward P/E trend
2006 2007 2008 2009 2010 2011 2012 2013 2014 2015 2016 2017 2018 2019 2020 2021 2022 2023 2024 2025 2026 MediaTek One-year Forward P/E
Source: Company data, FactSet, Morgan Stanley Researc M Idea
MediaTek: Financial Summary
Income Statement
Cash Flow Statement
| NT$mn (Years End Dec ) | 2024 | 2025 | 2026e | 2027e | 2028e |
|---|---|---|---|---|---|
| Net sales | 530,586 | 595,966 | 671,881 | 1,095,554 | 2,315,233 |
| COGS | (267,200) | (312,886) | (366,570) | (634,046) | (1,432,931) |
| Gross profit | 263,386 | 283,080 | 305,311 | 461,508 | 882,302 |
| Operating expenses | (160,974) | (179,610) | (188,783) | (199,489) | (251,991) |
| Operating income | 102,412 | 103,470 | 116,528 | 262,019 | 630,311 |
| Non-operating income | 17,107 | 21,418 | 19,322 | 15,000 | 15,000 |
| Pre-tax income | 119,519 | 124,888 | 135,851 | 277,019 | 645,311 |
| Income tax | (12,378) | (18,770) | (18,534) | (42,938) | (100,023) |
| Net income (excl. emp. bonus) | 133,925 | 132,647 | 146,645 | 292,602 | 681,610 |
| Employee Bonus Expense | 26,785 | 26,529 | 29,329 | 58,520 | 136,322 |
| Net income (incl. emp. bonus) | 106,387 | 105,319 | 116,823 | 233,811 | 545,288 |
| Adj.wtd.avg.shrs( m) | 1,589 | 1,592 | 1,593 | 1,591 | 1,593 |
| Reported EPS (NT$) | 66.93 | 66.17 | 73.35 | 146.97 | 342.37 |
| Diluted EPS (NT$) | 66.81 | 66.07 | 73.27 | 146.81 | 341.99 |
| EPS for Consensus (NT$) | 66.81 | 66.07 | 73.27 | 146.81 | 341.99 |
Balance Sheet
| NT$mn (Years End Dec ) | 2024 | 2025 | 2026e | 2027e | 2028e |
|---|---|---|---|---|---|
| Cash flow from Operations | 156,055 | 162,793 | 39,626 | 185,821 | 379,538 |
| Net profits | 106,385 | 105,319 | 116,823 | 233,811 | 545,288 |
| Depreciation | 20,936 | 22,974 | 23,808 | 24,641 | 25,474 |
| Equity investment losses (income) | (517) | (785) | 0 | 0 | 0 |
| Other adjustments | 29,251 | 35,284 | (101,005) | (72,631) | (191,224) |
| Cash flow from Investing | (35,928) | (37,754) | (74,260) | (122,445) | (343,102) |
| Capex | (13,787) | (15,059) | (5,000) | (5,000) | (5,000) |
| Change of LT Investment | (14,226) | (9,851) | 0 | 0 | 0 |
| Change of ST Investment | 283 | (69) | 0 | 0 | 0 |
| Other adjustments | (8,198) | (12,775) | (69,260) | (117,445) | (338,102) |
| Cash flow from financing | (90,119) | (87,675) | (71,117) | (43,459) | (137,049) |
| Increase in L/T debt | 0 | 60 | 50,000 | 50,000 | 50,000 |
| Increase in S/T debt | (1,260) | 0 | 0 | 0 | 0 |
| Cash Dividend Paid | (87,551) | (86,070) | (121,117) | (93,459) | (187,049) |
| Dir& Emp Bonus Paid | 0 | 0 | 0 | 0 | 0 |
| Issuance of stock | 0 | 0 | 0 | 0 | 0 |
| Other adjustments | (1,309) | (1,665) | 0 | 0 | 0 |
| Exchange rate adjustment | 0 | 0 | 0 | 0 | 0 |
| Net change in cash | 30,008 | 37,364 | -105,751 | 19,918 | -100,613 |
Financial Ratios
168,912 Margins (%)
| NT$mn (Years End Dec ) | 2024 | 2025 | 2026e | 2027e | 2028e |
|---|---|---|---|---|---|
| Cash | 203,696 | 235,290 | 129,539 | 149,457 | 48,844 |
| Mkt Securities | 15,928 | 12,419 | 12,419 | 12,419 | 12,419 |
| AR/NR | 44,713 | 62,121 | 79,877 | 130,246 | 275,248 |
| Inventory | 58,414 | 67,235 | 93,266 | 161,319 | 364,577 |
| Other | 28,274 | 20,392 | 13,849 | 22,582 | 47,723 |
| Current Assets | 351,025 | 397,456 | 328,950 | 476,023 | 748,812 |
| Long-term investments | 169,970 | 168,912 | 168,912 | 168,912 | 168,912 |
| Fixed assets | 56,917 | 60,427 | 65,427 | 70,427 | 75,427 |
| Other assets | 119,955 | 116,990 | 186,250 | 303,694 | 641,796 |
| Total Assets | 697,868 | 743,785 | 749,539 | 1,019,056 | 1,634,947 |
| S/T borrowings | 940 | 940 | 940 | 940 | 940 |
| AP/NP | 40,777 | 48,710 | 60,911 | 105,356 | 238,103 |
| Other ST liabilities | 225,186 | 253,700 | 177,739 | 187,818 | 237,248 |
| LT debt | 2,681 | 6,795 | 6,795 | 6,795 | 6,795 |
| Other LT liabilities | 23,228 | 24,444 | 24,444 | 24,444 | 24,444 |
| Total Liabilities | 292,812 | 334,590 | 270,830 | 325,354 | 507,531 |
| Common shares | 16,017 | 16,039 | 16,039 | 16,039 | 16,039 |
| Retained earning | 331,543 | 354,139 | 470,962 | 704,773 | 1,250,061 |
| Other shareholders' equity | 57,495 | 39,017 | (8,292) | (27,110) | (138,684) |
| Total Equity | 405,055 | 409,195 | 478,709 | 693,702 | 1,127,416 |
| Total Liab. & Shrhldr's Equity | 697,868 | 743,785 | 749,539 | 1,019,056 | 1,634,947 |
| 2024 | 2025 | 2026e | 2027e | 2028e | |
|---|---|---|---|---|---|
| Growth(%) | |||||
| Turnover | 22.4 | 12.3 | 12.7 | 63.1 | 111.3 |
| Operating profits | 42.6 | 1.0 | 12.6 | 124.9 | 140.6 |
| Pretax profits | 37.7 | 4.5 | 8.8 | 103.9 | 132.9 |
| Net profits | 38.8 | -1.0 | 10.6 | 99.5 | 132.9 |
| EPS | 38.1 | -1.1 | 10.9 | 100.4 | 132.9 |
| Margins (%) | |||||
| Gross Margin | 49.6 | 47.5 | 45.4 | 42.1 | 38.1 |
| Operating Margin | 19.3 | 17.4 | 17.3 | 23.9 | 27.2 |
| Pretax Margin | 22.5 | 21.0 | 20.2 | 25.3 | 27.9 |
| Net Profit | 20.1 | 17.7 | 17.4 | 21.3 | 23.6 |
| Return (%) | |||||
| ROAA | 16.0 | 14.6 | 15.6 | 26.4 | 41.1 |
| ROAE | 27.3 | 25.9 | 26.3 | 39.9 | 59.9 |
| Gearing (%) | |||||
| Net Debt/Equity | (50.1) | (57.3) | (26.9) | (21.4) | (4.2) |
| Liabilities/Equity | 72.3 | 81.8 | 56.6 | 46.9 | 45.0 |
| Ratios (X) | |||||
| Current ratio | 1.3 | 1.3 | 1.4 | 1.6 | 1.6 |
| Quick ratio | 0.9 | 1.0 | 0.9 | 1.0 | 0.7 |
| Others | |||||
| AR/NR Turnover (days) | 43 | 43 | 43 | 43 | 43 |
| Inventory Turnover (days) | 92 | 92 | 92 | 92 | 92 |
| AP Turnover (days) | 60 | 60 | 60 | 60 | 60 |
| Cash Conversion (days) | 75 | 75 | 75 | 75 | 75 |
e = Morgan Stanley Research Estimates
Source: Morgan Stanley Research, Company Data M Idea
Valuation Methodology and Risks
MediaTek (2454.TW)
Base case, residual inco e odel. Key assu ptions: cost of equity 9.2%, inter ediate growth rate 12.0%, ter inal growth rate 3.0%.
Risks to Upside
- n Edge AI proliferates s artphone replace ent cycle.
- n S artphone de and rises in China and other EMs.
- n New products attract high de and, resulting in arket share gains.
- n Google's TPU spurs de and.
Risks to Downside
- n S artphone de and deteriorates in China and other EMs.
- n Co petition heats up, resulting in pricing co petition.
- n New products attract low de and, causing arket share loss.
- nMargin dilution is ore severe.
M Idea
INDUSTRY COVERAGE: Grea er China Technology Semiconduc ors
| Company (Ticker) | Rating ( s Of) | Price* (10/28/2026) |
|---|---|---|
| Charlie Chan | ||
| Advanced Wireless emiconductor Co (8086.TWO) | U (07/14/2025) | NT$125.00 |
| Alchip Technologies Ltd (3661.TW) | O (05/14/2021) | NT$3,800.00 |
| A E Technology Holding Co. Ltd. (3711.TW) | O (09/15/2024) | NT$695.00 |
| Cambricon Technology Corporation (688256. ) | O (04/27/2026) | Rmb958.00 |
| CXMT Corp (688825. ) | O (08/26/2026) | Rmb44.36 |
| Global Unichip Corp (3443.TW) | O (06/24/2026) | NT$8,170.00 |
| GlobalWafers Co Ltd (6488.TWO) | E (05/19/2026) | NT$849.00 |
| Gudeng Precision (3680.TWO) | O (11/25/2025) | NT$532.00 |
| Hua Hong emiconductor Ltd (1347.HK) | E (03/12/2026) | HK$70.00 |
| Iluvatar CoreX emiconductor Co., Ltd. (9903.HK) | O (04/27/2026) | HK$73.60 |
| MediaTek (2454.TW) | O (11/28/2025) | NT$4,235.00 |
| MetaX Integrated Circuits (688802. ) | E (04/27/2026) | Rmb489.40 |
| Nanya Technology Corp. (2408.TW) | O (05/28/2026) | NT$477.00 |
| OmniVision Integrated Circuits Group Inc (603501. ) | E (11/17/2025) | Rmb85.20 |
| Phison Electronics Corp (8299.TWO) | E (02/25/2026) | NT$2,040.00 |
| G Micro Corp. (300661. Z) | E (11/03/2025) | Rmb90.03 |
| ilergy Corp. (6415.TW) | U (05/19/2026) | NT$525.00 |
| MIC (0981.HK) | O (10/21/2025) | HK$47.80 |
| T MC (2330.TW) | O (02/07/2022) | NT$2,425.00 |
| UMC (2303.TW) | O (05/19/2026) | NT$128.00 |
| Vanguard International emiconductor (5347.TWO) | E (01/14/2026) | NT$167.50 |
| WIN emiconductors Corp (3105.TWO) | E (10/09/2026) | NT$540.00 |
Daisy Dai, CFA
M Idea
| A MPT Ltd (0522.HK) | O (07/24/2025) | HK$118.30 |
|---|---|---|
| China Resources Microelectronics Limited (688396. ) | U (03/02/2026) | Rmb49.10 |
| Empyrean Technology Co Ltd (301269. Z) | E (01/17/2025) | Rmb101.92 |
| Hangzhou ilan Microelectronics Co. Ltd. (600460. ) | U (08/25/2025) | Rmb25.07 |
| Hygon Information Technology Co., Ltd. (688041. ) | O (07/03/2026) | Rmb192.70 |
| Innoscience (2577.HK) | E (10/13/2025) | HK$30.92 |
| JCET Group Co Ltd (600584. ) | O (09/16/2026) | Rmb55.41 |
| hanghai Fudan Microelectronics (1385.HK) | O (03/07/2025) | HK$23.22 |
| ICC Co Ltd (688234. ) | O (03/20/2026) | Rmb81.00 |
| J emiconductor Corp (688820. ) | E (09/16/2026) | Rmb87.90 |
| tarPower emiconductor Ltd (603290. ) | E (05/14/2026) | Rmb70.98 |
| Unigroup Guoxin Microelectronics Co Ltd (002049. Z) | U (01/10/2023) | Rmb50.13 |
| Universal cientific Ind. ( hanghai) (601231. ) | O (11/05/2025) | Rmb22.02 |
| Yangjie Technology (300373. Z) | O (06/10/2022) | Rmb74.94 |
| Daniel Yen, CFA | ||
| AP Memory Technology Corp (6531.TW) | O (07/11/2025) | NT$843.00 |
| A Media Technology Inc (5269.TW) | U (10/03/2025) | NT$1,505.00 |
| Aspeed Technology (5274.TWO) | O (06/09/2025) | NT$17,295.00 |
| Egis Technology Inc (6462.TWO) | E (01/28/2026) | NT$99.00 |
| Elan Microelectronics Corp (2458.TW) | O (10/03/2025) | NT$130.00 |
| eMemory Technology Inc (3529.TWO) | O (08/18/2026) | NT$2,655.00 |
| Espressif ystems (688018. ) | O (05/15/2023) | Rmb142.55 |
| GigaDevice emiconductor Beijing Inc (603986. ) | O (05/15/2025) | Rmb289.88 |
| Himax Technologies Inc (HIMX.O) | E (02/04/2026) | U $11.94 |
| Macronix International Co Ltd (2337.TW) | O (09/18/2025) | NT$103.50 |
| Montage Technology Co Ltd (6809.HK) | O (03/18/2026) | HK$230.20 |
| Montage Technology Co Ltd (688008. ) | O (03/18/2026) | Rmb174.70 |
| Novatek (3034.TW) | U (02/04/2026) | NT$598.00 |
| Nuvoton Technology Corporation (4919.TW) | U (11/10/2025) | NT$142.00 |
| Parade Technologies Ltd (4966.TWO) | O (05/27/2026) | NT$525.00 |
| Powerchip emiconductor Manufacturing Co (6770.TW) | O (10/27/2025) | NT$71.30 |
| Realtek emiconductor (2379.TW) | E (01/30/2026) | NT$791.00 |
| henzhen Goodix Technology Co Ltd (603160. ) | U (07/14/2025) | Rmb61.38 |
| ilicon Motion ( IMO.O) | O (05/06/2024) | U $204.17 |
| Winbond Electronics Corp (2344.TW) | O (05/28/2026) | NT$172.00 |
| WPG Holdings (3702.TW) | O (03/16/2026) | NT$116.00 |
| WT Microelectronics Co. Ltd. (3036.TW) | O (01/27/2026) | NT$217.00 |
| Henry Zhao | ||
| ACM Research Inc (ACMR.O) | O (03/07/2023) | U $51.97 |
| Advanced Micro-Fabrication Equipment Inc (688012. ) | O (11/06/2023) | Rmb240.00 |
| Maxscend Microelectronics Co Ltd (300782. Z) | U (01/11/2021) | Rmb56.00 |
| NAURA Technology Group Co Ltd (002371. Z) | O (11/06/2023) | Rmb511.68 |
| Lucas Wang | ||
| AllRing Tech Co. (6187.TWO) | O (09/23/2025) | NT$1,345.00 |
| FOCI Fiber Optic Communications Inc (3363.TWO) | E (10/09/2026) | NT$533.00 |
| Hon Precision (7769.TW) | O (04/17/2026) | NT$5,565.00 |
| King Yuan Electronics Co Ltd (2449.TW) | O (03/03/2023) | NT$277.50 |
| MPI Corporation (6223.TWO) | O (04/17/2026) | NT$5,115.00 |
Stock Ratings are subject to c ange. Please see latest researc for eac company.
- Historical prices are not split adjusted.
© 2026 Morgan Stanley
圖片清單(已驗證 2026-10-29)
ingest 時建立的「眼見為憑」圖片索引,是 lib/ 嵌圖的唯一真相來源;本報告共 6 張抽圖,006 為揭露頁圖、未嵌入本文。
| 檔名 | size | 分類 | 親眼所見內容 |
|---|---|---|---|
報告_MS_聯發科2454_3Q26前瞻_20261028_001.png |
239KB | 真資料圖 | Nvidia 發表會投影片「Announcing NVLink Fusion — NVIDIA AI Factory Plus Custom ASIC」:圓形晶圓內為含紫色運算區塊的客製 ASIC 版圖,右上放大標示「Custom ASIC with NVLink Fusion IP」,左右各三座機架(報告 Exhibit 3,來源 Nvidia;與 09-27 版同圖) |
報告_MS_聯發科2454_3Q26前瞻_20261028_002.png |
21KB | 真資料圖 | 堆疊長條「Total 2.5D packaging capacity」kwpm:2026e 總 142(TSMC CoWoS 100、Non-TSMC CoWoS 37、Intel EMIB-T 5)/2027e 總 250(165/65/20)/2028e 總 374(230/95/45,另有 TSMC CoPoS 3.75)(報告 Exhibit 5;與 09-27 版同圖,<40KB 仍已讀) |
報告_MS_聯發科2454_3Q26前瞻_20261028_003.png |
253KB | 真資料圖 | 「CoWoS Enables AI Compute Scaling」:縱軸 Interposer Size、橫軸 2016-2027,CoWoS-S 1.5→3.3-reticle、CoWoS-R 1.4-reticle、CoWoS-L/R 3.3→5.5→9.7-reticle,右側附封裝示意;1 reticle ~830mm²(報告 Exhibit 6,來源 Winway/TSMC) |
報告_MS_聯發科2454_3Q26前瞻_20261028_004.png |
168KB | 真資料圖 | Intel「EMIB Scalability to Support AI Demand」:2023/2026/2028 三欄,Reticle size 約 4x/>8x/>12x,Package size 約 ~80x80/~120x120/~120x180,HBM 8/12/>24,EMIB 12/>20/>38,附封裝俯視示意(報告 Exhibit 7,來源 Intel) |
報告_MS_聯發科2454_3Q26前瞻_20261028_005.png |
56KB | 真資料圖 | 聯發科一年期預期本益比 2006-2026:平均 18x、+1SD 23x、-1SD 12x,2026 年急升至約 36-40x 後回落至約 30x(報告 Exhibit 10,財務估值類) |
報告_MS_聯發科2454_3Q26前瞻_20261028_006.png |
58KB | 真資料圖 | 聯發科股價(藍線)與 MS 目標價沿革(紅虛線)2023-10 至 2026-10,目標價末段標示 1988、2588、2988、5088、5588、6188,股價收於約 4,000 上下(揭露頁圖,財務股價類;未嵌入本文) |