PDF 原檔:報告_MS_NVL72機櫃出貨_20260807_original.pdf
圖片清單(已驗證 2026-08-10)
| 檔名 | size | 分類 | 親眼所見內容 |
|---|---|---|---|
報告_MS_NVL72機櫃出貨_20260807_002.png |
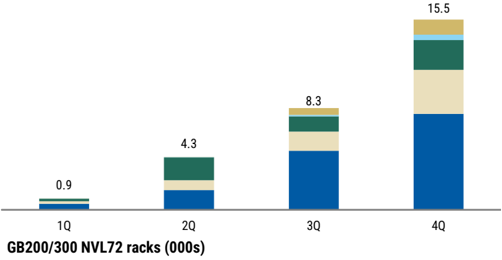
11KB | 真資料圖 | Exhibit 1:2025 年 GB200/300 NVL72 機櫃出貨(依 ODM 分堆疊長條,1Q 0.9K→2Q 4.3K→3Q 8.3K→4Q 15.5K,千台) |
報告_MS_NVL72機櫃出貨_20260807_003.png |
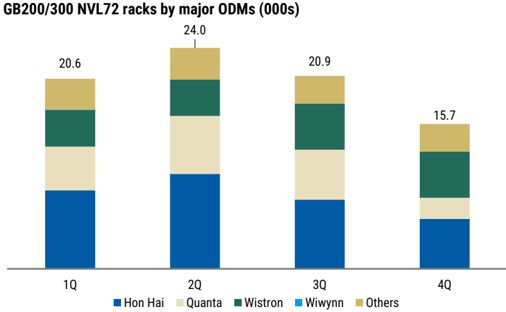
18KB | 真資料圖 | Exhibit 2:2026 年 GB200/300 NVL72 機櫃出貨(依 ODM 分堆疊長條,1Q 20.6K→2Q 24.0K→3Q 20.9K→4Q 15.7K,千台) |
報告_MS_NVL72機櫃出貨_20260807_005.png |
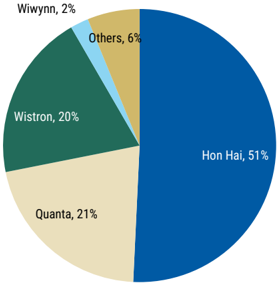
21KB | 真資料圖 | Exhibit 4:2025 年 GB200/300 NVL72 機櫃供應市占圓餅圖(鴻海 51%、廣達 21%、緯創 20%、緯穎 2%、其他 6%) |
報告_MS_NVL72機櫃出貨_20260807_006.png |
30KB | 真資料圖 | Exhibit 5:2026 年 GB200/300 NVL72 機櫃供應市占圓餅圖(鴻海 39%、廣達 23%、緯創 22%、緯穎 0%、其他 16%) |
報告_MS_NVL72機櫃出貨_20260807_004.png |
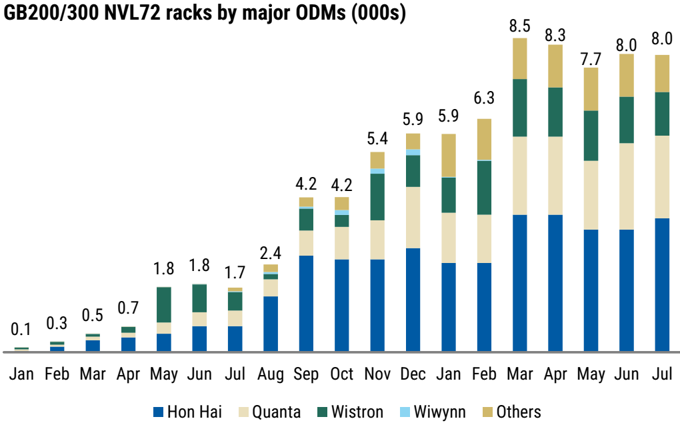
46KB | 真資料圖 | Exhibit 3:2025-2026 逐月 GB200/300 NVL72 機櫃出貨堆疊長條(Jan25 0.1K 逐月爬升至 Jul26 8.0K,依鴻海/廣達/緯創/緯穎/其他分色) |
報告_MS_NVL72機櫃出貨_20260807_007.png |
61KB | 真資料圖 | 鴻海(2317) 2023/08-2026/08 股價走勢圖疊加 MS 目標價階梯沿革(115→155→210→255→270→232→200→175→220→250→317→290→310) |
報告_MS_NVL72機櫃出貨_20260807_001.png |
66KB | 裝飾·banner | 「Asia Summer School 2026」泳池意象廣告 banner,非資料圖 |
報告_MS_NVL72機櫃出貨_20260807_009.png |
69KB | 真資料圖 | 緯創(3231) 2023/08-2026/08 股價走勢圖疊加 MS 目標價階梯沿革(135→145→136→143→158→168→158→150→125→140→150→210→215→205→210→275) |
報告_MS_NVL72機櫃出貨_20260807_008.png |
77KB | 真資料圖 | 廣達(2382) 2023/08-2026/08 股價走勢圖疊加 MS 目標價階梯沿革(240→280→305→340→370→348→335→315→325→335→310→330→332→370→400→385) |
007/008/009 為估值方法章節標準股價/目標價沿革圖(鴻海/廣達/緯創各一張),對照各公司頁「目標價與評等」表末筆 MS 最新 TP 確認對應(鴻海 NT$310、廣達 NT$385、緯創 NT$275)。
原始內容
M August 7, 2026 12:58 PM GMT
Greater China Technology Hardware | Asia Pacific
GB200 and GB300 NVL72 Racks in July 2026
We provide monthly/quarterly rack shipment forecasts for ODMs. Within the major Server ODMs, our order of preference is Wistron > Hon Hai > Quanta, based on upside to PT.
Key Takeaways
- We estimate GB200/300 rack output in July at ~8.0K (flattish m/m), within which:
- Quanta shipped 2.2-2.25K GB200/GB300 racks.
- Wistron shipped 1.1-1.2K GB200/GB300 racks.
- Hon Hai shipped ~3.6K GB200/300 racks.
Our CY26 full-year forecast is now at 80-85K racks: This bakes in our recently raised ~3.8K rack-equivalent forecast at Wistron (report here), to ~17.9K racks. This year is a strong one for downstream rack assembly. We expect over 100% y/y growth in rack shipments, vs. ~29k last year.
Quanta (2382.TW, OW): July revenue was NT$366.3B (-5% m/m, +131% y/y). We attribute the m/m decline mainly to lower NB shipments, at 2.8M units (-38% m/m). As for GB200/300 rack shipments in the month, we estimate Quanta delivered 2.22.25K racks (-4% m/m) in July. Our full-year assumption is unchanged, at ~18.7K racks.
Wistron (3231.TW, OW): July revenue was NT$308.2B (-4% m/m, +61% y/y). We attribute the m/m decline to: 1) lower NB shipment, at 1.6M units (-20% m/m); 2) lower DT shipments, at 700K units (-13% m/m); 3) lower monitor shipments, at 900K units (-10% m/m); and 4) slightly lower GB200/300 server computing tray shipments (1,150-1,200 rack equivalents, by our estimates, down 6% m/m), offset by higher Wiwynn revenue, at NT$117.7B (+6% m/m, +39% y/y). Our full-year forecast was raised to ~17.9K racks recently.
Hon Hai (2317.TW, OW): July revenue was NT$946.5B (+15% m/m, +54% y/y), with all segments growing m/m, with server-related revenue seeing the strongest m/m growth, followed by computing products, followed by components and other products, and lastly the consumer segment, which mainly includes iPhone assembly. We model HH's GB rack shipments at 3.6K racks (+9% m/m). Our full-year forecast is unchanged, at ~31.7K racks.
Update
Morgan Stanley Taiwan Limited+
Howard Kao
Equity Analyst Howard.Kao@morganstanley.com
+886 2 2730-2989
Irene Yen
Research Associate
Irene.Yen@morganstanley.com
+886 2 2730-2869
Morgan Stanley Asia Limited+
Andy Meng, CFA
Equity Analyst
Andy.Meng@morganstanley.com
+852 2239-7689

Greater China Technology Hardware
Asia Pacific Industry View
In-Line
Morgan Stanley does and seeks to do business with companies covered in Morgan Stanley Research. As a result, investors should be aware that the firm may have a conflict of interest that could affect the objectivity of Morgan Stanley Research. Investors should consider Morgan Stanley Research as only a single factor in making their investment decision.
For analyst certification and other important disclosures, refer to the Disclosure Section, located at the end of this report.
+= Analysts employed by non-U.S. affiliates are not registered with FINRA, may not be associated persons of the member and may not be subject to FINRA restrictions on communications with a subject company, public appearances and trading securities held by a research analyst account.
M
GB200/300 Exhibits
We believe actual rack deliveries to end-customers are likely lower than these numbers because we include Wistron's computing tray (L10) rack equivalent (without accounting for rack assembly and test times for L11).
Exhibit 1: Industry-wide GB200/300 NVL72-equivalent monthly rack output, by major ODMs (2025)
GB200/300 NVL72 racks by major ODMs (000s)
Source: Morgan Stanley Research estimates.
Exhibit 2: Industry-wide GB200/300 NVL72-equivalent monthly rack output, by major ODMs (2026)
Source: Morgan Stanley Research estimates.
Hon Hai
Quanta
Wistron
Exhibit 3:
Industry-wide GB200/300 NVL72-equivalent monthly rack output, by major ODMs (2025-2026)
Source: Morgan Stanley Research estimates.
Wiwynn
Others
M
Exhibit 4: GB200/300 rack supply share, by major ODMs (2025)
GB200/300 NVL72-equivalent rack supply share (2025)
Source: Morgan Stanley Research estimates.
Exhibit 5: GB200/300 rack supply share, by major ODMs (2026)
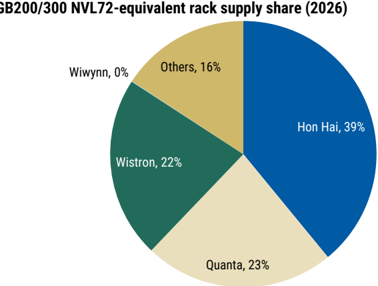
Source: Morgan Stanley Research estimates.
M
Valuation Methodology and Risks
Hon Hai Precision (2317.TW)
Base case scenario value, derived from a residual income valuation model. Our key assumptions include a cost of equity of 8.5%, a medium-term growth rate of 13%, and a terminal growth rate of 3%.
Risks to Upside
- n Better-than-expected iPhone sell-through
- n Faster progress in AI server business
- n Faster EV business development progress
- n Any new M&A activity that could improve sentiment
Risks to Downside
- n Lower iPhone sell-through
- n Smaller profit contribution from AI business
- n Slower EV business development progress
- n Geopolitical developments that could negatively affect foreign investment
Quanta Computer Inc. (2382.TW)
Base case, residual income model. Key assumptions include a cost of equity of 9.0% (beta of 1.2, equity premium of 6.0% and risk-free rate of 1.5%), an 8.5% medium-term growth rate, and a 3% terminal growth rate.
Risks to Upside
- n Stronger-than-expected NB demand
- n Stronger-than-expected Apple Watch demand
- n Stronger-than-expected server demand
- n Faster-than-expected AI server penetration
Risks to Downside
- n Weaker-than-expected NB demand
- n Softer-than-expected Apple Watch demand
- n Weak margin performance owing to rising labor costs and sales shortfalls
- n Fierce price competition in the mega data center segment
- n Slower-than-expected AI server penetration
Wistron Corporation (3231.TW)
Base case, residual income valuation. Key assumptions: 8.7% cost of equity, 7.0% mediumterm growth rate and 3% terminal growth rate.
Risks to Upside
- n Faster-than-expected divestiture of consumer electronics business
- n Stronger-than-expected NB demand
- n Margin expansion from better product mix
M
- n Faster-than-expected AI server penetration
Risks to Downside
- n Slower-than-expected divestiture of consumer electronics business
- n Weaker-than-expected NB demand
- n Margin contraction from sales shortfall and fierce competition
- n Slower-than-expected AI server penetration
M
Disclosure Section
The information and opinions in Morgan Stanley Research were prepared or are disseminated by Morgan Stanley Asia Limited (which accepts the responsibility for its contents) and/or Morgan Stanley Asia (Singapore) Pte. (Registration number 199206298Z) and/or Morgan Stanley Asia (Singapore) Securities Pte Ltd (Registration number 200008434H), regulated by the Monetary Authority of Singapore (which accepts legal responsibility for its contents and should be contacted with respect to any matters arising from, or in connection with, Morgan Stanley Research), and/or Morgan Stanley Taiwan Limited and/or Morgan Stanley & Co International plc, Seoul Branch, and/or Morgan Stanley Australia Limited (A.B.N. 67 003 734 576, holder of Australian financial services license No. 233742, which accepts responsibility for its contents), and/or Morgan Stanley Wealth Management Australia Pty Ltd (A.B.N. 19 009 145 555, holder of Australian financial services license No. 240813, which accepts responsibility for its contents), and/or Morgan Stanley India Company Private Limited having Corporate Identification No (CIN) U22990MH1998PTC115305, regulated by the Securities and Exchange Board of India ('SEBI') and holder of licenses as a Research Analyst (SEBI Registration No. INH000001105); Stock Broker (SEBI Stock Broker Registration No. INZ000244438), Merchant Banker (SEBI Registration No. INM000011203), and depository participant with National Securities Depository Limited (SEBI Registration No. IN-DP-NSDL-567-2021) having registered office at Altimus, Level 39 & 40, Pandurang Budhkar Marg, Worli, Mumbai 400018, India; Telephone no. +91-22-61181000; Compliance Officer Details: Mr. Tejarshi Hardas, Tel. No.: +91-22-61181000 or Email: tejarshi.hardas@morganstanley.com; Grievance officer details: Mr. Tejarshi Hardas, Tel. No.: +91-22-61181000 or Email: msic-compliance@morganstanley.com which accepts the responsibility for its contents and should be contacted with respect to any matters arising from, or in connection with, Morgan Stanley Research, and their affiliates (collectively, "Morgan Stanley"). Morgan Stanley India Company Private Limited (MSICPL) may use AI tools in providing research services. All recommendations contained herein are made by the duly qualified research analysts.
For important disclosures, stock price charts and equity rating histories regarding companies that are the subject of this report, please see the Morgan Stanley Research Disclosure Website at www.morganstanley.com/eqr/disclosures/webapp/generalresearch, or contact your investment representative or Morgan Stanley Research at 1585 Broadway, (Attention: Research Management), New York, NY, 10036 USA.
For valuation methodology and risks associated with any recommendation, rating or price target referenced in this research report, please contact the Client Support Team as follows: US/Canada +1 800 303-2495; Hong Kong +852 2848-5999; Latin America +1 718 754-5444 (U.S.); London +44 (0)20-7425-8169; Singapore +65 6834-6860; Sydney +61 (0)2-9770-1505; Tokyo +81 (0)3-6836-9000. Alternatively you may contact your investment representative or Morgan Stanley Research at 1585 Broadway, (Attention: Research Management), New York, NY 10036 USA.